Embed Size (px)
Citation preview
North Carolina Demographic Change &
the 2016 Electorate
NCFEF Thinkers Luncheon
July 31, 2015
Rebecca Tippett, University of North Carolina
0
2
4
6
8
10
12
1990 1992 1994 1996 1998 2000 2002 2004 2006 2008 2010 2012 2014 2016
July
1 P
op
ula
tio
n (M
illio
ns)
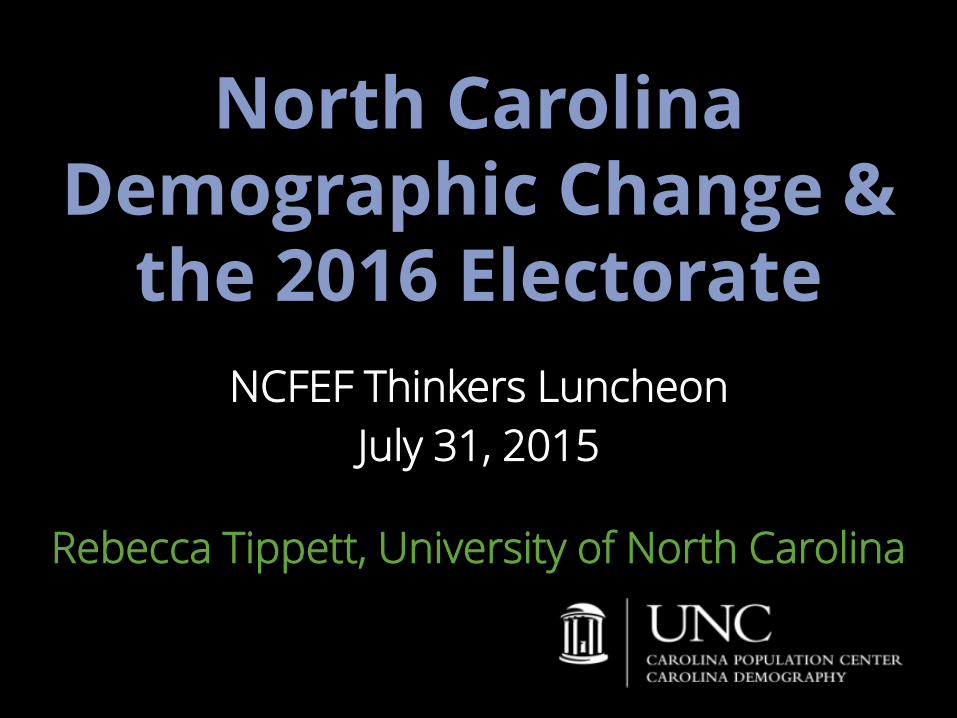
YearData: U.S. Census Bureau Population Estimates, OSBM Projections
Officially 9th most populous state
as of 2014
10.2M in 2016
North Carolina’s Total Population (July 1), 1990-2016

Urbanization
50% in 1990
vs.
66% in 2010
Source: U.S. Census Bureau

NC Counties with Growth from Natural Increase & Net Migration, 2010-2014
Data Source: U.S. Census Bureau
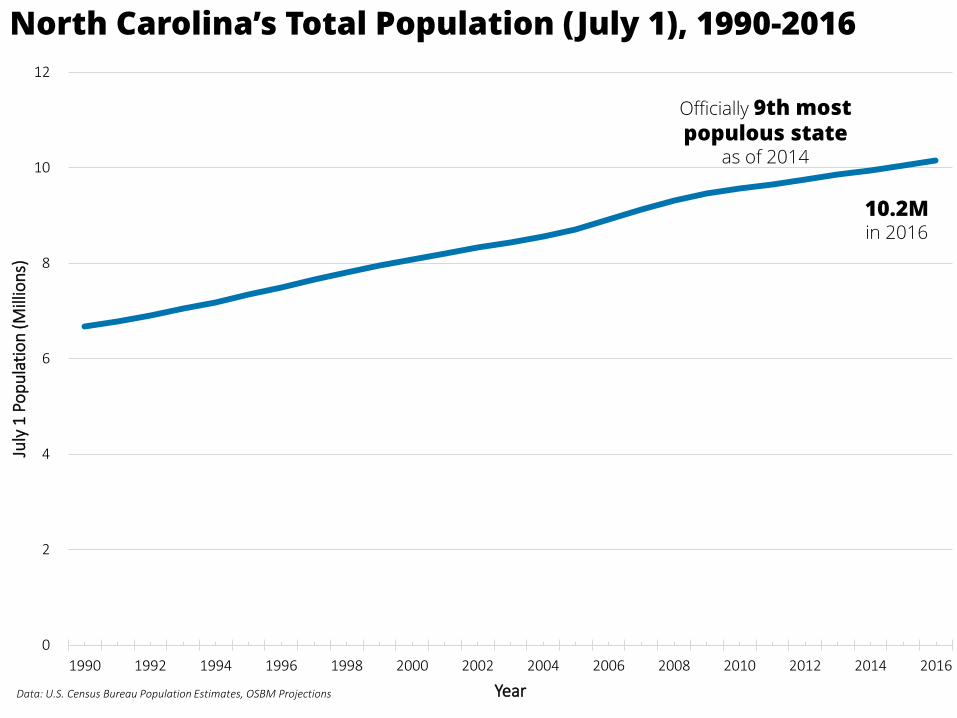
NC Counties with Growth from Natural Increase Only, 2010-2014
Data Source: U.S. Census Bureau
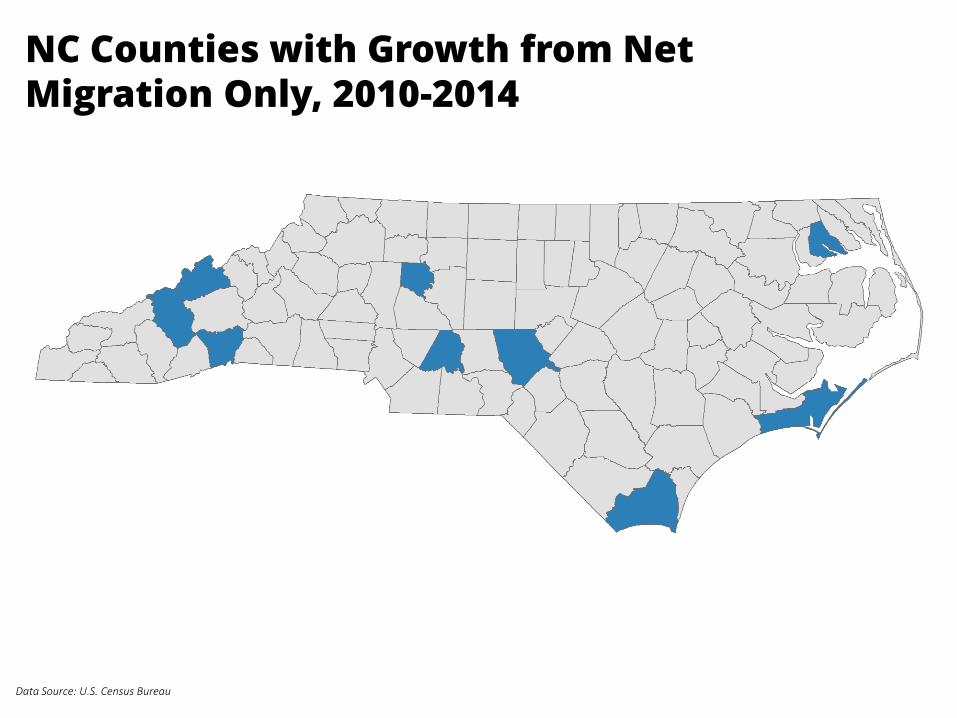
NC Counties with Growth from Net Migration Only, 2010-2014
Data Source: U.S. Census Bureau

NC Counties with Population Loss, 2010-2014
Data Source: U.S. Census Bureau

Who is “at risk” of voting?
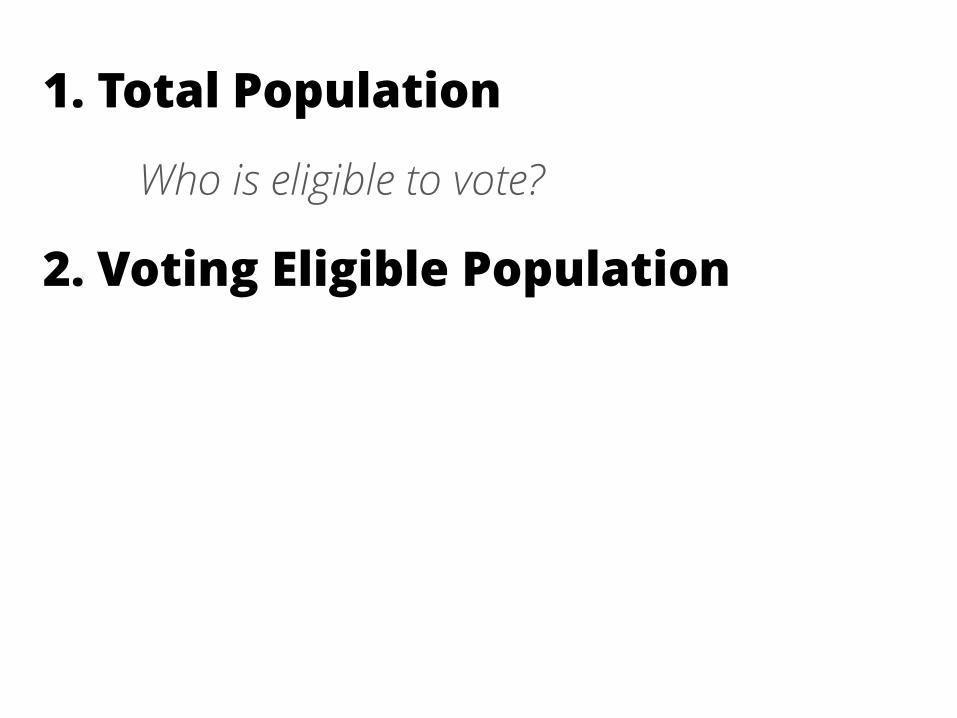
1. Total Population
Who is eligible to vote?
2. Voting Eligible Population

Share of eligible voters can differ from share of total population
Data Source: 2009-2013 American Community Survey

1. Total Population
Who is eligible to vote?
2. Voting Eligible Population
Who is registered to vote?
3. Registered Population
Who votes?
4. Electorate

Differences in registration & turnout rates shift county share of total electorate
Data Sources: 2009-2013 ACS; NC SBE
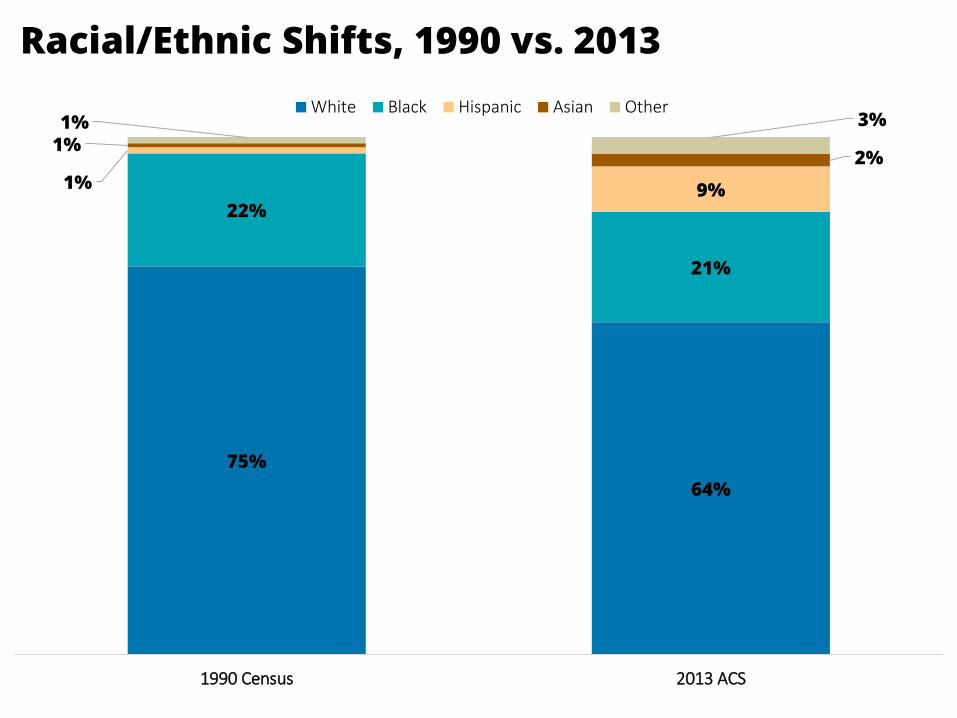
75%
64%
22%
21%
1% 9%
1%2%
1% 3%
1990 Census 2013 ACS
White Black Hispanic Asian Other
Racial/Ethnic Shifts, 1990 vs. 2013
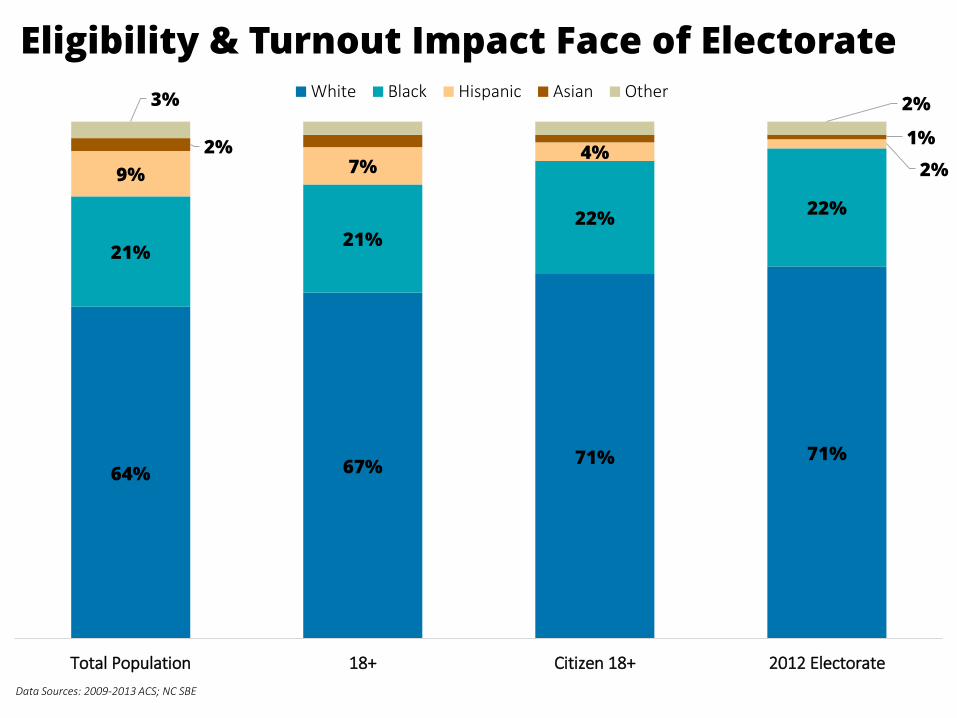
64% 67% 71% 71%
21%21%
22%22%
9% 7%4%
2%2% 1%
3% 2%
Total Population 18+ Citizen 18+ 2012 Electorate
White Black Hispanic Asian Other
Eligibility & Turnout Impact Face of Electorate
Data Sources: 2009-2013 ACS; NC SBE
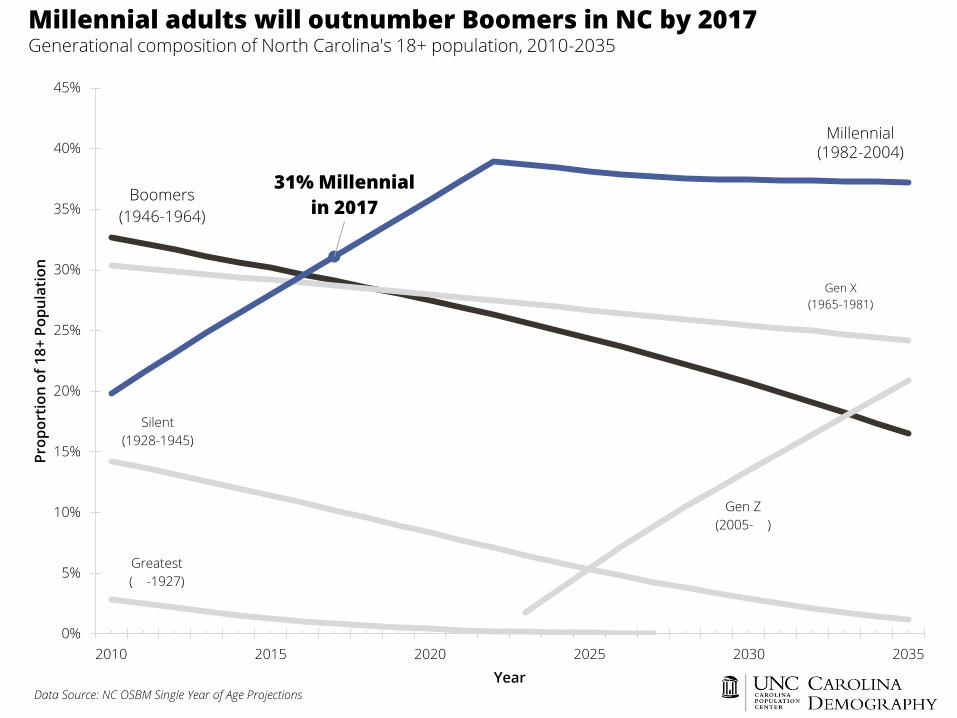
Greatest
( -1927)
Silent
(1928-1945)
Boomers
(1946-1964)
Gen X
(1965-1981)
31% Millennial
in 2017
Gen Z
(2005- )
0%
5%
10%
15%
20%
25%
30%
35%
40%
45%
2010 2015 2020 2025 2030 2035
Pro
po
rtio
n o
f 1
8+
Po
pu
lati
on
Year
Millennial adults will outnumber Boomers in NC by 2017Generational composition of North Carolina's 18+ population, 2010-2035
Data Source: NC OSBM Single Year of Age Projections
Millennial(1982-2004)
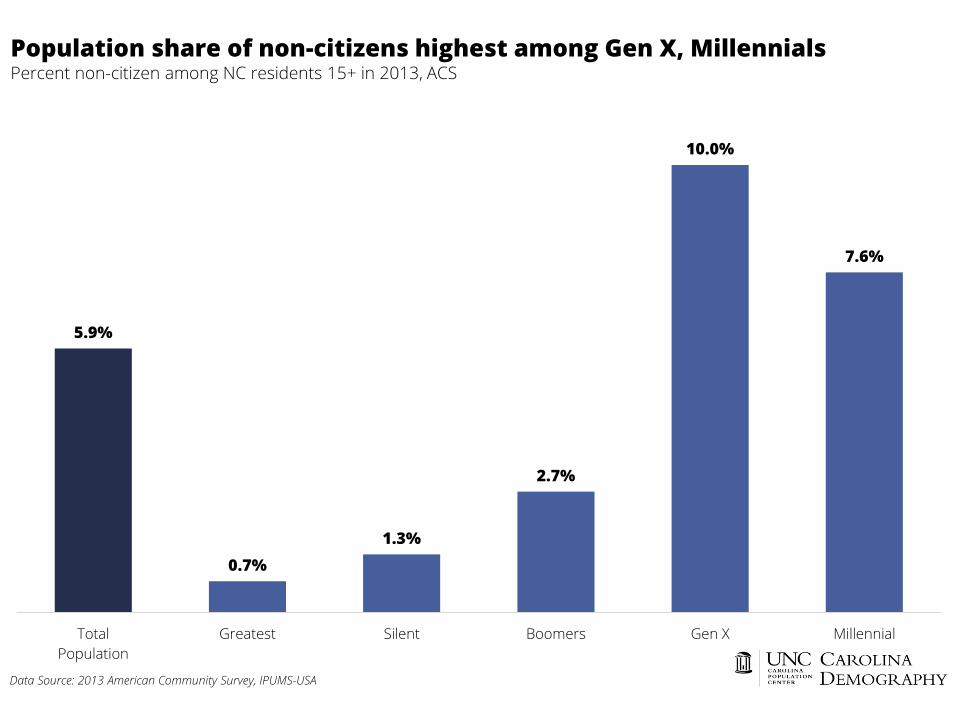
5.9%
0.7%
1.3%
2.7%
10.0%
7.6%
Total
Population
Greatest Silent Boomers Gen X Millennial
Population share of non-citizens highest among Gen X, MillennialsPercent non-citizen among NC residents 15+ in 2013, ACS
Data Source: 2013 American Community Survey, IPUMS-USA
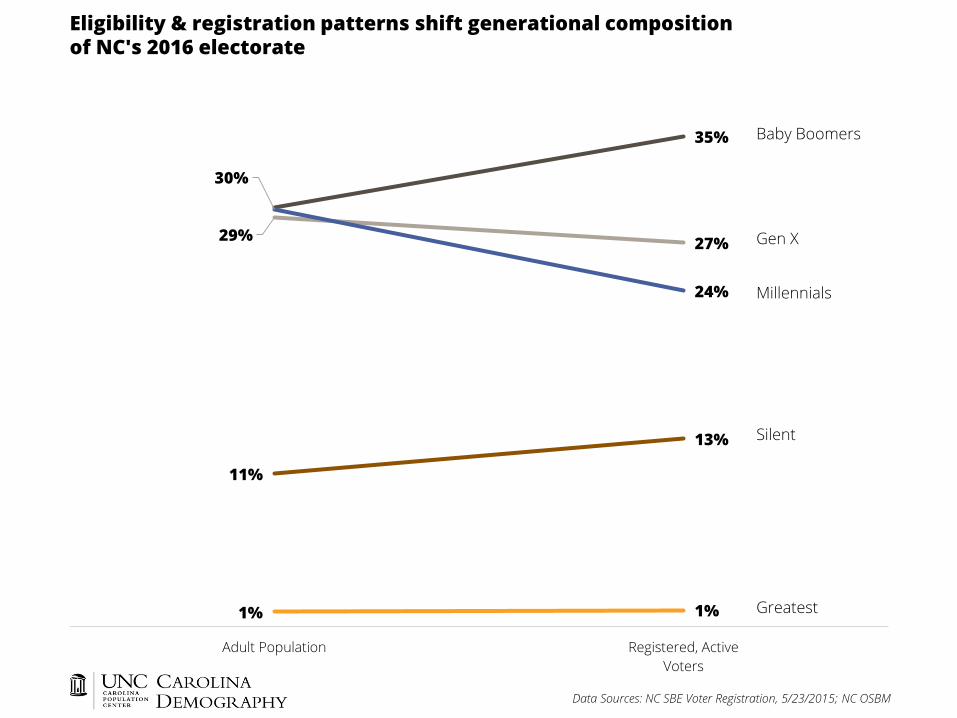
1% 1%
11%
13%
35%
29%27%
30%
24%
Adult Population Registered, Active
Voters
Eligibility & registration patterns shift generational compositionof NC's 2016 electorate
Baby Boomers
Gen X
Millennials
Silent
Greatest
Data Sources: NC SBE Voter Registration, 5/23/2015; NC OSBM
Thank you!
http://demography.cpc.unc.edu
@ncdemography
Rebecca Tippett
(919) 962-6151