Embed Size (px)
Citation preview
The U.S. Elections and the Growing
Appeal of Anti-establishment
Politics in America and Europe Richard WikeDirector, Global Attitudes Research
@RichardWikeRome, October 25, 2016
October 25, 2016 2
Pew Research Center
• Established 1996
• Funded by the Pew Charitable Trusts, foundations
• Non-profit, non-partisan fact tank in Washington
• Since 2002, we have surveyed in 93 countries
• www.pewresearch.org
www.pewresearch.org
2016 U.S. POLITICAL LANDSCAPE
Sept. 18, 2015 www.pewresearch.org 3
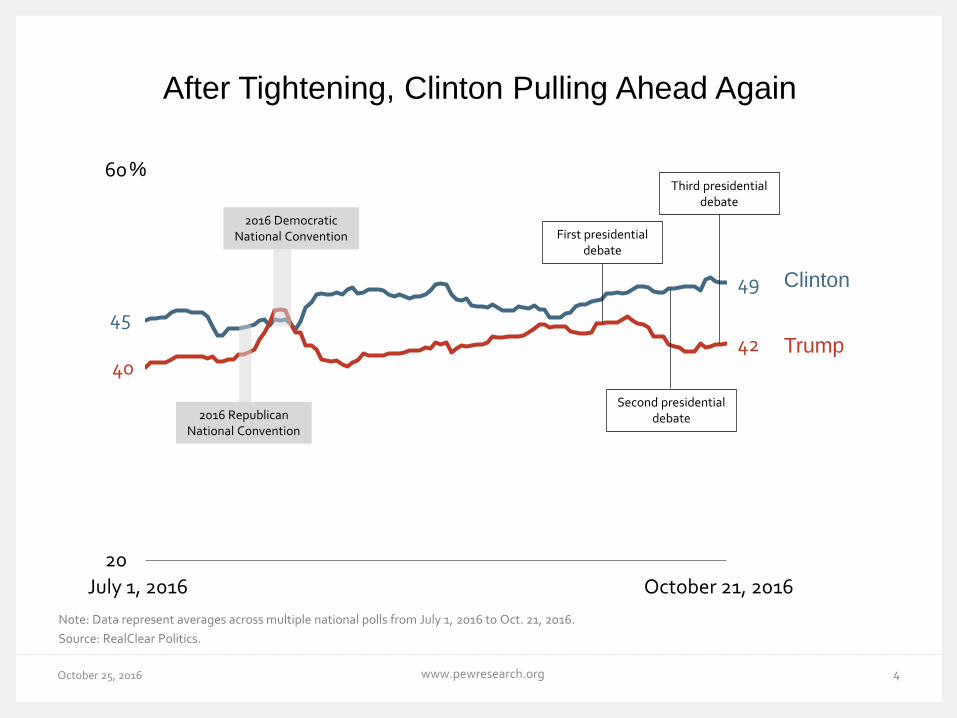
After Tightening, Clinton Pulling Ahead Again
October 25, 2016 www.pewresearch.org 4
Note: Data represent averages across multiple national polls from July 1, 2016 to Oct. 21, 2016.
Source: RealClear Politics.
45
49
4042
20
60
July 1, 2016 October 21, 2016
%
Trump
Clinton
2016 Republican National Convention
2016 Democratic National Convention First presidential
debate
Second presidential debate
Third presidential debate
October 25, 2016 www.pewresearch.org 5
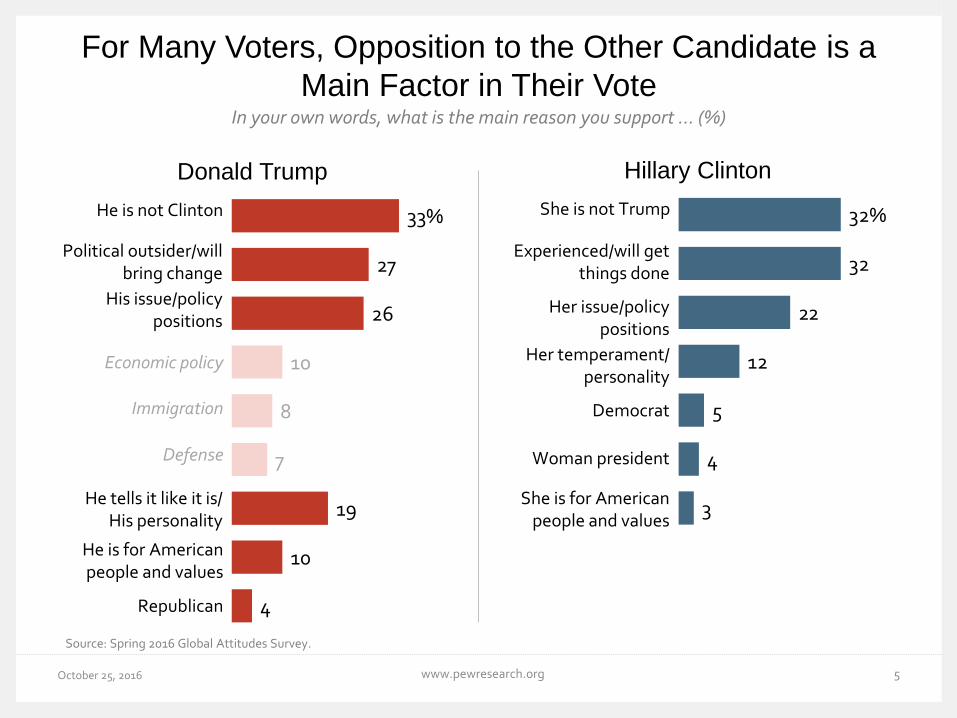
In your own words, what is the main reason you support … (%)
33%
27
26
10
8
7
19
10
4
Defense
He is not Clinton
He is for American people and values
His issue/policy positions
Political outsider/will bring change
He tells it like it is/ His personality
Immigration
Economic policy
Republican
For Many Voters, Opposition to the Other Candidate is a
Main Factor in Their Vote
Source: Spring 2016 Global Attitudes Survey.
Donald Trump
32%
32
22
12
5
4
3
She is not Trump
Democrat
Her issue/policy positions
Experienced/will get things done
Her temperament/ personality
Woman president
She is for American people and values
Hillary Clinton
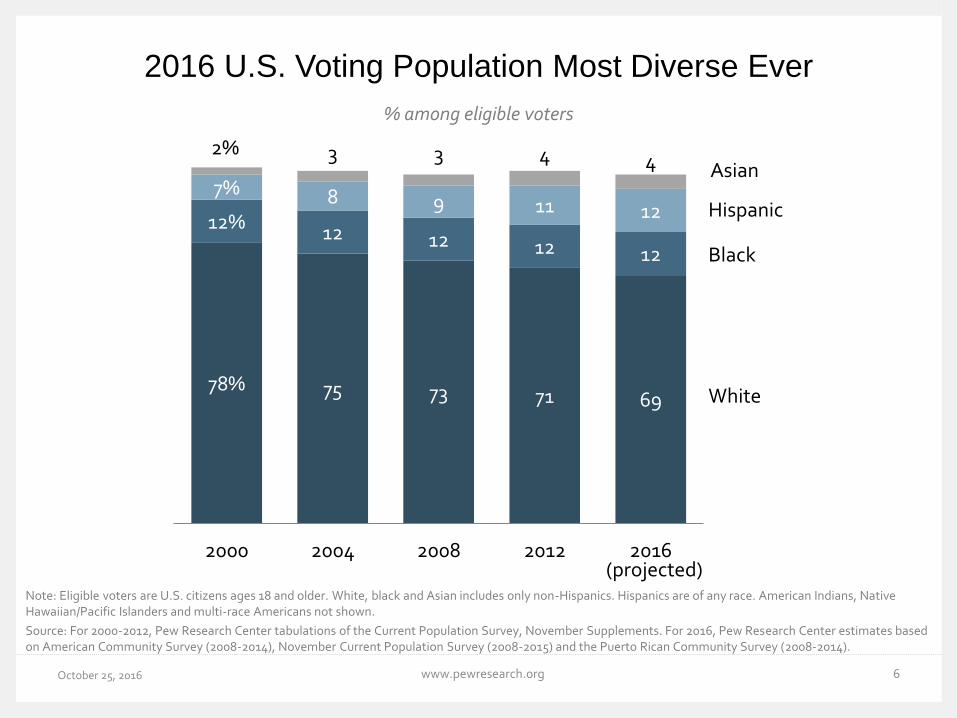
2016 U.S. Voting Population Most Diverse Ever
October 25, 2016 www.pewresearch.org 6
Note: Eligible voters are U.S. citizens ages 18 and older. White, black and Asian includes only non-Hispanics. Hispanics are of any race. American Indians, Native Hawaiian/Pacific Islanders and multi-race Americans not shown.
Source: For 2000-2012, Pew Research Center tabulations of the Current Population Survey, November Supplements. For 2016, Pew Research Center estimates based on American Community Survey (2008-2014), November Current Population Survey (2008-2015) and the Puerto Rican Community Survey (2008-2014).
% among eligible voters
78% 75 73 71 69
12%12 12 12 12
7% 8 9 11 12
2% 3 3 4 4
2000 2004 2008 2012 2016
Hispanic
Black
White
Asian
(projected)
September 2016 7www.pewresearch.org
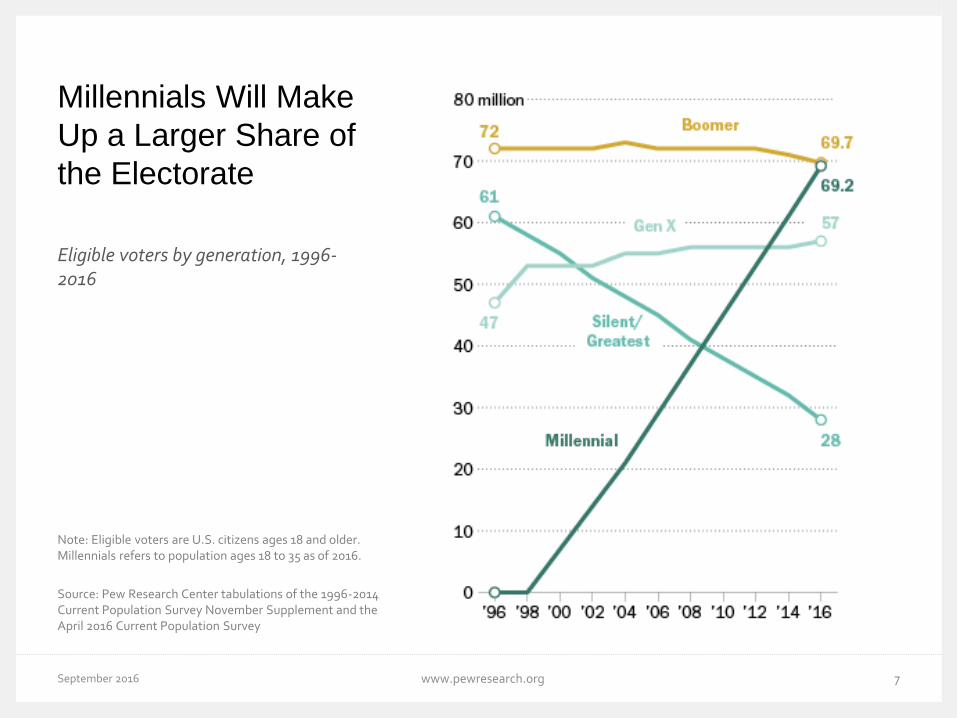
Millennials Will Make
Up a Larger Share of
the Electorate
Eligible voters by generation, 1996-2016
Note: Eligible voters are U.S. citizens ages 18 and older. Millennials refers to population ages 18 to 35 as of 2016.
Source: Pew Research Center tabulations of the 1996-2014 Current Population Survey November Supplement and the April 2016 Current Population Survey
October 25, 2016 8www.pewresearch.org
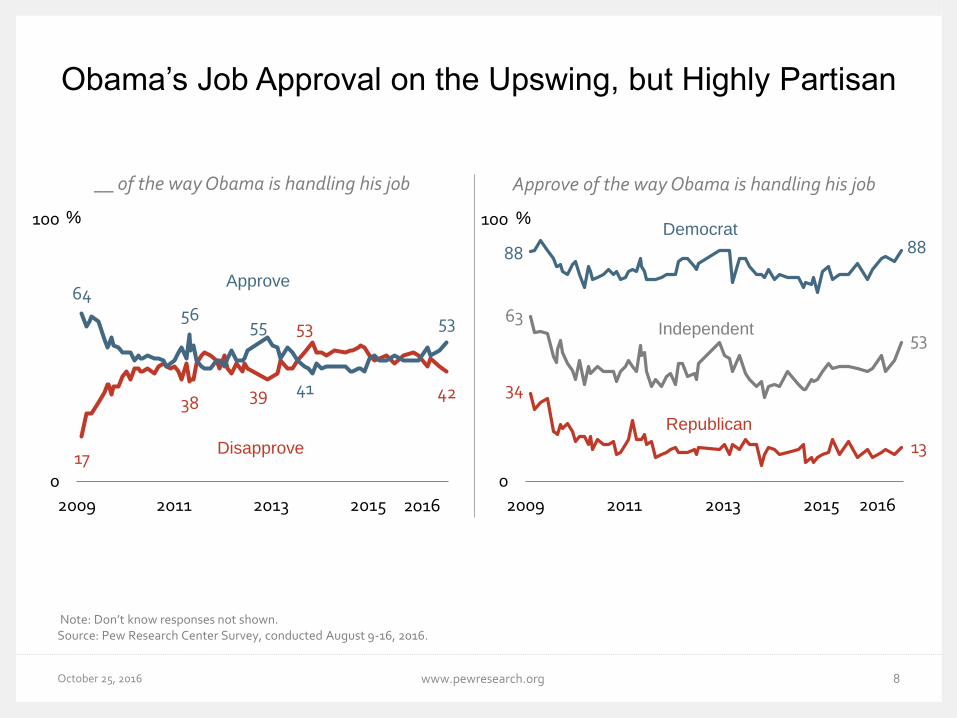
Obama’s Job Approval on the Upswing, but Highly Partisan
34
13
88 88
6353
0
100
2009 2011 2013 2015
Republican
Democrat
Independent
17
38 39
53
42
6456
55
41
53
0
100
2009 2011 2013 2015
Disapprove
Approve
Source: Pew Research Center Survey, conducted August 9-16, 2016.
__ of the way Obama is handling his job
Note: Don’t know responses not shown.
Approve of the way Obama is handling his job
%%
2016 2016
IN U.S. & EU MANY SEE THEIR COUNTRIES IN
DECLINE
Sept. 18, 2015 www.pewresearch.org 9
October 25, 2016 10www.pewresearch.org
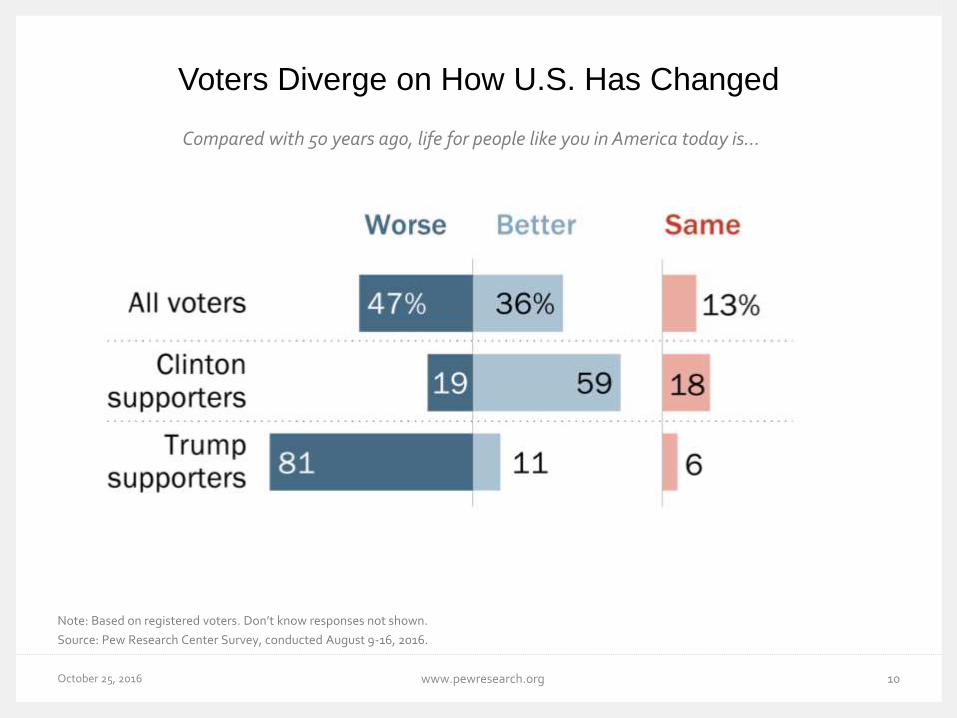
Voters Diverge on How U.S. Has Changed
Source: Pew Research Center Survey, conducted August 9-16, 2016.
Compared with 50 years ago, life for people like you in America today is…
Note: Based on registered voters. Don’t know responses not shown.
October 25, 2016 11www.pewresearch.org
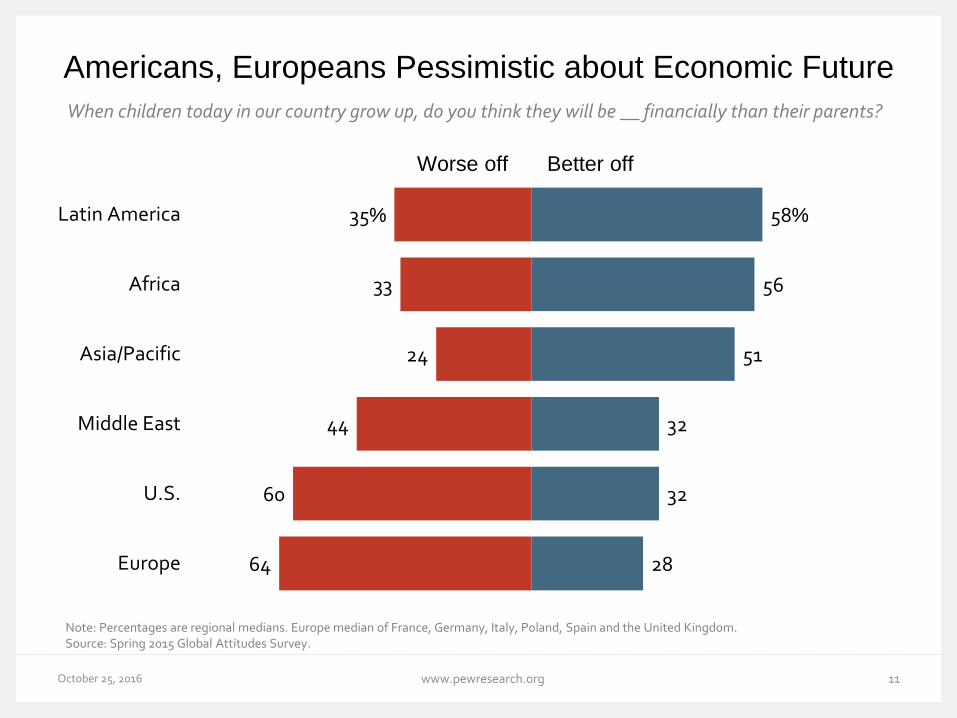
Americans, Europeans Pessimistic about Economic Future
Note: Percentages are regional medians. Europe median of France, Germany, Italy, Poland, Spain and the United Kingdom.Source: Spring 2015 Global Attitudes Survey.
When children today in our country grow up, do you think they will be __ financially than their parents?
35%
33
24
44
60
64
58%
56
51
32
32
28
Latin America
Africa
Asia/Pacific
Middle East
U.S.
Europe
Better offWorse off
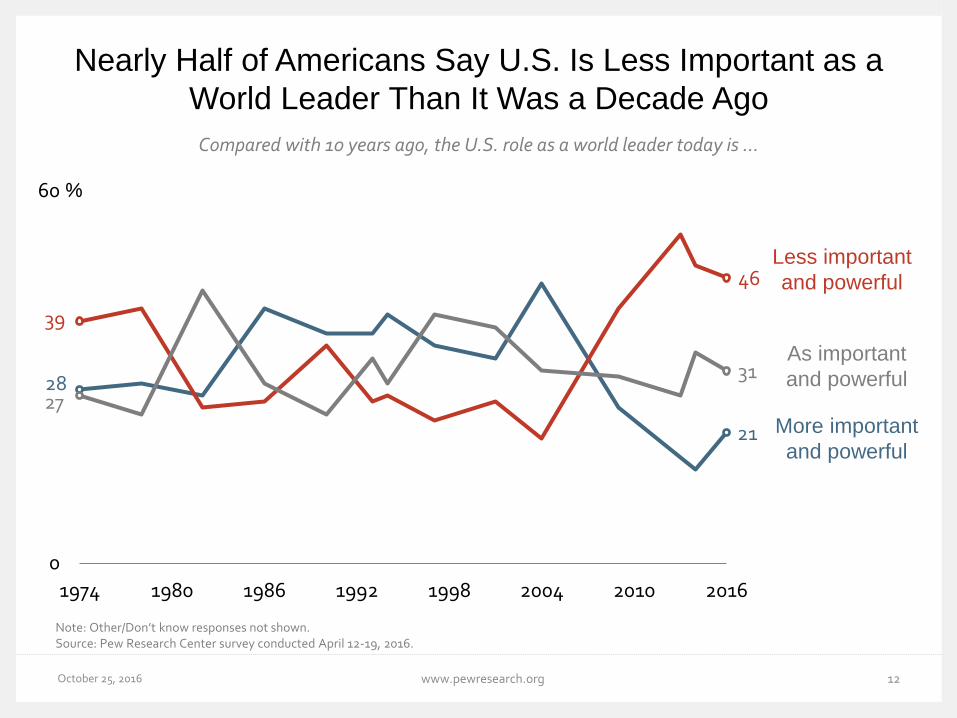
October 25, 2016 12www.pewresearch.org
Nearly Half of Americans Say U.S. Is Less Important as a
World Leader Than It Was a Decade Ago
Compared with 10 years ago, the U.S. role as a world leader today is …
Note: Other/Don’t know responses not shown. Source: Pew Research Center survey conducted April 12-19, 2016.
28
21
39
46
27
31
0
60
1974 1980 1986 1992 1998 2004 2010 2016
Less important
and powerful
More important
and powerful
As important
and powerful
%
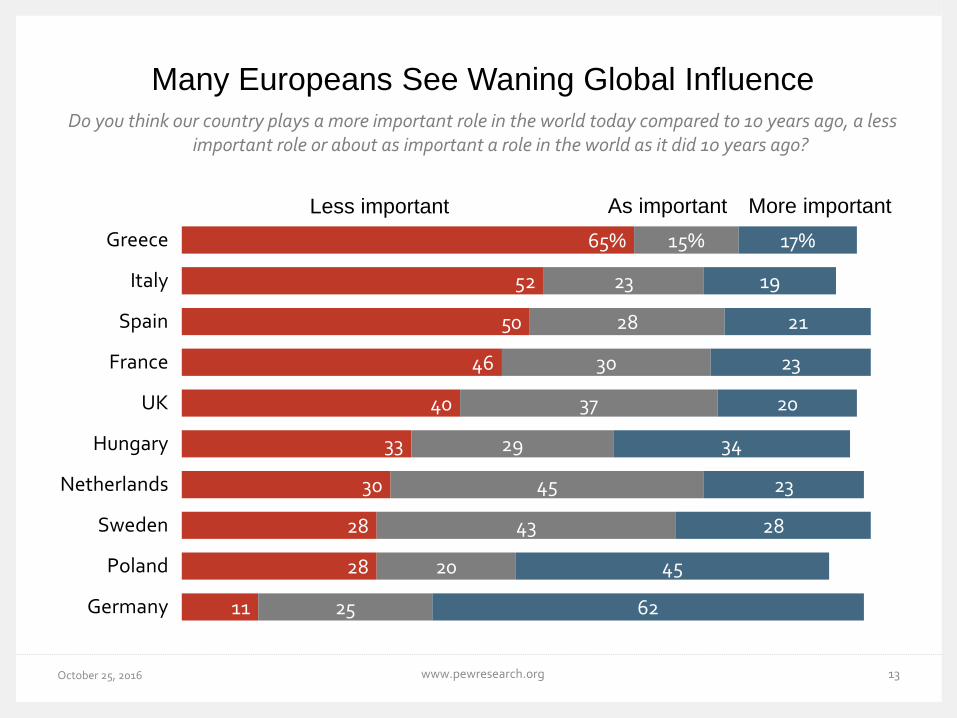
Many Europeans See Waning Global Influence
October 25, 2016 www.pewresearch.org 13
Do you think our country plays a more important role in the world today compared to 10 years ago, a less important role or about as important a role in the world as it did 10 years ago?
65%
52
50
46
40
33
30
28
28
11
15%
23
28
30
37
29
45
43
20
25
17%
19
21
23
20
34
23
28
45
62
Greece
Italy
Spain
France
UK
Hungary
Netherlands
Sweden
Poland
Germany
Less important As important More important
PERCEIVED THREATS AND VIEWS OF MINORITIES
Sept. 18, 2015 www.pewresearch.org 14
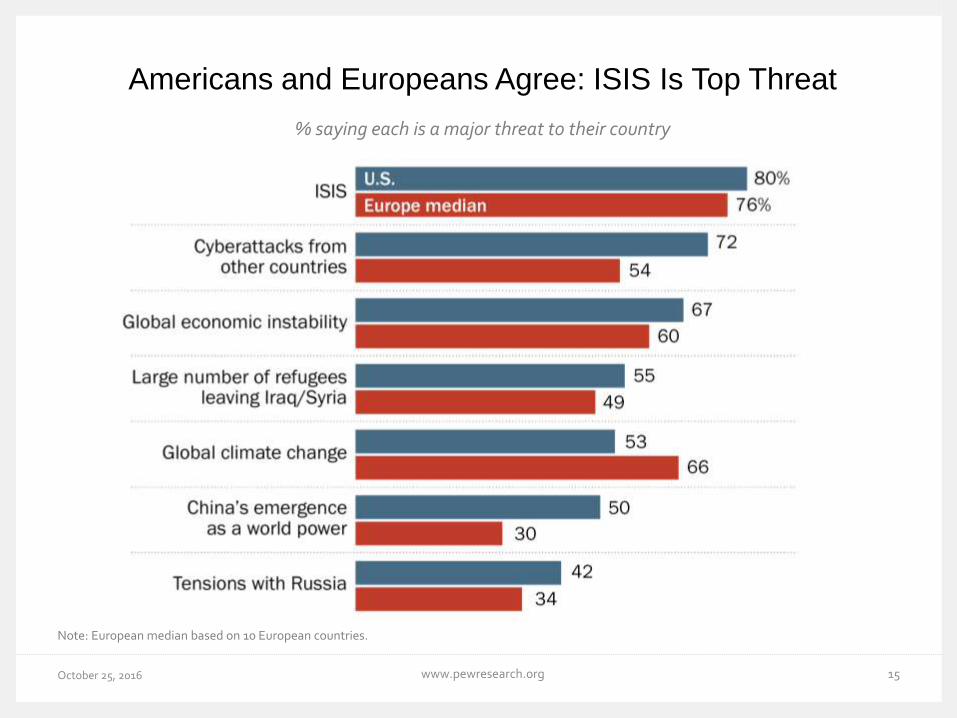
Americans and Europeans Agree: ISIS Is Top Threat
October 25, 2016 www.pewresearch.org 15
Note: European median based on 10 European countries.
% saying each is a major threat to their country
October 25, 2016 16www.pewresearch.org
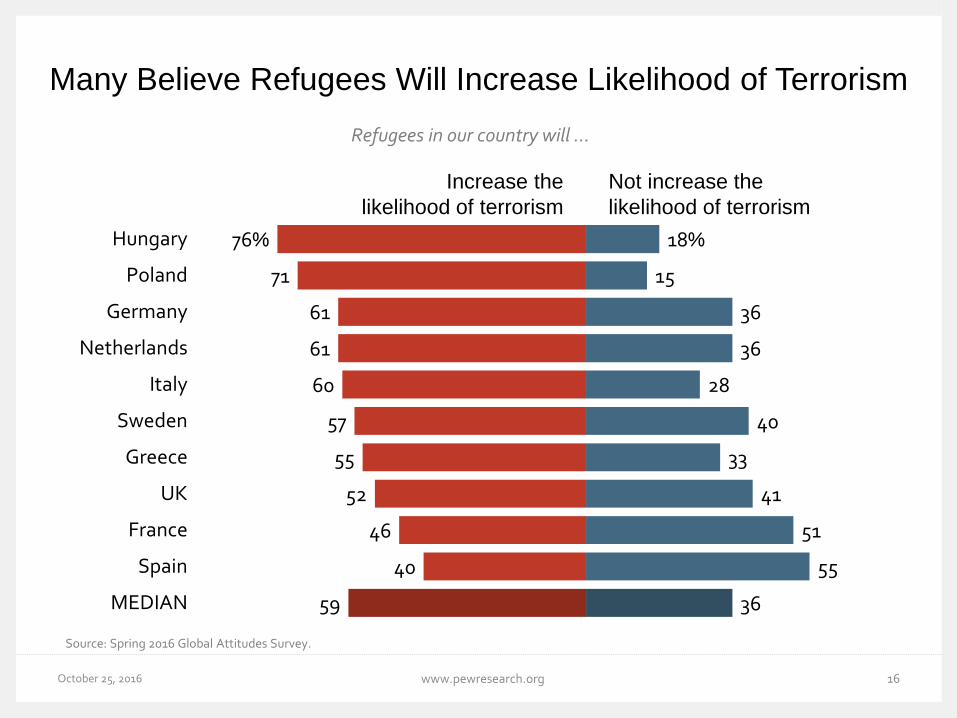
Many Believe Refugees Will Increase Likelihood of Terrorism
Refugees in our country will …
76%
71
61
61
60
57
55
52
46
40
59
18%
15
36
36
28
40
33
41
51
55
36
Hungary
Poland
Germany
Netherlands
Italy
Sweden
Greece
UK
France
Spain
MEDIAN
Not increase the
likelihood of terrorism
Increase the
likelihood of terrorism
Source: Spring 2016 Global Attitudes Survey.
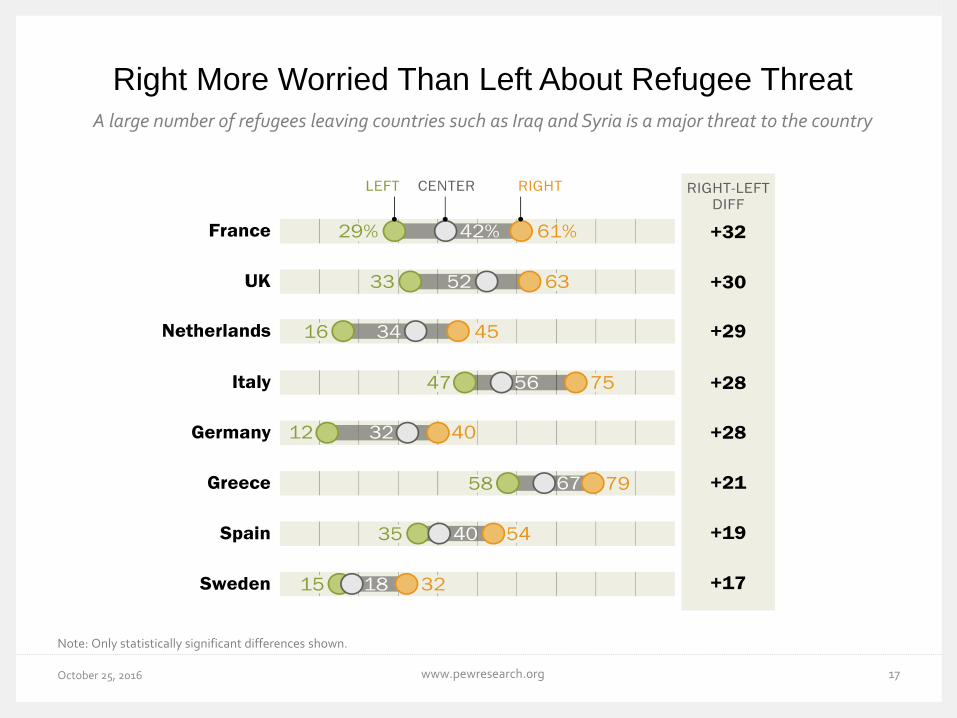
Right More Worried Than Left About Refugee Threat
October 25, 2016 www.pewresearch.org 17
Note: Only statistically significant differences shown.
A large number of refugees leaving countries such as Iraq and Syria is a major threat to the country
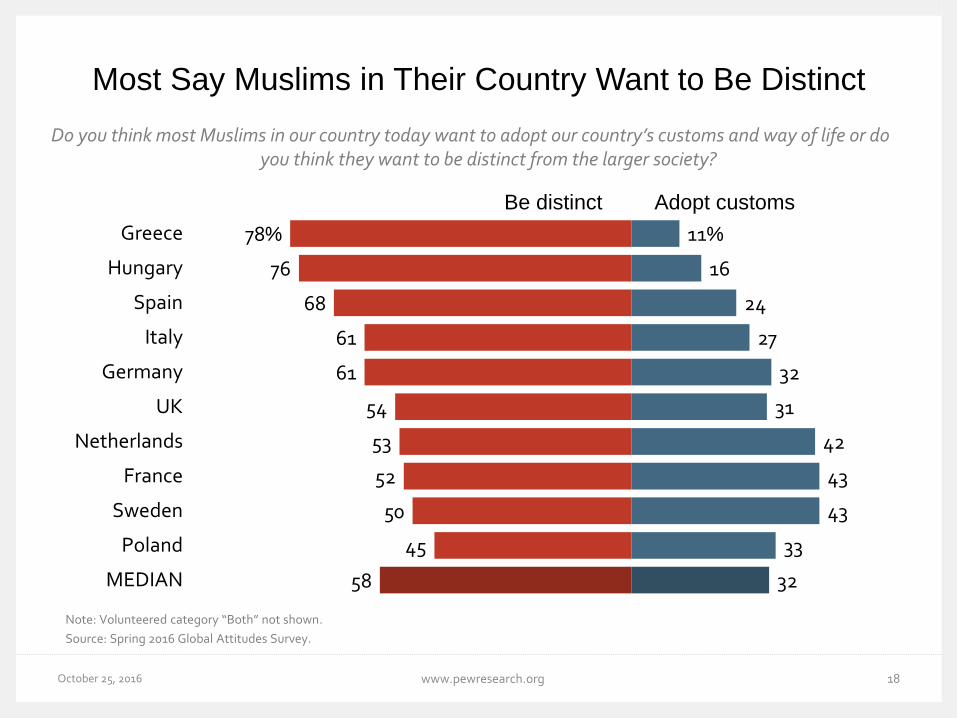
October 25, 2016 18www.pewresearch.org
Most Say Muslims in Their Country Want to Be Distinct
Do you think most Muslims in our country today want to adopt our country’s customs and way of life or do you think they want to be distinct from the larger society?
Note: Volunteered category “Both” not shown.
Source: Spring 2016 Global Attitudes Survey.
78%
76
68
61
61
54
53
52
50
45
58
11%
16
24
27
32
31
42
43
43
33
32
Greece
Hungary
Spain
Italy
Germany
UK
Netherlands
France
Sweden
Poland
MEDIAN
Adopt customsBe distinct
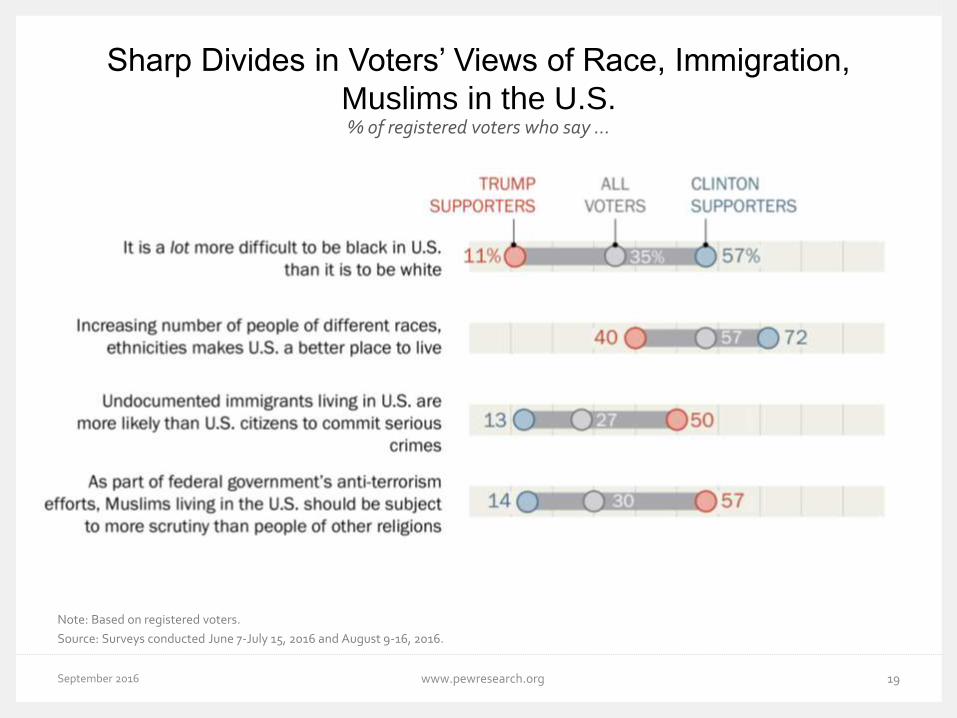
September 2016 19www.pewresearch.org
Sharp Divides in Voters’ Views of Race, Immigration,
Muslims in the U.S. % of registered voters who say …
Note: Based on registered voters.
Source: Surveys conducted June 7-July 15, 2016 and August 9-16, 2016.
A LACK OF FAITH IN INSTITUTIONS
Sept. 18, 2015 www.pewresearch.org 20
October 25, 2016 21www.pewresearch.org
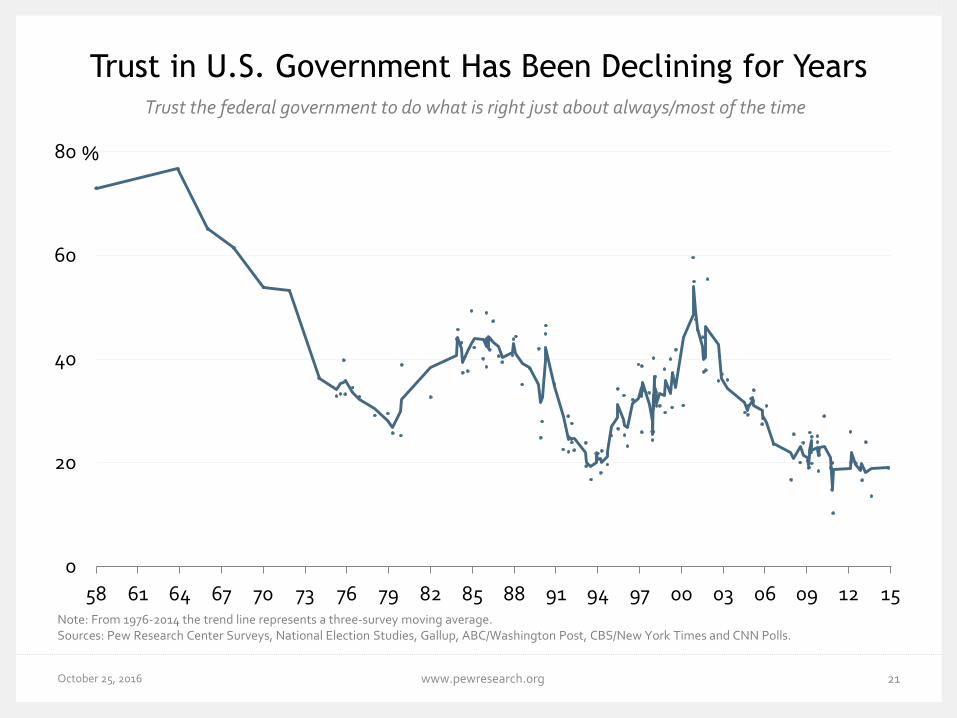
Trust in U.S. Government Has Been Declining for YearsTrust the federal government to do what is right just about always/most of the time
Note: From 1976-2014 the trend line represents a three-survey moving average.Sources: Pew Research Center Surveys, National Election Studies, Gallup, ABC/Washington Post, CBS/New York Times and CNN Polls.
0
20
40
60
80
58 61 64 67 70 73 76 79 82 85 88 91 94 97 00 03 06 09 12 15
%
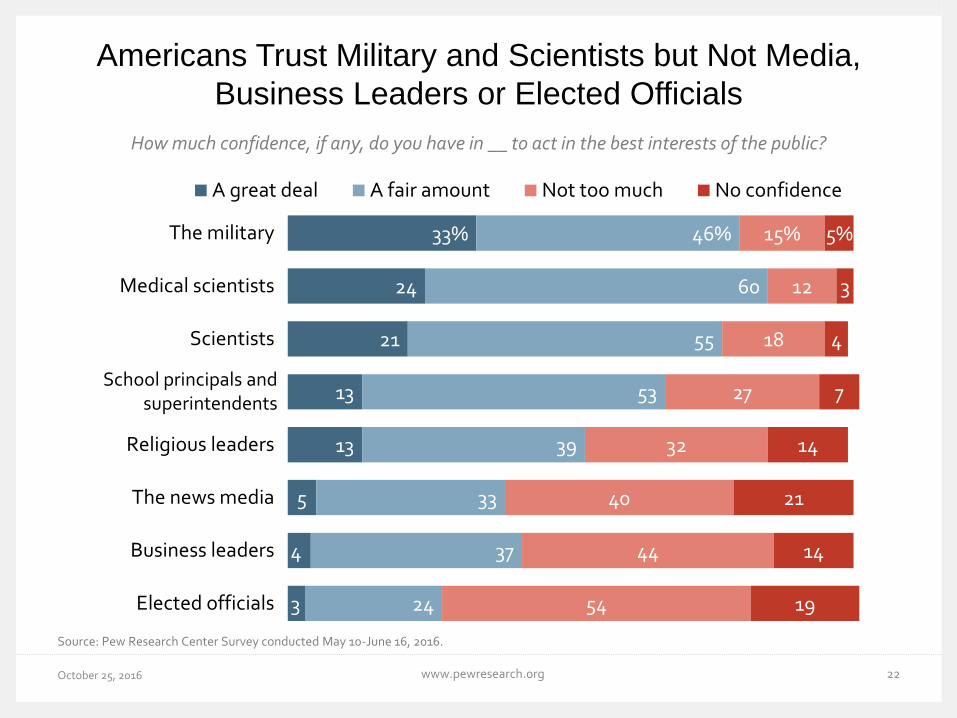
Americans Trust Military and Scientists but Not Media,
Business Leaders or Elected Officials
October 25, 2016 www.pewresearch.org 22
Source: Pew Research Center Survey conducted May 10-June 16, 2016.
33%
24
21
13
13
5
4
3
46%
60
55
53
39
33
37
24
15%
12
18
27
32
40
44
54
5%
3
4
7
14
21
14
19
The military
Medical scientists
Scientists
Religious leaders
The news media
Business leaders
Elected officials
A great deal A fair amount Not too much No confidence
School principals and superintendents
How much confidence, if any, do you have in __ to act in the best interests of the public?
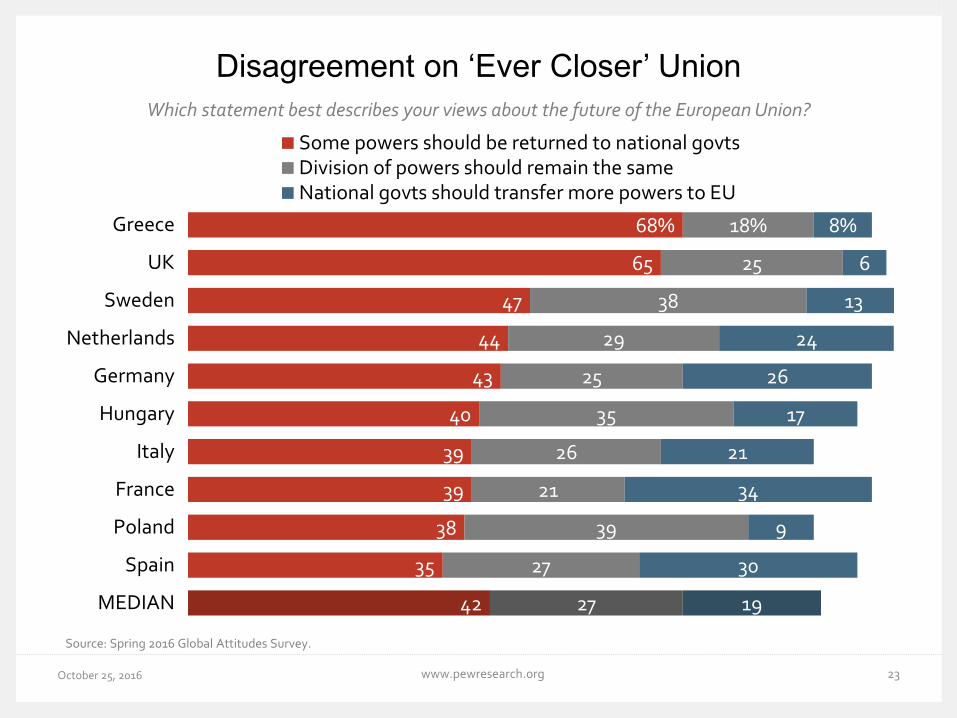
October 25, 2016 www.pewresearch.org 23
Which statement best describes your views about the future of the European Union?
68%
65
47
44
43
40
39
39
38
35
42
18%
25
38
29
25
35
26
21
39
27
27
8%
6
13
24
26
17
21
34
9
30
19
Greece
UK
Sweden
Netherlands
Germany
Hungary
Italy
France
Poland
Spain
MEDIAN
Some powers should be returned to national govtsDivision of powers should remain the sameNational govts should transfer more powers to EU
Disagreement on ‘Ever Closer’ Union
Source: Spring 2016 Global Attitudes Survey.
MANY WARY OF GLOBAL ENGAGEMENT
Sept. 18, 2015 www.pewresearch.org 24
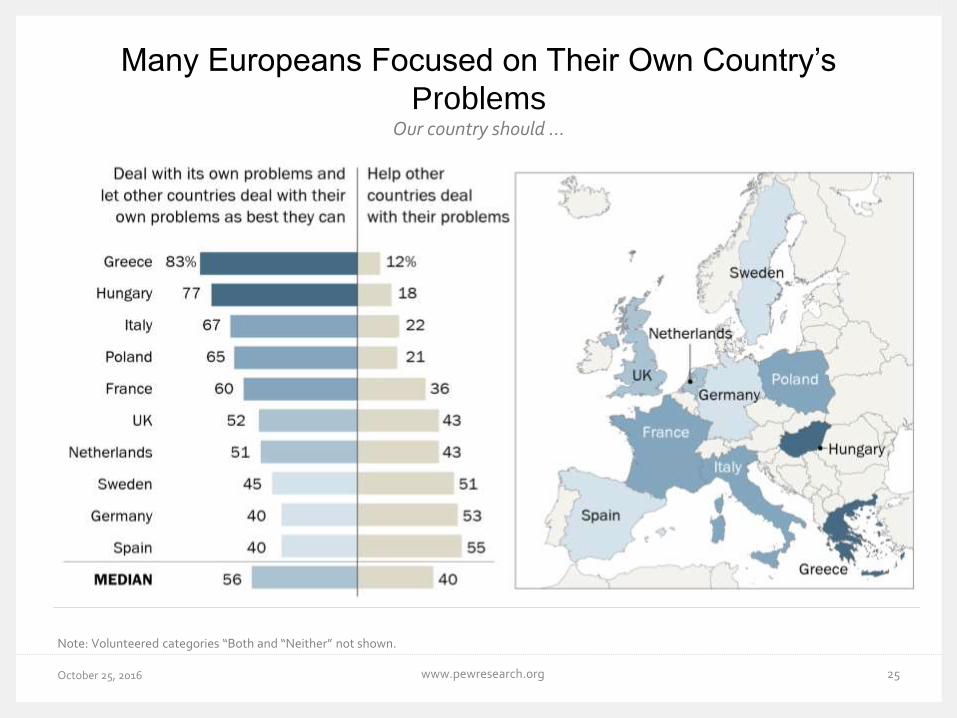
Many Europeans Focused on Their Own Country’s
Problems
October 25, 2016 www.pewresearch.org 25
Note: Volunteered categories “Both and “Neither” not shown.
Our country should …
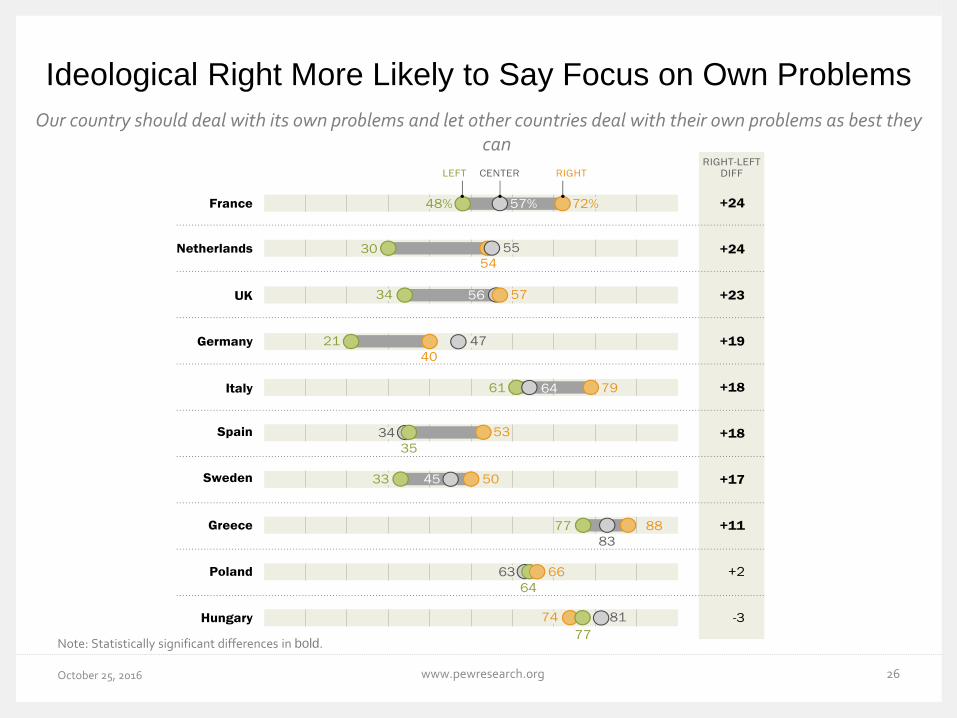
Ideological Right More Likely to Say Focus on Own Problems
October 25, 2016 www.pewresearch.org 26
Note: Statistically significant differences in bold.
Our country should deal with its own problems and let other countries deal with their own problems as best they can
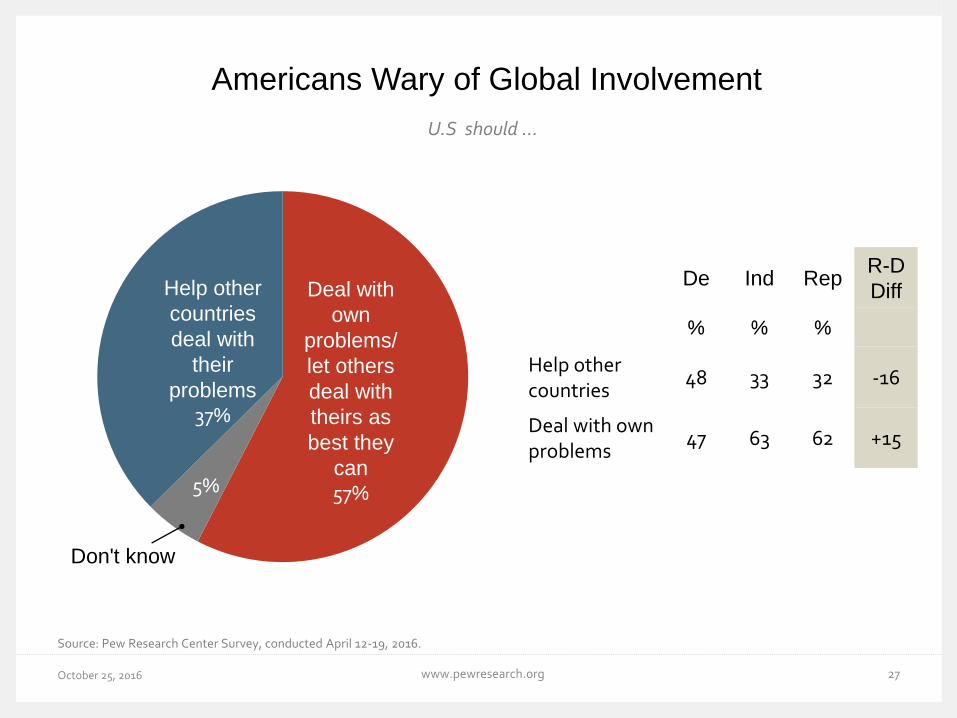
Americans Wary of Global Involvement
October 25, 2016 www.pewresearch.org 27
Source: Pew Research Center Survey, conducted April 12-19, 2016.
U.S should …
5%
Don't know
Deal with
own
problems/
let others
deal with
theirs as
best they
can57%
Help other
countries
deal with
their
problems 37%
De Ind RepR-D
Diff
% % %
Help other countries
48 33 32 -16
Deal with own problems
47 63 62 +15
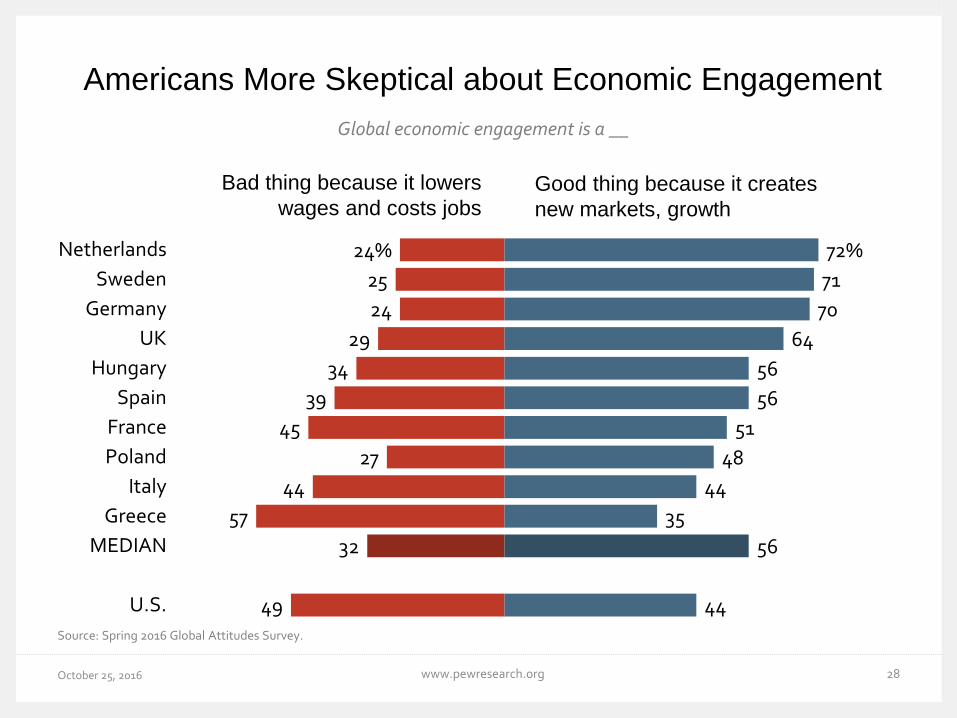
Americans More Skeptical about Economic Engagement
October 25, 2016 www.pewresearch.org 28
Global economic engagement is a __
24%
25
24
29
34
39
45
27
44
57
32
49
72%
71
70
64
56
56
51
48
44
35
56
44
Netherlands
Sweden
Germany
UK
Hungary
Spain
France
Poland
Italy
Greece
MEDIAN
U.S.
Bad thing because it lowers
wages and costs jobsGood thing because it creates
new markets, growth
Source: Spring 2016 Global Attitudes Survey.
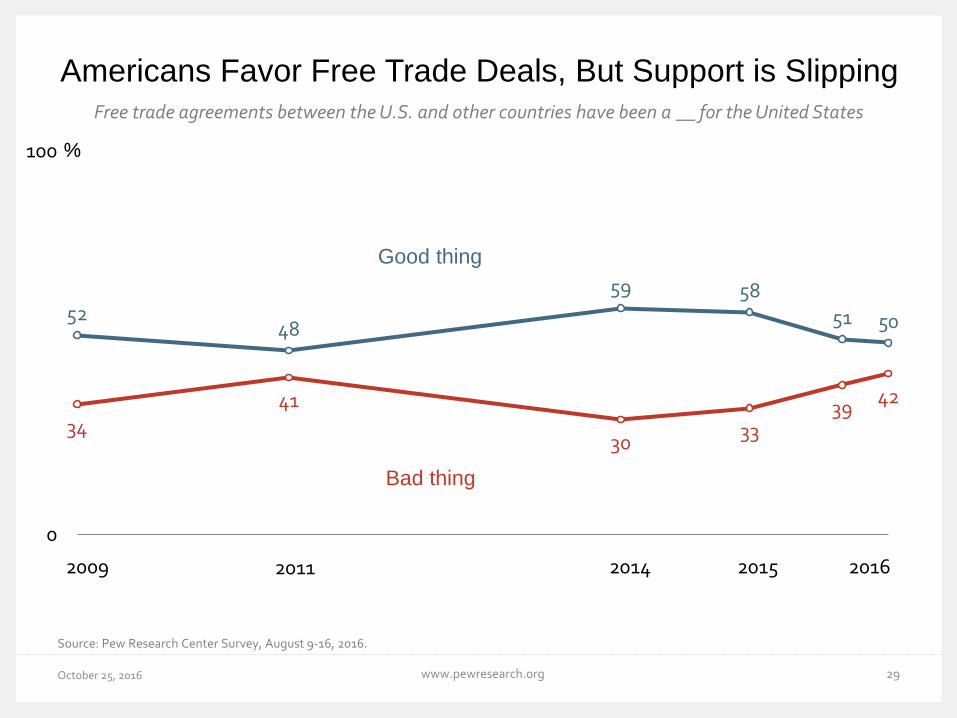
Americans Favor Free Trade Deals, But Support is Slipping
October 25, 2016 www.pewresearch.org 29
Source: Pew Research Center Survey, August 9-16, 2016.
Free trade agreements between the U.S. and other countries have been a __ for the United States
5248
59 58
51 50
34
41
3033
3942
0
100
Good thing
Bad thing
%
20162015201420112009
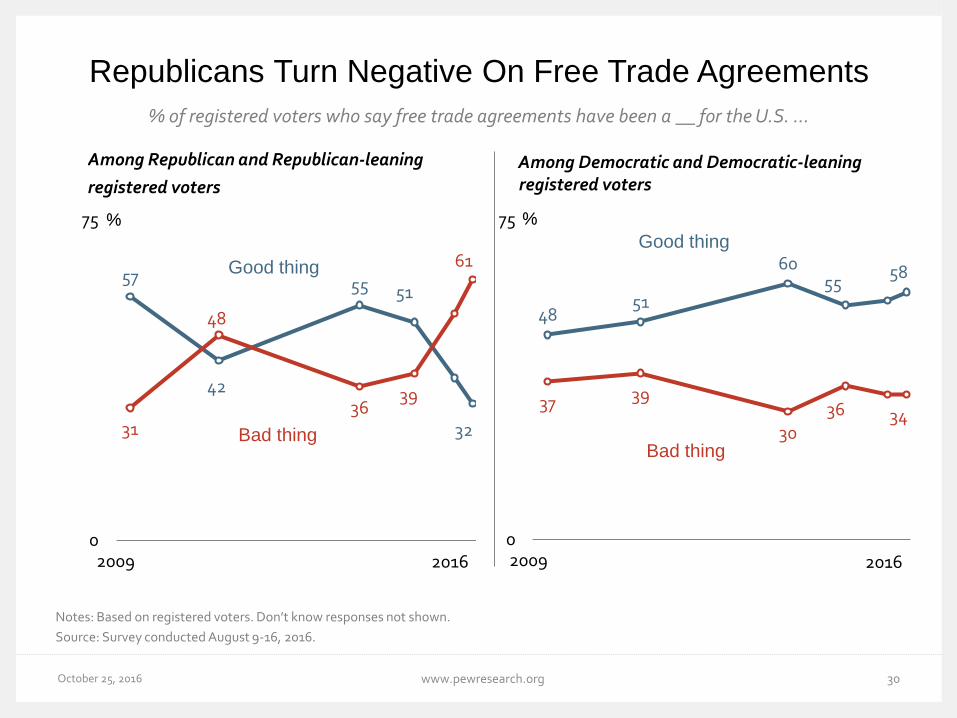
October 25, 2016 30www.pewresearch.org
Republicans Turn Negative On Free Trade Agreements
% of registered voters who say free trade agreements have been a __ for the U.S. …
Notes: Based on registered voters. Don’t know responses not shown.
Source: Survey conducted August 9-16, 2016.
Among Republican and Republican-leaning
registered voters
Among Democratic and Democratic-leaning registered voters
57
42
55 51
3231
48
3639
61
0
75
2009 2016
Bad thing
Good thing
4851
6055
58
37 39
30
36 34
0
75
2009 2016
Bad thing
Good thing
% %
October 25, 2016 31
All Pew Research Center reports and data are available online at www.pewresearch.org
Global Attitudes: www.pewglobal.org
@pewglobal
@RichardWike
www.pewresearch.org