Embed Size (px)
Citation preview
1
The effect of illicit financial flows on time to reach the fourth Millennium Development Goal in Sub-
Saharan Africa: a quantitative analysis
Short title – Illicit financial flows and the fourth Millennium Development Goal
O’Hare BA,
Senior Lecturer in Global Health Implementation, College of Medicine and St Andrews University
Private Bag 360, Blantyre, Chichiri, Blantyre, Malawi. [email protected]
Makuta I,
Department of Economics, University of Malawi, Zomba, Malawi
Bar Zeev N,
Malawi Liverpool Wellcome Trust, Blantyre, Malawi
Chiwaula L,
Department of Economics, University of Malawi, Zomba, Malawi
Cobham A
Centre for Global Development
2
Abstract
Introduction
Richer countries have lower child mortality (1). One of the constraints to development and therefore child survival
in Sub Saharan Africa (SSA) is shortage of capital and public revenues, yet more than $800 billion left the continent
over the last 40 years as illicit financial flows (IFF), at the expense of both (2).
Objectives
This paper sets out to estimate the cost of illicit financial flows in terms of the amount of time it could take to
reach the fourth Millennium Development Goal (MDG) in 34 African countries.
Design
We have calculated the percentage increase in Gross Domestic Product (GDP) if IFF were curtailed using IFF/GDP
ratios. We applied the income (GDP) elasticity of child mortality to the increase in GDP to estimate the reduction in
time to reach the fourth MDG in 34 African countries.
Settings
34 countries in SSA
Main Outcome measures
Reduction in time to reach the first indicator of the fourth MDG, under-five mortality rate in the absence of IFF
Results
We find that in the 34 SSA countries, six countries will achieve their fourth MDG target at the current rates of
decline. In the absence of IFF, sixteen countries would reach their fourth MDG target by 2015 and there would be
large reductions for all other countries.
Conclusions
This drain on development is facilitated by financial secrecy in other jurisdictions. Rich and poor countries alike
must stem the hemorrhage of illicit financial flows by taking decisive steps towards improving financial
transparency.
3
Background
The MDGs are eight development goals, agreed to by 189 countries in 2000. These goals provided the international
community with a focus upon which to act. The fourth MDG is to reduce by two-thirds, between 1990 and 2015,
the under-five mortality rate. There are three indicators which are used to monitor progress towards the fourth
MDG (3); these indicators are -
4.1 Under five mortality rate
4.2 Infant mortality rate
4.3 Proportion of children aged 1 year who are immunised against measles
As each country had different rates of mortality at baseline in 1990, each were set a different target to aim
towards. However, the majority of countries in the SSA region are making insufficient progress to meet their target
as indicated by their progress towards the first indicator, the under-five mortality rate (4).
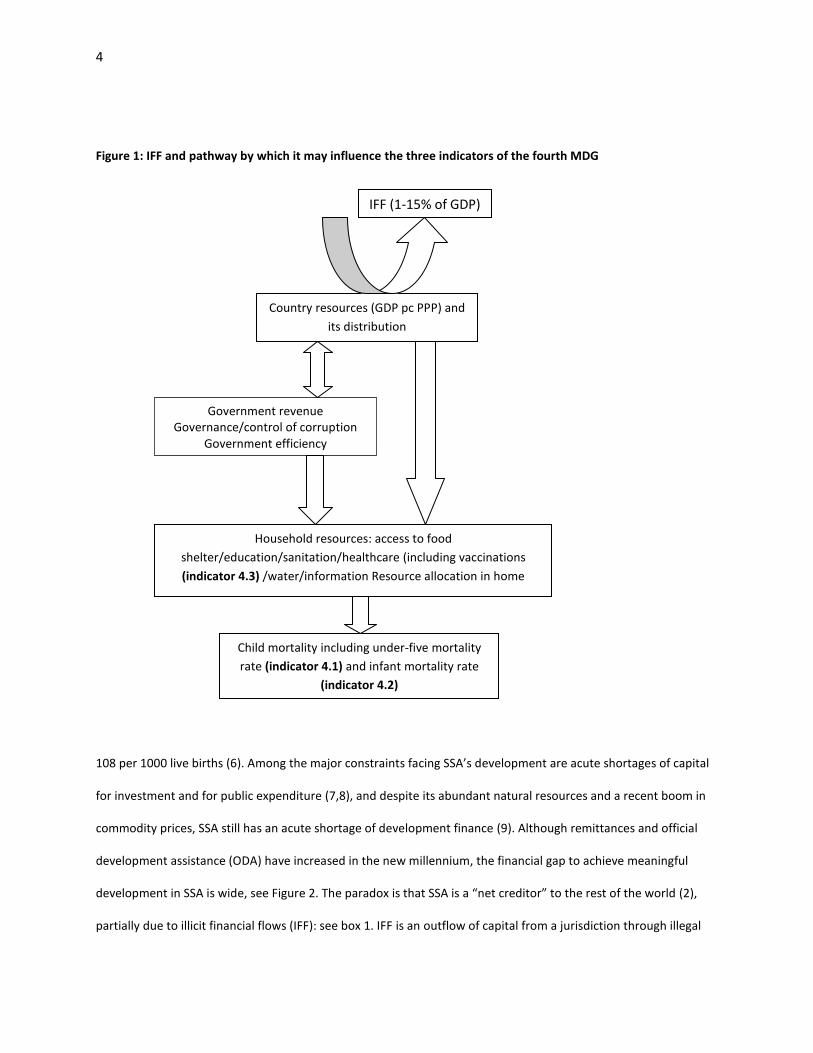
The capital coming into a country (or leaving it) may influence the child mortality rate, and therefore the
fourth MDG indicators, by several pathways, see figure 1 for a schematic representation. The most direct and
arguably the most important is the impact on household income and thus the ability of the family to provide for
their children. The second is that the amount of capital coming into a country will influence the amount of
government revenue available to provide social goods such as healthcare, education, water and sanitation. This
latter pathway may be modified either positively or negatively by factors such control of corruption and the
effectiveness of a government. The degree of corruption in a government also influences the capital coming into a
country as corruption deters foreign direct investment, which in turn will affect household income. Government
effectiveness is important for the provision of water and healthcare whereas household income is more important
for shelter, sanitation and education (5).
Many countries in Sub Saharan Africa (SSA) have experienced economic growth over the last decade
despite a global downturn, but it remains the world’s least developed region; as a result the under-five mortality
rate is still
4
Figure 1: IFF and pathway by which it may influence the three indicators of the fourth MDG
108 per 1000 live births (6). Among the major constraints facing SSA’s development are acute shortages of capital
for investment and for public expenditure (7,8), and despite its abundant natural resources and a recent boom in
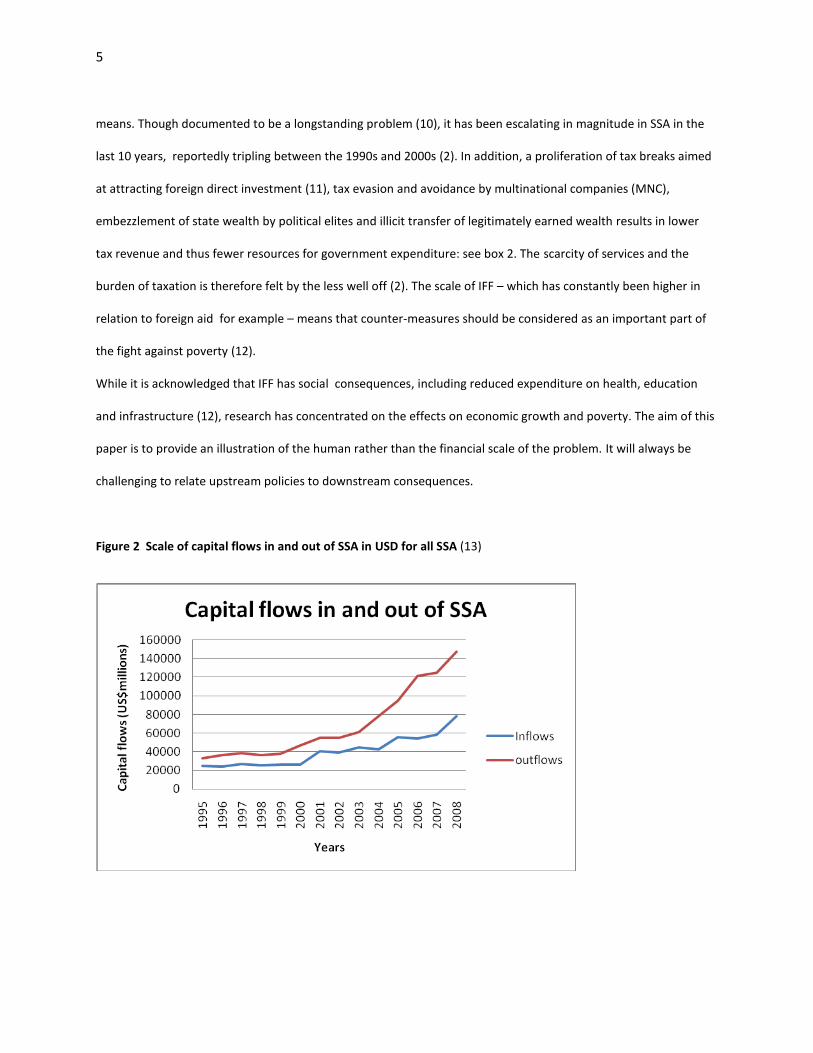
commodity prices, SSA still has an acute shortage of development finance (9). Although remittances and official
development assistance (ODA) have increased in the new millennium, the financial gap to achieve meaningful
development in SSA is wide, see Figure 2. The paradox is that SSA is a “net creditor” to the rest of the world (2),
partially due to illicit financial flows (IFF): see box 1. IFF is an outflow of capital from a jurisdiction through illegal
Country resources (GDP pc PPP) and
its distribution
Household resources: access to food
shelter/education/sanitation/healthcare (including vaccinations
(indicator 4.3) /water/information Resource allocation in home
Child mortality including under-five mortality
rate (indicator 4.1) and infant mortality rate
(indicator 4.2)
Government revenue Governance/control of corruption
Government efficiency
IFF (1-15% of GDP)
5
means. Though documented to be a longstanding problem (10), it has been escalating in magnitude in SSA in the
last 10 years, reportedly tripling between the 1990s and 2000s (2). In addition, a proliferation of tax breaks aimed
at attracting foreign direct investment (11), tax evasion and avoidance by multinational companies (MNC),
embezzlement of state wealth by political elites and illicit transfer of legitimately earned wealth results in lower
tax revenue and thus fewer resources for government expenditure: see box 2. The scarcity of services and the
burden of taxation is therefore felt by the less well off (2). The scale of IFF – which has constantly been higher in
relation to foreign aid for example – means that counter-measures should be considered as an important part of
the fight against poverty (12).
While it is acknowledged that IFF has social consequences, including reduced expenditure on health, education
and infrastructure (12), research has concentrated on the effects on economic growth and poverty. The aim of this
paper is to provide an illustration of the human rather than the financial scale of the problem. It will always be
challenging to relate upstream policies to downstream consequences.
Figure 2 Scale of capital flows in and out of SSA in USD for all SSA (13)
6
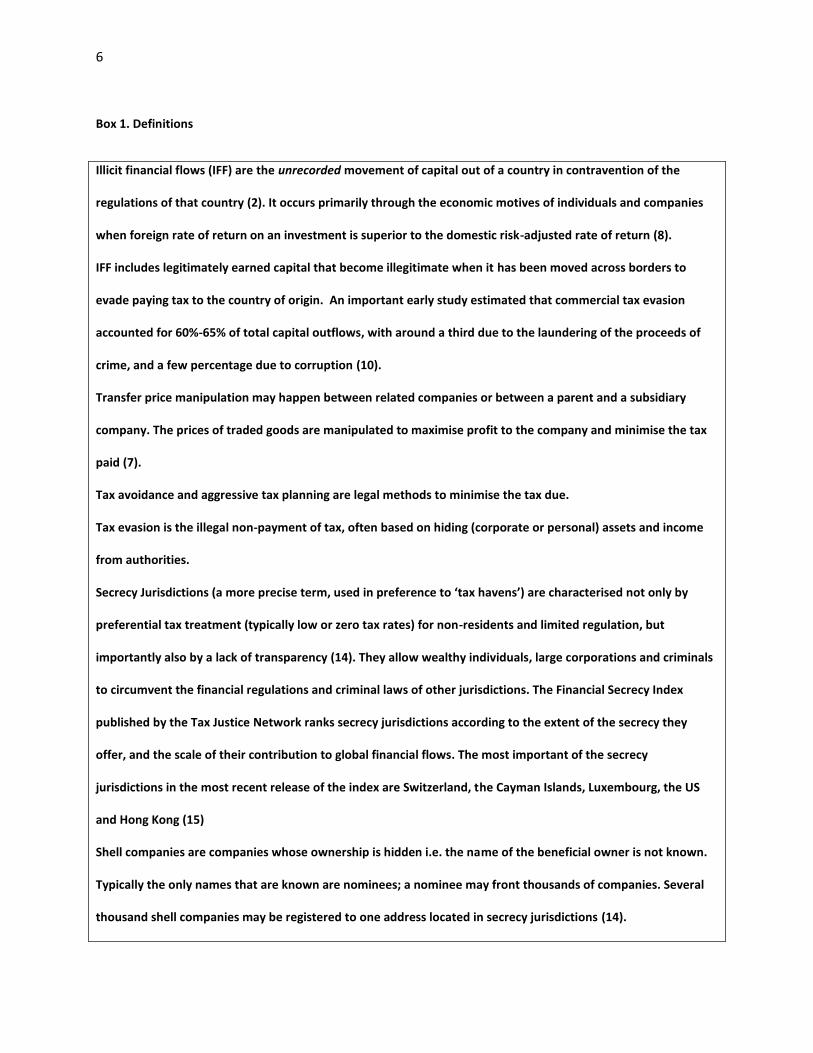
Box 1. Definitions
Illicit financial flows (IFF) are the unrecorded movement of capital out of a country in contravention of the
regulations of that country (2). It occurs primarily through the economic motives of individuals and companies
when foreign rate of return on an investment is superior to the domestic risk-adjusted rate of return (8).
IFF includes legitimately earned capital that become illegitimate when it has been moved across borders to
evade paying tax to the country of origin. An important early study estimated that commercial tax evasion
accounted for 60%-65% of total capital outflows, with around a third due to the laundering of the proceeds of
crime, and a few percentage due to corruption (10).
Transfer price manipulation may happen between related companies or between a parent and a subsidiary
company. The prices of traded goods are manipulated to maximise profit to the company and minimise the tax
paid (7).
Tax avoidance and aggressive tax planning are legal methods to minimise the tax due.
Tax evasion is the illegal non-payment of tax, often based on hiding (corporate or personal) assets and income
from authorities.
Secrecy Jurisdictions (a more precise term, used in preference to ‘tax havens’) are characterised not only by
preferential tax treatment (typically low or zero tax rates) for non-residents and limited regulation, but
importantly also by a lack of transparency (14). They allow wealthy individuals, large corporations and criminals
to circumvent the financial regulations and criminal laws of other jurisdictions. The Financial Secrecy Index
published by the Tax Justice Network ranks secrecy jurisdictions according to the extent of the secrecy they
offer, and the scale of their contribution to global financial flows. The most important of the secrecy
jurisdictions in the most recent release of the index are Switzerland, the Cayman Islands, Luxembourg, the US
and Hong Kong (15)
Shell companies are companies whose ownership is hidden i.e. the name of the beneficial owner is not known.
Typically the only names that are known are nominees; a nominee may front thousands of companies. Several
thousand shell companies may be registered to one address located in secrecy jurisdictions (14).
7
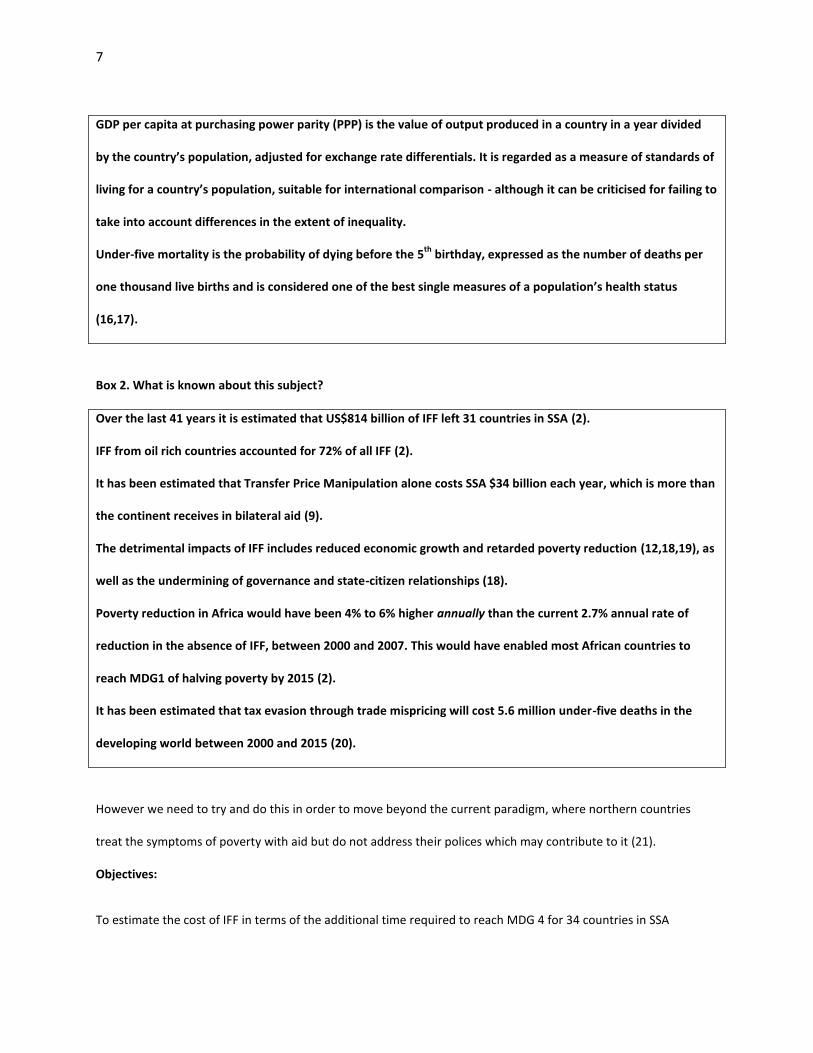
GDP per capita at purchasing power parity (PPP) is the value of output produced in a country in a year divided
by the country’s population, adjusted for exchange rate differentials. It is regarded as a measure of standards of
living for a country’s population, suitable for international comparison - although it can be criticised for failing to
take into account differences in the extent of inequality.
Under-five mortality is the probability of dying before the 5th
birthday, expressed as the number of deaths per
one thousand live births and is considered one of the best single measures of a population’s health status
(16,17).
Box 2. What is known about this subject?
Over the last 41 years it is estimated that US$814 billion of IFF left 31 countries in SSA (2).
IFF from oil rich countries accounted for 72% of all IFF (2).
It has been estimated that Transfer Price Manipulation alone costs SSA $34 billion each year, which is more than
the continent receives in bilateral aid (9).
The detrimental impacts of IFF includes reduced economic growth and retarded poverty reduction (12,18,19), as
well as the undermining of governance and state-citizen relationships (18).
Poverty reduction in Africa would have been 4% to 6% higher annually than the current 2.7% annual rate of
reduction in the absence of IFF, between 2000 and 2007. This would have enabled most African countries to
reach MDG1 of halving poverty by 2015 (2).
It has been estimated that tax evasion through trade mispricing will cost 5.6 million under-five deaths in the
developing world between 2000 and 2015 (20).
However we need to try and do this in order to move beyond the current paradigm, where northern countries
treat the symptoms of poverty with aid but do not address their polices which may contribute to it (21).
Objectives:
To estimate the cost of IFF in terms of the additional time required to reach MDG 4 for 34 countries in SSA
8
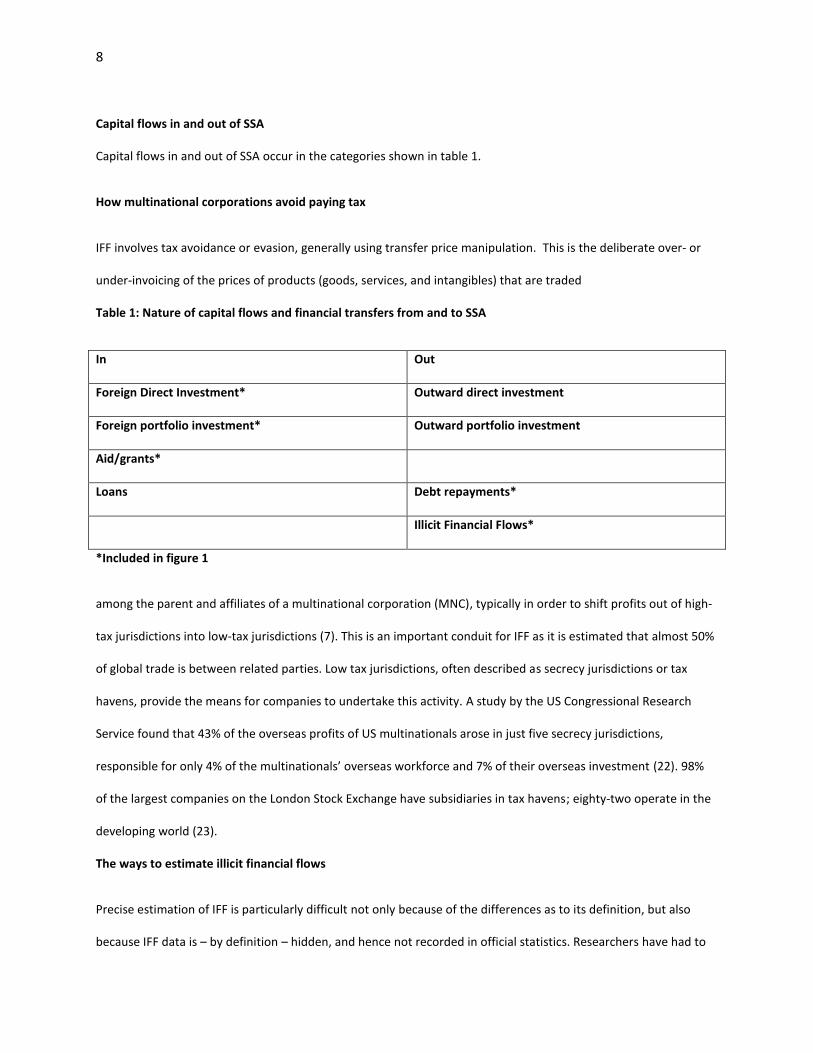
Capital flows in and out of SSA
Capital flows in and out of SSA occur in the categories shown in table 1.
How multinational corporations avoid paying tax
IFF involves tax avoidance or evasion, generally using transfer price manipulation. This is the deliberate over- or
under-invoicing of the prices of products (goods, services, and intangibles) that are traded
Table 1: Nature of capital flows and financial transfers from and to SSA
In Out
Foreign Direct Investment* Outward direct investment
Foreign portfolio investment* Outward portfolio investment
Aid/grants*
Loans Debt repayments*
Illicit Financial Flows*
*Included in figure 1
among the parent and affiliates of a multinational corporation (MNC), typically in order to shift profits out of high-
tax jurisdictions into low-tax jurisdictions (7). This is an important conduit for IFF as it is estimated that almost 50%
of global trade is between related parties. Low tax jurisdictions, often described as secrecy jurisdictions or tax
havens, provide the means for companies to undertake this activity. A study by the US Congressional Research
Service found that 43% of the overseas profits of US multinationals arose in just five secrecy jurisdictions,
responsible for only 4% of the multinationals’ overseas workforce and 7% of their overseas investment (22). 98%
of the largest companies on the London Stock Exchange have subsidiaries in tax havens; eighty-two operate in the
developing world (23).
The ways to estimate illicit financial flows
Precise estimation of IFF is particularly difficult not only because of the differences as to its definition, but also
because IFF data is – by definition – hidden, and hence not recorded in official statistics. Researchers have had to
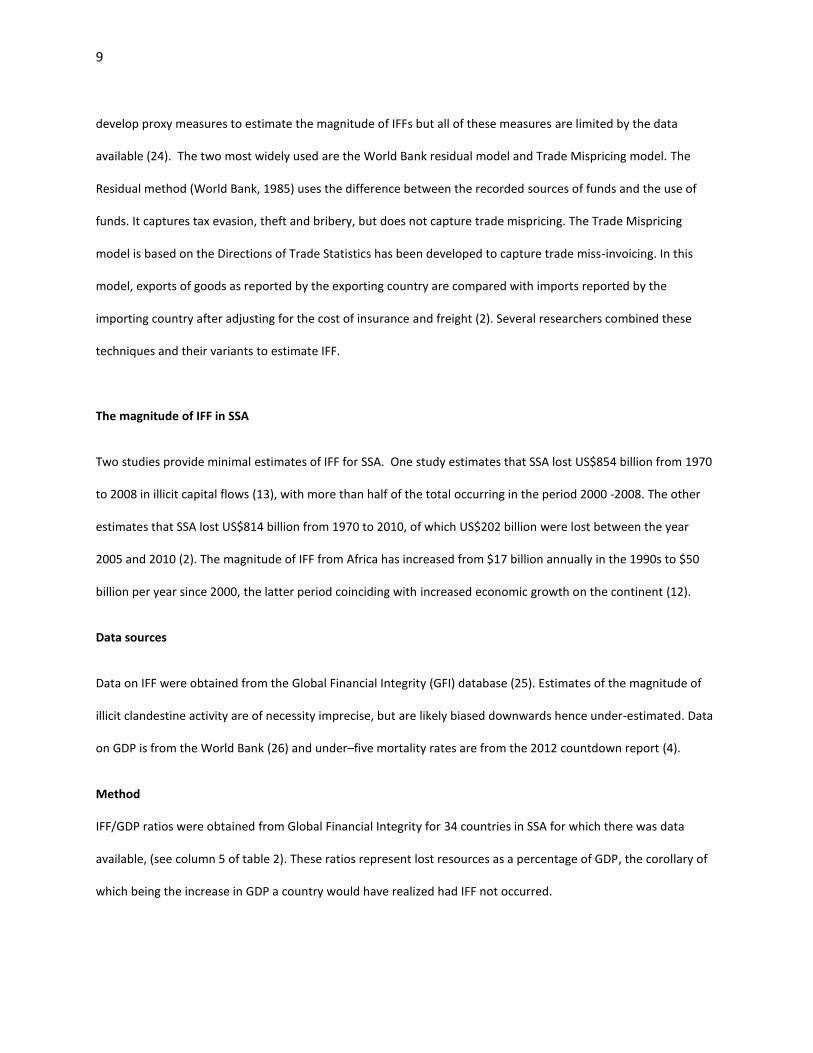
9
develop proxy measures to estimate the magnitude of IFFs but all of these measures are limited by the data
available (24). The two most widely used are the World Bank residual model and Trade Mispricing model. The
Residual method (World Bank, 1985) uses the difference between the recorded sources of funds and the use of
funds. It captures tax evasion, theft and bribery, but does not capture trade mispricing. The Trade Mispricing
model is based on the Directions of Trade Statistics has been developed to capture trade miss-invoicing. In this
model, exports of goods as reported by the exporting country are compared with imports reported by the
importing country after adjusting for the cost of insurance and freight (2). Several researchers combined these
techniques and their variants to estimate IFF.
The magnitude of IFF in SSA
Two studies provide minimal estimates of IFF for SSA. One study estimates that SSA lost US$854 billion from 1970
to 2008 in illicit capital flows (13), with more than half of the total occurring in the period 2000 -2008. The other
estimates that SSA lost US$814 billion from 1970 to 2010, of which US$202 billion were lost between the year
2005 and 2010 (2). The magnitude of IFF from Africa has increased from $17 billion annually in the 1990s to $50
billion per year since 2000, the latter period coinciding with increased economic growth on the continent (12).
Data sources
Data on IFF were obtained from the Global Financial Integrity (GFI) database (25). Estimates of the magnitude of
illicit clandestine activity are of necessity imprecise, but are likely biased downwards hence under-estimated. Data
on GDP is from the World Bank (26) and under–five mortality rates are from the 2012 countdown report (4).
Method
IFF/GDP ratios were obtained from Global Financial Integrity for 34 countries in SSA for which there was data
available, (see column 5 of table 2). These ratios represent lost resources as a percentage of GDP, the corollary of
which being the increase in GDP a country would have realized had IFF not occurred.
10
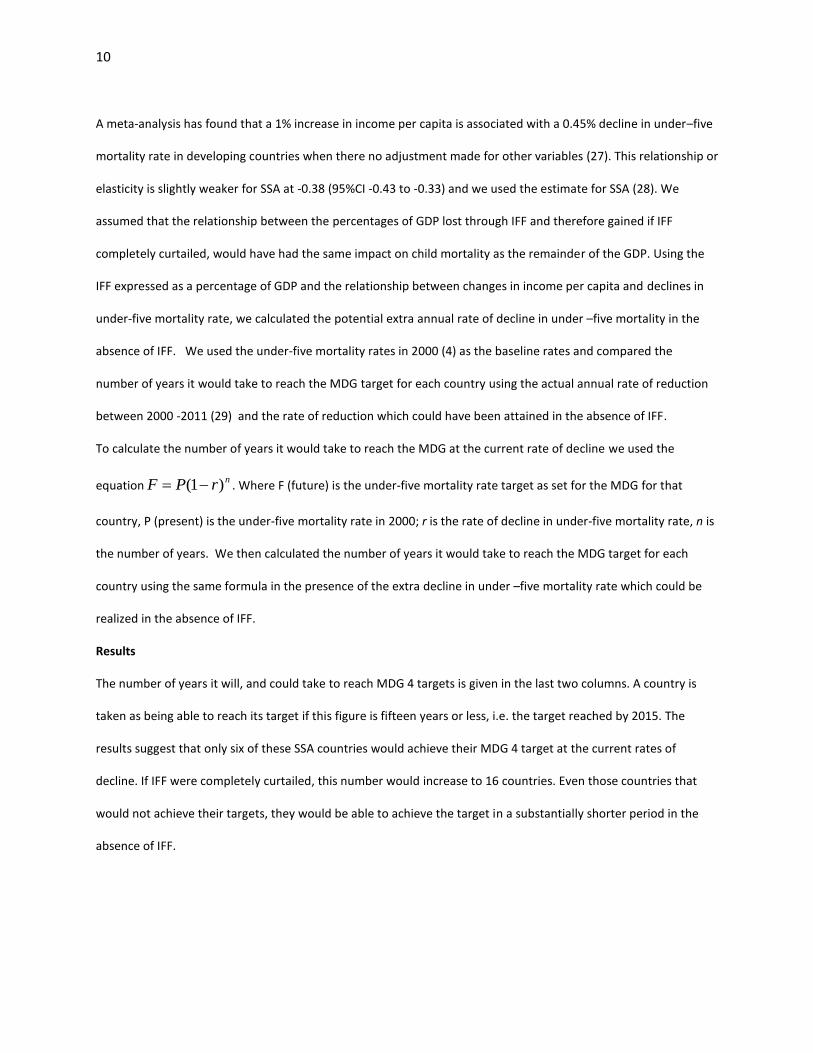
A meta-analysis has found that a 1% increase in income per capita is associated with a 0.45% decline in under–five
mortality rate in developing countries when there no adjustment made for other variables (27). This relationship or
elasticity is slightly weaker for SSA at -0.38 (95%CI -0.43 to -0.33) and we used the estimate for SSA (28). We
assumed that the relationship between the percentages of GDP lost through IFF and therefore gained if IFF
completely curtailed, would have had the same impact on child mortality as the remainder of the GDP. Using the
IFF expressed as a percentage of GDP and the relationship between changes in income per capita and declines in
under-five mortality rate, we calculated the potential extra annual rate of decline in under –five mortality in the
absence of IFF. We used the under-five mortality rates in 2000 (4) as the baseline rates and compared the
number of years it would take to reach the MDG target for each country using the actual annual rate of reduction
between 2000 -2011 (29) and the rate of reduction which could have been attained in the absence of IFF.
To calculate the number of years it would take to reach the MDG at the current rate of decline we used the
equationnrPF )1( . Where F (future) is the under-five mortality rate target as set for the MDG for that
country, P (present) is the under-five mortality rate in 2000; r is the rate of decline in under-five mortality rate, n is
the number of years. We then calculated the number of years it would take to reach the MDG target for each
country using the same formula in the presence of the extra decline in under –five mortality rate which could be
realized in the absence of IFF.
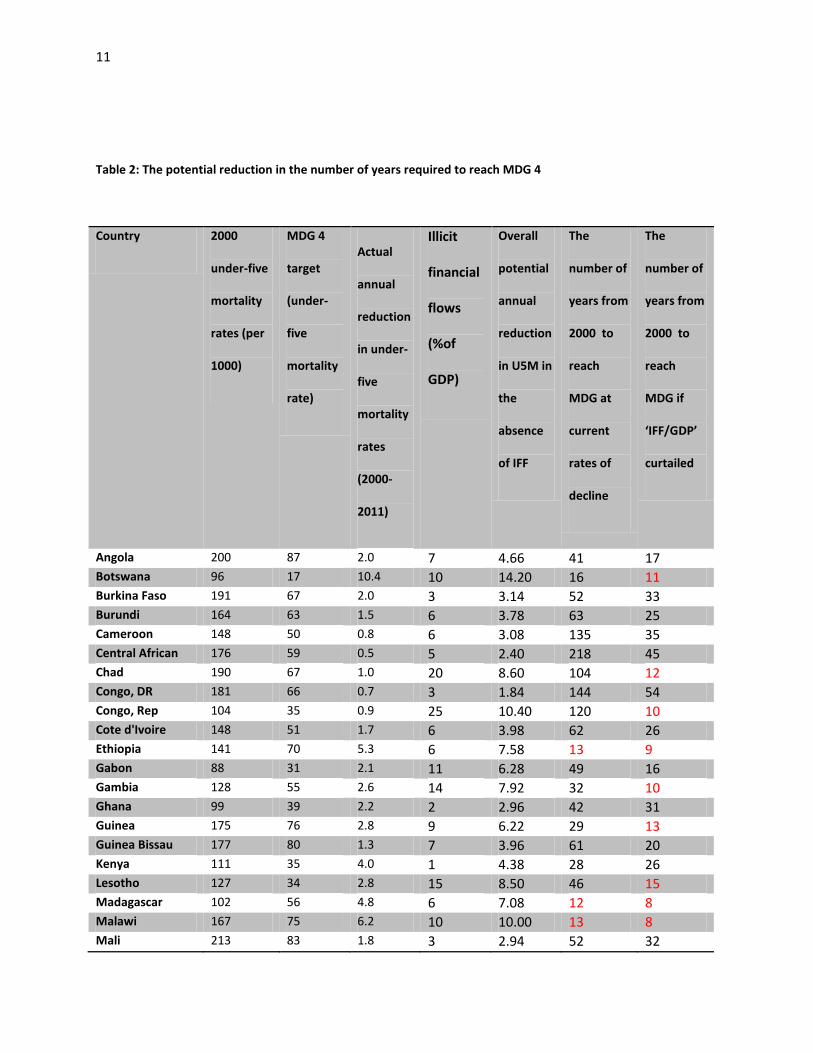
Results
The number of years it will, and could take to reach MDG 4 targets is given in the last two columns. A country is
taken as being able to reach its target if this figure is fifteen years or less, i.e. the target reached by 2015. The
results suggest that only six of these SSA countries would achieve their MDG 4 target at the current rates of
decline. If IFF were completely curtailed, this number would increase to 16 countries. Even those countries that
would not achieve their targets, they would be able to achieve the target in a substantially shorter period in the
absence of IFF.
11
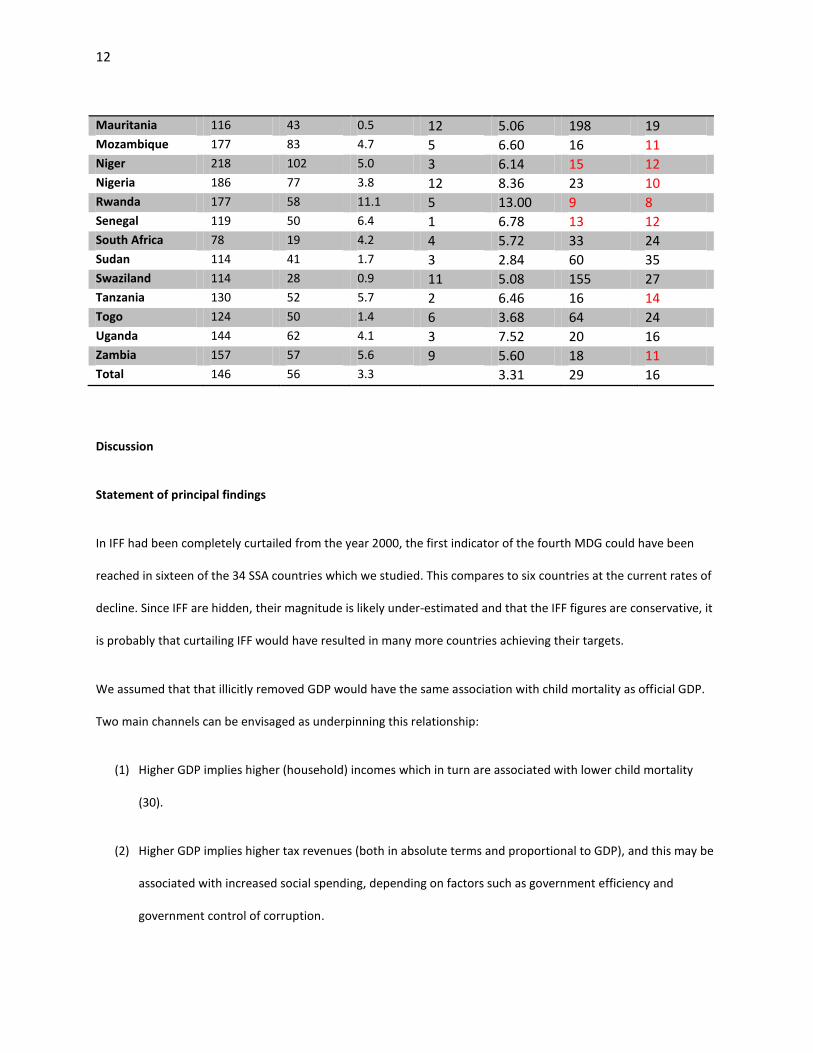
Table 2: The potential reduction in the number of years required to reach MDG 4
Country 2000
under-five
mortality
rates (per
1000)
MDG 4
target
(under-
five
mortality
rate)
Actual
annual
reduction
in under-
five
mortality
rates
(2000-
2011)
Illicit
financial
flows
(%of
GDP)
Overall
potential
annual
reduction
in U5M in
the
absence
of IFF
The
number of
years from
2000 to
reach
MDG at
current
rates of
decline
The
number of
years from
2000 to
reach
MDG if
‘IFF/GDP’
curtailed
Angola 200 87 2.0 7 4.66 41 17 Botswana 96 17 10.4 10 14.20 16 11 Burkina Faso 191 67 2.0 3 3.14 52 33 Burundi 164 63 1.5 6 3.78 63 25 Cameroon 148 50 0.8 6 3.08 135 35 Central African
Republic*
176 59 0.5 5 2.40 218 45 Chad 190 67 1.0 20 8.60 104 12 Congo, DR 181 66 0.7 3 1.84 144 54 Congo, Rep 104 35 0.9 25 10.40 120 10 Cote d'Ivoire 148 51 1.7 6 3.98 62 26 Ethiopia 141 70 5.3 6 7.58 13 9 Gabon 88 31 2.1 11 6.28 49 16 Gambia 128 55 2.6 14 7.92 32 10 Ghana 99 39 2.2 2 2.96 42 31 Guinea 175 76 2.8 9 6.22 29 13 Guinea Bissau 177 80 1.3 7 3.96 61 20 Kenya 111 35 4.0 1 4.38 28 26 Lesotho 127 34 2.8 15 8.50 46 15 Madagascar 102 56 4.8 6 7.08 12 8 Malawi 167 75 6.2 10 10.00 13 8 Mali 213 83 1.8 3 2.94 52 32
12
Mauritania 116 43 0.5 12 5.06 198 19 Mozambique 177 83 4.7 5 6.60 16 11 Niger 218 102 5.0 3 6.14 15 12 Nigeria 186 77 3.8 12 8.36 23 10 Rwanda 177 58 11.1 5 13.00 9 8 Senegal 119 50 6.4 1 6.78 13 12 South Africa 78 19 4.2 4 5.72 33 24 Sudan 114 41 1.7 3 2.84 60 35 Swaziland 114 28 0.9 11 5.08 155 27 Tanzania 130 52 5.7 2 6.46 16 14 Togo 124 50 1.4 6 3.68 64 24 Uganda 144 62 4.1 3 7.52 20 16 Zambia 157 57 5.6 9 5.60 18 11 Total 146 56 3.3 3.31 29 16
Discussion
Statement of principal findings
In IFF had been completely curtailed from the year 2000, the first indicator of the fourth MDG could have been
reached in sixteen of the 34 SSA countries which we studied. This compares to six countries at the current rates of
decline. Since IFF are hidden, their magnitude is likely under-estimated and that the IFF figures are conservative, it
is probably that curtailing IFF would have resulted in many more countries achieving their targets.
We assumed that that illicitly removed GDP would have the same association with child mortality as official GDP.
Two main channels can be envisaged as underpinning this relationship:
(1) Higher GDP implies higher (household) incomes which in turn are associated with lower child mortality
(30).
(2) Higher GDP implies higher tax revenues (both in absolute terms and proportional to GDP), and this may be
associated with increased social spending, depending on factors such as government efficiency and
government control of corruption.
13
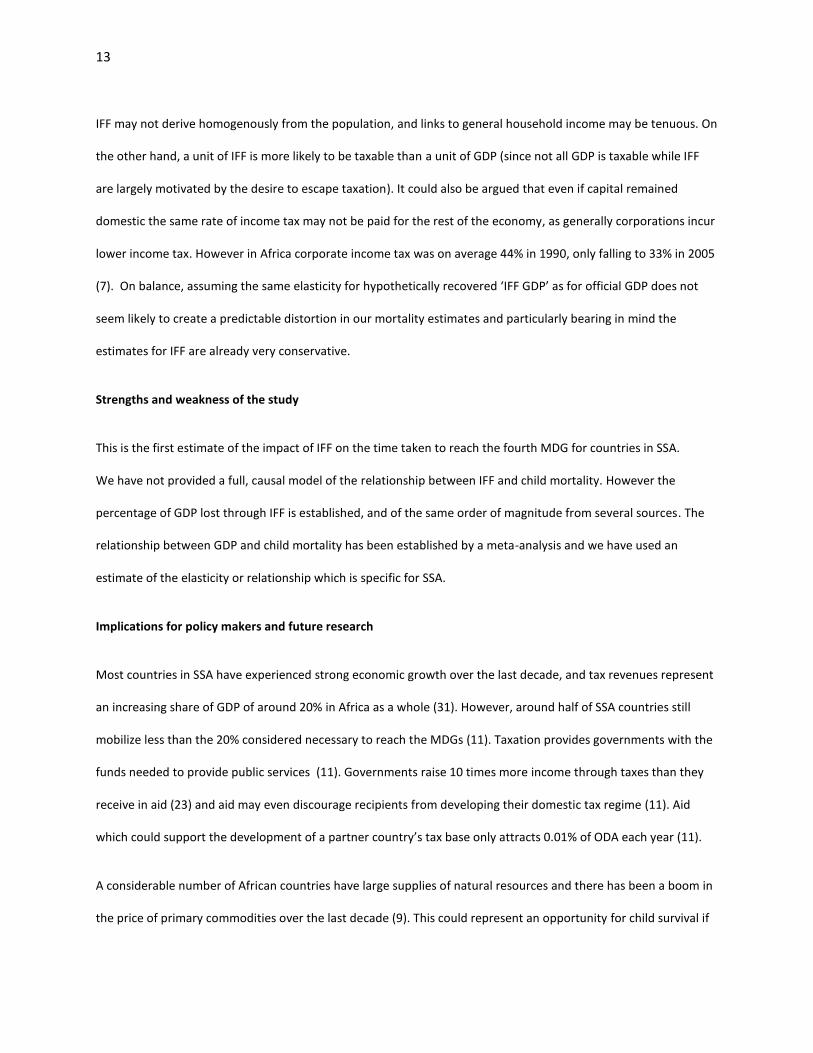
IFF may not derive homogenously from the population, and links to general household income may be tenuous. On
the other hand, a unit of IFF is more likely to be taxable than a unit of GDP (since not all GDP is taxable while IFF
are largely motivated by the desire to escape taxation). It could also be argued that even if capital remained
domestic the same rate of income tax may not be paid for the rest of the economy, as generally corporations incur
lower income tax. However in Africa corporate income tax was on average 44% in 1990, only falling to 33% in 2005
(7). On balance, assuming the same elasticity for hypothetically recovered ‘IFF GDP’ as for official GDP does not
seem likely to create a predictable distortion in our mortality estimates and particularly bearing in mind the
estimates for IFF are already very conservative.
Strengths and weakness of the study
This is the first estimate of the impact of IFF on the time taken to reach the fourth MDG for countries in SSA.
We have not provided a full, causal model of the relationship between IFF and child mortality. However the
percentage of GDP lost through IFF is established, and of the same order of magnitude from several sources. The
relationship between GDP and child mortality has been established by a meta-analysis and we have used an
estimate of the elasticity or relationship which is specific for SSA.
Implications for policy makers and future research
Most countries in SSA have experienced strong economic growth over the last decade, and tax revenues represent
an increasing share of GDP of around 20% in Africa as a whole (31). However, around half of SSA countries still
mobilize less than the 20% considered necessary to reach the MDGs (11). Taxation provides governments with the
funds needed to provide public services (11). Governments raise 10 times more income through taxes than they
receive in aid (23) and aid may even discourage recipients from developing their domestic tax regime (11). Aid
which could support the development of a partner country’s tax base only attracts 0.01% of ODA each year (11).
A considerable number of African countries have large supplies of natural resources and there has been a boom in
the price of primary commodities over the last decade (9). This could represent an opportunity for child survival if
14
these resources are carefully stewarded. However, countries which are oil exporters have a higher IFF as a
proportion of GDP than countries which do not export oil (12) and countries which trade commodities (particularly
through Switzerland) are exposed to illicit outflows through price distortions (32).
The UN high level panel on the post-2015 development framework has recommended a global target to ‘Reduce
illicit flows and tax evasion and increase stolen-asset recovery’ (33), which is a welcome recognition of the
importance of the issue for development. What is lacking so far is a specific target for reduction, and a plan of
action to achieve this. Both the G8 and G20 have relevant agenda in this area, and should prioritise the automatic
exchange of tax information between countries, including the identification of companies, trusts and bank
accounts owned by residents of other countries; and a requirement that multinational groups publish a combined
report on their global activities, including a country by country breakdown (34).
We hope this may galvanise policymakers to address the issue of illicit flows with greater urgency, including
through greater international financial transparency. Future research could usefully estimate the pathways
through which economic determinants of child mortality operate and more accurately model the impact of IFF on
child mortality.
Acknowledgements
The authors would like to thank David Woodward for his valuable comments on an earlier version of this
manuscript
Ethical approval – none required
Funding Mr John Dowling paid for research assistance but had no input into the study, analysis or results
Guarantor – BOH
Author’s contributions
Concept BOH
Analysis BOH and IM
15
First draft - all authors’
Final draft - all authors’
Conflict of Interest
The Authors declares that there is no conflict of interest.
1. Summers L, Pritchett L. Wealthier is Healthier: Working paper World Development Report. World. 1993.
2. Boyce JK, Ndikumana L. Capital Flight from Sub-Saharan African Countries : Updated Estimates , 1970 - 2010. Polit. Econ. Res. Inst. Inst. Res. Rep. 2012;(October).
3. unstats | Millennium Indicators [Internet]. Available from: http://mdgs.un.org/unsd/mdg/host.aspx?Content=indicators/officiallist.htm
4. Countdown 2015. Building a Future for Women and Children The 2012 Report [Internet]. 2012. Available from: http://www.countdown2015mnch.org/reports-and-articles/2012-report
5. Halleröd B, Rothstein B, Daoud A, Nandy S. Bad Governance and Poor Children: A Comparative Analysis of Government Efficiency and Severe Child Deprivation in 68 Low- and Middle-income Countries. World Dev. [Internet]. 2013 Aug [cited 2013 Aug 8];48:19–31. Available from: http://linkinghub.elsevier.com/retrieve/pii/S0305750X13000831
6. Data | The World Bank [Internet]. [cited 2013 May 10]. Available from: http://data.worldbank.org/
7. The World Bank. Draining Development. Reuter P, editor. 2012.
8. Ndikumana L, Boyce J. Public Debts and Private Assets : Explaining Capital Flight from Sub-Saharan African Countries. World Dev. 2003;31(1):107–30.
9. Africa Progress Panel. Equity in Extractives Africa Progress Report 2013. 2013.
10. Baker R. Capitalism’s Achilles Heel. Dirty Money and how to renew the free-market system [Internet]. John Wiley and Sons; 2005. p. 438. Available from: http://www.e-reading-lib.org/bookreader.php/135381/Capitalism`s_Achilles_heel.pdf
11. IMF, OECD, UN, The World Bank. Supporting the Development of More Effective Tax Systems A REPORT TO THE G-20 DEVELOPMENT WORKING GROUP BY THE IMF, OECD, UN and WORLD BANK.
12. Minter W, Scarnecchia T, Ndikumana L, Boyce JK, Weeks J, Asiedu E, et al. Africa ’ s Capital Losses : What Can Be Done ?". Concerned African Sch. 2012;Bulletin87.
13. Kar D, Cartwright.Smith D. Illicit financial flows from Africa: Hidden Resources for Development. Glob. Financ. Integr. Work. Pap. [Internet]. Available from: www.gfip.org
16
14. Cobham A. “Tax havens and illicit flows” in Draining Development: Controlling Flows of Illicit Funds from Developing Countries : World Bank. Washington: P. Reuter; 2012. p. 337–72.
15. Tax Justice Network. Financial secrecy index [Internet]. 2013. Available from: http://financialsecrecyindex.com/2011results.html
16. Amouzou A, Hill K. Child Mortality and Socioeconomic Status in Sub- Saharan Africa. Etude La Popul. Africaine. 2004;(1975).
17. Filmer D, Pritchett L. The impact of public spending on health: does money matter? Soc. Sci. Med. 1999;49(10):1309–23.
18. Epstein G. 1 . Capital Flight and Capital Controls in Developing Countries : an Introduction. Edward Elgar; 2005. p. 3–14.
19. Ajayi S. An Economic Analysis of Capital Flight from Nigeria. Policy Res. Work. Pap. [Internet]. 1992;WPS 993. Available from: http://www-wds.worldbank.org/external/default/WDSContentServer/IW3P/IB/1992/10/01/000009265_3961003110354/Rendered/PDF/multi0page.pdf
20. Cobham, Hogg, Melby, Kwatra, Wilson, Baird. Death and taxes : the true toll of tax dodging. 2008;(May).
21. Barder O, Clark J, Reynolds L, Roodman D. Europe beyond aid: Assessing European countries individual and collective committment to development. 2013;853:832–53.
22. Keightley MP. An Analysis of Where American Companies Report Profits : Indications of Profit Shifting: Report for Congress [Internet]. 2013. Available from: http://digitalcommons.ilr.cornell.edu/key_workplace/1006/
23. Actionaid. Collateral damage : How government plans to water down UK anti-tax haven rules could cost developing countries – and the UK – billions . 2012;(March):1–9.
24. Kar D, Freitas S. Illicit Financial Flows from Developing Countries Over the Decade Ending 2009 by Global Financial Integrity [Internet]. 2011. Available from: http://www.gfintegrity.org/
25. Global Financial Integrity [Internet]. Available from: http://www.gfintegrity.org/index.php?option=com_frontpage&Itemid=80
26. World Development Indicators | Data [Internet]. Available from: http://data.worldbank.org/data-catalog/world-development-indicators
27. O’Hare B, Makuta I, Chiwaula L, Bar-Zeev N. Income and child mortality in SSA; A systematic review and Meta analysis. J. R. Soc. Med. [Internet]. 2013;106(7). Available from: http://jrs.sagepub.com/content/early/2013/06/26/0141076813489680.full
28. Hague S, Gottschalk R, Martins P. Pro-poor growth: the evidence beyond income. IDS ESRC Dev. Econ. Conf. 2008.
29. Childinfo.org: [Internet]. Available from: http://www.childinfo.org/index.html
17
30. Van Malderen C, Van Oyen H, Speybroeck N. Contributing determinants of overall and wealth-related inequality in under-5 mortality in 13 African countries. J. Epidemiol. Community Heal. [Internet]. 2013 May 23 [cited 2013 May 24]; Available from: http://jech.bmj.com/cgi/doi/10.1136/jech-2012-202195
31. African Economic Outlook - Measuring the pulse of Africa [Internet]. [cited 2013 May 12]. Available from: http://www.africaneconomicoutlook.org/en/
32. Cobham A, Jansky P, Prats A. THE SWISS ROLE IN Christian Aid Occasional Paper Number 10. 2013;(10).
33. ECONOMIES THROUGH SUSTAINABLE DEVELOPMENT A NEW GLOBAL PARTNERSHIP : The Report of the High-Level Panel of Eminent Persons. Available from: http://www.un.org/sg/management/pdf/HLP_P2015_Report.pdf
34. Cobham A, Barder O. “ The Fermanagh Declaration on tax , trade and transparency .”2013;1–4. Available from: http://international.cgdev.org/sites/default/files/FermanaghDeclaration.pdf