Embed Size (px)
Citation preview

Photo Credit Goes Here
Photo credit: 2006 Freweni Gebre Mariam/IFPRI
Claudia Ringler, October 13th, 2015, USAID
Tapping Irrigation’s Potential for Women’s
Empowerment: Findings from Ethiopia and Tanzania

U.S. GOVERNMENT PARTNERS
PRESENTATION
• Introduction to the project
• Background of the WEAI
• Findings from Ethiopia
• Findings from Tanzania
• Conclusions and next steps
ABOUT THE PROJECT• The Feed the Future Innovation Lab for Small-
Scale Irrigation, a project of the U.S.
Government’s Feed the Future Initiative, is a five-
year project in Ethiopia, Ghana and Tanzania
aimed at benefiting the region’s farmers by
improving effective use of scarce water supplies
through interventions in small-scale irrigation
• Activities include field interventions with water
management technologies, capacity building,
research on irrigation-nutrition-gender linkages,
and provision of data and analysis of empirical
models of irrigation impacts (IDSS)
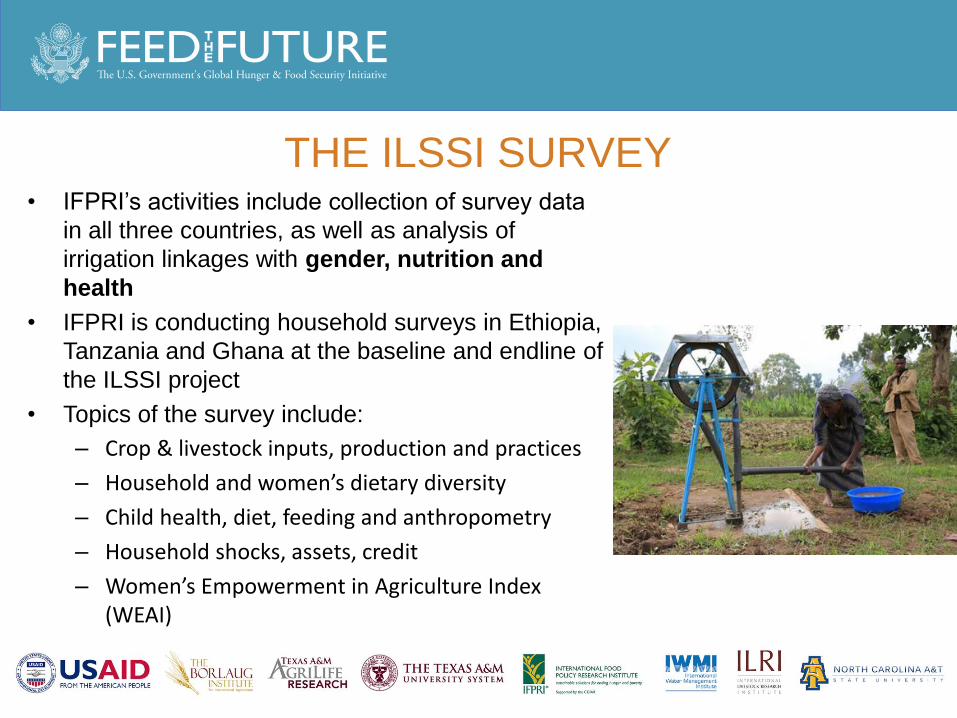
THE ILSSI SURVEY• IFPRI’s activities include collection of survey data
in all three countries, as well as analysis of
irrigation linkages with gender, nutrition and
health
• IFPRI is conducting household surveys in Ethiopia,
Tanzania and Ghana at the baseline and endline of
the ILSSI project
• Topics of the survey include:
– Crop & livestock inputs, production and practices
– Household and women’s dietary diversity
– Child health, diet, feeding and anthropometry
– Household shocks, assets, credit
– Women’s Empowerment in Agriculture Index (WEAI)
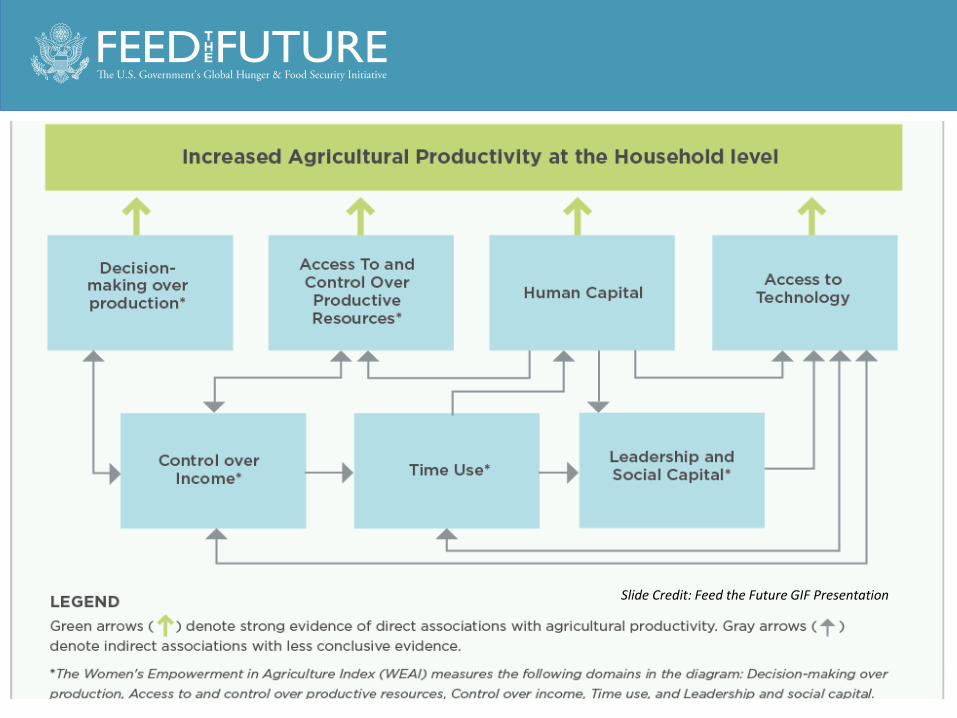
Slide Credit: Feed the Future GIF Presentation
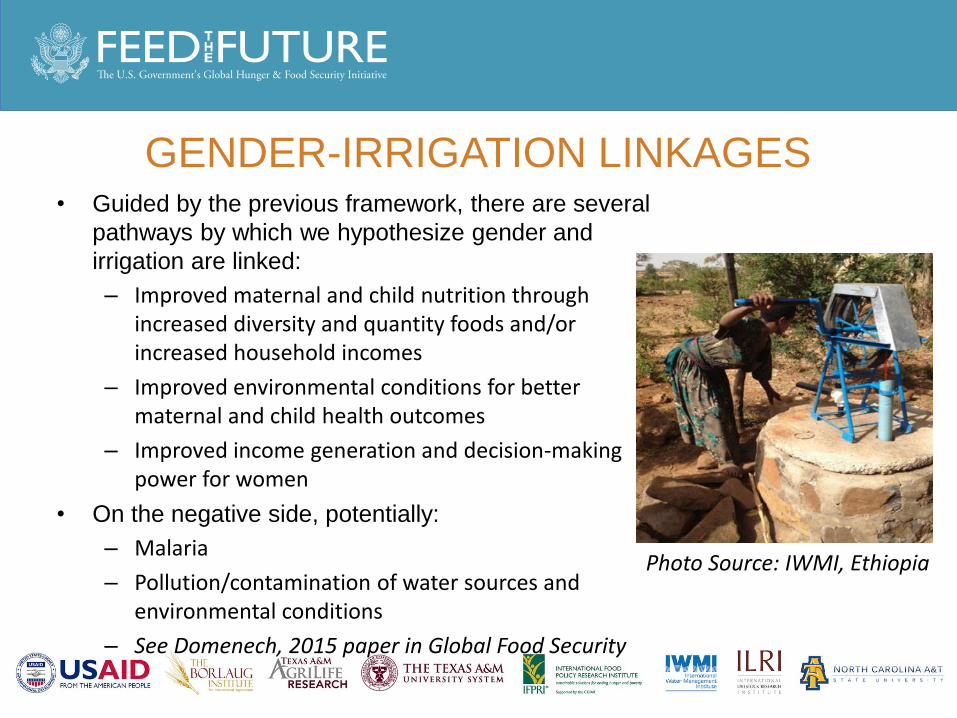
GENDER-IRRIGATION LINKAGES• Guided by the previous framework, there are several
pathways by which we hypothesize gender and
irrigation are linked:
– Improved maternal and child nutrition through increased diversity and quantity foods and/or increased household incomes
– Improved environmental conditions for better maternal and child health outcomes
– Improved income generation and decision-making power for women
• On the negative side, potentially:
– Malaria
– Pollution/contamination of water sources and environmental conditions
– See Domenech, 2015 paper in Global Food Security
Photo Source: IWMI, Ethiopia
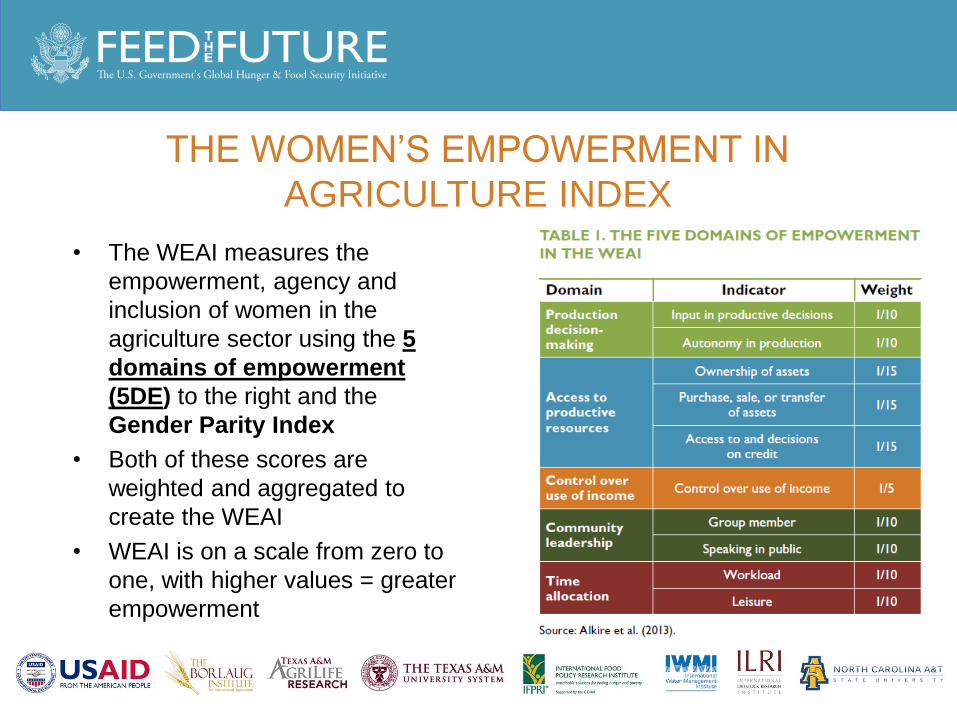
THE WOMEN’S EMPOWERMENT IN
AGRICULTURE INDEX
• The WEAI measures the
empowerment, agency and
inclusion of women in the
agriculture sector using the 5
domains of empowerment
(5DE) to the right and the
Gender Parity Index
• Both of these scores are
weighted and aggregated to
create the WEAI
• WEAI is on a scale from zero to
one, with higher values = greater
empowerment
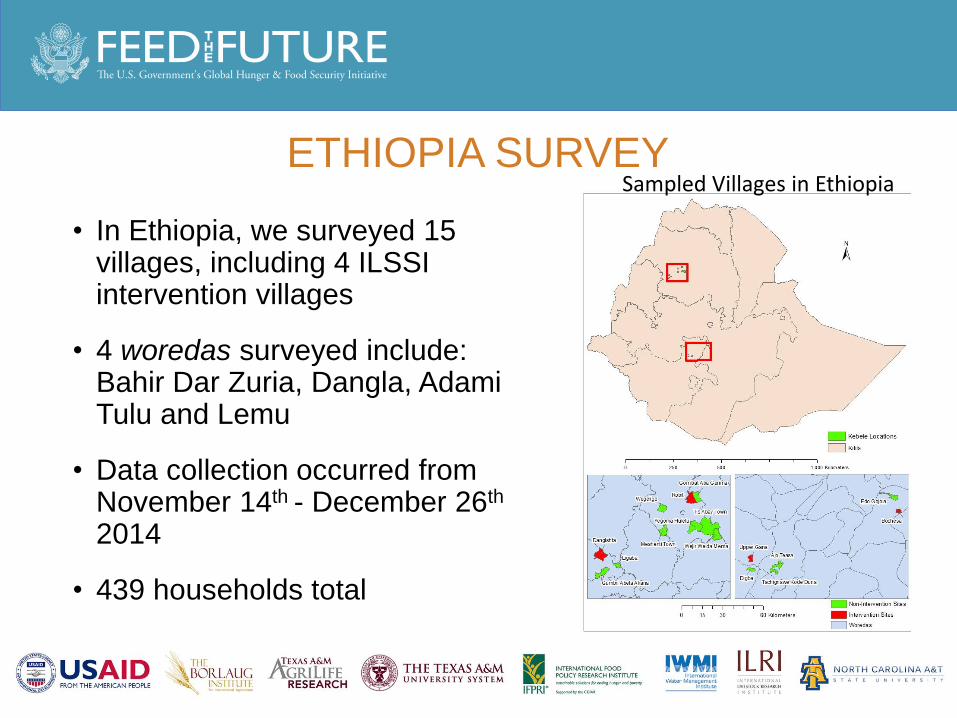
ETHIOPIA SURVEY
• In Ethiopia, we surveyed 15 villages, including 4 ILSSI intervention villages
• 4 woredas surveyed include: Bahir Dar Zuria, Dangla, AdamiTulu and Lemu
• Data collection occurred from November 14th - December 26th
2014
• 439 households total
Sampled Villages in Ethiopia
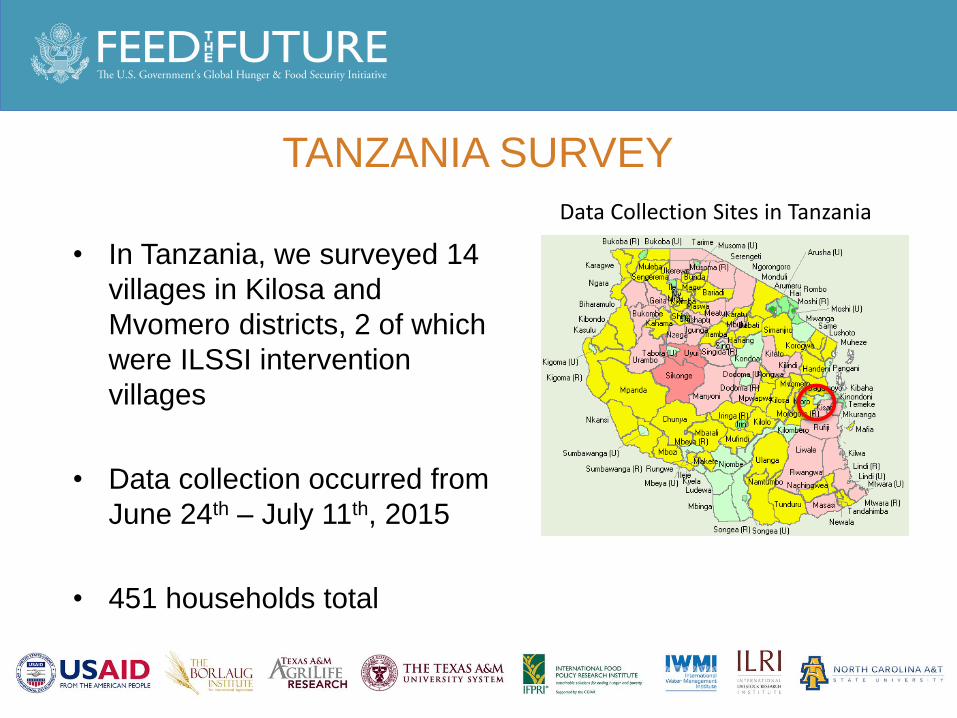
TANZANIA SURVEY
• In Tanzania, we surveyed 14
villages in Kilosa and
Mvomero districts, 2 of which
were ILSSI intervention
villages
• Data collection occurred from
June 24th – July 11th, 2015
• 451 households total
Data Collection Sites in Tanzania
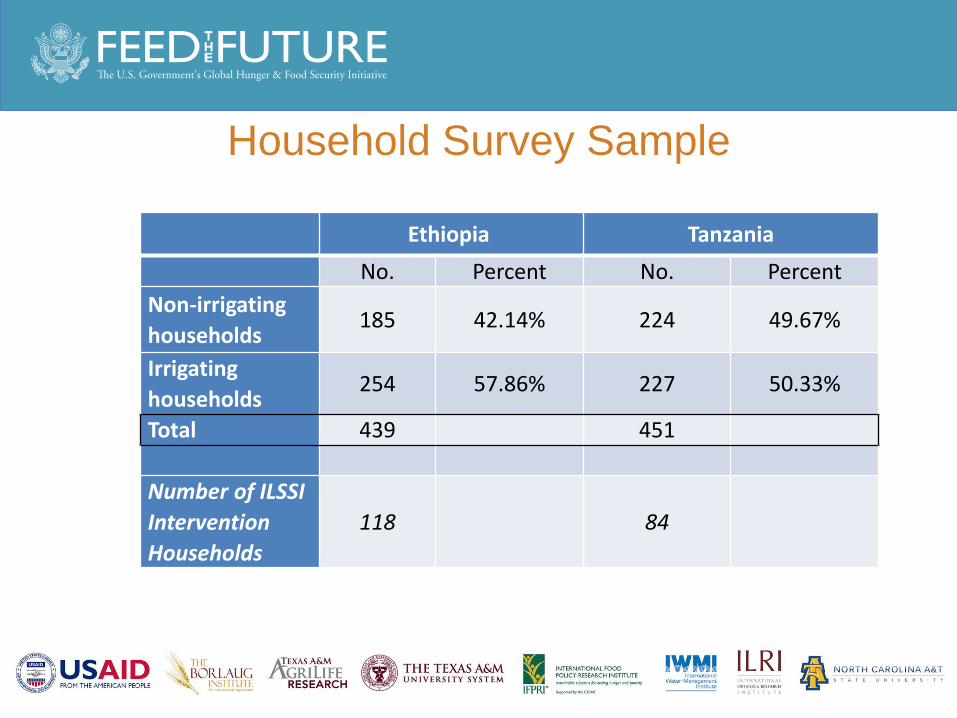
Household Survey Sample
Ethiopia Tanzania
No. Percent No. Percent
Non-irrigating
households185 42.14% 224 49.67%
Irrigating
households254 57.86% 227 50.33%
Total 439 451
Number of ILSSI
Intervention
Households
118 84
WEAI MODIFICATIONS
• Technically, we use a “Modified WEAI” for the ILSSI project in order
to better capture linkages between irrigation and gender
• Modifications to the original WEAI include:
– Role in decisionmaking: on irrigated food crop and cash crop farming
– Autonomy in decisionmaking: types of crops to grow for irrigated vs. non-irrigated
– Productive capital: also includes irrigation tank/pond and irrigation equipment
– Access to information/extension: on irrigation methods
– Time allocation: time spent irrigating/working with equipment
– Added response options on irrigation topics for various questions on credit, savings, group membership
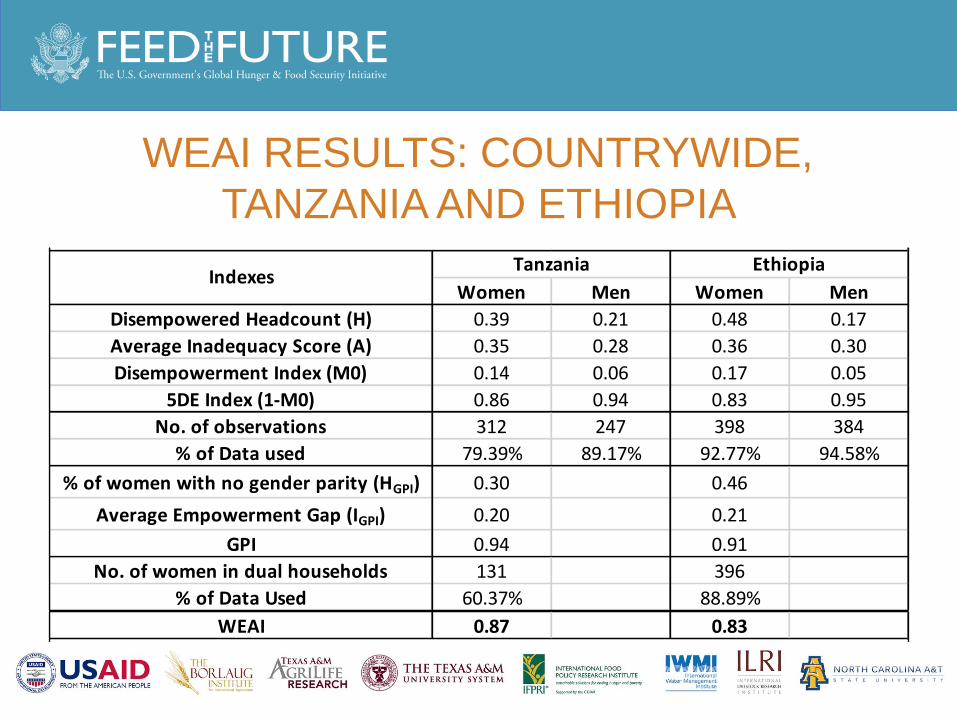
WEAI RESULTS: COUNTRYWIDE,
TANZANIA AND ETHIOPIA
Women Men Women Men
Disempowered Headcount (H) 0.39 0.21 0.48 0.17
Average Inadequacy Score (A) 0.35 0.28 0.36 0.30
Disempowerment Index (M0) 0.14 0.06 0.17 0.05
5DE Index (1-M0) 0.86 0.94 0.83 0.95
No. of observations 312 247 398 384
% of Data used 79.39% 89.17% 92.77% 94.58%
% of women with no gender parity (HGPI) 0.30 0.46
Average Empowerment Gap (IGPI) 0.20 0.21
GPI 0.94 0.91
No. of women in dual households 131 396
% of Data Used 60.37% 88.89%
WEAI 0.87 0.83
IndexesTanzania Ethiopia
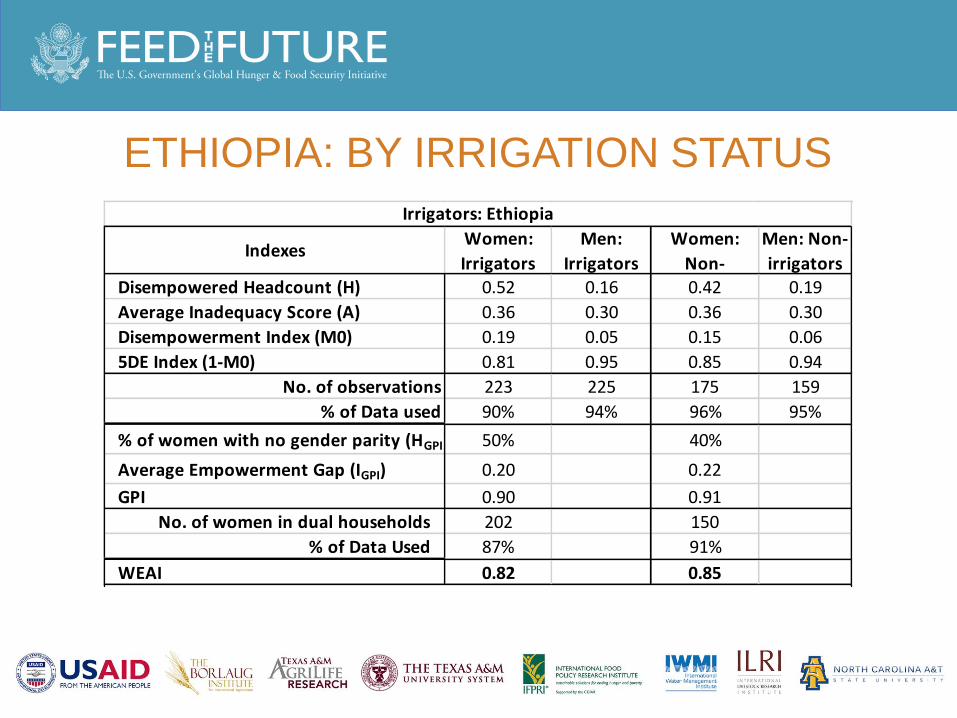
ETHIOPIA: BY IRRIGATION STATUS
Disempowered Headcount (H) 0.52 0.16 0.42 0.19
Average Inadequacy Score (A) 0.36 0.30 0.36 0.30
Disempowerment Index (M0) 0.19 0.05 0.15 0.06
5DE Index (1-M0) 0.81 0.95 0.85 0.94
No. of observations 223 225 175 159
% of Data used 90% 94% 96% 95%
% of women with no gender parity (HGPI) 50% 40%
Average Empowerment Gap (IGPI) 0.20 0.22
GPI 0.90 0.91
No. of women in dual households 202 150
% of Data Used 87% 91%
WEAI 0.82 0.85
Irrigators: Ethiopia
Women:
Irrigators
Men:
Irrigators
Women:
Non-
Men: Non-
irrigatorsIndexes

TANZANIA: BY IRRIGATION STATUS
Disempowered Headcount (H) 0.37 0.21 0.40 0.21
Average Inadequacy Score (A) 0.34 0.28 0.37 0.28
Disempowerment Index (M0) 0.12 0.06 0.15 0.06
5DE Index (1-M0) 0.88 0.94 0.85 0.94
No. of observations 153 140 159 107
% of Data used 77% 90% 82% 88%
% of women with no gender parity (HGPI) 25% 36%
Average Empowerment Gap (IGPI) 0.18 0.22
GPI 0.96 0.92
No. of women in dual households 73 58
% of Data Used 59% 62%
WEAI 0.88 0.86
Irrigators: Tanzania
Women:
Irrigators
Men:
Irrigators
Women:
Non-
Men: Non-
irrigatorsIndexes
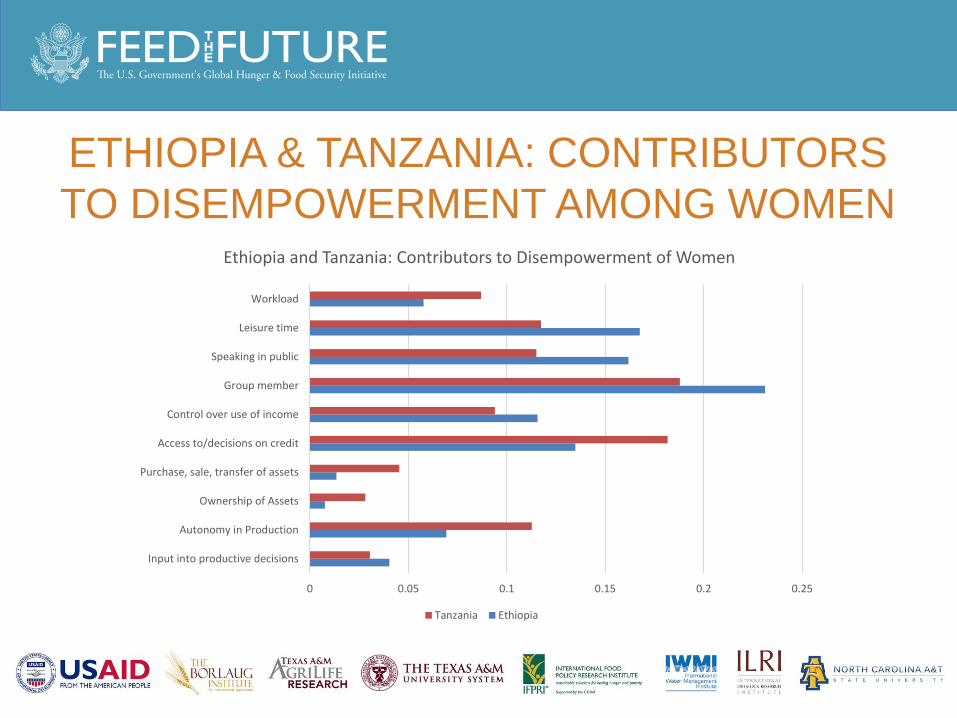
ETHIOPIA & TANZANIA: CONTRIBUTORS
TO DISEMPOWERMENT AMONG WOMEN
0 0.05 0.1 0.15 0.2 0.25
Input into productive decisions
Autonomy in Production
Ownership of Assets
Purchase, sale, transfer of assets
Access to/decisions on credit
Control over use of income
Group member
Speaking in public
Leisure time
Workload
Ethiopia and Tanzania: Contributors to Disempowerment of Women
Tanzania Ethiopia
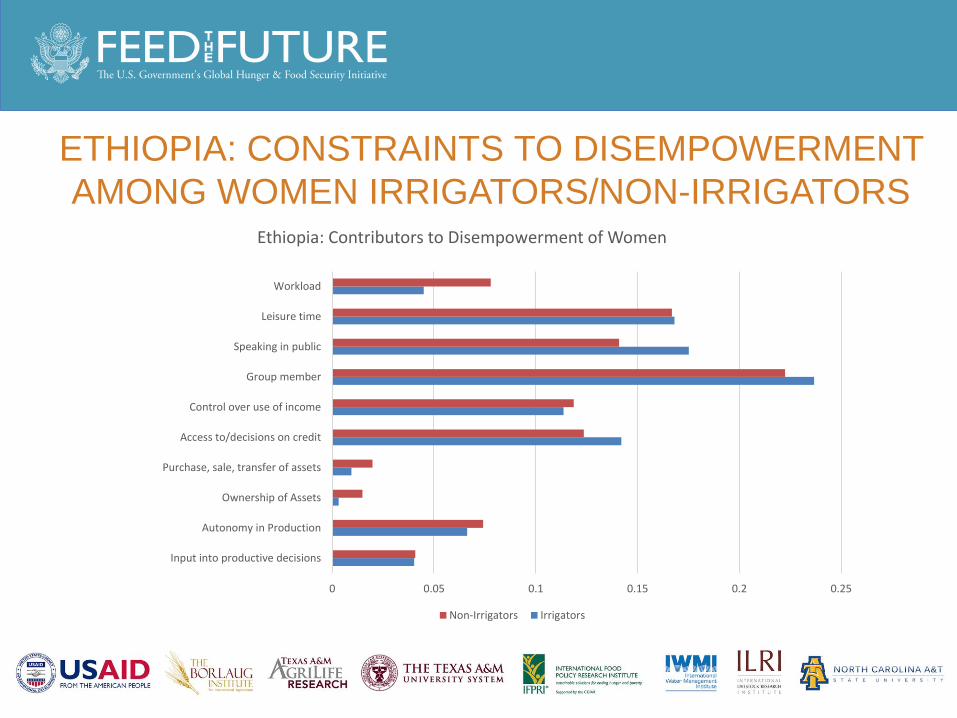
ETHIOPIA: CONSTRAINTS TO DISEMPOWERMENT
AMONG WOMEN IRRIGATORS/NON-IRRIGATORS
0 0.05 0.1 0.15 0.2 0.25
Input into productive decisions
Autonomy in Production
Ownership of Assets
Purchase, sale, transfer of assets
Access to/decisions on credit
Control over use of income
Group member
Speaking in public
Leisure time
Workload
Ethiopia: Contributors to Disempowerment of Women
Non-Irrigators Irrigators
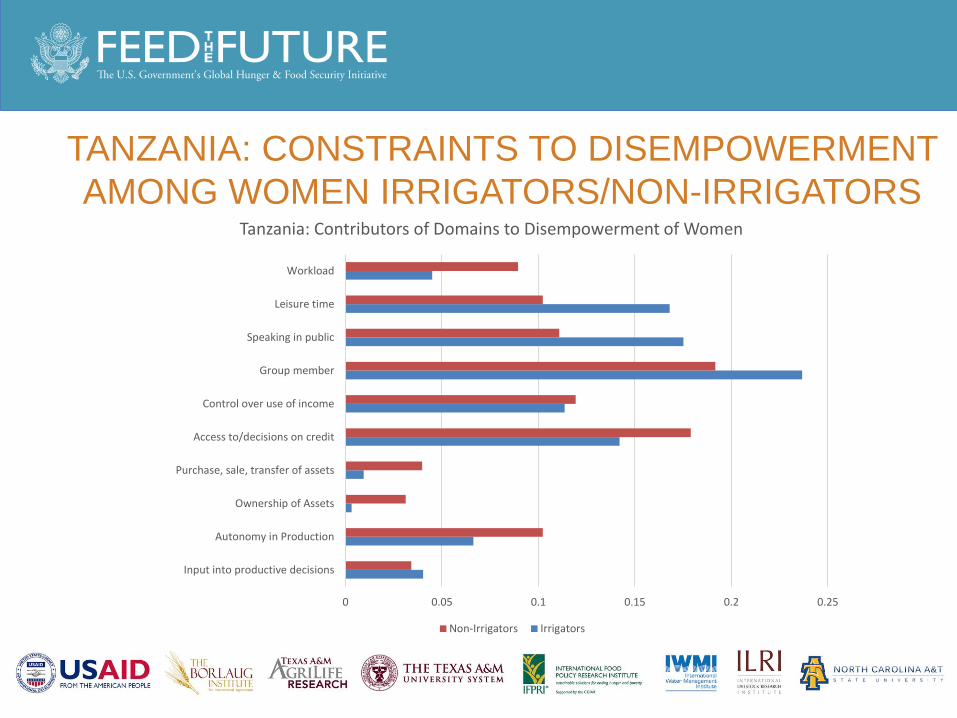
TANZANIA: CONSTRAINTS TO DISEMPOWERMENT
AMONG WOMEN IRRIGATORS/NON-IRRIGATORS
0 0.05 0.1 0.15 0.2 0.25
Input into productive decisions
Autonomy in Production
Ownership of Assets
Purchase, sale, transfer of assets
Access to/decisions on credit
Control over use of income
Group member
Speaking in public
Leisure time
Workload
Tanzania: Contributors of Domains to Disempowerment of Women
Non-Irrigators Irrigators
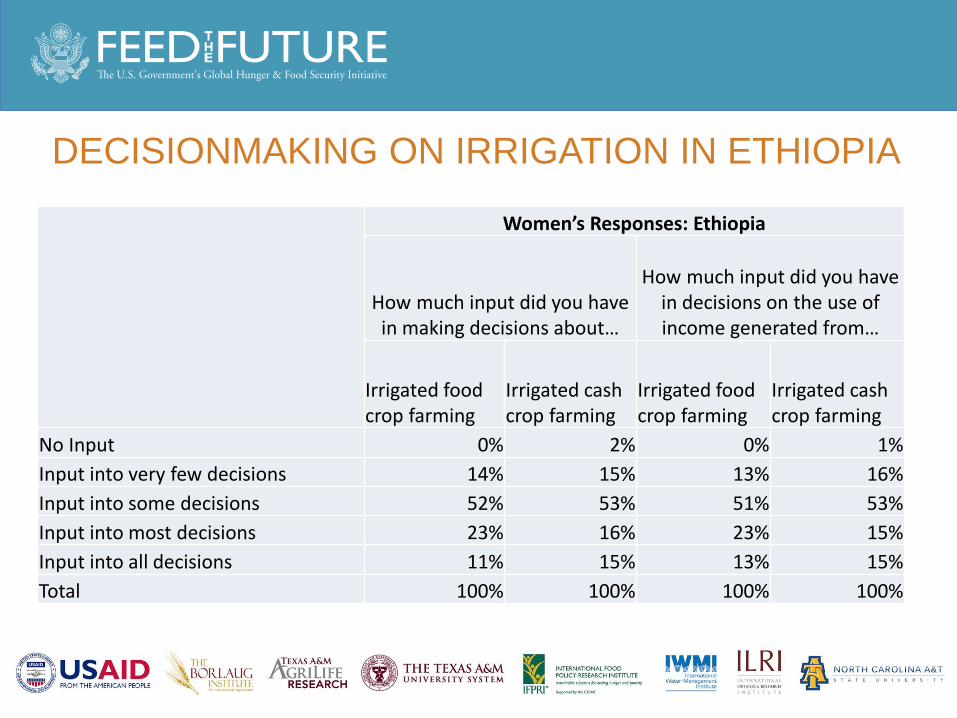
DECISIONMAKING ON IRRIGATION IN ETHIOPIA
Women’s Responses: Ethiopia
How much input did you have in making decisions about…
How much input did you have in decisions on the use of income generated from…
Irrigated food crop farming
Irrigated cash crop farming
Irrigated food crop farming
Irrigated cash crop farming
No Input 0% 2% 0% 1%
Input into very few decisions 14% 15% 13% 16%
Input into some decisions 52% 53% 51% 53%
Input into most decisions 23% 16% 23% 15%
Input into all decisions 11% 15% 13% 15%
Total 100% 100% 100% 100%
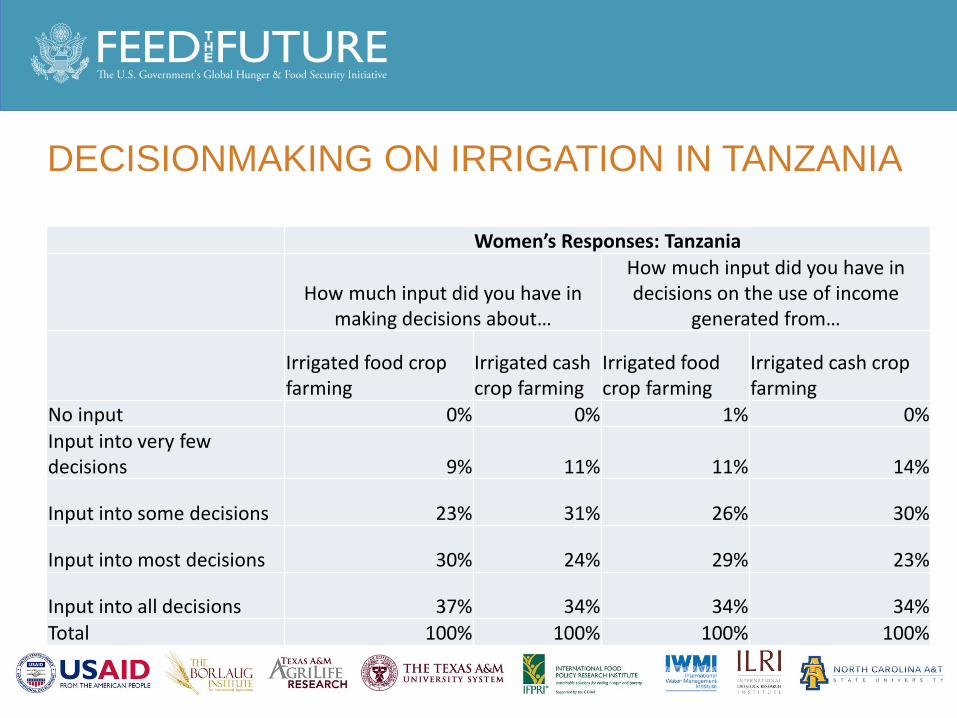
DECISIONMAKING ON IRRIGATION IN TANZANIA
Women’s Responses: Tanzania
How much input did you have in making decisions about…
How much input did you have in decisions on the use of income
generated from…
Irrigated food crop farming
Irrigated cash crop farming
Irrigated food crop farming
Irrigated cash crop farming
No input 0% 0% 1% 0%
Input into very few decisions 9% 11% 11% 14%
Input into some decisions 23% 31% 26% 30%
Input into most decisions 30% 24% 29% 23%
Input into all decisions 37% 34% 34% 34%
Total 100% 100% 100% 100%
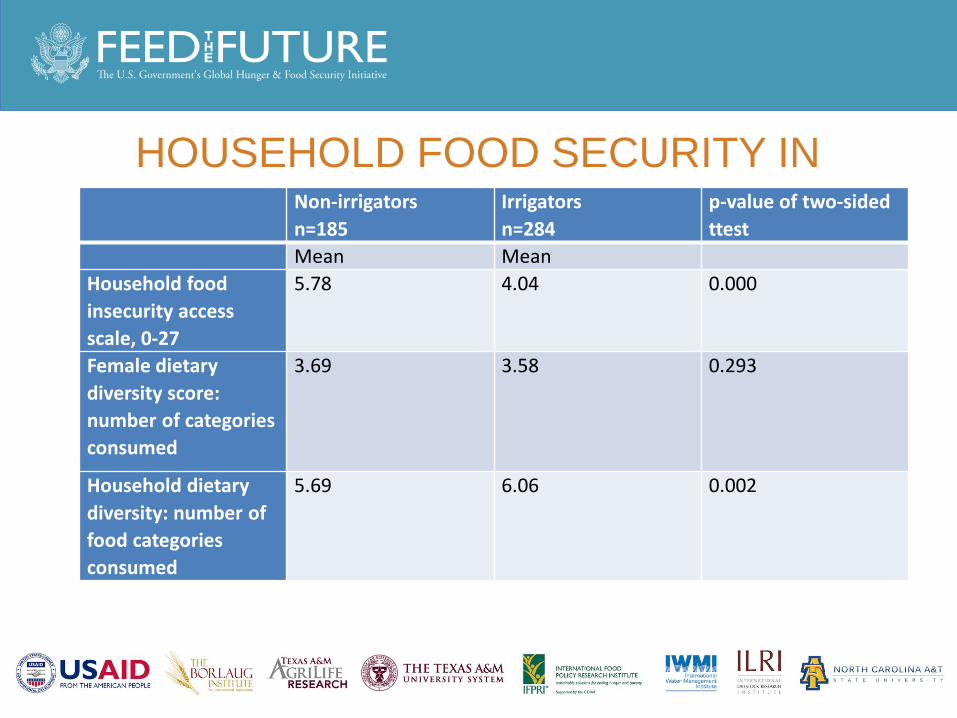
HOUSEHOLD FOOD SECURITY IN
ETHIOPIANon-irrigators
n=185
Irrigators
n=284
p-value of two-sided
ttest
Mean Mean
Household food
insecurity access
scale, 0-27
5.78 4.04 0.000
Female dietary
diversity score:
number of categories
consumed
3.69 3.58 0.293
Household dietary
diversity: number of
food categories
consumed
5.69 6.06 0.002

HOUSEHOLD FOOD SECURITY IN TANZANIA
Non-irrigators
n=224
Irrigators
n=227
p-value of two-
sided ttest
Mean Mean
Household food
insecurity access
scale, 0-27
3.92 2.58 0.0004
Female dietary
diversity score:
number of
categories
consumed
3.71 4.20 0.0010
Household dietary
diversity: number
of food categories
consumed
4.88 5.63 0.0002
CONCLUSIONS AND NEXT STEPS
• The ILSSI study has provided a baseline we can use to observe change
across groups and over time
• Irrigation and gender may indeed be linked: however, whether this
relationship is beneficial or not remains inconclusive
• The relationship between irrigation and gender likely depends on a
multitude of factors, such as crop type, household structure, local extension
system biases, and existing intra-household decisionmaking structures that
are difficult to tease out with our sample size
NEXT STEPS• We will use individual empowerment scores to observe the relationship
between irrigation and empowerment
• We will conduct crop level analysis, to see whether empowerment has a
relationship with crop choice (fruits, vegetables, cash crops, cereals etc.)
• We will examine plot-level decision making by women, to see the extent to
which women play a role in decisions regarding irrigation
• We are currently preparing a paper on the relationship between irrigation and
maternal and child nutrition
• We plan to investigate these linkages further in our future research through
regression analysis using individual WEAI scores, and welcome your feedback
and suggestions for research directions

THANK YOU!