Embed Size (px)
Citation preview

Route 236 Corridor Study
Kittery - Eliot – S. Berwick
Prepared By
Maine Department of Transportation Bureau of Transportation Systems Planning
October 2008

Route 236 Corridor Study
Kittery - Eliot – S. Berwick
Prepared By
Maine Department of Transportation Bureau of Transportation Systems Planning Edward W. Hanscom, P.E., Study Manager
Dennis E. Emidy, P.E., Transportation Engineer
July 2008

Content i
Contents
I. Introduction ......................................................................... I-1 II. Existing Conditions............................................................ II-1 A. Traffic Volumes ........................................................................ II-1 1. Daily Traffic Flows.............................................................................. II-1 2. Hourly Traffic Variation ...................................................................... II-3 3. Intersection Turning Movement Volumes ........................................... II-4 4. Traffic Composition............................................................................. II-4 5. Historical Traffic Growth .................................................................... II-5 B. Existing Condition Inventory.................................................... II-7 1. Roadway Geometrics ........................................................................... II-7 2. Pavement Conditions ........................................................................... II-9 3. Roadway System................................................................................ II-11 4. Safety ................................................................................................. II-11 C. Mobility and Operating Conditions ........................................ II-18 1. Corridor Travel Speeds ...................................................................... II-18
2. Hourly Speed Variation ..................................................................... II-25 3. Hourly Headway Variation ................................................................ II-27 4. Level of Service ................................................................................. II-29
a. Roadway ...................................................................................... II-29 b. Unsignalized Intersection............................................................. II-33 c. Signalized Intersection................................................................. II-37 III. Future Conditions .............................................................III-1 A. Mobility and Operating Conditions ......................................... III-3 1. Roadway ............................................................................................. III-3 2. Unsignalized Intersections .................................................................. III-6 3. Signalized Intersections ...................................................................... III-6 B. Future Uncertainty ................................................................. III-11 IV. Alternatives ...................................................................... IV-1 A. Kittery-Eliot-South Berwick....................................................IV-1 1. Intersections (Alternatives)................................................................. IV-1 a. Martin/Stevenson Road-Kittery .................................................... IV-1 b. Bolt Hill Road-Eliot...................................................................... IV-3 c. Depot Road-Eliot .......................................................................... IV-5 d. Route 101-Eliot............................................................................. IV-7 e. Route 91-South Berwick............................................................. IV-10 2. Roadway Segments Network (Long-Term Alternatives) ................. IV-14 a. Transportation Demand Management Alternative...................... IV-16 b. 4-Lane Alternatives (with Signals) ............................................. IV-17 c. 4-Lane Alternatives (with Roundabouts).................................... IV-17 B. South Berwick Village (Downtown) .....................................IV-17

Content ii
1. Intersections (Alternatives)............................................................... IV-17 a. Portland Street-South Berwick ................................................... IV-17 b. Route 236/Main St-South Berwick............................................. IV-19 2. Roadway Segments Network (Long-Term Alternatives) ................. IV-22 a. Downtown Option (TSM)........................................................... IV-23 b. Transportation Demand Management Option ............................ IV-24 c. Northern Bypass Option ............................................................. IV-24 d. Southern Bypass Option ............................................................. IV-25 C. Access Management ..............................................................IV-27 1. Access Management (definition) ...................................................... IV-27 2. Service Roads.................................................................................... IV-27 3. Nontraversable (Raised) Medians..................................................... IV-27 4. Signal Spacing .................................................................................. IV-28 5. Driveways ......................................................................................... IV-29 V. Recommendations ..............................................................V-1 A. Improvements Completed......................................................... V-1 1. Route 91 Intersection ........................................................................... V-1 B. Near-Term Recommendations.................................................. V-3 1. Martin/Stevenson Rd. Signal Modification - Kittery........................... V-4 2. Depot Road - Eliot ............................................................................... V-4 3. South Berwick Village Feasibility Study............................................. V-6 4. Eliot Route 236 Master Plan ................................................................ V-6 5. Transportation Demand Management Plan ......................................... V-7 6. Route 91 Intersection – South Berwick ............................................... V-8 7. Route 101 Intersection - Eliot .............................................................. V-9 8. Martin Road/Stevenson Road – Kittery............................................. V-10 9. Bolt Hill Road - Eliot......................................................................... V-12 C. Long-Term Recommendations ............................................... V-13 1. Dana Road to Route 101 Intersection - Eliot ..................................... V-13 Appendix I - Speed and Headway Summary ............................................ A-1 Appendix II - Peak Intersection Turning Movements................................ A-6 Appendix III- Roadway Inventory............................................................ A-24 Appendix IV - Crash Summary and HCL Diagrams ............................... A-25 Appendix V - Speed Summary from Speed Delay Study ........................ A-45

Content iii
List of Figures
Figure I-1 Route 236 Corridor Study Area .....................................................................I-2 Figure II-1 2006 Annual Average Daily Traffic............................................................ II-2 Figure II-2 Hourly Traffic Variation.............................................................................. II-3 Figure II-3 Pavement Condition Rating………………………………………………II-10 Figure II-4 Northbound Travel Time........................................................................... II-18 Figure II-5 Southbound Travel Time........................................................................... II-19 Figure II-6 Kittery-Eliot Average Travel Speed.......................................................... II-21 Figure II-7 Eliot Average Travel Speed....................................................................... II-22 Figure II-8 Eliot-South Berwick Average Travel Speed ............................................. II-23 Figure II-9 South Berwick Average Travel Speed ...................................................... II-24 Figure II-10 Hourly Speed Variation........................................................................... II-26 Figure II-11 Hourly Headway Variation SB north of Bolt Hill Road ......................... II-28 Figure II-12 Hourly Headway Variation NB north of Bolt Hill Road......................... II-28 Figure II-13 LOS Rural Roadway Segments-Existing Hourly Conditions ................. II-33 Figure II-14 2006 Overall Delay at Intersections & Level of Service......................... II-40 Figure III-1 2026 Annual Average Daily Traffic ......................................................... III-2 Figure III-2 2026 LOS: Rural Two-Lane Segments at 5-Year Intervals ...................... III-5 Figure III-3 2006 Overall Delay at Intersections & Level of Service ........................ III-10 Figure IV-1 Martin/Stevenson Rd 4-Lanes................................................................... IV-2 Figure IV-2 Martin/Stevenson Rd Roundabout............................................................ IV-3 Figure IV-3 Bolt Hill Left-Turn Lanes ......................................................................... IV-4 Figure IV-4 Depot Road ............................................................................................... IV-6 Figure IV-5 Route 101 .................................................................................................. IV-9 Figure IV-6 Route 91 .................................................................................................. IV-10 Figure IV-7 Route 91 Alternative 2 ............................................................................ IV-11 Figure IV-8 Route 91 Alternative 3 ............................................................................ IV-12 Figure IV-9 Route 91 Alternative 4 ............................................................................ IV-13 Figure IV-10 Route 91 Alternative 5 .......................................................................... IV-14 Figure IV-11 Portland St SB Left-Turn Lane Alternative ......................................... IV-19 Figure IV-12 Route 236/4 Roundabout Alternative .................................................. IV-21 Figure IV-13 Route 236/4 Signalized Free Right Alternative ................................... IV-22 Figure IV-14 Downtown Option................................................................................. IV-24 Figure IV-15 Northern Bypass Option ....................................................................... IV-25 Figure IV-16 Southern Bypass Option ....................................................................... IV-26 Figure V-1 Route 91 Restriping..................................................................................... V-2 Figure V-2 Depot Road Intersection Improvement ....................................................... V-5 Figure V-3 Route 91 Intersection Improvement............................................................ V-8 Figure V-4 Route 101 Intersection Improvement .......................................................... V-9 Figure V-5 Martin Road/Stevenson Road Intersection Improvement ......................... V-11 Figure V-6 Bolt Hill Road Intersection Improvement................................................. V-12

Content iv
List of Tables Table II-1 Traffic Composition and Directional Distribution........................................ II-5 Table II-2 Historical Traffic Trends .............................................................................. II-6 Table II-3 Historical Roadway Construction Projects ................................................... II-8 Table II-4 High Crash Locations ………………………… ………………………… II-11 Table II-5 Fatal Crash Comparison.............................................................................. II-13 Table II-6 Crash Rate Comparison .............................................................................. II-14 Table II-7 Crash Type Comparison ............................................................................. II-15 Table II-8 Contributing Crash Factor Comparison...................................................... II-17 Table II-9 Maximum Observed Delay at Intersections................................................ II-20 Table II-10 LOS Criteria for Urban Streets Class I & Class III .................................. II-29 Table II-11 LOS Criteria for Two-Lane Highways Class I ......................................... II-30 Table II-12 LOS: Roadway Segments - Existing Conditions (2006) ......................... II-32 Table II-13 LOS Criteria for Unsignalized Intersections ............................................ II-33 Table II-14 LOS: Unsignalized Intersections – AM Existing Conditions (2006) ...... II-35 Table II-15 LOS: Unsignalized Intersections – PM Existing Conditions (2006)....... II-36 Table II-16 Traffic Signal Warrant Analysis for Average Day ................................... II-37 Table II-17 LOS Criteria for Signalized Intersections................................................. II-37 Table II-18 LOS: Signalized Intersections – AM Existing Conditions (2006) .......... II-39 Table II-19 LOS: Signalized Intersections – PM Existing Conditions (2006) ........... II-39 Table III-1 LOS: Roadway Segments - Existing Conditions (2026)........................... III-4 Table III-2 LOS: Unsignalized Intersections – PM Existing Conditions (2026)......... III-7 Table III-3 LOS: Unsignalized Intersections – AM Existing Conditions (2026)........ III-8 Table III-4 LOS: Signalized Intersections – AM Existing Conditions (2026) ............ III-9 Table III-5 LOS: Signalized Intersections – PM Existing Conditions (2026)............. III-9 Table IV-1 Martin/Stevenson Road Alternatives ......................................................... IV-2 Table IV-2 Bolt Hill Road Alternatives........................................................................ IV-4 Table IV-3 Depot Road Existing Alternatives.............................................................. IV-6 Table IV-4 Depot Road Future Alternatives................................................................. IV-7 Table IV-5 Route 101 Existing Alternatives ................................................................ IV-8 Table IV-6 Route 101 Future Alternatives ................................................................... IV-9 Table IV-7 Route 91 Future Alternatives ................................................................... IV-11 Table IV-8 Dana Rd. to Depot Rd. Roadway Alternatives......................................... IV-15 Table IV-9 Portland Street Alternatives ..................................................................... IV-18 Table IV-10 Route 236/4 Alternatives........................................................................ IV-20 Table IV-11 South Berwick Village Roadway Alternatives....................................... IV-23 Table V-1 Near-Term Recommendations Summary ..................................................... V-3

Introduction I-1
I Introduction The Route 236 Corridor Study focuses on a 10.8-mile corridor of Route 236 between Kittery and South Berwick. As shown in Figure I-1, this corridor extends from north of the Kittery rotary on Route 1, through Eliot, to the junction of Route 236 with Portland Street (Route 4) in South Berwick. The primary objectives of this Planning Study are:
• To evaluate existing (base) traffic and roadway conditions along the Route 236 Corridor. • To identify existing deficiencies relative to mobility safety, physical conditions and
roadway geometrics. • To estimate travel demand conditions for the year 2026 based on historical traffic growth
trends. • To identify potential future roadway deficiencies. • To make recommendations for roadway improvements that reduce congestion and
increase safety on Route 236 in the study area. A Route 236 Corridor Committee was formed from members of the three communities, Southern Maine Regional Planning Commission (SMRPC) and Maine Department of Transportation (MaineDOT). The Corridor Committee’s main focus was to solicit input from the communities and to keep them informed about the Corridor Study and its recommendations. Members of the Corridor Committee during the study period included the following stakeholders:
• Town of Kittery • Town of Eliot • Town of South Berwick • Town of Berwick • York County Community Action Corporation (YCCAC) • Cooperative Alliance for Seacoast Transportation (COAST) • Maine Turnpike Authority • Maine Department of Transportation • Greater York Region Chamber of Commerce • Portsmouth Naval Shipyard • Maine School Administration District 35 • Strafford NH Regional Planning Commission • Eastern Trail Management District • Rockingham NH Planning Commission • KEYS Coalition (Kittery, Eliot, York, South Berwick) • Interested citizens along the corridor

Introduction I-2
Figure I-1: Rte 236 Corridor Study Area

Existing Conditions II-1
II Existing Conditions The analysis of existing conditions provides a detailed description of the current physical and operating characteristics of the Route 236 corridor. This evaluation required the development of a comprehensive inventory of existing conditions in terms of traffic volume and composition, travel speeds, level of service, physical conditions, roadway geometrics, and crash history. It also serves as a benchmark for analyzing future conditions and potential improvements. An important product of the existing conditions analysis is the identification of physical and operational deficiencies in the Route 236 corridor that adversely affect its ability to serve safely and efficiently. A. Traffic Volumes 1. Daily Traffic Flows Traffic volume counts obtained in the Study Area during early June of 2006 are depicted in Figure II-1. The volumes shown have been adjusted to represent the annual average daily traffic (AADT). Daily volumes will be somewhat higher than AADT in summer and somewhat lower in winter. Figure II-1 shows that AADT within the Study Area ranges from a low of 12,710 vehicles per day north of Route 101 in Eliot to a high of 20,030 vehicles per day on Rte 4/236 north of Route 236 in South Berwick.

Existing Conditions II-2
Figure II-1: 2006 Annual Average Daily Traffic

Existing Conditions II-3
2. Hourly Traffic Variation Figure II-2 shows the hourly variations in traffic volume by hours of the day on June 8, 2006 for Route 236 in Eliot north of Bolt Hill Rd. Figure II-2 closely resembles a typical weekday distribution for commuter traffic on an arterial highway. Peak periods of travel occur in the morning during the hour from 7 to 8 AM, and in the afternoon from 4 to 5 PM. During the morning peak, the directional distribution of the traffic volume is (over 76%) in the southbound direction toward Kittery. During the afternoon peak, the directional distribution is greater (over 68%) in the northbound direction. During the hour from noon to 1 PM the traffic volume is about 50 % in each direction. One pattern that is a little different from typical weekday distributions is the high volume of traffic (916 vehicles per hour) in the early hour from 5 to 6 AM heading in the southbound direction. This traffic is almost entirely the vehicles heading southbound. Likely destinations include the Kittery Navy Yard and points further south. The peak hour of combined traffic (over 1682 vehicles per hour) occurs in the afternoon from 4 to 5 PM. After 6 PM, the volumes decrease rapidly and reach a low of 37 vehicles per hour from 2 to 3 AM. The hourly variation of traffic was also recorded at a site southeast of Depot Rd in Eliot. As shown in Appendix I, the morning and afternoon directional distribution of vehicles is similar to Figure II-2 but the peak volumes are not as high. Figure II-2: Hourly Traffic Variation
Route 236 NW/O Bolt Hill RdThursday June 8, 2006
0
200
400
600
800
1000
1200
1400
1600
1800
1 2 3 4 5
6 A
M 7 8 9 10 11
Noo
n 1 2 3 4 5
6 P
M 7 8 9 10 11
Mid
nigh
t
Hour Ending
Vehi
cles
Per
Hou
r
Combined VehNorth DirectionSouth Direction

Existing Conditions II-4
3. Intersection Turning Movement Volumes Manual turning movement counts used in the Corridor Study cover eighteen intersections. The turning movement counts were conducted in South Berwick on June 1 and June 2, 2006, and in Eliot and Kittery the following week. These counts were conducted from 6 AM to 6 PM for all approaches of the following intersections:
• Kittery – Exit 2 and Exit 3 • Kittery – Martin Road / Stevenson Road • Eliot – Bolt Hill Road • Eliot – Beech Road • Eliot – Depot Road • Eliot – Route 103 • Eliot – Route 101 • South Berwick – Route 91 (June 23, 2004) • South Berwick – Quarry Drive • South Berwick – Brattle Street • South Berwick – Academy Street (south intersection) • South Berwick – Old Mill Road • South Berwick – Vine Street • South Berwick – Route 4 • South Berwick – Liberty Street (at Route 4) • South Berwick – Academy Street (north intersection) • South Berwick – Central School • South Berwick – Route 4 (Portland Street)
The peak hour turning volumes and times for the above intersections are shown in Appendix II. 4. Traffic Composition Two factors that have a significant influence on the traffic carrying capacity of a highway facility are the mix of vehicles in the traffic stream (specifically the percentage of heavy trucks), and the directional distribution, which is the proportion of vehicles traveling in the peak direction. A heavy truck is defined as any vehicle with 6 or more tires touching the pavement. Table II-1 summarizes this data at various locations throughout the corridor.

Existing Conditions II-5
Table II-1: Traffic Composition and Directional Distribution (2002 & 2003)
Town Location AADT Peak Hour Vol.
% Heavy Trucks of
AADT
Directional Distribution
% Heavy Trucks in Peak Hour
Kittery S/O Martin Rd 17,770 1,748 5.90% 69% 3.09%
Kittery N/O Martin Rd 18,710 1,758 6.02% 68% 3.30%
Eliot S/O Beech Rd 17,300 1,767 8.12% 64% 5.49%
Eliot N/O Beech Rd 16,630 1,741 8.34% 65% 5.86%
Eliot S/O Depot Rd 14,980 1,585 7.89% 72% 5.43%
Eliot N/O Depot Rd 14,800 1,528 8.36% 74% 4.84%
Eliot S/O Rte 101 16,300 1,510 6.04% 70% 4.11%
Eliot N/O Rte 101 12,710 1,162 7.04% 68% 4.48%
S.Berwick S/O Rte 91 12,750 1,227 8.54% 72% 4.64%
S.Berwick N/O Rte 91 15,150 1,531 7.73% 68% 4.48%
S.Berwick S/O Rte 4 20,390 1,768 7.41% 67% 2.77%
S.Berwick N/O Rte 4 10,790 1,028 5.66% 58% 2.14%
S.Berwick Rte.4 (Portland St) 13,630 1,132 8.48% 69% 3.27%
5. Historical Traffic Growth Table II-2 below shows the historical growth in traffic at selected locations along Route 236 between the Traffic Circle in Kittery and north of Route 4 in South Berwick. The historical data indicates that traffic continues to grow in the corridor study area. Future traffic projections will be discussed in Part III, Future Conditions.

Existing Conditions II-6
Table II-2: Historical Traffic Trends RTE 236 HISTORICAL TRAFFIC TRENDS
LOCATION2006 AADT
2005 AADT
2004 AADT
2003 AADT
2002 AADT
2001 AADT
2000 AADT
1999 AADT
1998 AADT
1997 AADT
1996 AADT
1995 AADT
1993 AADT
1992 AADT
1991 AADT
1990 AADT
1989 AADT
1987 AADT
1986 AADT
1985 AADT
1983 AADT
1981 AADT
Berwick, @ S Berwick TL 5,930 5,760 5,470 5,860 4,520 4,530 4,380 4,450 4,540 4,120 4,030 3,780 3,500 2,655South Berwick, NW/O Main St 5980 5,540 5,590 5,180 6,960South Berwick, N/O SR 4 (Portland St) 10790 10,410 11,010 11,670 7,400South Berwick, SR 4/236 N/O SR 236 20030 18,990 18,880 14,250South Berwick, SE/O Vine St 14900 14150 14,730 11,960 10,470 6,165South Berwick, NW/O SR 91 16320 14570 14,920 15,910 15,310 15,100 13,260 12,220 11,160 11,460 10,420 10,760 10,880 10,330 9,070 7,675 6,300South Berwick, SW/O Fifes Ln 12980 13,760 12,780 10,080 8,890 8,710 8,900 8,350 5,098Eliot, NE/O SR 101 12710 12290 13,910 12,030 9,750 8,620 8,290 7,740 8,600 8,700 5,319Eliot, SW/O SR 101 16300 15330 15,140 16,650 15,960 15,160 13,950 12,610 12,110 12,810 11,480 10,090 10,275 8,445 7,056Eliot, SE/O SR 103 14930 15,520 13,760 12,000 10,020 11,650 6,744Eliot, SE/O Depot Rd 14980 15360 16,170 14,780 15,080 13,400 11,660 7,495Eliot, NW/O Beech Rd 16630 16,600 15,640 13,860 12,810 13,180 12,400 12,690 12,260 11,120 11,235 8,915 7,365Eliot, NW/O Bolt Hill Rd 18370 16930 18,380 17,700 12,060 7,832Eliot, SE/O Bolt Hill Rd 17830 17700 18,140 17,680 16,840 15,270 14,280 13,230 13,080Kittery, NW/O Martin Rd 18710 17,980 16,770 14,680 13,900 15,300 13,760 9,409Kittery, SE/O Stevenson Rd 17770 18500 19,900 18,020 16,290 16,830 15,060 15,310 13,650 13,490 9,742Kittery, NW/O Traffic Circle 19900 19,800 19,540 19,570 18,730 17,150 16,620 19,500 18,930 12,365

Existing Condition II-7
B. Existing Conditions Inventory 1. Roadway Geometrics The existing physical characteristics of the corridor help to define the potential and the limitations of the existing roadway. The ability of the corridor to operate as a highway is largely controlled by the physical setting. Appendix III presents a segment-by-segment inventory of existing roadway geometric and operating conditions for the Route 236 Corridor Study area. The following elements are included in the appendix:
• Begin and end node descriptions • Begin and end node numbers • Begin and end miles along the corridor • Segment length (miles) • Posted speeds • Shoulder type and width • Number of lanes • Number of through lanes and widths • Number of right and left turning lanes and widths • Pavement condition rating
Table II-3 shows the historical full-construction projects along the Study Area. In general, Route 236 is a two-lane highway in rural areas and three or four lanes in the urban sections. Route 236 was built as a faster, more direct alternative to Route 103. The majority of the roadway is relatively straight and flat because it was built it on an abandoned railroad line. The old railroad line veers off Route 236 by Route 91 and is now occupied by power and gas lines. The original roadway projects in Eliot and South Berwick were constructed in the mid 1950’s. These projects were built with 11 or 12 foot width travel lanes and 6 or 8 foot shoulders. Intersection improvements occurred at Beech Road in 1989 and Route 101 in 1992. The latest widening in the Main Street area in South Berwick was in 1997. Overlay projects were not included in Table II-3 but the latest overlay project was finished in early 2006.

Existing Condition II-8
Table II-3: Historical Roadway Construction Projects
Location Project No From To
Const. Date
Travel Lanes Width (ft)
Shoulder Width (ft)
Length (Miles)
I-95-1(5)0 Exit 3 Area Route 1B Ramps Dana Road in Kittery 1970 2-26 Feet
(20” Gravel Base)
10 Feet Shoulder Variable Median (20” Gravel Base)
0.53
F.A.S.-0(100)5 Dana Road in Kittery 0.69 miles s/o S. Berwick Town Line (Rte. 101) 1957 22 Feet
(18” Gravel Base) 6 Feet
(18” Gravel Base) 6.058
HES-03-1(5) 0.36 miles s/o Beech Road 0.227 miles n/o Beech Road 1989 2-24 feet (22” Gravel Base)
4 feet Shoulder 16 feet Median
(28.5” Gravel Base) 0.587
F.A.S-0100(3) 0.69 miles s/o S. Berwick Town Line (Rte. 101) Route 4 in South Berwick 1956 22 & 24 Feet
(18” Gravel Base) 6 & 8 Feet
(18” Gravel Base) 4.645
F-003P(6) 0.133 miles s/o Route.101 0.075 miles n/o Route 101 1992 Auxiliary Lanes 0.208
105(502) Liberty St in South Berwick Webster St. in South Berwick 1964 12 Feet (24” Gravel Base)
8 Feet (24” Gravel Base) 0.658
F-STP-004P(31)E Route 236 Young St 1997 Variable Width
(24” Gravel Base) Variable Width
(24” Gravel Base) 0.328

Existing Conditions II-9
2. Pavement Conditions The Pavement Condition Rating (PCR) is an evaluation of distresses in pavement (such as cracking and wheel path rutting). PCRs will always range from 5 for a newly paved roadway to 0 for a road that is completely deteriorated. It is generally most cost-effective to resurface a road before the PCR drops below a rating of 3. PCRs do not account for base material, shoulders, drainage or longitudinal profile (ride). Listed below are descriptions for different PCR:
• PCR 5.0 – Excellent. New or nearly new pavements. Free of cracks, patches, or rutting. • PCR 4.0 - Good to Excellent. Pavement exhibiting few, if any, visible signs of surface
deterioration. • PCR 3.3 – Good. Evidence of initial deterioration including hairline cracks and minor
rutting. • PCR 2.4 – Fair to Poor. Visible defects including moderate cracking, distortion, and
rutting. Some patching may now be present. • PCR 1.2 – Poor. Extremely deteriorated pavements. Defects include severe cracking,
distortion, and rutting. Very extensive patching. • PCR 0.8 – Very Poor. Pavement is completely deteriorated. No structural integrity. No
salvage value. The PCR of each segment for the latest year (2007) is shown in Appendix III and displayed graphically in Figure II-3. The latest overlay project began in the interchange area and ended at Maine Street in South Berwick. The PCR for the study area is very good to excellent.

Existing Conditions II-10
Figure II-3 Pavement Condition Rating

Existing Conditions II-11
3. Roadway System Route 236 within the Study Area has two different Federal Functional Classifications: “Principal Arterial” and “Minor Arterial”. Arterials are the highest class of roadway, with their primary function being the movement of through traffic. The portion of Route 236 from the rotary to the I-95 interchange ramps is classified as Principal Arterial, in part, because this portion is a segment of the STRAHNET (Strategic Highway Network) System and the National Highway System. The balance of the Study Area, from the I-95 interchange ramps to Route 4 (Portland Street) is classified as Minor Arterial. Minor Arterials carry more localized traffic than Principal Arterials. 4. Safety Crash data for the years 2003 through 2005 were used to identify high crash locations (HCLs) in the Study Area. A HCL is a location that has eight (8) or more reported traffic crashes and a Critical Rate Factor (CRF) greater than 1.00 in a three-year period. A highway location with a CRF greater than 1.00 has a frequency of crashes that is significantly greater than the statewide average for similar locations. During this time period there were 1,054 HCLs statewide, including 143 HCLs in York County. Based on the results of the crash research, seven locations within the Study Area meet the criteria for placement on MaineDOT’s list of HCLs. Collision diagrams were prepared for these locations to determine if there are any crash patterns or trends evident that may indicate correctable roadway/intersection deficiencies. These diagrams are provided in Appendix IV. Table II-4 summarizes the high crash location, the number of crashes, injury type and the CRF for the Study Area HCLs. Table II-4: High Crash Locations
Injury Type Location Total
Crashes K A B C PD
Percent Injury CRF
Kittery – Exit 2 N.B. Off-Ramp 11 0 0 0 3 8 27.3 2.48 Eliot – Bolt Hill Rd. 9 0 0 2 2 5 44.4 1.53 Eliot – Route 101 24 0 0 0 6 18 25.0 1.15 S. Berwick – Route 91 11 0 0 1 2 8 27.3 2.10 S. Berwick – Quarry Dr. 10 0 0 1 4 5 50.0 1.87 S. Berwick – Vine St. 9 0 0 1 3 5 44.4 1.12 S. Berwick – Route 4 (Portland St.) 10 0 1 0 2 7 30.0 1.50 Note: Injury Type: K=fatality A=incapacitating B= non-incapacitating C= possible injury PD= no injuries (property damage only) The following paragraphs summarize the results of the crash research.

Existing Conditions II-12
Route 236 South at Exit 2 N.B. Off-Ramp Eleven crashes occurred at the intersection of Route 236 and the Exit 2 northbound off-ramp in Kittery between 2003 and 2005. Ten of the eleven are rear-end type crashes at the yield sign. In most of these crashes, people had started and then stopped and the driver in the vehicle behind did not realize they had stopped. The remaining crash was an angle collision that involved a vehicle going through the yield sign and continuing over the median into the Route 236 northbound travel lane. Route 236 at Bolt Hill Road Nine crashes occurred at the intersection of Route 236 and Bolt Hill Road in Eliot between 2003 and 2005. There were five rear-end type crashes; this is a result of people turning or trying to turn into Bolt Hill Road. There were two angle type crashes exiting Bolt Hill Road from the west. One crash involved a mattress falling out of the back of the truck and a vehicle in the opposite direction hitting it. The last crash involved a truck driver trying to reverse direction by using a driveway (Morgridge Construction) by the intersection and striking a utility pole in the process. Route 236 at Route 101 Twenty four crashes occurred at the signalized intersection of Route 236 and Route 101 in Eliot between 2003 and 2005. Fourteen crashes were rear-end type, all at the stop bar except one which involved a right turn into the Muddy River Steak House driveway. Four crashes resulted from left-turn vehicles being struck by through traffic: two left-turn vehicles heading southbound on Rte 236 and one from each direction on Rte.101. Two angle crashes resulted when drivers on Rte 101 disregarded the red traffic signal. There were four miscellaneous crashes: one involving a snow plow clearing the intersection (backing up), a truck turning too sharply and striking a utility pole, a vehicle striking the median island and sign, and a vehicle turning into the Steak House and sideswiping another vehicle as it entered. Route 236 at Route 91 Eleven crashes occurred at the intersection of Route 236 and Route 91 in South Berwick between 2003 and 2005. There were five rear-end type crashes: two were at the stop sign on Rte 91, one involved a driver waiting to turn left into Old South Road, one involving a vehicle exiting Rte 91 and one rear-end from a vehicle sliding under snowy conditions. There were six angle type crashes: four exiting Rte 91 (one was distracted and ran the stop sign) and two were heading southbound on Rte 236 and turning left into Rte 91. Eight of the eleven crashes occurred between 3 PM and 6PM and on dry road conditions. Route 236 at Quarry Drive Ten crashes occurred at the intersection of Route 236 and Quarry Drive in South Berwick between 2003 and 2005. There were three rear-end type crashes: two of these involved drivers waiting to turn left into Quarry Drive and one at the stop sign on Quarry Drive. There were five

Existing Conditions II-13
angle type crashes: four turning left and one turning right out of Quarry Drive. There were two miscellaneous type crashes: one involved an attempted U-turn using Quarry Drive and the other involved a driver that was distracted and hit a tree. Route 236 at Vine St Nine crashes occurred at the intersection of Route 236 and Vine Street in South Berwick between 2003 and 2005. There were three rear-end type crashes: two of these involved drivers waiting to turn left into Vine Street (one from each direction) and one was a three-car rear-end when late afternoon traffic stopped suddenly. There was one crash where the driver avoided rear-ending a left-turning vehicle but went into a ditch. There were four angle type crashes: two involved vehicles exiting out of Academy Street side, one exiting out of Vine Street and one heading southbound on Rte 236 and turning left into the Academy Street side. The last crash involved a vehicle turning into Academy Street from Route 236 and striking a vehicle waiting to turn onto Route 236. Route 236 at Route 4 (Portland Street) Ten crashes occurred at the intersection of Route 236 and Portland Street in South Berwick between 2003 and 2005. There were five rear-end type crashes: four of these were on Portland Street and one was heading southbound on Main Street. There were two angle type crashes, both involving vehicles exiting Portland Street and heading southbound on Route 236. Both angle crashes occurred in the evening (5:40 PM and 7:25 PM), with one on a Sunday and the other on the Fourth of July. There were two crashes involving parked vehicles. The last crash involved a vehicle exiting the Mobil Station and being struck by an eastbound vehicle. The crash rate is determined by dividing the number of crashes in a study period by the amount of travel (in units of 100 million vehicle-miles). Crash rates on Route 236 were compared with overall crash rates statewide and for other Minor Arterials statewide. Table II-5 represents the combined (links and nodes) fatal crash rate for the three-year study period from 2003 through 2005. There were no fatal crashes in the study area between 2003 and 2005. The fatal crash rate for the Route 236 Study Area was 0.00, compared to the 1.08 for two-lane Minor Arterials statewide. Table II-5: Fatal Crash Comparison
2003 2004 2005 2003-2005 Crash Rate
Total Fatal Crashes Statewide 184 176 152 1.13 Total Fatal Crashes on Two-Lane Minor Arterials 34 35 25 1.08
Total Fatal Crashes on Route 236 Study Area 0 0 0 0.00

Existing Conditions II-14
For the general crash rate comparison, the Study Area was divided into four sections based on road classification, road type and the number of lanes and signalized intersections. Crash rates for the period 2003 through 2005 are shown in Table II-6 for combined roadway segments (links and nodes) for the Study Area and compared to the statewide average for the same classes of roadway. For Principal Arterial four-lane divided urban roadway segments, the Study Area has a higher crash rate than the statewide crash rate. The Study Area segment is the four-lane section (both northbound and southbound on Rte 236) east of I-95. The segment has a crash rate of 566.0 compared to the statewide three-year average of 286.6. The crash rate is higher for this segment is because of the HCL at the intersection of the Exit 2 northbound off-ramp and Route 236 southbound. All of the crashes on this segment occurred at the intersection (node). For all other classes of roadway in the Route 236 Study Area, the crash rate was equal to or less than the statewide crash rate. Table II-6: Crash Rate Comparison (Links and Nodes- crashes per 100 million vehicle-miles)
Location Classification Type 2003-2005 Statewide
Crash Rate
2003-2005 Study Area Crash Rate
East Side of I-95 Interchange Principal Arterial Four-Lane Urban 286.6 566.0
West Side of I-95 to Dana Dr. Principal Arterial Four-Lane Rural 198.2 195.4
Dana Dr. to Rte 91 Minor Arterial Two-Lane Rural 166.7 123.5
Rte 91 to Rte 4 (Portland St) Minor Arterial Two-Lane Urban 348.8 275.5
Signalized Intersection (3) Signals Signals 0.65 0.64
Note: The highlighted areas are the locations where the crash rate is higher in the Study Area than the statewide average.

Existing Conditions II-15
Table II-7 shows crash types for the Study Area compared to the statewide averages for the same three-year period. Route 236 had a higher than statewide average for the following crash types: rear-end/sideswipe, intersection movement, sled/bike, all other animals, and other crashes. However, only the rear-end/sideswipe and intersection movement types occurred in large numbers. Table II-7: Crash Type Comparison
Crash Statewide Statewide Route 236 Route 236
Type 2003-2005 Total
Percent of Total
2003-2005 Total
Percent of Total
% %Object in Road 2,609 2.49% 9 2.59%
Run Off Road 27,471 26.25% 36 10.37%
Rear End / Sideswipe 33,583 32.09% 158 45.53%
Head On / Sideswipe 3,477 3.32% 10 2.88%
Intersection Movement 21,015 20.08% 96 27.67%
Pedestrians 746 0.71% 1 0.29%
Sled / Bike 566 0.54% 2 0.58%
Train 12 0.01% 0 0.00%
All Other Animals 420 0.40% 2 0.58%
Deer 9,406 8.99% 25 7.20%
Moose 1,976 1.89% 0 0.00%
Bear 72 0.07% 0 0.00%
Non Collision 1,360 1.30% 1 0.29%
Other 1,950 1.86% 7 2.02%
Unknown 0 0.00% 0 0.00%
Total 104,663 100.00% 347 100.00% Note: The highlighted area is where the percent of crash type in the Study Area (3-year) is greater than the statewide (3-year) crash type. The percentage (45.53%) of rear-end/sideswipe crashes in the Study Area is greater than the statewide (32.09%) percentage. Of the 158 rear-end/sideswipe crashes, 58 occurred on straight road, five on curved road, eight at driveways and 87 at intersections or interchanges. It is common for rear-end crashes to occur at intersections, especially signalized intersections. Many of the 58 straight road crashes occurred because of stopped, slowing or turning traffic. Some of the crashes occurred during the 2005 overlay project.

Existing Conditions II-16
The percentage (27.67) of intersection movement crashes in the Study Area is also higher than the statewide (20.08) percentage. Out of a total of 96 crashes, 75 occurred at intersections and interchanges and 21 occurred at driveways. The remaining crash types sled/bike, other animals and other are slightly above the statewide percentage, but are very few in number. The percentage (10.37%) of run off road crashes is much less than the statewide percentage (26.25%), however they do make up 10% of the total crashes. The lower percentage can be attributed to the straight and flat alignment of Route 236 and its modern design (12-foot lanes with 8-foot paved shoulders). Of the total 36 run off road crashes, 24 crashes occurred on straight road, three on curved road, one at a driveway, and the remaining at intersections and interchanges. Table II-8 shows Contributing Human Factors for the Study Area compared to the statewide averages for the same 3 year period. The total number in Table II-8 is greater than the total number of crashes in Table II-7 because the crash factor table includes factors for each driver in a multi-vehicular crash.

Existing Conditions II-17
Table II-8: Contributing Crash Factor Comparison
Statewide Statewide Route 236 Route 2362001-2003
TotalPercent of
Total2003-2005
TotalPercent of
Total% %
No Improper Driving 75,599 46.65% 306 49.28%Failure to Yield R/W 13,234 8.17% 51 8.21%Illegal Unsafe Speed 16,853 10.40% 8 1.29%Follow Too Close 8,248 5.09% 21 3.38%Disregard Traffic 2,197 1.36% 9 1.45%Driving Left of Center 940 0.58% 4 0.64%Improper Passing 1,768 1.09% 2 0.32%Improper Lane Change 1,673 1.03% 7 1.13%Improper Start/Stop 601 0.37% 1 0.16%Improper Turn 1,683 1.04% 11 1.77%Unsafe Backing 2,284 1.41% 1 0.16%No Proper Signal 471 0.29% 1 0.16%Impeding Traffic 279 0.17% 5 0.81%Driver Inattention 25,020 15.44% 156 25.12%Driver Inexperience 2,415 1.49% 10 1.61%Pedestrian Violation 293 0.18% 0 0.00%Physical Impairment 2,186 1.35% 9 1.45%Vision Obscured Glass 184 0.11% 1 0.16%Vision Obscured Light 884 0.55% 2 0.32%Vision Obscured Other 1,480 0.91% 6 0.97%Other Human Factor 3,310 2.04% 10 1.61%Hit & Run 454 0.28% 0 0.00%Total 162,056 100.00% 621 100.00%
Human Factors
Note: The highlighted area is where the percent of contributing crash factors in the Study Area (3 year) is greater than the statewide (3 year) crash type. No improper driving was a contributing factor in 49.28% of the Study Area crashes; this is very close to the statewide average of 46.65%. Illegal unsafe speed was a contributing factor in only 1.29% of the Study Area crashes compared to a much higher statewide average of 10.40%. This is most likely due to police enforcement and heavy traffic volumes. For the Study Area, driver inattention was listed as a contributing factor for 25.12% of the crashes which is substantially higher than the statewide average of 15.44%. Intersection and rear end crashes are the dominant type of crashes, and the contributing factors for those types would be more likely to be driver inattention than illegal unsafe speed.

Existing Conditions II-18
C. Mobility and Operating Conditions 1. Travel Speeds Travel time studies were conducted on May 31, June 1, and June 2, 2006 from the Kittery rotary to Route 4 / Agamenticus Road in South Berwick to measure actual travel speeds and locate areas where travel delays are occurring. Thirty-one speed and delay runs were made between 6:00 am and 6:00 pm in both the northbound and southbound directions. As shown in Figure II-4, for the northbound direction, travel times for the 11.33 mile section range from 15 minutes and 05 seconds (10:04 am) to 22 minutes and 52 seconds (4:09 pm). There appear to be both AM and PM peaks but the longest travel times were in the PM.
Figure II-4: Northbound Travel Times
Northbound All Days
0200400600800
100012001400
6:18
AM
6:22
AM
6:55
AM
7:00
AM
7:43
AM
7:43
AM
8:34
AM
8:34
AM
9:27
AM
9:37
AM
10:0
4 AM
10:1
2 AM
10:3
9 AM
10:5
6 AM
11:3
7 AM
12:0
2 PM
12:4
0 PM
1:08
PM
1:23
PM
1:50
PM
2:03
PM
2:42
PM
2:43
PM
3:27
PM
3:28
PM
4:08
PM
4:09
PM
4:52
PM
4:56
PM
5:34
PM
5:43
PM
Start Time of Runs
Tim
e (s
ec)
As shown in Figure II-5, for the southbound direction, travel times for the 11.33 mile section range from 15 minutes and 41 seconds (1:02 pm) to 22 minutes and 04 seconds (7:20 am). There appear to be both AM and PM peaks, but a longest travel times occur in the AM. There were more travel times over 20 minutes in the southbound direction than in the northbound direction. One explanation for this is that the Route 236 intersection at Portland Street in South Berwick allows northbound traffic to turn right onto Portland Street without stopping or yielding, but stops left-turning southbound traffic from Portland St.

Existing Conditions II-19
Figure II-5: Southbound Travel Times
Southbound All Days
0200400600800
100012001400
6:01
AM
6:36
AM
6:42
AM
7:20
AM
7:24
AM
8:06
AM
8:15
AM
8:54
AM
8:58
AM
9:47
AM
9:55
AM
10:2
2 AM
10:3
9 AM
11:1
6 AM
11:4
4 AM
11:5
3 AM
12:2
3 PM
12:4
8 PM
1:02
PM
1:31
PM
1:44
PM
2:09
PM
2:24
PM
3:06
PM
3:10
PM
3:51
PM
3:53
PM
4:34
PM
4:39
PM
5:13
PM
5:20
PM
Start Time of Runs
Tim
e (s
ec)
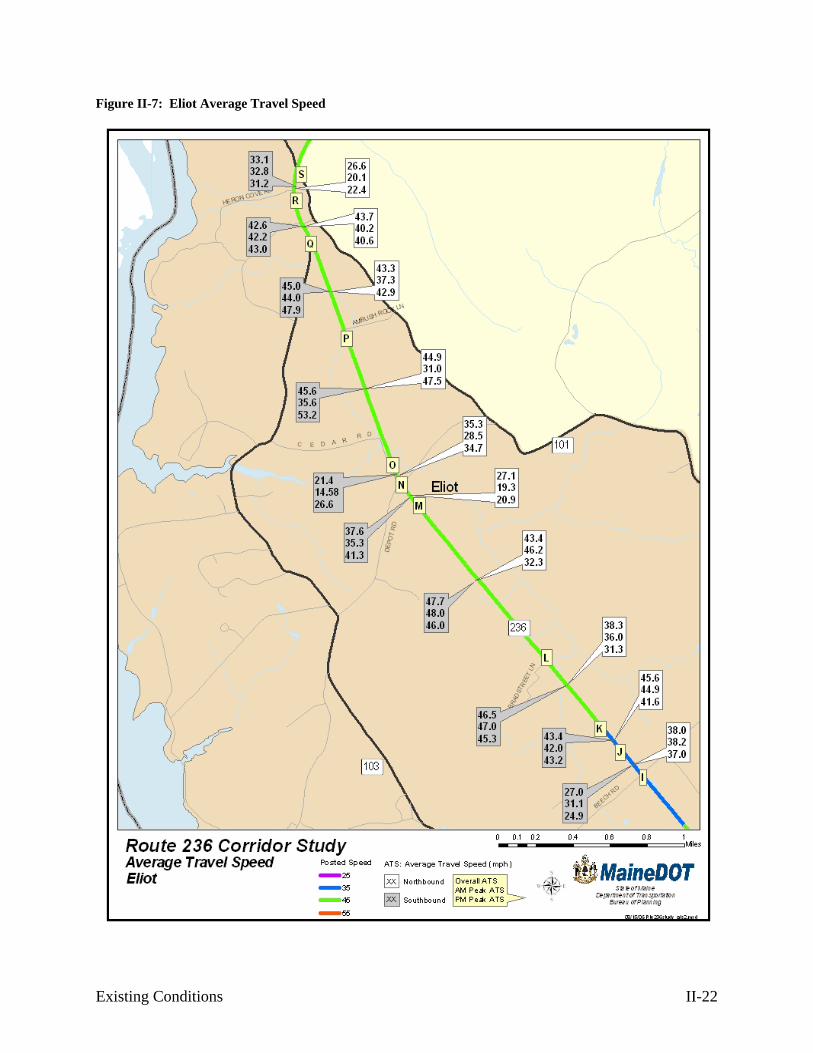
Comparisons of AM peak, PM peak and overall average travel speeds (ATS) with the posted speeds, are shown in Figures II-6, II-7, II-8 and II-9. (See Appendix V for summary of average travel speed from speed and delay runs.) According to the 2000 Highway Capacity Manual (HCM2000), the ATS is the length of the highway segment divided by the average travel time of all vehicles traversing the segment, including all stopped delay times. As a whole, the overall average travel speed is slightly above or below the posted speed except in areas approaching signalized intersections, 15 mph school zones, and in the village area of South Berwick. For example, on the approach to the signal at Depot Road between the 15 mph speed zone signs (Point M) and Depot St (point N), the overall average travel speed is 27.1 mph in a 45 mph Speed Zone. This would be expected because the average travel speed includes the time that vehicles are stopped for the signal. The other location where the average travel speed is much lower than the posted speed is in South Berwick between Points EE and GG. For Southbound traffic, the average travel speed is 16.0 mph to 16.3 mph in a 25 mph zone. The AM peak is the average of the runs from 7:00 AM to 9:00 AM. In most locations the southbound speed in the AM peak is slower than the PM peak southbound speeds, but in between Depot Road and Bolt Hill Road the AM peak speed is slightly higher. A higher volume of traffic is heading southbound in the AM, and northbound in the PM. This is discussed in more detail in the section on hourly speed variations. One value of note in the northbound direction in the AM is between Point O and Point P where the ATS is 31.0 mph in a 45 mph speed zone. Closer review of this information showed the delays to be caused by school buses picking up students. The PM peak is the average of runs from 3:30 PM to 5:30 PM. The PM peak ATS from the 45 mph speed zone change and Depot Road in Eliot is only 31.3 and 32.3 mph in a 45 mph zone. There are long northbound queues from Depot Road that back up approximately three quarters of a mile in the PM peak.

Existing Conditions II-20
Maximum observed delay times from the speed and delay study at signalized and unsignalized intersections are shown in Table II-9. Table II-9: Maximum Delay at Intersections
Location Delay (seconds/vehicle) Time Direction
Martin/Stevenson Rd 77 4:09 PM Northbound Beech St. 44 12:02 PM Northbound Depot Rd. 185 4:08 PM Northbound Route 101 57 5:13 PM Northbound Route 236/Main St 168 4:09 PM Northbound Route 236/Portland St (No Police) 445 5:20 PM Southbound Route 236/Portland St ( Police) 292 8:06 PM Southbound

Existing Conditions II-21
Figure II-6: Kittery-Eliot Average Travel Speed
Existing Conditions II-22
Figure II-7: Eliot Average Travel Speed

Existing Conditions II-23
Figure II-8: Eliot-South Berwick Average Travel Speed

Existing Conditions II-24
Figure II-9: South Berwick Average Travel Speed

Existing Conditions II-25
2. Hourly Speed Variation Figure II-10 shows variation of average speed with time of day, along with combined hourly volume variations, over a 24–hour period for Route 236 north of Bolt Hill Road. The speed remains relatively constant despite significant changes in volume. At this particular location, the average speed in the northbound direction is higher than in the southbound direction. This difference may be due to the reduction of the speed limit (from 45 mph to 35 mph) and the roadside development in the area north of the data collection point. For the 9,106 northbound vehicles that passed the collection point over the 24 hours, the average speed was 46.3 mph. For the 10,009 southbound vehicles that passed the collection point over the 24 hours, the average speed was 44.4 mph. The hour from 6:00 am to 7:00 am shows a drop in speed for both northbound and southbound traffic. The average speed is the lowest for the northbound (44 mph) and for the southbound (40 mph) in the 24 hours. It is unknown as to why both directions had the lowest average speed in the same hour but perhaps there was police enforcement during that hour. The hourly speed variation of traffic was also observed south of Depot Rd. in Eliot. Appendix I includes a figure for this site, similar to Figure II-10 for Bolt Hill Road. The average speeds south of Depot Road are higher (48 mph) than the speeds at location north of Bolt Hill Road. Because the speed of vehicles varies little with change in volume on two-lane highways, average speed is not the sole measure of Level of Service (LOS) for this type of facility. The other factor in determining the LOS is percent time spent following (PTSF). PTSF represents the freedom to maneuver and the comfort and convenience of travel. It is the average percent of travel time that vehicles must travel in platoons behind slower vehicles due to the inability to pass. PTSF is difficult to measure in the field. However, the percentage of vehicles traveling with headways of less than 3 seconds can be used as a surrogate measure. Headway is the time in seconds between two successive vehicles as they pass a point on the roadway, measured from the same common feature of both vehicles (for example, the front axle or the front bumper). (See Appendix I for summary of Speed and Headway Data)

Existing Conditions II-26
Figure II-10: Hourly Speed Variation (N/O Bolt Hill Road)
Route 236 NW/O Bolt Hill RdThursday June 8, 2006
0
200
400
600
800
1000
1200
1400
1600
18001 2 3 4 5
6 AM
7 8 9 10 11
Noo
n 1 2 3 4 5
6 PM
7 8 9 10 11
Mid
nigh
t
Hour Ending
Vehi
cles
Per
Hou
r
0
5
10
15
20
25
30
35
40
45
50
55
Avg
. Spe
ed (m
ph)
Combined Vehicular VolumeNorth Average SpeedSouth Average Speed

Existing Conditions II-27
3. Hourly Headway Variation Figures II-11 and II-12 show the variation in headway for both southbound and northbound traffic north of Bolt Hill Rd in Eliot. In these two figures, headway is broken down into four ranges. The first range, in red, has an upper value of 2 seconds and represents vehicles with headways less than the recommended “safe” driving distance given in the State of Maine Motorist Handbook and Study Guide. The second range, in orange, has an upper value of 3 seconds, which represents the current Highway Capacity Manual (HCM 2000) threshold for PTSF. The third range, in yellow, has an upper value of 5 seconds, which represents the 1985 HCM threshold for “percent time delay”. The last range, in green, represents vehicles with headway greater than 5 seconds. For southbound traffic, the time period that has the highest percentage of headway (84.2%) of less than 5 seconds is from 7:00 am to 8:00 am. This corresponds with the peak hour of south bound traffic in Figure II-2. The range of vehicles with less than the safe distance is from 0 % during early morning hours to a high of around 47 % (492 out of 1,048 vehicles) from 7:00 am to 8:00 am. The average percent for the 24 hour period of vehicles that travel less than the recommended safe distance between vehicles is around 23%. The highest percent of vehicular headway that is less than 3 seconds is 68.8% (719 out of 1,048 vehicles) and it is also from 7:00 am to 8:00 am. For northbound traffic, the time period that has the highest percentage of headway (86.9%) of less than 5 seconds is from 4:00 pm to 5:00 pm. This corresponds with the peak hour of north bound traffic in Figure II-2. The range of vehicles with less than the safe distance is from 0 % during early morning hours to a high of around 47 % (490 out of 1,042 vehicles) from 5:00 pm to 6:00 pm. The average percentage for the 24 hour period of vehicles that travel less than the recommended safe distance between vehicles is around 23%. The highest percentage of vehicular headway that is less than 3 seconds is 72.2% (829 out of 1,042 vehicles), also from 4:00 to 5:00 pm.

Existing Conditions II-28
Figure II-11: Hourly Headway Variation - Southbound
Headway SB Route 236 N/O Bolt Hill Rd
0%
10%
20%
30%
40%
50%
60%
70%
80%
90%
100%1 2 3 4 5
6 AM 7 8 9 10 11
Noo
n 1 2 3 4 5
6 PM 7 8 9 10 11
Mid
nigh
t
Hour Ending
% o
f Tot
al S
B V
ehic
les
>5 sec3.01 to 5 sec2.01 to 3 sec0 to 2.00 sec
Figure II-12: Hourly Headway Variation - Nouthbound
Headway NB Route 236 N/O Bolt Hill Rd
0%
10%
20%
30%
40%
50%
60%
70%
80%
90%
100%
1 2 3 4 5
6 A
M 7 8 9 10 11
Noo
n 1 2 3 4 5
6 P
M 7 8 9 10 11
Mid
nigh
t
Hour Ending
% o
f Tot
al N
B V
ehic
les
>5 sec3.01 to 5 sec2.01 to 3 sec0 to 2.00 sec

Existing Conditions II-29
4. Level of Service A major element of this study is the evaluation of operating conditions along the corridor relative to existing and future traffic mobility. To assess mobility, capacity and level of service (LOS), analyses were conducted by using the Synchro/SimTraffic software package for intersections and urban roadway segments and the HCM 2000 for rural roadway segments. Capacity is defined as the “maximum sustainable flow rate at which vehicles or persons reasonably can be expected to traverse a point or uniform segment of a lane or roadway during a specific time period under given roadway, geometric, traffic, environmental, and control conditions”. Conditions or factors that affect capacity include the number of travel lanes, lane and shoulder width, lateral clearances, alignment, the characteristics of vehicles in the traffic stream, and traffic control and regulations in existence. Level-of-service (LOS) is a qualitative measure describing operational conditions within a traffic stream taking into account a number of variables such as speed and travel time, vehicles maneuverability, traffic interruptions, comfort, and convenience. There are six levels of service defined in the manual ranging from LOS “A” to LOS “F”, with LOS “A” representing the best operational condition and LOS “F” representing the worst. Each level of service represents a range of operating conditions and the driver’s perception of those conditions. a. Roadway For analysis purposes, the HCM2000 classifies Route 236 roadway segments into the following two categories based on roadway type and function.
• Urban Streets (Class I, II, III, IV) • Rural Two-Lane Highways (Class I and II)
The Urban Street Level of Service is based on travel speed, running time, and intersection control delay. These criteria were applied to a short section in Kittery and to one in South Berwick. Table II-10: LOS Criteria for Urban Streets
Urban Street Class 1 (Kittery) Urban Street Class III (South Berwick)
Level of Service Avg. Travel Speed (mph) Level of Service Avg. Travel Speed (mph)A >42 A >30 B >34-42 B >24-30 C >27-34 C >18-24 D >21-27 D >14-18 E >16-21 E >10-14 F <=16 F <=10
For Rural Two Lane Highways (Class 1), LOS criteria are percent time-spent-following and average travel speed. These criteria were applied in all parts of the corridor not evaluated as

Existing Conditions II-30
Urban Streets. Factors that affect the level of service include: lane and shoulder width, access point density, percentage of no-passing zones, base free flow speeds, peak hour factor, directional distribution and composition of traffic. Table II-11 LOS Criteria for Two-Lane Highways (Class 1)
Level of Service Percent Time-Spent Following Avg. Travel Speed (mph)
A <= 35 > 55 B > 35-50 > 50-55 C > 50-65 > 45-50 D > 65-80 > 40-45 E > 80 <= 40
F Applies whenever the flow rate exceeds the segment capacity. The following describes the typical characteristics of the each level of service as applied to two-lane rural highways. LOS A – Motorists are able to travel at their desired speed. Passing demand is well below passing capacity, and platoons of three or more vehicles are rare. Drivers are delayed no more than 35 percent of their travel time by slow moving vehicles. Maximum flow rate of 490 pc/hr in both directions. LOS B – Characterizes traffic flow with speeds of 50 mph or slightly higher. The demand for passing to maintain desired speeds becomes significant and approximates the passing capacity at the lower boundary of LOS B. Drivers are delayed in platoons up to 50% of the time. Service flow rates of 780 pc/h total in both directions can be achieved. Above this flow rate the number of platoons increase dramatically. LOS C describes further increase in flow, resulting in noticeable increases in platoon formation, platoon size, and frequency of passing impediments. The average speed still exceeds 45mph, even though unrestricted passing demand exceeds passing capacity. Although traffic flow is stable, it is susceptible to congestion due to turning traffic and slow-moving vehicles. PTSF may reach 65%. Service flow rates of up to1,190 pc/h in both directions. LOS D describes unstable flow. The two opposing traffic streams begin to operate separately at higher volume levels, as passing becomes extremely difficult. Passing demand is high, but passing capacity approaches zero. Mean platoon sizes of 5 to 10 vehicles are common, although speeds of 40mph still can be maintained. The proportion of no-passing zones usually has little influence on passing. Turning vehicles and roadside distractions cause major shock waves in the traffic stream. Motorists are delayed in platoons for nearly 80% of their travel time. Maximum flow rates of 1,830 pc/h total in both directions. LOS E traffic flow conditions have a PTSF greater than 80 percent. Passing is virtually impossible, and platooning becomes intense, as slower vehicles or other interruptions are encountered. The highest volume attainable under LOS E defines the capacity of the highway, generally 3,200 pc/h total in both directions.
Existing Conditions II-31
LOS F represents heavily congested flow with traffic demand exceeding capacity. In order to determine level of service, the Route 236 corridor was divided into seven sections for analysis purposes. The results of this analysis are summarized in Table II-12, which identifies each study segment and its associated level of service in the PM peak hours. The field data collected from the speed/delay runs was used in evaluating the existing conditions. As shown in Table II-12, the two urban roadway segments operate at a LOS A in the Kittery area and LOS D in South Berwick. The five rural roadway segments from Dana Road to Route 4 currently operate at a LOS E except for the segment between Route 101 to Route 91 which operates at LOS D. The volume to roadway capacity range is from 46% to 56%. As shown in Figure II-13, the rural roadway segments from Dana Road to Route 4 were further analyzed for each hour of the day from 6:00 am to 6:00 pm. The level of service ranges from LOS C to LOS E. The roadway segment from Route 91 to Route 4 is the only segment with a LOS E throughout the day despite the lower traffic volumes in mid day. This is mainly due to the high percentage (87%) of no-passing zones, access points and the lower base free flow speed for that segment. Mainly due to lower traffic volumes, the roadway segments from Beech Road to Route 91 between the hours of 9:00am to 2:00 pm operate at a LOS C.

Existing Conditions II-32
Table II-12: Level of Service (LOS): Roadway Segments - Existing Conditions (2006) NB SB
PM Peak PM Peak PM Peak Design Urban LOSSection Posted ATS Avg. Travel ATS Category Street (Both Dir.)
Town From To Mileage Speed 3:30-5:30 Speed Both Dir. 3:30-5:30 ClassKittery NB Off-Ramp Cross Over SB Off-Ramp Cross Over 0.225 45 43.0 42.3Kittery SB Off-Ramp Cross Over Dana Rd (End of 4-lanes) 0.2 45 44.2 45.0
0.425 43.5 High Speed I A
Kittery Dana Rd (End of 4-lanes) Martin Road 0.385 45 25.5 41.2Kittery Martin Road MacKenzie Lane 0.35 45 39.2 36.7Kittery MacKenzie Lane Bolt Hill Road 0.335 45 45.4 45.8
Eliot Bolt Hill Road Drive For Boat Buisness (Begin 4-lanes NB) 0.545 45 45.9 42.3
Eliot Drive For Boat Buisness (Begin 4-lanes NB) Beech Road 0.37 35 27.5 35.7
1.985 37.2 Rural 2-Lane EATS = 37.1
PTSF = 82.6V/C = 0.56
Eliot Beech Road Passamaquoddy (End 4-lanes NB) 0.216 35 37.0 24.9
Eliot Passamaquoddy (End 4-lanes NB) 35/45 mph Zone Change 0.216 35 41.6 43.2
Eliot 35/45 mph Zone Change Brad Street 0.363 45 31.3 45.3
Eliot Brad Street NB 15 mph School Zone Limit Lights 1.06 45 32.3 46.0
Eliot NB 15 mph School Zone Limit Lights Depot Road 0.17 45 20.9 41.3
2.025 35.7 Rural 2-Lane EATS = 36.2
PTSF = 80.3V/C = 0.55
Eliot Depot Road SB 15 mph School Zone Limit Lights 0.095 45 34.7 26.6
Eliot SB 15 mph School Zone Limit Lights Ambush Rock Lane 0.8 45 47.5 53.2
Eliot Ambush Rock Lane Route 103 0.475 45 42.9 47.9Eliot Route 103 Heron Cove Road 0.285 45 40.6 43.0Eliot Heron Cove Road Route 101 0.12 45 22.4 31.2
1.775 43.1 Rural 2-Lane EATS = 42.9
PTSF = 83.0V/C = 0.54
Eliot Route 101 End of SB Guard Rail 0.15 45 36.0 12.1Eliot End of SB Guard Rail 45/55 mph Speed Zone 0.239 45 48.2 52.1Eliot 45/55 mph Speed Zone Lord's Road 0.742 55 50.4 53.6
S. Berwick Lord's Road NB 15 mph School Zone Limit Lights 0.525 55 51.9 52.7
S. Berwick NB 15 mph School Zone Limit Lights
SB 15 mph School Zone Limit Lights 0.183 55 49.6 50.0
S. Berwick SB 15 mph School Zone Limit Lights 55/45 mph Speed Zone 0.539 55 54.1 52.2
S. Berwick 55/45 mph Speed Zone Route 91 0.304 45 48.5 49.02.682 46.9 Rural 2-Lane D
ATS = 46.3PTSF = 77.3V/C = 0.46
S. Berwick Route 91 Quarry Drive 0.41 45 44.5 48.4
S. Berwick Quarry Drive Brattle St (Vaughan Woods) 0.214 45 44.2 46.7
S. Berwick Brattle St (Vaughan Woods) Vine St. (school area) 0.587 45 45.1 45.6
S. Berwick Vine St. (school area) 45/25 mph Speed Zone 0.321 45 41.1 40.5S. Berwick 45/25 mph Speed Zone Route 4 0.166 25 6.5 30.6
1.698 33.5 Rural 2-Lane EATS = 33.6
PTSF = 81.6V/C = 0.49
S. Berwick Route 4 Academy St 0.078 25 19.9 13.2S. Berwick Academy St Route4/Portland St 0.12 25 18.0 19.3
0.198 17.5 Urban III DTotal 10.788
Color Key School Zone 15 mph Flashing Lights Signalized Intersections

Existing Conditions II-33
Figure II-13: Level of Service (LOS): Rural Roadway Segments – Existing Hourly Conditions (2006)
Rte 4
Seg.5 E E E E E E E E E E E E
Rte 91
Seg.4 D D D C C C C C D D D D
Rte 101
Seg.3 D D/E D C C C C C D E/D E/D E
Depot
Seg.2 D D D C C C C C D E E E/D
Beech
Seg.1 D D E D D D D D D E E E
Dana
6-7a
m
7-8a
m
8-9a
m
9-10
am
10-1
1am
11-N
oon
12-1
pm
1-2p
m
2-3p
m
3-4p
m
4-5p
m
5-6p
m
Time of Day b. Unsignalized Intersections Levels of service (LOS) for unsignalized intersections are determined by computed or measured control delay in seconds per vehicle. LOS is defined for each minor movement and not for the intersection as a whole. Control delay is defined as the total elapsed time from the time a vehicle stops at the end of the queue to the time the vehicle crosses the stop line at the intersection. LOS ranges are shown in the following table: Table II-13: LOS Criteria for Unsignalized Intersections
Level of Service Average Control Delay (sec/veh) A 0-10 B >10-15 C >15-25 D >25-35 E >35-50 F >50

Existing Conditions II-34
Existing 2006 traffic flow conditions for signalized and unsignalized intersections were evaluated using the SimTraffic microscopic vehicle simulation analysis program. This program models all vehicles traveling through a roadway network by simulating individual vehicle traffic flow. Inputs to the model include roadway geometrics, lane use, intersection control operations, intersection turning movements, and system traffic volume. As the model runs, the location of each vehicle in the model network is tracked for each second of time. With this location and time data compiled for each vehicle, the model then computes a variety of measures of effectiveness (MOE’s) for each intersection approach by lane and traffic movement. This comprehensive list of MOE’s includes delay per vehicle, along with 50th percentile, 95th percentile and maximum queue lengths by lane. The primary benefit of SimTraffic is that it allows the analyst to view simulated traffic flows on the computer screen. The model results reported for each intersection or roadway segments are based on an average of results from five randomly seeded simulations. The SimTraffic modeling results for the 2006 unsignalized traffic conditions are presented in Table II-14 and Table II-15. The intersection of Route 236 and Portland Street is unsignalized, but during peak hours a police office is present to direct traffic. Police officers and crossing guards are also present at Norton Street, Central School, and Academy Street. As shown in Table II-14 and Table II-15, without a police officer, the Portland Street intersection would operate at a poor level of service. Other locations with a poor LOS are at the Route 236 and Route 4 intersection and at Academy Street.

Existing Conditions II-35
Table II-14 : Level of Service (LOS): Unsignalized Intersections – AM Peak Existing Conditions (2006)
Minor Street Major Street (Left Turners) EB WB NB SB Town Intersection
Delay (sec/veh) LOS Delay
(sec/veh) LOS Delay (sec/veh) LOS Delay
(sec/veh) LOS
Overall Intersection
Delay (sec/veh)
Kittery Route 236 / Exit 3 NB Off-Ramp - - 7 A - - - - 2
Kittery Route 236 / Exit 2 NB Off-Ramp 2 A - - - - - - 2
Kittery Route 236 / Exit 2 SB Off-Ramp 3 A - - - - - - 5
Eliot Route 236 / Bolt Hill Rd 14 B 9 A 13 B 0 A 8
Eliot Route 236 / Route 103 13 B - - - - - - 5 South Berwick Route 236 / Route 91 8 A 9 A 2 A 7 A 7
South Berwick Route 236 / Quarry Dr - - 22 C - - 5 A 6
South Berwick Route 236 / Vine St 17 C 24 C 7 A 9 A 8
South Berwick Route 236 / Route 4 - - **9 A *14 B - - 8
South Berwick Route 236 / Academy St - - 21 C - - 8 A 2
South Berwick Route 236 / Portland St. - - 100+ F - - 12 B 90
South Berwick
Route 236 / Portland St. (Signal to represent Police) - - 27 D - - 29 D 20
* Rte 236 Minor Approach
** Left-turn to Rte 236 SB taken from SimTraffic (average of 5 runs)

Existing Conditions II-36
Table II-15: Level of Service (LOS): Unsignalized Intersections – PM Peak (4:45 pm to 5:45 pm) Existing Conditions (2006)
Minor Street Major Street (Left Turners) EB WB NB SB Town Intersection
Delay (sec/veh) LOS Delay
(sec/veh) LOS Delay (sec/veh) LOS Delay
(sec/veh) LOS
Overall Intersection
Delay (sec/veh)
Kittery Route 236 / Exit 3 NB Off-Ramp - - 10 A - - - - 4
Kittery Route 236 / Exit 2 NB Off-Ramp 2 A - - - - - - 3
Kittery Route 236 / Exit 2 SB Off-Ramp 5 A - - - - - - 3
Eliot Route 236 / Bolt Hill Rd 12 B 25 C 13 B 11 B 11
Eliot Route 236 / Route 103 27 D - - - - - - 6 South Berwick Route 236 / Route 91 18 C 73 F 9 A 11 B 22
South Berwick Route 236 / Quarry Drive - - 87 F - - 17 C 13
South Berwick Route 236 / Vine Street 27 D 30 D 11 B 8 A 10
South Berwick Route 4 / Route 236 - - **15 B *100+ F - - 44
South Berwick Route 236 / Academy Street - - 100+ F - - 100+ F 38
South Berwick
Route 236 / Portland Street (Police Control) - - 35 15 - 31 22
South Berwick
Route 236 / Portland Street (Stop Sign Only) - - 100+ F 78 F 100+
* Rte 236 Minor Approach
** Left-turn to Rte 236 SB taken from SimTraffic (average of 5 runs)

Existing Conditions II-37
In addition to capacity analysis, a signal warrant analysis of eight intersections was performed to determine if traffic signal installation was warranted for further consideration as a possible improvement to these locations. According to the MUTCD, the satisfaction of a traffic signal warrant or warrants shall not in itself require or justify the installation of a traffic control signal. The signal warrants analysis is based on traffic volumes for an average day. Table II-16 presents a summary showing whether warrants that are satisfied at each of the intersections evaluated. At least one signal warrant is met at the Quarry Road, Route 4, and Portland Street intersections in South Berwick. Table II-16: Traffic Signal Warrant Analysis of Unsignalized Intersections for an Average Day
Warrant
Kittery
Exit 3 NB Off-Ramp
Kittery
Exit 2 SB Off-Ramp
Kittery McKenzie
Lane
South Berwick Route 91
South Berwick Quarry Road
South Berwick Route 4
South
Berwick Academy
Street
South
Berwick Portland
Street
Eight Hour Vehicular Volume No No No No No No No Yes
Four Hour Vehicular Volumes No No No No Yes Yes No Yes
Peak Hour N/A N/A N/A N/A N/A N/A N/A N/A Pedestrian Volume No No No No No No No No School Crossing N/A N/A No N/A No N/A No No Coordinated Signal Systems N/A N/A N/A N/A N/A N/A N/A N/A
Crash Experience No No No No No No No No Roadway Network No No No No No Yes No Yes
c. Signalized Intersections Level of service for signalized intersections is evaluated in terms of control delay per vehicle. Control delay includes initial deceleration delay, queue move-up time, stopped delay, and acceleration delay. The LOS criteria for signalized intersections are somewhat higher than the LOS criteria for unsignalized intersections. A signalized intersection is designed to carry higher traffic volumes and experience greater delay. The following table shows the level of service criteria. Table II-17: LOS Criteria for Signalized Intersections
Level of Service Control Delay (sec/veh) A Up to10 B 10.0 to 20.0 C 20.1 to 35.0 D 35.1 to 55.0 E 55.1 to 80.0 F Greater than 80.0

Existing Conditions II-38
Intersection operations along the Route 236 corridor are based on current geometry and signal timing and phasing. Levels of service analyses were conducted at four signalized intersections within the study area. The results of the intersection analysis under 2006 design hour traffic volume conditions are summarized in Tables II-18 and II-19. The four signalized intersections, as shown in Tables II-18 and II-19, operate overall at LOS B or LOS C. During the PM peak all four intersections operate at LOS C. Figure II-14 shows the overall delay (seconds/vehicle) for both signalized and unsignalized intersections along with the overall level of service for signalized intersections. For all of the intersections analyzed, the overall delay is generally lower for unsignalized intersections than for signalized intersections. The exceptions to this are the unsignalized intersections in South Berwick downtown area, which have overall delays that are often greater than the delays at signalized intersections elsewhere in the Route 236 corridor.

Existing Conditions II-39
Table II-18: Level of Service (LOS): Signalized Intersections – AM Peak Existing Conditions (2006) *
Municipality Intersection EB WB SB NB Overall
Delay (sec/veh) LOS Delay
(sec/veh) LOS Delay (sec/veh) LOS Delay
(sec/veh) LOS Delay (sec/veh)
LOS
Kittery Route 236 / Martin St 28 C 30 C 19 B 5 A 17 B
Eliot Route 236 / Beech Rd 18 B 26 C 14 B 12 B 15 B
Eliot Route 236 / Depot Rd 35 D 35 D 22 C 16 B 23 C
Eliot Route 236 / Route 101 38 D 17 B 25 C 22 C 26 C Table II-19: Level of Service (LOS): Signalized Intersections – PM Peak Existing Conditions (2006) * Municipality Intersection EB WB SB NB Overall
Delay (sec/veh) LOS Delay
(sec/veh) LOS Delay (sec/veh) LOS Delay
(sec/veh) LOS Delay (sec/veh)
LOS
Kittery Route 236 / Martin St 35 C 35 C 14 B 23 C 21 C
Eliot Route 236 / Beech Rd 27 C 27 C 11 B 27 C 23 C
Eliot Route 236 / Depot Rd 32 C 34 C 12 B 37 D 31 C
Eliot Route 236 / Route 101 30 C 27 C 21 C 25 C 25 C * Taken from SimTraffic (average of 5 runs)

Existing Conditions II-40
Figure II-14: Existing Level of Service

Future Conditions III-1
III. Future Conditions To evaluate the impact of future travel on the existing Route 236 corridor, hourly traffic volume conditions were projected to the year 2026. The procedure used was to estimate annual percentage increases based on historical trends and apply those increases to volumes within the study area. Two different growth rates were projected for the corridor study area. For most of the corridor, from Dana Road in Kittery to the intersection of Route 4/236 in South Berwick, the projected growth rate is approximately 2.0 percent per year (40% in 20 years). For the remainder of the corridor in Kittery and South Berwick, the projected growth rate is approximately 1.5 percent per year (30% in 20 years). The baseline analysis of 2026 conditions assumes that no major improvements, no new signals, and no new access points of any type are implemented within the time period of the study. Figure III-1 represents the projected 2026 average annual daily traffic (AADT) along the corridor study area.

Future Conditions III-2
Figure III-1: 2026 Annual Average Daily Traffic

Future Conditions III-3
A. Mobility and Operating Analysis The effects of projected year 2026 traffic volumes on intersection and roadway segment operating conditions were evaluated using the same analysis procedure described under Chapter II, Existing Conditions. 1. Roadway Future traffic operating conditions were evaluated along various segments of the study area roadways. The future roadway segment LOS results for the specific segments within the study area are shown in Table III-1. For the two urban segments, average travel speeds were derived from the SimTraffic modeling results. It should be noted that the average travel speed may not be truly represented because not all the future design hour volumes were able to enter the traffic simulation network because of intersection capacity constraints. On the urban street class I roadway segment from Exit 3 NB Off-Ramp to Dana Road in Kittery, the average travel speed will decrease from 44 mph to 41 mph, thus resulting in a decline from a LOS A to LOS B. On the urban street class III roadway segment from Route 4/236 to Portland Street (Route 4) in South Berwick, the level of service will decline from LOS D to LOS F, and the average travel speeds will decrease from 17 mph to less than 10 mph. The rural two-lane roadway segments will be either LOS E or LOS F. The future rural two-lane segments will decrease in average travel speed and increase in percent time-spent following. The two segments from Dana Rd to Depot Rd will be LOS F because of the high directionality of the PM traffic, which will exceed the one-lane capacity of these segments in the northbound direction of flow. As shown in Figure III-2, the five rural segments were analyzed in five year increments by increasing the volumes by 2.0 percent per year. The level of service will remain the same until year 2016. Between the years 2016 and year 2021, the level of service between Route 101 and Route 91 will decrease from LOS D to LOS E. Between the years 2021 and 2026, the level of service between Dana and Depot Road will decrease from LOS E to LOS F.

Future Conditions III-4
Table III-1: Level of Service (LOS): Roadway Segments - Future Conditions (2026)
Design Urban LOSSection Posted Category Street (Both Dir.)
Town From To Mileage Speed ClassKittery NB Off-Ramp Cross Over SB Off-Ramp Cross Over 0.225 45Kittery SB Off-Ramp Cross Over Dana Rd (End of 4-lanes) 0.2 45
0.425 High Speed I BATS = 40.8
Kittery Dana Rd (End of 4-lanes) Martin Road 0.385 45Kittery Martin Road MacKenzie Lane 0.35 45Kittery MacKenzie Lane Bolt Hill Road 0.335 45
Eliot Bolt Hill Road Drive For Boat Buisness (Begin 4-lanes NB) 0.545 45
Eliot Drive For Boat Buisness (Begin 4-lanes NB) Beech Road 0.37 35
1.985 Rural 2-Lane FATS = 31.2
PTSF = 92.1V/C = 0.79
NB V/C = 1.01
Eliot Beech Road Passamaquoddy (End 4-lanes NB) 0.216 35
Eliot Passamaquoddy (End 4-lanes NB) 35/45 mph Zone Change 0.216 35
Eliot 35/45 mph Zone Change Brad Street 0.363 45
Eliot Brad Street NB 15 mph School Zone Limit Lights 1.06 45
Eliot NB 15 mph School Zone Limit Lights Depot Road 0.17 45
2.025 Rural 2-Lane FATS = 30.8
PTSF = 89.4V/C = 0.77
NB V/C = 1.01
Eliot Depot Road SB 15 mph School Zone Limit Lights 0.095 45
Eliot SB 15 mph School Zone Limit Lights Ambush Rock Lane 0.8 45
Eliot Ambush Rock Lane Route 103 0.475 45Eliot Route 103 Heron Cove Road 0.285 45Eliot Heron Cove Road Route 101 0.12 45
1.775 Rural 2-Lane EATS = 38.9
PTSF = 90.4V/C = 0.70
NB V/C = 0.95
Eliot Route 101 End of SB Guard Rail 0.15 45Eliot End of SB Guard Rail 45/55 mph Speed Zone 0.239 45Eliot 45/55 mph Speed Zone Lord's Road 0.742 55
S. Berwick Lord's Road NB 15 mph School Zone Limit Lights 0.525 55
S. Berwick NB 15 mph School Zone Limit Lights
SB 15 mph School Zone Limit Lights 0.183 55
S. Berwick SB 15 mph School Zone Limit Lights 55/45 mph Speed Zone 0.539 55
S. Berwick 55/45 mph Speed Zone Route 91 0.304 452.682 Rural 2-Lane E
ATS = 43.3PTSF = 84.5V/C = 0.58
NB V/C = 0.83
S. Berwick Route 91 Quarry Drive 0.41 45
S. Berwick Quarry Drive Brattle St (Vaughan Woods) 0.214 45
S. Berwick Brattle St (Vaughan Woods) Vine St. (school area) 0.587 45
S. Berwick Vine St. (school area) 45/25 mph Speed Zone 0.321 45S. Berwick 45/25 mph Speed Zone Route 4 0.166 25
1.698 Rural 2-Lane EATS = 29.2
PTSF = 90.4V/C = 0.69
NB V/C = 0.84
S. Berwick Route 4 Academy St 0.078 25S. Berwick Academy St Route4/Portland St 0.12 25
0.198 Urban III F*Total 10.788 ATS = 9.6
Color Key School Zone 15 mph Flashing Lights Signalized Intersections
* The actual speed may be less because not all vehicles are able to enter the network.

Future Conditions III-5
Figure III-2: Future Level of Service: Rural Two-Lane Segments at 5-Year Intervals
Rte 4
Seg.5 E E E E E
Rte 91
Seg.4 D D D E E
Rte 101
Seg.3 E E E E E
Depot
Seg.2 E E E E F
Beech
Seg.1 E E E E F
Dana
2006
2011
2016
2021
2026
Year

Future Conditions III-6
2. Unsignalized Intersections The results of the intersection analysis under 2026 design hour traffic volume conditions are summarized in Table III-2 and Table III-3 for unsignalized intersections. As shown in Table III-2, most unsignalized intersections will operate poorly in PM peak-hour conditions. 3. Signalized Intersections Level of service analyses were conducted at four signalized intersections within the study area. The results of the intersection analysis under 2026 design hour traffic volume conditions are summarized in Table III-4 and Table III-5. The results show that all four intersections that operate at an overall LOS F under 2026 design hour conditions. Figure III-3 shows the overall delay for both signalized and unsignalized intersections, along with the overall level of service for signalized intersections. The future conditions LOS and delays based on projected volumes (historic growth) and assumes no major improvements to the corridor or intersections. Under future no-build conditions, except by the Interstate ramps, the majority of signalized and unsignalized intersections will have an overall delay of greater than 100+ seconds/vehicle. The following section of this report looks at alternatives to address the deficiencies thus improving the Route 236 corridor.

Future Conditions III-7
Table III-2: Level of Service (LOS): Unsignalized Intersections – PM Peak Future Conditions (2026)
Minor Street Major Street (Left Turners) EB WB NB SB Town Intersection
Delay (sec/veh) LOS Delay
(sec/veh) LOS Delay (sec/veh) LOS Delay
(sec/veh) LOS
Overall Intersection
Delay (sec/veh)
Kittery Route 236 / Exit 3 NB Off-Ramp - - 83 F - - - - 17***
Kittery Route 236 / Exit 2 NB Off-Ramp 3 A - - - - - - 3
Kittery Route 236 / Exit 2 SB Off-Ramp 11 B - - - - - - 4
Eliot Route 236 / Bolt Hill Rd 100+ F 100+ F 38 E 72 F 33
Eliot Route 236 / Route 103 100+ F - - 100+ F - - 100+*** South Berwick Route 236 / Route 91 100+ F 100+ F 14 B 81 F 100+***
South Berwick Route 236 / Quarry Dr - - 100+ F - - 17 C 100+***
South Berwick Route 236 / Vine St 87 F 100+ F 20 C 15 C 25***
South Berwick
Route 4 / Route 236 (Police Control) - - **31.4 D *100+ F - - 100+***
South Berwick Route 236 / Academy St - - 100+ F - - 100+ F 100+***
South Berwick
Route 236 / Portland St. (Police control) - - 100+ F - - 49 F 100+***
* Rte 236 Minor Approach ** Left-turn to Rte 236 SB*** Capacity constraints present some vehicles from passing through the intersection. Taken from SimTraffic (average of 5 runs)

Future Conditions III-8
Table III-3: Level of Service (LOS): Unsignalized Intersections – AM Peak Future Conditions (2026)
Minor Street Major Street (Left Turners) EB WB NB SB Town Intersection
Delay (sec/veh) LOS Delay
(sec/veh) LOS Delay (sec/veh) LOS Delay
(sec/veh) LOS
Overall Intersection
Delay (sec/veh)
Kittery Route 236 / Exit 3 NB Off-Ramp - - 16 C - - - - 5
Kittery Route 236 / Exit 2 NB Off-Ramp 2 A - - - - - - 3
Kittery Route 236 / Exit 2 SB Off-Ramp 3 A - - - - - - 4
Eliot Route 236 / Bolt Hill Rd 98 F 34 D 27 D 16 C 14
Eliot Route 236 / Route 103 100+ F - - 35 D - - 12 South Berwick Route 236 / Route 91 24 C 100+ F 34 D 9 A 34
South Berwick Route 236 / Quarry Dr - - 100+ F - - 10 B 60
South Berwick Route 236 / Vine St 49 E 100+ F 14 B 12 B 61
South Berwick
Route 236 / Route 4 (Police Control) 61 F 12 B 21 C - - 26
South Berwick
Route 236 / Academy St (Police Control) - - 36 E 22 C 3 A 14
South Berwick
Route 236 / Portland St. (Police Control) - - 100+ F 14 B 100+ F 100+
Taken from SimTraffic (average of 5 runs)

Future Conditions III-9
Table III-4: Level of Service (LOS): Signalized Intersections – AM Peak Future Conditions (2026) Taken from SimTraffic
Municipality Intersection EB WB SB NB Overall
Delay (sec/veh) LOS Delay
(sec/veh) LOS Delay (sec/veh) LOS Delay
(sec/veh) LOS Delay (sec/veh) LOS
Kittery Route 236 / Martin St 69 E 100+ F 39 D 7 A 36 D
Eliot Route 236 / Beech Rd 25 C 39 D 28 C 15 B 26 C
Eliot Route 236 / Depot Rd 48 D 65 E 100+ F 28 C 100+ F*
Eliot Route 236 / Route 101 84 F 69 F 100+ F 20 B 92 F *Capacity constraints prevent some vehicles from passing through the intersection. Table III-5: Level of Service (LOS): Signalized Intersections – PM Peak Future Conditions (2026) Taken from SimTraffic Municipality Intersection EB WB SB NB Overall
Delay (sec/veh) LOS Delay
(sec/veh) LOS Delay (sec/veh) LOS Delay
(sec/veh) LOS Delay (sec/veh) LOS
Kittery Route 236 / Martin St 82 F 100+ F 100+ F 100+ F 100+ F*
Eliot Route 236 / Beech Rd 34 C 28 C 16 B 100+ F 100+ F*
Eliot Route 236 / Depot Rd 58 E 52 D 17 B 100+ F 100+ F*
Eliot Route 236 / Route 101 43 D 84 F 100+ F 78 F 100+ F* Taken from Sim Traffic (average of 5 runs) *Capacity constraints prevent some vehicles from passing through the intersection.

Future Conditions III-10
Figure III-3: Future Level of Service
Future Conditions III-11
B. Future Uncertainty The analysis of the 2026 projections in the Route 236 Corridor Study provides a reasonable estimate of future conditions based on historic growth in the corridor. However, some external factors and trends, as discussed below, could have a substantial impact on future traffic volumes and congestion levels. The population of the United States is aging. As the wave of baby boomers, born between 1945 and 1965, enter their 60’s, 70’s, and 80’s, the driving habits of a large segment of population will change. Older people drive less and rely on public transportation more. This trend will tend to slow the growth of automobile travel. Recent experience in the last three years has shown that increases in the price of gasoline can reduce automobile travel. The future price of motor fuels is difficult to predict, but rising demand for fuel in rapidly growing economies in China, India, and other parts of the developing world will put increasing pressure on the petroleum supplies and upward pressure on energy prices. These pressures will push transportation in the United States more toward alternative fuels, fuel-efficient vehicles, and other modes of transportation. Transportation funding by conventional motor fuel taxes is becoming less able to keep up with financial demands of maintaining and improving the highway system. Recent trends of higher fuel prices and less dependence on gasoline and diesel fuels, coupled with rising highway and bridge construction costs, are creating a widening gap between revenues and needed expenditures. These trends will push policy makers to find new means of collecting revenue for transportation.

Alternatives IV-1
IV. Alternatives The alternatives chapter discusses different ways of addressing problems noted in existing conditions and expected for future conditions. Advantages and disadvantages are discussed for each alternative; the Recommendations chapter proposes which alternatives to pursue further. A. Kittery - Eliot - South Berwick This section focuses on alternatives for both intersections and roadway segments for the towns of Kittery, Eliot and South Berwick (south of the South Berwick Downtown area). The South Berwick Downtown area is considered in Section B.
1. Intersections (Alternatives) Intersection improvement alternatives were evaluated for the following intersections along the Route 236 corridor: Martin/Stevenson Road, Bolt Hill Road, Depot Road, Route 101 and at Route 91. a. Martin/Stevenson Road - Kittery The Martin/Stevenson Road intersection is signalized. Currently, the mainline northbound and southbound approaches to the intersection each have a through and a left-turn lane. However, the left-turn lanes do not have a protected left-turn phase (left green arrow). Adding a protected left-turn phase to the signal is a possible short-term alternative. At the Town’s request, this alternative was modeled, and a benefit/cost analysis was performed. The benefits (measured by the dollar value of annual time savings and annual crash savings) were compared with the improvement cost (measured by the annualized cost of construction). Adding an extra phase to the signal actually increased overall delay, so there were no annual time savings. However, given the intersection’s crash history, crash reduction benefits are realized from reducing the number of left-turn crashes. Given these benefits and the relatively low cost (estimated $10,000 for the Town to install an additional signal head), the benefit/cost ratio is over 23. A benefit/cost ratio greater than 1.0 indicates an improvement with benefits greater than the cost. Looking at future conditions, three alternatives were analyzed for this intersection: transportation demand management (TDM), 4 through lanes, and a 2-lane roundabout. Table IV-1 below shows the overall delay and volume to capacity ratio for future PM peak traffic volumes.

Alternatives IV-2
Table IV-1: Martin/Stevenson Road Alternatives 2026 PM
No-Build 2026 PM
TDM (-350)2026 PM 4-Lanes
2026 PM Roundabout
Overall Delay (sec/veh) 100+ 27 35 13 Volume/Capacity 1.07 0.88 0.71
The TDM alternative is the use of low-cost actions to modify travel behavior and thus remove a certain number of vehicles in the peak direction. The TDM alternative would remove 350 peak-direction vehicles in the peak hour. The 350 vehicles would come from the northbound flow of vehicles on Rte 236 during the PM peak hour. As table IV-1 indicates, the overall delay at the intersection would be reduced from 100+ seconds to approximately 27 sec/veh. This alternative would not require the widening of the intersection. The 4-lane alternative would require widening of the roadway for both northbound and southbound with 2 through lanes and a left-turn lane. The future overall delay in the PM peak hour would be reduced from (no-build) 100+ sec/veh to approximately 35 sec/veh with this alternative. As shown in Figure IV-1, widening of the roadway would impact the properties on both sides of the road. Figure IV-1: Martin / Stevenson 4-Lanes
The 2-lane roundabout alternative would be similar to the 4-lane alternative but instead of having a left-turn lane and a signal it would have a 2-lane roundabout. As shown in Table IV-1, the overall future PM peak hour delay would be reduced from 100+ sec/veh to 13 sec/veh. In Figure IV-2, the outer blue line shows the outside diameter of a 2-lane roundabout, and its right of way impacts on the two buildings on the corners.

Alternatives IV-3
Figure IV-2: Martin / Stevenson Roundabout
a. Bolt Hill Road- Eliot The Bolt Hill Road intersection is unsignalized. Currently, the mainline northbound and southbound approaches have one lane and both Bolt Hill Road approaches also have one lane. A flashing beacon was installed in late 2007, but it has not been activated. The intersection has been a high crash location (HCL). To address the HCL, a left-turn lane for the mainline approach in both directions was evaluated as shown in Figure IV-3. The left-turn vehicles would be protected from through traffic by a raised island. According to the Federal Highway Administration Report No. FHWA-RD-02-089, for installation of left-turn lanes on both the major-road approaches to rural intersections, the expected percentage reduction in total intersection crashes is 48%. Even with the expected reduction in crashes, this alternative’s benefit/cost ratio is only 0.14.

Alternatives IV-4
Figure IV-3: Bolt Hill Left-Turn Lanes
Four different alternatives were analyzed for the intersection to address future conditions delays on Bolt Hill Road and the high crash location: TDM, 4 through lanes (with the left-turn lane), 2-Lane Roundabout, and a future signal (with 4 through lanes). Table IV-2 summarizes the overall delays and volume to capacity ratio for future PM peak traffic volumes. Table IV-2: Bolt Hill Road Alternatives
2026 PM No-Build
2026 PM TDM (-350)
2026 PM 4-Lanes Lt. Turn
Ln
2026 PM 4-Lanes
Roundabout
2026 PM4-Lanes Signal
Ovelall Delay (sec/veh) 33 6 4 12 5
Volume/Capacity n/a n/a n/a 0.56 The Travel Demand Management (TDM) alternative would reduce peak-direction flow by 350 vehicles in the peak hour. As Table IV-2 indicates, the overall delay at the intersection would be reduced from 33 sec/veh to approximately 6 sec/veh. The delay for the Bolt Hill Road approaches would decrease from 100+ sec/veh (both approaches) to 17 sec/veh on the eastbound approach and to 24 sec/veh on the westbound approach. This alternative would not require the widening of the intersection but would not help to reduce the rear-end crashes for vehicles turning left from Route 236. The 4-lane alternative would require widening of the mainline roadway for both northbound and southbound with 2 through lanes and a left-turn lane on the Route 236

Alternatives IV-5
approaches. The overall delay would be reduced from 33 sec/veh (no-build) to approximately 4 sec/veh with this alternative. The delay for Bolt Hill Road would decrease from 100+ sec/veh (both approaches) to 10 sec/veh on the eastbound approach and to 24 sec/veh on the westbound approach. This alternative would require the widening of the intersection and would help to reduce rear-end crashes (for vehicles turning left from the mainline). The 2-lane roundabout alternative would be similar to the 4-lanes alternative, but instead of having a left-turn lane, it would have a 2-lane roundabout. As shown in Table IV-2, the overall future PM delay would be reduced from 33 sec/veh to 12 sec/veh. The delay for Bolt Hill Road would decrease from 100+ sec/veh (both approaches) to 4 sec/veh on the eastbound approach and to 17 sec/veh on the westbound approach. The last alternative would have 4 lanes with a protected left-turn lane and a signal. As shown in Table IV-2, the overall future PM delay would be reduced from 33 sec/veh to 5 sec/veh. The delay for Bolt Hill Road would decrease from 100+ sec/veh (both approaches) to 10 sec/veh on the eastbound approach and to 16 sec/veh on the westbound approach. c. Depot Road- Eliot The Depot Road intersection is signalized. Currently, the mainline has a left-turn lane and thru-lane in each direction and the side street has a one-lane approach in each direction. Cedar Road runs parallel to Route 236 close to the Depot Road intersection. Although traffic volumes on Cedar Road are relatively low, these vehicles must negotiate what is essentially a 5-way intersection. In particular, large trucks southbound on Route 236 must make a virtual U-turn to reach local businesses on Cedar Road; this is further complicated by queued traffic on Depot Road. Currently, there are long queues in the PM in the northbound direction. There are challenges presented by the close proximity of Cedar Road. There is a steep slope in between Route 236 and Cedar Road, which makes connecting these two roads in another location difficult. Three different alternatives for addressing existing conditions were analyzed: no-build with a signal for Cedar Road, 4-through lanes (with a left-turn lane), and 4 lanes with a signal for Cedar Road. Table IV-3 summarizes the overall delays and the V/C ratios for existing PM peak traffic volumes.

Alternatives IV-6
Table IV-3: Depot Road Existing Alternatives 2006 PM
No-Build
2006 PM No-Build w/
Cedar Rd Signal
2006 PM 4-Thru Lanes
On Rte 236
2006 PM 4-Thru Lanes
Cedar Rd Signal
Overall Delay (sec/veh) 31 52 9 31
Volume/Capacity 0.92 0.96 0.5 0.63 The Cedar Road signal alternative would add a signal at the Cedar/Depot intersection and this new signal would work in conjunction with the existing Route 236/Depot Road signal. The added phases would increase the delay from an overall delay of 31 sec/veh to 52 sec/veh and increase the volume to capacity ration from 0.92 to 0.96. An increase in delay results when Cedar Road gets the green signal because no other movements can be allowed (including the Depot westbound approach). Also, eastbound Depot Road vehicles would have to stop west of the Cedar Road, which would increase signal clearance times for eastbound vehicles. While this alternative may help prevent vehicles from blocking Depot Road, it makes the overall delay worse. The second alternative, shown in Figure IV-4, would add protected left-turn lanes in each direction on the mainline and two through lanes (400 feet upstream of the intersection and 1000 feet downstream) in each direction on the mainline. It would also add a left-turn lane on both Depot Road approaches. As indicted in Table IV-3, delay (for existing traffic volumes) would be reduced from 31 sec/veh to approximately 9 sec/veh. The benefit/cost ratio for this alternative is 2.1. Figure IV-4: Depot Road

Alternatives IV-7
The third alternative is the same as the second on the mainline, but would add a signal phase for Cedar Road. As shown in Table IV-3, this alternative does not reduce delay at all; it has a -0.06 benefit to cost ratio. For the short term, each of these three alternatives has advantages and disadvantages. The next step was to analyze the same three alternatives using expected volumes for the year 2026. In addition, the TDM option was analyzed for 2026 conditions. Table IV-4 summarizes the overall delay and volume-to-capacity ratios for these four alternatives for future PM peak traffic volumes. Table IV-4: Depot Road Future Alternatives
2026 PM No-Build
2026 PM No-Build w/ Cedar Signal
2026 PM TDM(-350)
2026 PM
4-Lanes
2026 PM 4-Lanes
Cedar Signal Overall Delay (sec/veh) 100+ 100+ 60 21 43
Volume/ Capacity 1.25 1.35 0.95 .62 .92
The no-build with a signal for Cedar Road alternative would increase the volume to capacity ratio from 1.25 to 1.35. This alternative would not work under future projected conditions. The transportation demand management (TDM) alternative would reduce peak-direction flow by 350 vehicle in the peak hour. As Table IV-4 indicates, the overall delay at the intersection would be reduced from 100+ sec/veh to approximately 60 seconds/vehicle. This alternative would not require the widening of the intersection. The 4-lane alternative would require widening of the roadway for both northbound and southbound with 2-through lanes and a left-turn lane, and widening on Depot Road for the left-turn lane. The overall delay would be reduced from 100+ sec/veh (No-Build) to approximately 21 sec/veh with this alternative. This alternative would require widening, which would bring Route 236 closer to Cedar Road. The last alternative is the 4-lanes but with a signal at Cedar Road that would work in conjunction with the Depot Road signal. As shown in Table IV-4, the overall future PM delay would be reduced from 100+ sec/veh to 43 sec/veh and the V/C ratio from 1.25 to 0.92. Both of the 4-lane alternatives include new raised islands on Route 236; southbound Rte 236 traffic could no longer turn left into the southern driveway of the school. Traffic flow into and out of the school would have to be addressed. d. Route 101- Eliot The Route 101 intersection is signalized and skewed. Currently, the mainline has a left-turn lane and thru-lane in each direction and the side street has a one lane approach for

Alternatives IV-8
the westbound approach and a right turn lane in the eastbound approach. Also, the Route 236 northbound left (toward Dover, New Hampshire) has a protected left arrow but the southbound lefts do not. The intersection is a high crash location. The skew of the intersection makes it very wide and future long delay and poor level of service. Two different alternatives for addressing existing conditions were analyzed: No-Build with adding a lagging southbound protected left-turn phase to the signal, and 4-through lanes (with left-turn lanes). Table IV-5 summarizes the overall delays and volume to capacity ratio for existing PM peak traffic volumes. Table IV-5: Route 101 Existing Alternatives 2006 PM
No-Build
2006 PM No-Build w/
Protected SB Lefts
2006 PM 4-Thru Lanes
On Rte 236 Overall Delay (sec/veh) 25 26 17
Volume/Capacity 0.75 0.72 0.57 The first alternative, adding a protected left-turn phase for Route 236 southbound, would provide protection for southbound lefts. Because of the skew of the intersection, the protected phase should be lagging (there could be conflicts with concurrent lefts because of the roadway alignment). In the three-year period, 24 crashes occurred at the intersection of which two involved southbound left-turners. As indicated in Table IV-5, delay (for existing traffic volumes) would increase from 25 sec/veh to 26 sec/veh. The benefit/cost ratio for this alternative is 0.34. The second alternative, shown in Figure IV-5, would add protected left-turn lanes in each direction on the mainline and two through lanes (400 feet upstream of the intersection and 1000 feet downstream) in each direction on the mainline. As indicated in Table IV-5, delay (for existing traffic volumes) would be reduced from 25 sec/veh to approximately 17 sec/veh. The benefit/cost ratio for this alternative is 0.38.

Alternatives IV-9
Figure IV-5: Route 101
For the short-term, each of the alternatives had a low benefit/cost ratio. The next step was to analyze different alternatives using expected volumes for the year 2026. Table IV-6 summarizes the overall delay and volume to capacity ratios for two alternatives for future PM peak traffic volumes. Table IV-6: Route 101 Future Alternatives 2026 PM
No-Build
2026 PM No-Build w/ TDM (-350)
2026 PM 4-Thru Lanes
On Rte 236 Overall Delay (sec/veh) 100+ 100+ 32
Volume/Capacity 1.03 .94 0.70 The transportation demand management (TDM) alternative of removing 350 through vehicles in the peak northbound direction would not be adequate for future conditions at this intersection. Because of the heavy northbound lefts (to New Hampshire), more than 350 peak-hour (through and left-turn) vehicles would need to be removed from the intersection in the future. The four-lane alternative as described above, and as indicated in Table IV-6, would reduce the future delay from 100+ sec/veh to 32 sec/veh. As shown in Figure IV-5, this alternative would require widening. A restaurant business in the southwest quadrant is very close to Route 236, so the mainline of Route 236 would most likely be widened on the east side and would require lowering the grade for Route 101 westbound (in order to avoid an abrupt change in grade where Route 236 and Route 101 would come together).

Alternatives IV-10
This alternative would address mobility issues, but could have right-of-way impacts. It would not rectify the skew of the intersection. e. Route 91- South Berwick The Route 91 intersection is skewed intersection (like the Rte 101 intersection ) but unsignalized. Before the fall of 2007, the mainline had a through lane in each direction. The two side streets (Rte 91 and Old South Road) have one-lane approaches with triangular raised islands, which direct traffic turning left (out onto Route 236) to a point downstream of the main intersection. This arrangement has the disadvantage that, if more than a couple of side-street vehicles are waiting to turn left, the vehicles queue out onto the side street and are at risk of being struck by traffic turning left off of Route 236. Also, with the old configuration, vehicles southbound on Route 236 would often ride on the wrong side of the road prior to turning left onto Route 91 (perhaps out of fear of being rear-ended by Route 236 SB through traffic). The intersection is a high crash location. The AM peak hour has over 200 southbound vehicles turning left onto Route 91, which is enough to warrant a left-turn lane. Based on this early finding (recommendation) the Corridor Committee, the intersection was re-striped in the fall of 2007, as shown in Figure IV-6. The northbound traffic was shifted (by a striped island) to provide room for a striped southbound left- turn lane. The striping improvement helped to provide better guidance through the intersection and to improve safety for southbound left-turning traffic. Figure IV-6: Route 91
The short-term improvements do not address the future (2026) delay or the skew of the intersection. Table IV-7 summarizes the overall delay for five different alternatives for future PM peak traffic.

Alternatives IV-11
Table IV-7: Route 91 Future Alternatives
2026 PM No-Build
2026 PM Alt. 1
2026 PM Alt. 2
2026 PM Alt. 3
2026 PM Alt. 4
2026 PM Alt. 5
Overall Delay (sec/veh) 100+ 100+ 100+ 100+ 23 32
Vol./Capacity n/a n/a n/a n/a n/a 0.69 Alternative 1, transportation demand management would remove 350 vehicles in the northbound direction on Route 236. As shown in Table IV-7, the removal of 350 vehicles would not be adequate for future conditions. Alternative 2, shown in Figure IV-7, would split the intersection into two Tee intersections. Delay (for Alternative 2) would decrease somewhat, but would still be unacceptable at over 100 sec/veh. Because of the close proximity of the two intersections, queued SB left-turning traffic would block Old South Road. Another problem with this alternative is that there would be more right-of-way impacts, especially in the northwest corner. Figure IV-7: Route 91 Alternative 2
Alternative 3, shown in Figure IV-8, would relocate Route 91 further south to the old rail line that is currently occupied by two power lines and two gas lines. While this would help resolve the southbound left-turn queue, it would not help with the future delay for the intersection. Another advantage of re-locating Route 91 is that it may have a better sight distance than at the current location.
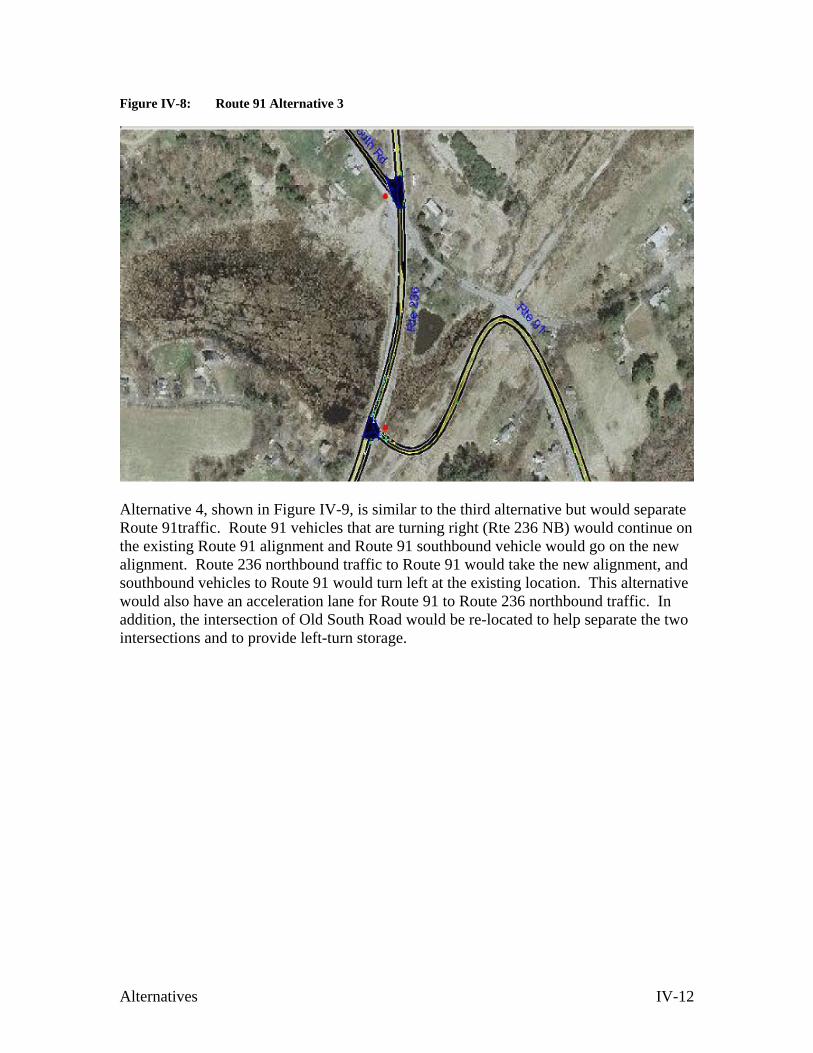
Alternatives IV-12
Figure IV-8: Route 91 Alternative 3
Alternative 4, shown in Figure IV-9, is similar to the third alternative but would separate Route 91traffic. Route 91 vehicles that are turning right (Rte 236 NB) would continue on the existing Route 91 alignment and Route 91 southbound vehicle would go on the new alignment. Route 236 northbound traffic to Route 91 would take the new alignment, and southbound vehicles to Route 91 would turn left at the existing location. This alternative would also have an acceleration lane for Route 91 to Route 236 northbound traffic. In addition, the intersection of Old South Road would be re-located to help separate the two intersections and to provide left-turn storage.

Alternatives IV-13
Figure IV-9: Route 91 Alternative 4
As Table IV-7 indicates, this alternative has the shortest amount of delay and it wouldn’t need to be signalized. However, there would right-of-way impacts associated with the existing location of the utilities on the old rail line. Alternative 5, shown in Figure IV-10, would signalize the intersection. It would construct protected left-turn lanes in each direction on the mainline and 2 through lanes (400 feet upstream of the intersection and 1000 feet downstream) in each direction on the mainline. The triangular raised islands on the side streets would be only for traffic turning right off the mainline; side street traffic turning left onto the mainline would have to go through the main intersection. This would eliminate the potential for queued left-turners (on the side street) being struck by traffic turning left off the mainline.

Alternatives IV-14
Figure IV-10: Route 91 Alternative 5
As indicated in Table IV-7, delay would be reduced from 100+ sec/veh to 32 sec/veh. This alternative would improve the safety of the intersection by having protected left-turn lanes. This alternative would improve safety for the side road lefts by bringing them into the intersection. This alternative would still be a skewed intersection and will have right-of-way and environmental impacts. The benefit/cost ratio for this alternative is 0.55.
2. Roadway Segments Network (Long-Term Alternatives) This section will look at different long-term alternatives evaluated to address the two roadway segments (in section III A.1) that would be LOS F (from Dana Road in Kittery to Depot Road in Eliot) under projected future conditions. These long-term alternatives were modeled using Synchro/SimTraffic traffic simulations. Table IV-8 is a summary of the future 2026 PM peak for the segments overall (from Dana Road to Depot Road) and for the intersections from Martin Road to Depot Road.

Alternatives IV-15
Table IV-8: Dana Rd to Depot Rd Roadway Alternatives
2026 PM No-Build
2026 PM TDM (-350)
2026 PM 4-Lanes w/ Intersection
Improvements
2026 PM 4-Lanes w/
Roundabouts
Simulation Model Travel Distance
(Veh.-Miles Traveled) 9394 8397 10068 10134
Travel Time (Veh.-Hours Traveled) 460 252 256 276
Total Delay(veh- hrs) 280* 89 62 57 Dana to Depot Rd.
NB Avg. Speed (mph) 23 34 40 37 SB Avg. Speed (mph) 37 42 44 41
Overall Avg. Speed (mph) 29 38 42 39
LOS (Urban St. Class 1) C B A/B A/B LOS (Rural 2-Lane) F E N/A N/A Intersections Depot Road Delay (sec/veh) 100+ 60 21 21
Beech Road Delay (sec/veh) 100+ 24 24 19
Bolt Hill Road Delay (sec/veh) 33 6 4 12
Martin/Stevenson St. Delay (sec/veh) 100+ 27 35 22
Key: Signalized Roundabout Unsignalized Note: Taken from SimTraffic (average of 5 runs) * Not all future design hour vehicles (163) are able to enter network due to capacity constraints. The first part of Table IV-8 describes travel in the overall traffic simulation model. The travel distance is the summation of the number of vehicles times the distance traveled in the model. The travel time is a total of the time each vehicle was present in the model. The travel time includes time spent by vehicles being denied into the network (due to capacity constraints). Total delay is equal to the total travel time minus the travel time for the vehicle with no interference from other vehicles or traffic control devices. Total delay also includes all time spent by denied entry vehicles while they are waiting to enter the simulated area of the model. The average speed is calculated by dividing the total distance by total time in the model. Average speed is weighted by volume, and includes stopped time and denied entry time. The time use in calculation for average speed does not include time spent by denied entry vehicles while they are waiting to enter the network. The LOS for the different

Alternatives IV-16
alternatives is based on the average speed determine by the model. The last section is a summary of the overall intersection delays. a. Transportation Demand Management Alternative The transportation demand management (TDM) alternative is the use of low-cost actions to modify travel behavior by encouraging people to share rides, telecommute, use transit, or change their travel route. By definition TDM does not include physical improvements to the roadway or network being considered. For purposes of this Corridor Study, the TDM alternative simply analyzed how many vehicles would need to be removed from the peak direction in the future to improve the level of service from F to E. The first step in doing this was to identify those roadway segments that, under 2026 future conditions, would have a LOS F. It was determined that the roadway segments between Dana Road and Depot Road would have LOS F under 2026 conditions, and that the Depot Road intersection was the worst bottleneck in that 4-mile section. Looking at the volumes at the Depot Road intersection, it was found that 350 vehicles per hour (in the peak direction in the peak hour) would need to be removed in order to achieve a LOS E for the intersection. The 350 vehicles would come from the northbound vehicles on Route 236. Besides improving 2026 intersection LOS, the removal of 350 vph would also improve LOS on the roadway segments between Dana Road and Depot Road. These segments are LOS F because the directional volume exceeds the one-lane capacity. The maximum directional lane capacity is 1,700 passenger cars/hour (pc/hr). The 2026 volumes for Dana Road to Depot Road exceed this by less than 50 pc/hr, but this is enough to make them LOS F. It also should be noted that the approximate 2-miles from Depot Road to Route 101 will be (by 2026) just below the 1,700 pc/hr maximum; thus its predicted LOS E could easily slip to LOS F. The TDM alternative, in theory, preserves LOS E by removing 350 vehicles per hour in the peak direction in the PM peak hour. However, 350 vehicles in the peak hour is approximately 15% of the expected 2026 traffic volume. Under ideal conditions in urban areas, the most that can be expected from use of TDM options is approximately 10% reduction. So in this rural area, with no existing transit, it would be difficult even to attain a 10% reduction. In this setting, TDM might consist of mostly car pooling and van pooling. While TDM as a stand-alone alternative would not realistically address projected future capacity problems, it may be very useful in conjunction with other alternatives. As explained further in the Recommendations chapter, it makes sense to begin working on TDM in the near-term in order to be able to use it to its fullest potential in the long term.

Alternatives IV-17
b. 4-lane Alternatives (with signals) The 4-lane alternative would require widening of the roadway for both northbound and southbound with 2-through lanes with a raised median. Given the high volume of traffic today and in the future, the roadway would have a raised median. The raised median would be wide enough to allow breaks for turn-arounds at quarter and half mile intervals depending on the long-term plan for the corridor. This option would include intersection improvements at Martin Road, Bolt Hill Road and Depot Road as described in section IV-1. As indicated in Table IV-8, the average speed of the roadway would be increased from 23 mph (No-build) to 42 mph and the delay at the intersection would be reduced. Because this option would be 4-lanes it would no longer be considered a 2-lane rural roadway, the level of service for an urban street Class 1 would be LOS A/B. This alternative would be very expensive and would require further study under the Maine Sensible Transportation Act and NEPA process, which would require that all reasonable alternatives be considered before additional through lanes would be built. c. 4-lane Alternative (with roundabouts) The 4 intersections with roundabouts alternative is the same as the second option but instead of having signal intersections at Martin and Beech would have roundabouts. This option also had a roundabout at Bolt Hill Road. Roundabouts are very useful in access-managed corridors because they allow for U-turns. Depot Road was not analyzed for a roundabout because it is in a more rural section of the corridor. As indicated in Table IV-8, the average speed is less than the 4 lane option with signals. The roadway level of service for an urban street Class 1 is also LOS A/B. As with the 4- lane option with signals, this option would have to go through the Maine Sensible Transportation Act and NEPA process. B. South Berwick Village (Downtown) The Downtown area considered is on Main Street between the Route 236 intersection and Portland Street. Different alternatives were evaluated, keeping in mind issues raised in the South Berwick’s Comprehensive Plan, such as congestion, parking and strengthening the downtown businesses while preserving the aesthetics and character of the Village Area. Current AADT is over 20,000 vehicles per day, resulting in congestion in the area. Drivers have been known to avoid the congestion by using Highland Avenue, Norton Street and other local streets. Congestion lessens when the schools in the area are not in session. 1. Intersections (Short-Term Alternatives) This section focuses on different short-term alternatives for the intersections of Main Street/Portland Street and Main Street/Route 236.

Alternatives IV-18
a. Portland Street The Portland Street T-intersection is unsignalized but is controlled by a police officer during peak periods. Currently, the northbound approach to the intersection has a through lane and a right-turn lane, the southbound approach has one lane and the westbound approach (Portland Street) has a left-turn lane and right-turn lane. Several signal alternatives were analyzed: a signal with the existing lane configuration, a split phase signal, eliminating the southbound lefts onto Portland Street, and a southbound left-turn lane. Table IV-9 below shows the overall delay and the volume/capacity (V/C) ratio for the existing and future peak conditions. Table IV-9: Portland Street Alternatives
Alternative 2006 AM
Peak Delay (sec/veh)
2026 AM Peak Delay
(sec/veh)
2006 PM Peak Delay
(sec/veh)
2026 PM Peak Delay
(sec/veh) Police Officer 20 100+ 22 100+ Signal (existing lane configuration)
17 (V/C=0.70)
32 (V/C=.85)
25 (V/C=0.67)
100+ (V/C=.96)
Split Phase Signal 32 (V/C=0.85)
93 (V/C=1.07)
23 (V/C=0.91)
100+ (V/C=1.12)
No Rte 236 SB Lefts 14 (V/C=0.70)
21 (V/C=0.85)
10 (V/C=0.57)
13 (V/C=0.72)
Rte 236 SB Left-Turn Lane
14 (V/C=0.65)
24 (V/C=0.82)
16 (V/C=0.70)
20 (V/C=0.81)
Adding a signal at the intersection of Portland Street will help vehicles exit Portland Street when the police officer is not present. As shown in Table IV-9, adding a signal during peak times doesn’t improve the overall delay when compared to a police officer. It should be noted that the delay for a police officer is approximate. The police officer function was modeled in traffic simulation as a signal, but the simulation cannot replicate the officer’s ability to continuously adapt timing in response to changing traffic situations. Any alternative that involves adding a signal would require the removal of approximately 7 parking spaces on the west side of Main Street. One problem with keeping the existing lane configuration is that southbound vehicles turning left onto Portland Street block the southbound through vehicles, and thus create long southbound queues and delays. To solve the problem of southbound left turners (onto Portland Street), the alternative of a split phase signal was analyzed. With a split phase signal, southbound vehicles would be the only movement, then northbound vehicles, and then westbound vehicles (from Portland Street). This alternative increased the delay and the volume/capacity ratio. Another alternative was to prohibit Route 236 southbound traffic from turning left onto Portland Street. This alternative had the shortest delay and the lowest volume/cost ratio but would not be practical because of the

Alternatives IV-19
loss of continuity of State Route 236 to Route 4. (These vehicles would have to travel on village streets.) The last alternative was to add a Route 236 southbound left-turn lane at the intersection. As shown in Figure IV-11, this alternative does allow storage for southbound left-turners and it doesn’t impede southbound through traffic. This signal and lane configuration alternative would continue to work well in the future. However, it would mean losing an additional 10 parking spaces on the east side of Route 236. Figure IV-11: Portland St. SB Left-Turn Lane Alternatives
b. Route 236/Main Street The Route 236 / Main Street T-intersection is unsignalized, with the northbound Route 236 traffic controlled by a stop sign. The main problem at the intersection is in PM conditions, with long delays and queues for Route 236 northbound traffic. The Route 236 northbound approach has a right-turn lane and left-turn lane. The Rte 236/4 southbound approach has a left-turn lane and a through lane (to New.Hampshire), and the Route 4 approach (from New Hampshire) has one lane but is wide enough for a right-turn lane. Three alternatives were analyzed for this intersection: a signal, a roundabout, and a signal with free right turns. Table IV-10 below shows the overall delays and the volume/capacity ratio for existing and future peak traffic volumes.

Alternatives IV-20
Table IV-10: Route 236/4 Alternatives
Alternative 2006 AM
Peak Delay (sec/veh)
2026 AM Peak Delay
(sec/veh)
2006 PM Peak Delay
(sec/veh)
2026 PM Peak Delay
(sec/veh) Baseline 8 26 44 100+ Signal (existing lane configuration)
17 (V/C=0.72)
49 (V/C=0.93)
38 (V/C=0.95)
100+ (V/C=1.24)
Roundabout (2-lanes) 7 14 8 16 Signal (free rights-added NB lane)
9 (V/C=0.75)
18 (V/C=0.86)
13 (V/C=0.70)
43 (V/C=0.83)
The signal (with existing lane configuration) alternative has a volume to capacity ratio of 0.95 for existing pm conditions. During the am peak, the overall delay would increase if a signal were installed with the existing lane configuration. Roundabout alternatives were evaluated at the Town’s request. As part of the roundabout alternative, to address the long delays and queues at Academy Street, Academy Street would be right turn in and right turn out only. Route 236 southbound lefts would not be able to enter Academy St., but instead would continue south to the roundabout, make a U-turn and then turn right into Academy Street. Vehicles exiting left out of Academy would instead go southbound on Academy to Vine Street., take Route 236 northbound to the roundabout and then turn left onto Route 4. Given the high volume of rights from Route 236 to Main Street, lefts from Main Street to Route 236, relocated Academy Street traffic, and future volumes, a 2-lane roundabout would be required. The roundabout alternative did improve the delay at the intersection, but as shown in figure IV-12, would have severe right of way impacts. The outer blue line shows the outside diameter of a 2-lane roundabout.

Alternatives IV-21
Figure IV-12: Route 236/4 Roundabout 2-Lane Alternative
The third alternative is a signalized intersection with free right turns. The northbound Route 236 right turning vehicles would not enter through the signalized intersection but would have their own lane to merge onto Main Street as shown in Figure IV-13. This alternative would reduce the pm delay and queues, and work well (43 sec/veh) in the future. The alternative would require widening and it would also have right of way impacts. However, for this to operate well the added lane would have to continue to Portland Street, to allow sufficient distance for traffic to merge and weave.

Alternatives IV-22
Figure IV-13: Route 236/4 Signalized Free Right Alternative
2. Roadway Segments Network (Long-Term Alternatives) This section will look at different long-term alternatives evaluated to address the congestion in the South Berwick Downtown area. These long-term alternatives consider the Downtown area as a whole. Table IV-11 is a summary of the future 2026 PM peak for network level and for the intersections at Route 236/Main Street and at Main Street/ Portland Street.

Alternatives IV-23
Table IV-11: South Berwick Village Roadway Alternatives 2026 PM
No-Build
2026 PM Downtown
(TSM)
2026 PM TDM (-700)
2026 PM Northern Bypass
2026 PM Southern Bypass
Simulation Model Travel Distance (Veh-Mi. Traveled) 2646 3512 2610 3420 3483
Travel Time (Veh-Hr. Traveled) 580.2 191 141.6 544.5 152.4
Average Speed (mph) 5 18 18 6 23
Total Delay (vehicle hours) 494* 78 58 430** 43
Intersections Main / Portland St. Delay (sec/veh) 100+ 20 80 6 11
Rte. 236 / Main St. Delay (sec/veh) 100+ 43 19 100+ 22
Key: Signalized Unsignalized Note: Taken from SimTraffic (average of 5 runs) * Not all future design hour vehicles (649) are able to enter network due to capacity constraints. ** Not all future design hour vehicles (614) are able to enter network due to capacity constraints. a. Downtown Option (TSM) The downtown option would widen Main Street to accommodate future traffic and provide for a reasonable level of service. It is based upon the intersection alternatives discussed in the previous section. As shown in figure IV-14, this includes the free right turns at the intersection of Route 236 and a southbound left-turn lane at the Portland Street intersection. Main Street between these two intersections would include two northbound lanes, and one southbound lane, while maintaining the two-way-left-turn lane (TWLTL) and the left-turn lane at Rte 236. This option would reduce the delays at both Route 236/Main Street and at Main/Portland Street, from 100+ seconds to 43 seconds and 20 seconds, respectively (see Table IV-11). However, this option would require widening that would affect the aesthetics and character of the Downtown Area. In addition, over 40 on-street parking spaces would be removed, which would leave virtually no on-street parking on Main Street. Off-street parking could be created to replace the loss of on-street parking.

Alternatives IV-24
Figure IV-14: Downtown Option
b. Transportation Demand Management Option The transportation demand management (TDM) option is the use of low-cost actions to modify travel behavior by encouraging people to share rides, telecommute, use transit, or change their travel route. This option simply analyzed how many vehicles would need to be removed from the peak direction in the future to have a LOS E. Approximately 700 vehicles (in the peak direction in the PM peak hour) would need to be removed from the network. The 700 vehicles would come from the northbound right turning traffic from Route 236 to Main St and the northbound vehicles on Route 4 (from New Hampshire). This option, in theory, would reduce the delays at both Rte. 236/Main Street and at Main/Portland Street from 100+ seconds to 19 seconds and to 80 seconds, respectively. However, 700 vehicles per hour is approximately 30% of the expected 2026 traffic volume. As explained in Section IV-2a, a 10% reduction is the most that can be expected, even in an urban area. Therefore, TDM is not a viable stand-alone option for future conditions. c. Northern Bypass Option The northern bypass option would convert Portland Street to one-way flow from the intersection of Main Street to east of Agamenticus Road. As shown in Figure IV-15, Route 236 northbound traffic would turn right at Portland Street then turn left at the bypass and turn right to continue onto Route 236. Route 4 southbound vehicles would turn right onto the bypass, continue the length of the bypass, and then turn left (southbound) on Route 236.

Alternatives IV-25
This option greatly reduced the delay at Portland Street intersection but does not solve the long-term delays at the Route 236/Main Street intersection. This option also greatly increased the vehicle*hours traveled and total delay compared to the other alternatives. The northern bypass option would have right of way, neighborhood and other impacts, and would require study under the National Environmental Policy Act (NEPA) and Sensible Transportation Policy Act (STPA) processes. Figure IV-15: Northern Bypass Option
d. Southern Bypass Option The southern bypass option would reduce traffic on Main Street by redirecting the traffic that is traveling northbound on Route 236 to Portland Street and the reverse traffic from Portland Street to Route 236 southbound. For purposes of this evaluation, it was estimated that 7,000 of the 20,000 AADT would be re-directed to the southern bypass. This is approximately 60 percent of the rights and lefts at Route 236/Main Street and Main/Portland Street. This estimate is based solely on the AADT volumes for the different roadways. A detailed origin/destination study would need to be done to confirm these numbers.

Alternatives IV-26
As shown in Table IV-11, this option had the least amount of overall delay with significant improvements at the two intersections compared to the other options. This option would not require any changes to Main Street or to the Route 236/Main Street intersection. Even with the southern bypass, long queues (during the 2026 PM peak hour) may occur at the Portland Street approach so the Portland Street intersection may need to be signalized for local traffic. The Southern Bypass option would not change the lane and parking configuration in the downtown area, but there would be impacts at the location of the bypass. The southern bypass option would have right of way, neighborhood and other impacts, and would require study under the National Environmental Policy Act (NEPA) and Sensible Transportation Policy Act (STPA) processes. Figure IV-16: Southern Bypass Option
Of the four options considered for the South Berwick Village, it appears that only the downtown option and the southern bypass would be effective in reducing congestion. The downtown option would affect the character of the downtown area. The southern bypass would have land impacts and would require further study under the NEPA and STPA.

Alternatives IV-27
C. Access Management Access management, although not studied in detail for this corridor, is a technique that would be helpful in preserving the Route 236 Corridor. Access management principles, applied to Route 236 or any other arterial corridor, will help protect the safety and efficiency provided by post and future corridor investments. This section describes several access management techniques that could be applied to this corridor. Although not part of the scope of work for this study, some background information and definitions of terms is provided below: 1. Access Management (definitions of and reasons for)
“Access management is the systematic control of the location, spacing, design, and operation of driveways, median openings, interchanges, and street connections to a roadway. It also involves roadway design applications, such as median treatment and auxiliary lanes, and the appropriate spacing of traffic signals. The purpose of access management is to provide vehicular access to land development in a manner that preserves the safety and efficiency of the transportation system.1” Many of the 40,000 fatalities and nearly 3 million injuries from motor vehicle crashes in the United States each year could have been prevented through access management.
2. Service Road: A service road is a public or private road, auxiliary to an arterial roadway that provides access to parcels adjacent to the arterial. Hanscom Road in Eliot could be utilized as a service road for properties adjacent to Route 236. 3. Nontraversable (Raised) Median: A “raised” (nontraversable) median is a divider that separates opposing traffic streams and is designed to actively discourage or prevent vehicles from crossing into or over the opposing lane. According to the Access Management Manual, raised medians have the following advantages:
• They physically separate vehicles traveling in opposite directions and can be designed to greatly reduce the potential for head-on collisions.
• They provide specific, clearly identifiable locations at which left turns can be made.
• They can be built with left-turn median openings, which provide space for deceleration, and safe “storage” free of the through traffic lanes.
1 Transportation Research Board of the National Academies, Access Management Manual, Committee on Access Management, Washington, D.C., 2003.

Alternatives IV-28
• They permit design of directional median openings, which are commonly used for left turns and U-turns.
• They reduce the number of left-turn vehicular conflicts with pedestrians and bicyclists.
• They provide a suitable location for refuge areas for pedestrian crossing. • They result in less delay to through vehicles than a two-way left-turn lane
(TWLTL) • Roadways with non-traversable medians are safer than undivided roadways or
those with continuous TWLTL, because the median allows fewer opportunities for conflict and erratic movements. In urban areas, undivided highways had 9.0 accidents per million vehicle miles as compared with 6.9 for TWLTLs and 5.6 for nontraversable medians.2 This represents a 38 percent difference in the crash rate between undivided highways and non-traversable medians.
An example of effectiveness of a raised medium is Western Avenue in Augusta. This four-lane roadway has two adjacent sections: one with a raised island (0.25 miles) and the other undivided (0.22 miles). The 2003 AADT is 28,290 for these adjacent sections. In a three year period a total of 7 crashes were reported for the raised-island section vs. 31 crashes for the undivided section. Furthermore, injury crashes were much fewer for the raised-island section (1 vs.10).
• The number and complexity of conflicts are reduced within the functional area of an intersection. The length of turn bays at signalized intersections is based on the queue lengths for future volumes. The turn bays are also protected by raised islands. “Safety is enhanced, because through traffic is allowed to maneuver through the intersection without conflicts with turning vehicles that are leaving and entering the roadway, and intersection capacity is improved.”
4. Signal Spacing
“Closely spaced or irregularly spaced traffic signals on arterial roadways result in frequent stops, unnecessary delay, increased fuel consumption, excessive vehicular emissions, and high crash locations. Alternatively, long and uniform signal spacing allows timing plans that can efficiently accommodate varying traffic conditions during peak and off-peak periods as well as adoption of a traffic control system as changes occur over time. Therefore selecting long and uniform signalized intersection spacing is an essential element in establishing access spacing standards”3. “Spacing of signals has a direct effect on roadway efficiency. The Colorado Access Demonstration Project concluded that ½ mile signal spacing could reduce vehicle-hour of delay by over 60% and vehicle-
2 National Cooperative Highway Research Program (NCHRP) Project 3-52A, "Impacts of Access-Management Techniques." NCHRP Report 420, "Impacts of Access Management Techniques" (1999), 3 Transportation Research Board of the National Academies, Access Management Manual, Committee on Access Management, Washington, D.C., 2003.

Alternatives IV-29
hour of travel by over 50%, compared with signals at ¼ -mile intervals with full median openings between signals. These reductions in vehicle-hours are expected even though the hourly volume entering the signalized intersections is higher at the ½-mile spacing. Other analyses conclude that a four-lane divided arterial having signals at uniform ½ mile signal spacing could carry the same volume of traffic as a six-lane divided roadway with a ¼ mile spacing.”4 “Variables involved in the planning, design, and operation of signalized arterial roadways are reflected in the relationship between speed, cycle length, and signal spacing. A key objective of access management is to balance these elements to yield maximum progression bandwidths in both travel directions at desired travel speeds. Establishing a long signal spacing allows more flexibility for peak and off-peak conditions. For example, a 90 second cycle for ½-mile spacing will allow efficient traffic progression at 40 mph where as a ¼-mile spacing has a progressive at 20 mph and 1/8-mile spacing has a progressive at 10 mph. “A uniform signal spacing of ½ mile provides for efficient signal progression at speeds of 35 mph to 45 mph along major suburban arterials. At these speeds, maximum flows rates are achieved and fuel consumption and emissions are kept to a minimum.” 5
5. Driveways Access points, such as driveways, introduce conflicts and friction, i.e., a slowing, in the traffic stream. Vehicles entering and leaving the main roadway often slow the through traffic, and and increase the accident potential due to the difference in speed between through and turning traffic. Three important factors to be considered in driveway are design, location and spacing. The appropriate location of access points is critical to driver safety and roadway efficiency. Providing adequate sight distance, avoiding connections in the functional area of intersections and interchanges, and observing the hierarchy of roadways and intersections are all important concepts in access locations. Along with driveway location, spacing is another major access issue. The spacing between driveways affects both congestion and safety. According to FHWA’s Benefits of Access Management,
‘"Large numbers of driveways increase the potential conflicts on the road. Fewer driveways spaced further apart allow for more orderly merging of traffic and present fewer challenges to drivers.” “A research synthesis found that roadway speeds were reduced an average of 2.5 miles per hour for every 10 access points per mile, up to a maximum of a 10 mph reduction (at 40 access points per mile). With
4 Ibid, page144 5 Ibid, page146

Alternatives IV-30
higher numbers of access points, congestion will increase significantly”. “Many studies over the past 40 years have shown that accident rates rise with greater frequency of driveways and intersections. Roughly 240 roadway segments, involving more than 37,500 accidents, were analyzed in detail. Accident rates were derived for various spacings and median types. For example, a segment with 60 access points per mile would be expected to have an accident rate 3 times higher than a segment with 10 access points per mile. In general, each additional access point per mile increases the accident rate by about 4 percent.”6
It is important to remember that the assumption for future 2026 conditions does not include new driveways, signals or improvements to the roadway. Any master planning for future development along the Route 236 Corridor should keep general access management principles in mind.
6 National Cooperative Highway Research Program (NCHRP) Project 3-52A, "Impacts of Access-Management Techniques." NCHRP Report 420, "Impacts of Access Management Techniques" (1999),

Recommendations V-1
V. Recommendations This chapter presents the transportation improvement recommendations for the Study Area. The recommendations are divided into three parts: improvements completed, near-term recommendations and long-term recommendations. The overall purpose of these measures is to promote safe and efficient movement of traffic. While the recommended actions in this chapter respond to the projected mobility needs of the Route 236 corridor described in Chapter 3, Future Conditions, the uncertainty of external factors could affect future traffic growth and the scope of the recommendations necessary to address this growth. External factors such as demographic trends, energy costs, economic growth, and new technology will need to be monitored, and recommendations for the Route 236 corridor will need to be reviewed and adjusted as needed. A. Improvements Completed
1. Route 91 Intersection Problem: The AM Peak hour has over 200 southbound vehicles turning left onto Route 91, enough to warrant a left-turn lane. Southbound vehicles on Route 236 would often ride on the wrong side of the road prior to turning left onto Route 91 (perhaps out of fear of being rear-ended by Route 236 SB through traffic). The skew of the intersection makes it a wide intersection. The intersection is a high crash location and will have long delays and a poor level of service in the future. Recommended Action and Implementation: The recommended action performed was to restripe the intersection as shown in Figure V-1 to create a southbound left-turn lane. With support for the recommendation from the Corridor Advisory Committee, MaineDOT completed the work in the fall of 2007. A southbound left-turn lane was striped, and northbound traffic was shifted (by a striped island) to provide room. The added left-turn lane was done using existing pavement while maintaining a minimum 5-foot shoulder for bicyclists.

Recommendations V-2
Figure V-1: Route 91 Restriping
Benefits:
• Adding a southbound left-turn lane will improve safety by reducing southbound rear end crashes, involving left-turn vehicles.
• The restriping and new signage of the intersection provides better guidance through the intersection.
Issues and constraints: • The restriping of the intersection does not address the long-term
problem of long delays and poor level of service. • The restriping does not address the skewed intersection or the minor
street left-turn movement.
Implementation: During the Corridor Advisory Committee meetings, the Committee supported the recommendation of restriping the Route 91 intersection to create a southbound left-turn lane. A Maine DOT striping crew completed the work in the fall of 2007.

Recommendations V-3
B. Near-Term Recommendations Near-term recommendations include intersection improvement projects and actions that require additional studies. Table V-1 presents a summary of the near-term projects in priority order. The priority of the intersection projects is based upon benefit/cost ratio. The higher the benefit/cost ratio, the higher the priority of the project. Only the first two projects have a current benefit/cost ratio greater than 1.0. The other recommended projects will have a benefit/cost ratio greater than 1.0 in future years. Typically, proposed projects with a benefit/cost ratio less than 1.0 do not receive priority for funding. Table V-1: Near-Term Recommendations Summary
Intersection Location/Study Area Municipality Priority
Martin / Stevenson (Signal Modification) Kittery High
Depot Road (Additional Lanes) Eliot High
*South Berwick Feasibility Study South Berwick High
** Eliot Route 236 Master Plan Eliot High
Travel Demand Management Study Corridor Wide High
Route 91 (Additional Lanes) South Berwick Medium
Martin / Stevenson (Additional Lanes) Kittery Medium
Route 101 (Additional Lanes) Eliot Medium
Bolt Hill Road (Left-Turn Lanes) Eliot Low
* KACTS is in the process of funding Feasibility Study
**Maine DOT will work with KACTS to determine a scope of work, and to locate a funding source for this Plan.

Recommendations V-4
High Priority Projects
1. Martin/Stevenson Rd. Signal Modification - Kittery Problem: The signalized intersection of Martin and Stevenson Road has left-turn lanes on the main line but does not have protected left-turn signal phases. The intersection has experienced a high number of left-turn crashes. Recommended Action: Provide additional signal heads to allow for a protected left-turn movement (phase). Benefits:
• According to the FHWA Report No SA-07-015, adding a protected left-turn phase will reduce left-turn crashes by 46 percent.
• The benefit/cost ratio for installing a protected left-turn signal is over 23.
Issues and constraints:
• The estimated cost for this project has been reduced based on a commitment by the Town of Kittery to install the signals themselves.
• The cost of the additional signal assumes that it can be added to the control panel without replacing the traffic cabinet.
2. Depot Road - Eliot Problem: The signalized intersection of Depot Road often experiences long queues and delays, especially in the northbound direction in the PM peak. Another problem with the intersection is the close proximity of Cedar Road. Given the expected future volumes, the intersection is projected to have a LOS F by 2026. Recommended Action: The recommended action is to construct additional lanes as shown in Figure V-2. The project would construct protected left-turn lanes on the mainline and two-through lanes (400 feet upstream of the intersection and 1000 feet downstream) in each direction on the mainline. In addition, left-turn lanes would be added on both sides of Depot Road.

Recommendations V-5
Figure V-2: Depot Road – Intersection Improvement
Benefits:
• Additional lanes at the intersection will reduce both current (31 sec/veh to 9 sec/veh) and future delays (100+ sec/veh to 21 sec/veh).
• The 2026 PM level of service will improve from LOS F to LOS C. • Raised islands will protect left-turn traffic from through traffic. • The benefit/cost ratio for constructing additional lanes is 2.1.
Issues and constraints:
• Raised islands will improve safety, but will limit access to adjacent property at the intersection thereby restricting movements to the school and other property near the intersection.
• A traffic signal at Cedar Road would likely create more problems than it would solve. Given the close proximity of Cedar Road to the intersection, traffic movement at the Cedar/Depot Road intersection will need to be monitored. If vehicles continually block the Depot/Cedar intersection then a jug handle should be constructed on Depot Road west of Cedar Road, and Cedar Road should be right out only.
• By shifting Route 236 westward, the turning radius from Route 236 southbound onto Cedar Road will be decreased, especially for large vehicles. If this should be a design issue, then the jug handle should be installed to accommodate large vehicles.
• There are likely to be right of way and environmental impacts. • Traffic flow into and out of the school would have to be addressed.

Recommendations V-6
3. South Berwick Village Feasibility Study Problem: The South Berwick Village area currently has an AADT of over 20,000 per day. The high volume of traffic results in congestion, especially during AM and PM peak hours. The Study looked at several different alternatives at the conceptual level for future conditions. Evaluations concluded that re-configuration of the existing system within the Downtown South Berwick area (see Downtown Option) could accommodate existing and future conditions. However, the impacts to the historically significant village area would be substantial and may be unacceptable to the community. A southern bypass option could be effective also, but further work is needed to define this alternative (e.g. location, estimated costs, etc.) and determine its feasibility. Recommended Action: The recommended action is to support the KACTS South Berwick Feasibility Study. Benefits:
• The Feasibility Study will evaluate in more detail the different alternatives that include environmental, social, and economic resources.
• It will communicate these details to stakeholders and gather their input.
• Determine beneficial long-term solution Issues and constraints:
• The Feasibility Study may be expensive and limited funds are available for new transportation studies or construction.
4. Eliot Route 236 Master Plan
Problem: The Route 236 Corridor in the Eliot area has a current AADT of over 18,000 per day with a 2026 projected AADT of over 26,000 vehicles per day. Currently, the roadway LOS is E, and in sections in the future it is expected to have a LOS F. The Route 236 Corridor through Eliot is classified as “retrograde arterial”. A retrograde arterial is a mobility arterial where the access related crash-per mile rate exceeded the 1999 statewide average for arterials of the same-posted speed limit. Retrograde arterials have the highest access management standards. Unplanned public and commercial development on Route 236 impair the free flow of traffic and decrease safety, requiring taxpayers to fund expensive remedies. Recommended Action: The recommended action is for the Town to develop a Master Plan to help in preserving the mobility of the corridor.

Recommendations V-7
Benefits: • A Master Plan would identify desireable land uses. • It would use Access Management principles to preserve safety and
efficiency as the corridor is developed. Issues and constraints:
• The Master Plan would have to consider land owners, town vision, mobility and safety of the corridor.
• The Master Plan would work in conjunction with other alternatives.
5. Transportation Demand Management Study Problem: The Route 236 Corridor is a commuter route with high am and pm peak directional volumes. Most of the roadway segments currently have LOS E, and LOS F is projected for some segments of the corridor in the future due to capacity constraints. Given the high cost of adding new capacity, other alternatives must be considered for addressing congestion. The Route 236 Corridor likely needs a multi-pronged solution. With its relatively low cost, TDM is almost certain to be part of any solution proposed. At this point it is unknown what level of volume reduction is achievable through TDM. Recommended Action:
• Evaluate the potential for transportation demand management (TDM) actions in the Route 236 Corridor.
• Make recommendations on implementing cost-effective TDM options, e.g. van pools, car pools.
Benefits:
• TDM can be a low-cost, low-impact way of reducing congestion. • Knowing with more certainty the percentage reduction achievable
through TDM is essential in determining the mix of actions needed to make a multi-pronged approach effective.
Issues and constraints:
• Historically, it has been difficult to reduce travel in single-occupant vehicles. However, higher gasoline prices could provide greater incentives for ridesharing.
• This is a rural area with no transit currently in place.

Recommendations V-8
Medium Priority Projects
6. Route 91 Intersection - South Berwick Problem: Given the projected growth in corridor traffic, the intersection is projected to have a LOS F in the future. The intersection is skewed and left-turners on the side street turn left prior to the main intersection, which can queue out onto the side street and are at risk of being struck by traffic turning left off of Route 236. Recommended Action: The recommended action for the intersection is shown in Figure V-3. As shown, the intersection would be signalized (when warranted). The recommended project would construct protected left-turn lanes (raised island) on the mainline and two-through lanes (400 feet upstream of the intersection and 1000 feet downstream) in each direction on the mainline. Left-turn lanes would also be constructed for the minor streets. The triangular raised islands on the side streets would be only for traffic turning right off the mainline. Figure V-3: Route 91 – Intersection Improvement
Benefits:
• Adding lanes at the intersection will reduce 2026 PM delay from 100+ sec/veh to 32 sec/veh.
• The 2026 PM level of service will improve from LOS F to LOS C. • Left-turn traffic from the minor street will be brought into the main
intersection and eliminate the potential for queued left-turners being struck by traffic turning left off the mainline.
• Raised islands which will protect left-turn traffic from through traffic.

Recommendations V-9
Issues and constraints: • Several alternatives were evaluated for long-term solutions. The
recommended concept has the least amount of right of way and utility impact.
• The recommended alternative does not rectify the skew of the intersection; doing that would involve the acquisition of properties and likely have major impacts to those properties.
• There may be environmental impacts south of the intersection, i.e. wetlands.
• Raised islands will improve safety and limit access to adjacent property at the intersection thereby restricting movements to properties near the intersection.
7. Route 101 Intersection - Eliot Problem: Given the projected growth in corridor traffic, the intersection is expected to have a LOS F in the future. The skewed intersection is a high crash location. Recommended Action: The recommended action for the intersection is shown in Figure V-4. The project would construct protected left-turn lanes (raised island) on the mainline and two through lanes (400 feet upstream of the intersection and 1000 feet downstream) in each direction on the mainline. The intersection would have a southbound raised island (currently only in the northbound approach) that will protect the left-turn traffic. In addition, the project would provide signal heads for both northbound and southbound left-turn movements (phases). Figure V-4: Route 101 – Intersection Improvement

Recommendations V-10
Benefits:
• Adding lanes at the intersection will reduce 2026 PM delay from 100+ sec/veh to 32 sec/veh.
• The 2026 PM level of service will improve from LOS F to LOS C. • The raised islands will provide protection for left-turning traffic from
through traffic. Issues and constraints:
• A restaurant business in the southwest quadrant is very close to Route 236, so the mainline of Route 236 would most likely be widened on the east side. Widening on the east side most likely would require lowering the grade for Route 101 westbound.
• Gas lines located along the roadway and near the intersection could be impacted.
• The recommended alternative does not rectify the skew of the intersection; doing that would involve the acquisition of properties and likely have major impacts to those properties.
• Raised islands will improve safety and limit access to adjacent properties at the intersection, thereby restricting movements near the intersection.
8. Martin Road / Stevenson Road - Kittery Problem: Given the projected growth in corridor traffic, the intersection is projected to have a LOS F in the future. Recommended Action: The recommended action for the intersection is shown in Figure V-5. The project would construct protected left-turn lanes (raised island) on the mainline and two through lanes in each direction on the mainline. The Route 236 4-lane section in Kittery ends at Dana Road, 2000 feet south of Martin Road and because it would not make sense to go from 4-lane to 2-lanes and then 4-lanes again at the intersection. For continuity in the number of lanes, it would be proposed to extend the 4 existing lanes to Martin Road. North of Martin Road, there would be two southbound through lanes 400 feet upstream and two northbound through lanes 1,000 feet downstream of the intersection.
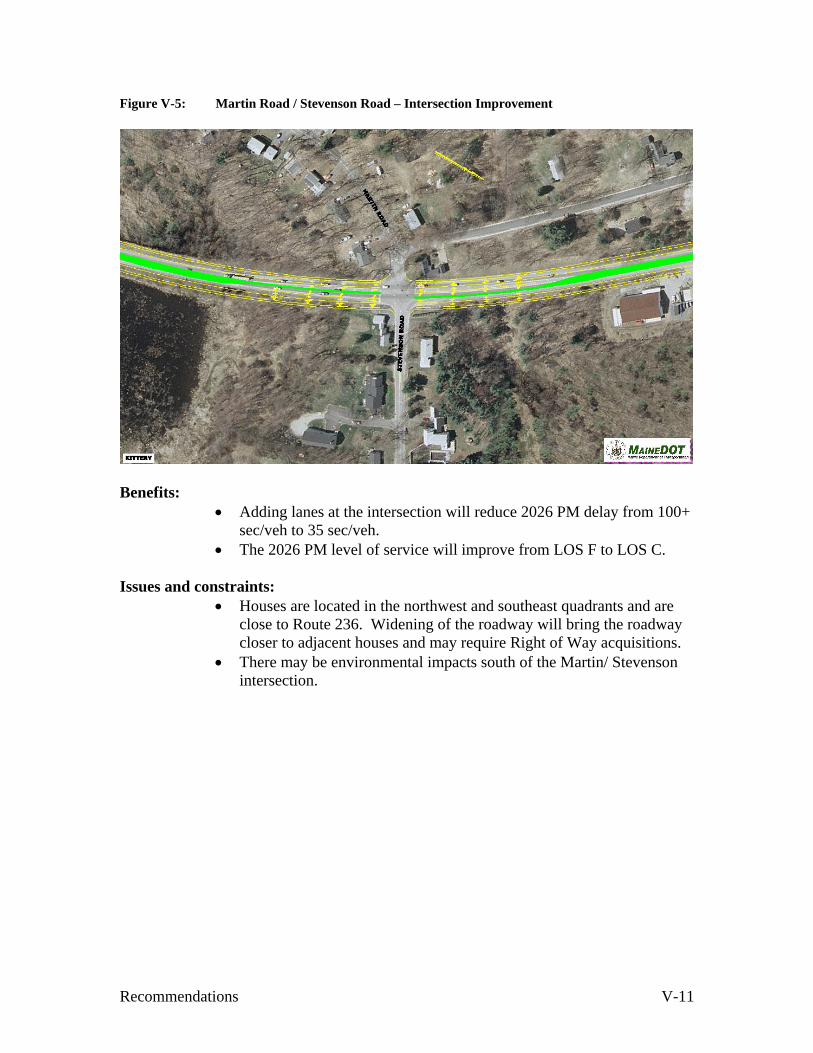
Recommendations V-11
Figure V-5: Martin Road / Stevenson Road – Intersection Improvement
Benefits:
• Adding lanes at the intersection will reduce 2026 PM delay from 100+ sec/veh to 35 sec/veh.
• The 2026 PM level of service will improve from LOS F to LOS C. Issues and constraints:
• Houses are located in the northwest and southeast quadrants and are close to Route 236. Widening of the roadway will bring the roadway closer to adjacent houses and may require Right of Way acquisitions.
• There may be environmental impacts south of the Martin/ Stevenson intersection.

Recommendations V-12
Low Priority
9. Bolt Hill Road - Eliot Problem: The intersection is a high crash location. Although the improvements would reduce the number of expected crashes, the intersection does not currently meet warrants for a signal or left-turn lanes. The benefit to cost ratio for installing a protected left-turn lane is 0.14. Recommended Action: The proposed improvement for the intersection is shown in Figure V-6. As shown, it would construct protected left-turn lanes (raised island) on the mainline. Monitor the crash experience at the intersection after the flashing beacon is operational. If the intersection persists as a high crash location or if congestion at the intersection increases, reconsider the economic feasibility of the proposed improvement. Figure V-6: Bolt Hill Road – Intersection Improvement
Benefits:
• Adding protected left-lanes will reduce the expected crashes at the intersection by 48%.
Issues and constraints:
• The existing benefit to cost ratio is only 0.14. • Unlikely funding candidate at this time.

Recommendations V-13
C. Long-Term Recommendations The near-term improvements focused mostly on intersection improvement projects that would improve traffic flow and safety at intersections, and would result in improved overall traffic flow to some extent. The long-term recommendations focus on the roadway segments between the intersections. The future 2026 conditions show that the roadway segments between Dana Road and Depot Road will be LOS F and the roadway segment between Depot Road and Route 101 will be close to LOS F. While the intersection improvement projects will reduce congestion at bottle necks (at the signalized intersection), the roadway itself will not have the capacity to handle projected future volumes. The recommendation to improve the roadway segments is to develop a Master Plan that will incorporate Access Management techniques, reduce the number of vehicles through TDM measures and construct the additional lanes at the intersections (as described in the near-term improvements) along the corridor. If these measures are unable to address the roadway segments, then it is recommended to develop a detailed feasibility evaluation of added through lanes on Route 236 between Dana Road and Route 101.
1. Dana Road to Route 101 Intersection - Eliot Problem: Given the projected growth in corridor traffic, the roadway segment between Dana and Depot Road is projected to have a LOS F in the future and the roadway segment between Depot Road and Route 101 is close to LOS F. Recommended Action: The recommended action for this section of the corridor is to evaluate the feasibility of an increase of the number of travel lanes between Dana Road and Route 101 from two lanes to four lanes with a raised median. Benefits:
• Adding capacity to the roadway will improve the level of service and reduce delays.
• A raised median will improve safety and mobility Issues and constraints:
• Added through lanes will be expensive • Both the STPA and NEPA processes would be required before through
lanes could be added. • There would be Right of Way and environmental impacts with
widening.

Appendix I A-1
Appendix I Speed and Headway Summary NW/O Bolt Hill Rd
Route 236 Northbound NW/O Bolt Hill Rd
Hour Hour Ending Number of 85th Percentile Average Median Mode Max Hour Ending VolumeVehicles Speed (mph) Speed (mph) Speed (mph) Speed (mph) Speed (mph) 0 to 2.00 2.01 to 3 3.01 to 5 >5 % Time Delay 0 to 5 sec % 0 to 2.00 % 2.01 to 3 % 3.01 to 5 % > 5 % 0 to 3 % 0 to 5
(<5 sec old HCM) 12:00 to 1:00 am 1 117 49 45 45 45 56 1 10 9 8 90 23.1% 27 8.5% 7.7% 6.8% 76.9% 16.2% 23.1% 1:00 to 2:00 am 2 53 50 46 45 44 59 2 4 4 3 42 20.8% 11 7.5% 7.5% 5.7% 79.2% 15.1% 20.8% 2:00 to 3:00 am 3 18 51 46 45 44 57 3 0 0 0 18 0.0% 0 0.0% 0.0% 0.0% 100.0% 0.0% 0.0% 3:00 to 4:00 am 4 17 52 46 47 47 57 4 1 0 0 16 5.9% 1 5.9% 0.0% 0.0% 94.1% 5.9% 5.9% 4:00 to 5:00 am 5 25 53 47 46 46 56 5 2 0 1 22 12.0% 3 8.0% 0.0% 4.0% 88.0% 8.0% 12.0% 5:00 to 6:00 am 6 87 52 48 47 46 62 6 AM 2 4 3 78 10.3% 9 2.3% 4.6% 3.4% 89.7% 6.9% 10.3% 6:00 to 7:00 am 7 224 51 44 44 48 62 7 49 27 23 125 44.2% 99 21.9% 12.1% 10.3% 55.8% 33.9% 44.2% 7:00 to 8:00 am 8 326 51 47 47 47 61 8 82 51 35 158 51.5% 168 25.2% 15.6% 10.7% 48.5% 40.8% 51.5% 8:00 to 9:00 am 9 333 50 46 47 47 61 9 66 40 48 179 46.2% 154 19.8% 12.0% 14.4% 53.8% 31.8% 46.2% 9:00 to 10:00 am 10 354 51 47 47 45 68 10 83 42 49 180 49.2% 174 23.4% 11.9% 13.8% 50.8% 35.3% 49.2% 10:00 to 11:00 am 11 355 51 46 46 45 59 11 86 56 51 162 54.4% 193 24.2% 15.8% 14.4% 45.6% 40.0% 54.4% 11:00 to 12:00 noon 12 482 50 46 45 47 61 Noon 154 65 63 200 58.5% 282 32.0% 13.5% 13.1% 41.5% 45.4% 58.5%12:00 to 1:00 pm 13 498 51 47 47 47 59 1 146 83 74 195 60.8% 303 29.3% 16.7% 14.9% 39.2% 46.0% 60.8% 1:00 to 2:00 pm 14 485 51 46 47 47 59 2 148 73 75 189 61.0% 296 30.5% 15.1% 15.5% 39.0% 45.6% 61.0% 2:00 to 3:00 pm 15 612 50 46 46 47 59 3 222 96 97 197 67.8% 415 36.3% 15.7% 15.8% 32.2% 52.0% 67.8% 3:00 to 4:00 pm 16 1006 50 45 46 45 60 4 437 227 175 167 83.4% 839 43.4% 22.6% 17.4% 16.6% 66.0% 83.4% 4:00 to 5:00 pm 17 1148 49 45 46 47 59 5 519 310 169 150 86.9% 998 45.2% 27.0% 14.7% 13.1% 72.2% 86.9% 5:00 to 6:00 pm 18 1042 50 46 46 47 63 6 PM 490 218 171 163 84.4% 879 47.0% 20.9% 16.4% 15.6% 67.9% 84.4% 6:00 to 7:00 pm 19 598 52 47 48 47 61 7 225 102 69 202 66.2% 396 37.6% 17.1% 11.5% 33.8% 54.7% 66.2% 7:00 to 8:00 pm 20 401 52 48 48 50 60 8 120 52 37 192 52.1% 209 29.9% 13.0% 9.2% 47.9% 42.9% 52.1% 8:00 to 9:00 pm 21 336 51 46 46 50 64 9 94 37 31 174 48.2% 162 28.0% 11.0% 9.2% 51.8% 39.0% 48.2% 9:00 to 10:00 pm 22 303 51 47 47 47 61 10 70 36 37 159 47.2% 143 23.1% 11.9% 12.2% 52.5% 35.0% 47.2% 10:00 to 11:00 pm 23 152 51 47 47 50 57 11 28 12 9 103 32.2% 49 18.4% 7.9% 5.9% 67.8% 26.3% 32.2% 11:00 to 12:00 pm 24 134 52 47 47 50 57 Midnight 19 6 9 100 25.4% 34 14.2% 4.5% 6.7% 74.6% 18.7% 25.4%
24 Hour Average 9106 46.3 24 Hr Ave 23.4% 11.8% 10.3% 54.5%Route 236 Southbound NW/O Bolt Hill Rd
Hour Hour Ending Number of 85th Percentile Average Median Mode Max Hour Ending VolumeVehicles Speed (mph) Speed (mph) Speed (mph) Speed (mph) Speed (mph) 0 to 2.00 2.01 to 3 3.01 to 5 >5 % Time Delay 0 to 5 sec % 0 to 2.00 % 2.01 to 3 % 3.01 to 5 % > 5 % 0 to 3 % 0 to 5
(<5 sec old HCM) 12:00 to 1:00 am 1 26 50 45 45 42 54 1 2 0 1 23 11.5% 3 7.7% 0.0% 3.8% 88.5% 7.7% 11.5% 1:00 to 2:00 am 2 15 47 43 43 45 56 2 0 0 0 15 0.0% 0 0.0% 0.0% 0.0% 100.0% 0.0% 0.0% 2:00 to 3:00 am 3 19 47 44 44 47 50 3 1 0 1 17 10.5% 2 5.3% 0.0% 5.3% 89.5% 5.3% 10.5% 3:00 to 4:00 am 4 46 49 45 44 43 55 4 2 3 2 39 15.2% 7 4.3% 6.5% 4.3% 84.8% 10.9% 15.2% 4:00 to 5:00 am 5 244 50 46 46 50 59 5 55 32 32 125 48.8% 119 22.5% 13.1% 13.1% 51.2% 35.7% 48.8% 5:00 to 6:00 am 6 916 49 44 44 44 61 6 AM 411 171 145 189 79.4% 727 44.9% 18.7% 15.8% 20.6% 63.5% 79.4% 6:00 to 7:00 am 7 886 47 40 42 43 63 7 344 198 155 189 78.7% 697 38.8% 22.3% 17.5% 21.3% 61.2% 78.7% 7:00 to 8:00 am 8 1048 46 41 42 45 56 8 492 227 163 166 84.2% 882 46.9% 21.7% 15.6% 15.8% 68.6% 84.2% 8:00 to 9:00 am 9 950 47 42 42 40 68 9 392 207 157 194 79.6% 756 41.3% 21.8% 16.5% 20.4% 63.1% 79.6% 9:00 to 10:00 am 10 593 48 44 44 43 59 10 134 122 120 217 63.4% 376 22.6% 20.6% 20.2% 36.6% 43.2% 63.4% 10:00 to 11:00 am 11 538 48 44 44 45 59 11 124 81 114 219 59.3% 319 23.0% 15.1% 21.2% 40.7% 38.1% 59.3% 11:00 to 12:00 noon 12 565 47 42 43 45 59 Noon 187 96 86 196 65.3% 369 33.1% 17.0% 15.2% 34.7% 50.1% 65.3%12:00 to 1:00 pm 13 501 50 45 45 45 59 1 123 83 83 212 57.7% 289 24.6% 16.6% 16.6% 42.3% 41.1% 57.7% 1:00 to 2:00 pm 14 519 49 44 45 45 59 2 130 99 90 200 61.5% 319 25.0% 19.1% 17.3% 38.5% 44.1% 61.5% 2:00 to 3:00 pm 15 520 49 44 44 47 57 3 149 85 82 204 60.8% 316 28.7% 16.3% 15.8% 39.2% 45.0% 60.8% 3:00 to 4:00 pm 16 552 50 45 45 44 62 4 172 83 89 208 62.3% 344 31.2% 15.0% 16.1% 37.7% 46.2% 62.3% 4:00 to 5:00 pm 17 534 50 45 45 45 63 5 184 76 83 191 64.2% 343 34.5% 14.2% 15.5% 35.8% 48.7% 64.2% 5:00 to 6:00 pm 18 473 50 45 46 47 60 6 PM 143 82 58 190 59.8% 283 30.2% 17.3% 12.3% 40.2% 47.6% 59.8% 6:00 to 7:00 pm 19 366 51 47 47 47 64 7 91 47 56 172 53.0% 194 24.9% 12.8% 15.3% 47.0% 37.7% 53.0% 7:00 to 8:00 pm 20 245 52 47 47 47 62 8 41 29 38 137 44.1% 108 16.7% 11.8% 15.5% 55.9% 28.6% 44.1% 8:00 to 9:00 pm 21 208 51 46 45 44 65 9 29 20 24 135 35.1% 73 13.9% 9.6% 11.5% 64.9% 23.6% 35.1% 9:00 to 10:00 pm 22 121 49 45 46 46 67 10 14 5 17 85 29.8% 36 11.6% 4.1% 14.0% 70.2% 15.7% 29.8% 10:00 to 11:00 pm 23 92 51 47 46 43 59 11 12 6 9 65 29.3% 27 13.0% 6.5% 9.8% 70.7% 19.6% 29.3% 11:00 to 12:00 pm 24 32 50 45 45 45 53 Midnight 1 0 1 30 6.3% 2 3.1% 0.0% 3.1% 93.8% 3.1% 6.3%
24 Hour Average 10009 44.4 24 Hr Ave 22.8% 12.5% 13.0% 51.7%

Appendix I A-2
Appendix I Speed and Headway Summary S/O Depot RD
Route 236 Northbound S/O Depot Rd
Hour Hour Ending Number of 85th Percentile Average Median Mode Max Hour Ending VolumeVehicles Speed (mph) Speed (mph) Speed (mph) Speed (mph) Speed (mph) 0 to 2.00 2.01 to 3 3.01 to 5 >5 % Time Delay 0 to 5 sec % 0 to 2.00 % 2.01 to 3 % 3.01 to 5 % > 5 % 0 to 3 % 0 to 5
(<5 sec old HCM) 12:00 to 1:00 am 1 104 51 49 49 51 59 1 6 4 12 82 21.2% 22 5.8% 3.8% 11.5% 78.8% 9.6% 21.2% 1:00 to 2:00 am 2 53 51 48 48 48 57 2 2 4 3 44 17.0% 9 3.8% 7.5% 5.7% 83.0% 11.3% 17.0% 2:00 to 3:00 am 3 16 50 48 48 47 56 3 0 0 0 16 0.0% 0 0.0% 0.0% 0.0% 100.0% 0.0% 0.0% 3:00 to 4:00 am 4 14 53 49 48 48 56 4 0 0 0 14 0.0% 0 0.0% 0.0% 0.0% 100.0% 0.0% 0.0% 4:00 to 5:00 am 5 24 53 50 49 49 59 5 3 0 0 21 12.5% 3 12.5% 0.0% 0.0% 87.5% 12.5% 12.5% 5:00 to 6:00 am 6 77 55 51 51 50 61 6 AM 5 4 1 67 13.0% 10 6.5% 5.2% 1.3% 87.0% 11.7% 13.0% 6:00 to 7:00 am 7 187 55 50 50 50 61 7 32 11 24 120 35.8% 67 17.1% 5.9% 12.8% 64.2% 23.0% 35.8% 7:00 to 8:00 am 8 297 55 49 50 50 61 8 63 30 39 165 44.4% 132 21.2% 10.1% 13.1% 55.6% 31.3% 44.4% 8:00 to 9:00 am 9 264 54 50 50 50 64 9 46 26 36 156 40.9% 108 17.4% 9.8% 13.6% 59.1% 27.3% 40.9% 9:00 to 10:00 am 10 293 53 49 49 47 67 10 43 35 46 169 42.3% 124 14.7% 11.9% 15.7% 57.7% 26.6% 42.3% 10:00 to 11:00 am 11 308 52 48 48 47 59 11 56 55 40 157 49.0% 151 18.2% 17.9% 13.0% 51.0% 36.0% 49.0% 11:00 to 12:00 noon 12 393 53 47 48 50 62 Noon 85 52 60 196 50.1% 197 21.6% 13.2% 15.3% 49.9% 34.9% 50.1%12:00 to 1:00 pm 13 446 53 49 49 50 65 1 110 76 73 187 58.1% 259 24.7% 17.0% 16.4% 41.9% 41.7% 58.1% 1:00 to 2:00 pm 14 445 53 49 49 50 67 2 128 65 67 185 58.4% 260 28.8% 14.6% 15.1% 41.6% 43.4% 58.4% 2:00 to 3:00 pm 15 553 53 48 49 50 61 3 171 92 98 191 65.3% 361 30.9% 16.6% 17.7% 34.5% 47.6% 65.3% 3:00 to 4:00 pm 16 909 52 47 47 47 64 4 376 213 157 163 82.1% 746 41.4% 23.4% 17.3% 17.9% 64.8% 82.1% 4:00 to 5:00 pm 17 1071 51 46 47 47 61 5 484 256 186 145 86.5% 926 45.2% 23.9% 17.4% 13.5% 69.1% 86.5% 5:00 to 6:00 pm 18 1055 51 47 46 45 64 6 PM 469 281 160 145 86.3% 910 44.5% 26.6% 15.2% 13.7% 71.1% 86.3% 6:00 to 7:00 pm 19 565 55 50 50 50 66 7 186 116 102 161 71.5% 404 32.9% 20.5% 18.1% 28.5% 53.5% 71.5% 7:00 to 8:00 pm 20 370 55 50 50 50 61 8 107 52 44 167 54.9% 203 28.9% 14.1% 11.9% 45.1% 43.0% 54.9% 8:00 to 9:00 pm 21 310 54 51 50 50 65 9 57 48 55 150 51.6% 160 18.4% 15.5% 17.7% 48.4% 33.9% 51.6% 9:00 to 10:00 pm 22 280 54 50 50 50 63 10 60 30 32 158 43.6% 122 21.4% 10.7% 11.4% 56.4% 32.1% 43.6% 10:00 to 11:00 pm 23 160 53 49 49 50 56 11 25 23 15 97 39.4% 63 15.6% 14.4% 9.4% 60.6% 30.0% 39.4% 11:00 to 12:00 pm 24 121 54 50 49 50 61 Midnight 8 5 9 99 18.2% 22 6.6% 4.1% 7.4% 81.8% 10.7% 18.2%
24 Hour Average 8315 48.9 24 Hr Ave 19.9% 12.0% 11.5% 56.6%
Headway Headway Headway Headway Headway Headway<=2.0 >=2.001 <=3 >=3.001 <=5 >5
Appendix I Speed and Headway Summary S/E of Depot Rd
Route 236 Southbound S/O Depot Rd
Hour Hour Ending Number of 85th Percentile Average Median Mode Max Hour Ending VolumeVehicles Speed (mph) Speed (mph) Speed (mph) Speed (mph) Speed (mph) 0 to 2.00 2.01 to 3 3.01 to 5 >5 % Time Delay 0 to 5 sec % 0 to 2.00 % 2.01 to 3 % 3.01 to 5 % > 5 % 0 to 3 % 0 to 5
(<5 sec old HCM) 12:00 to 1:00 am 1 31 51 47 48 51 56 1 2 1 1 27 12.9% 4 6.5% 3.2% 3.2% 87.1% 9.7% 12.9% 1:00 to 2:00 am 2 15 51 47 47 47 56 2 0 0 0 15 0.0% 0 0.0% 0.0% 0.0% 100.0% 0.0% 0.0% 2:00 to 3:00 am 3 18 51 48 47 47 59 3 2 0 0 16 11.1% 2 11.1% 0.0% 0.0% 88.9% 11.1% 11.1% 3:00 to 4:00 am 4 48 50 48 48 50 61 4 3 2 2 41 14.6% 7 6.3% 4.2% 4.2% 85.4% 10.4% 14.6% 4:00 to 5:00 am 5 249 51 49 48 48 59 5 49 37 29 134 46.2% 115 19.7% 14.9% 11.6% 53.8% 34.5% 46.2% 5:00 to 6:00 am 6 862 52 49 49 50 57 6 AM 367 192 149 154 82.1% 708 42.6% 22.3% 17.3% 17.9% 64.8% 82.1% 6:00 to 7:00 am 7 843 52 48 48 47 61 7 320 208 160 155 81.6% 688 38.0% 24.7% 19.0% 18.4% 62.6% 81.6% 7:00 to 8:00 am 8 957 50 46 46 47 59 8 409 204 179 165 82.8% 792 42.7% 21.3% 18.7% 17.2% 64.1% 82.8% 8:00 to 9:00 am 9 837 51 47 48 47 58 9 369 166 134 167 79.9% 669 44.1% 19.8% 16.0% 20.0% 63.9% 79.9% 9:00 to 10:00 am 10 514 52 48 49 50 67 10 156 93 83 182 64.6% 332 30.4% 18.1% 16.1% 35.4% 48.4% 64.6% 10:00 to 11:00 am 11 458 52 48 48 50 64 11 128 71 63 196 57.2% 262 27.9% 15.5% 13.8% 42.8% 43.4% 57.2% 11:00 to 12:00 noon 12 469 51 47 47 47 60 Noon 149 75 73 172 63.3% 297 31.8% 16.0% 15.6% 36.7% 47.8% 63.3%12:00 to 1:00 pm 13 408 52 48 48 47 74 1 120 63 50 174 57.1% 233 29.4% 15.4% 12.3% 42.6% 44.9% 57.1% 1:00 to 2:00 pm 14 434 53 49 49 47 60 2 124 59 58 193 55.5% 241 28.6% 13.6% 13.4% 44.5% 42.2% 55.5% 2:00 to 3:00 pm 15 462 53 48 49 47 63 3 128 79 87 168 63.6% 294 27.7% 17.1% 18.8% 36.4% 44.8% 63.6% 3:00 to 4:00 pm 16 473 53 49 50 50 75 4 170 84 54 165 65.1% 308 35.9% 17.8% 11.4% 34.9% 53.7% 65.1% 4:00 to 5:00 pm 17 451 54 50 50 50 64 5 142 67 65 177 60.8% 274 31.5% 14.9% 14.4% 39.2% 46.3% 60.8% 5:00 to 6:00 pm 18 425 54 49 50 50 61 6 PM 126 70 50 178 57.9% 246 29.6% 16.5% 11.8% 41.9% 46.1% 57.9% 6:00 to 7:00 pm 19 334 54 49 49 48 61 7 97 44 41 152 54.5% 182 29.0% 13.2% 12.3% 45.5% 42.2% 54.5% 7:00 to 8:00 pm 20 213 55 51 50 50 63 8 47 28 19 119 44.1% 94 22.1% 13.1% 8.9% 55.9% 35.2% 44.1% 8:00 to 9:00 pm 21 183 52 48 48 47 65 9 49 18 18 98 46.4% 85 26.8% 9.8% 9.8% 53.6% 36.6% 46.4% 9:00 to 10:00 pm 22 128 52 49 48 47 62 10 13 17 20 78 39.1% 50 10.2% 13.3% 15.6% 60.9% 23.4% 39.1% 10:00 to 11:00 pm 23 78 53 49 49 49 63 11 11 5 4 58 25.6% 20 14.1% 6.4% 5.1% 74.4% 20.5% 25.6% 11:00 to 12:00 pm 24 47 51 48 49 49 56 Midnight 3 3 4 37 21.3% 10 6.4% 6.4% 8.5% 78.7% 12.8% 21.3%
24 Hour Average 8937 48.3 24 Hr Ave 24.7% 13.2% 11.6% 50.5%

Appendix I A-3
Route 236 SE/O Depot RdThursday June 8, 2006
0
200
400
600
800
1000
1200
1400
16001 2 3 4 5
6 A
M 7 8 9 10 11
Noo
n 1 2 3 4 5
6 P
M 7 8 9 10 11
Mid
nigh
t
Hour Ending
Vehi
cles
Per
Hou
r
Combined VehNorth DirectionSouth Direction

Appendix I A-4
Route 236 S/O Depot Rd
0
200
400
600
800
1000
1200
14001 2 3 4 5
6 A
M 7 8 9 10 11
Noo
n 1 2 3 4 5
6 P
M 7 8 9 10 11
Mid
nigh
t
Hour Ending
Vehi
cles
Per
Hou
r
0
5
10
15
20
25
30
35
40
45
50
55
60
Avg
. Spe
ed (m
ph)
Combined Vehicular VolumeNorth Average SpeedSouth Average Speed

Appendix I A-5
Headway NB Route 236 SEO Depot Rd
0%
10%
20%
30%
40%
50%
60%
70%
80%
90%
100%
1 2 3 4 5
6 A
M 7 8 9 10 11
Noo
n 1 2 3 4 5
6 P
M 7 8 9 10 11
Mid
nigh
t
Hour Ending
% o
f Tot
al W
B V
ehic
les
>5 sec3.01 to 5 sec2.01 to 3 sec0 to 2.00 sec
Headway NB Route 236 SEO Depot Rd
0%
10%
20%
30%
40%
50%
60%
70%
80%
90%
100%
1 2 3 4 5
6 AM
7 8 9 10 11
Noo
n 1 2 3 4 5
6 PM
7 8 9 10 11
Mid
nigh
t
Hour Ending
% o
f Tot
al W
B V
ehic
les
>5 sec3.01 to 5 sec2.01 to 3 sec0 to 2.00 sec

Appendix II A-6

Appendix II A-7

Appendix II A-8

Appendix II A-9

Appendix II A-10

Appendix II A-11

Appendix II A-12
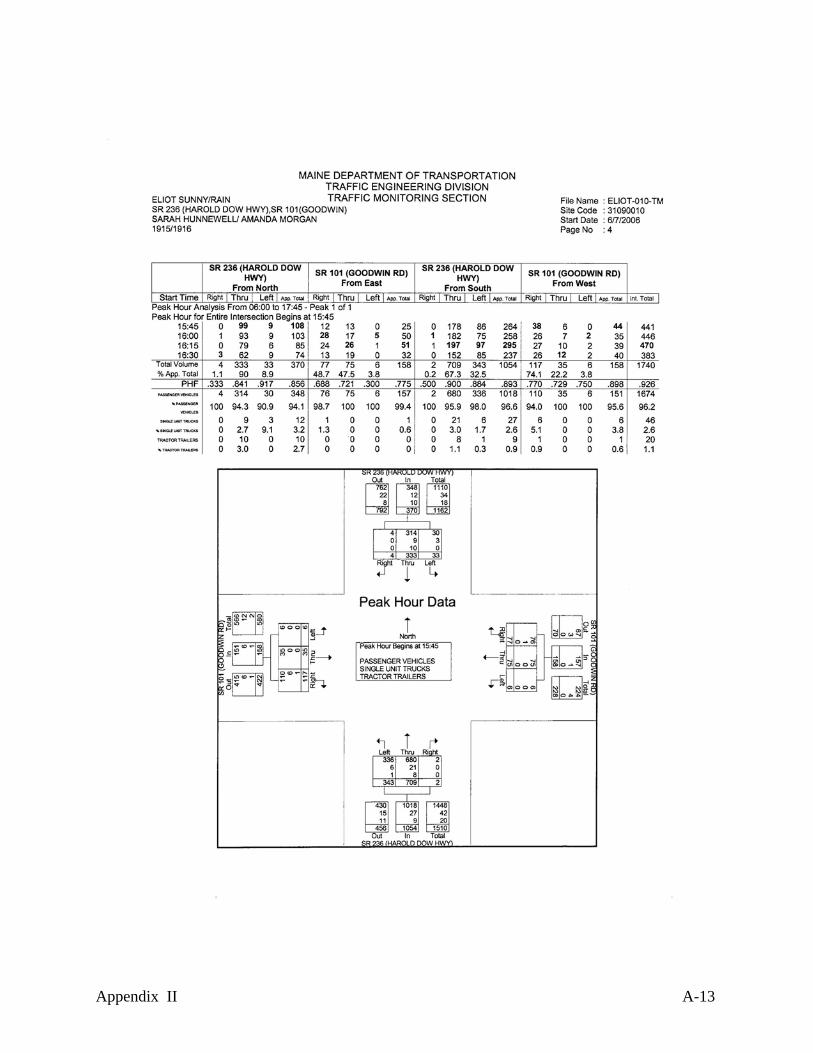
Appendix II A-13

Appendix II A-14

Appendix II A-15

Appendix II A-16

Appendix II A-17

Appendix II A-18

Appendix II A-19

Appendix II A-20

Appendix II A-21

Appendix II A-22

Appendix II A-23

Appendix III A-24
Town name Begin node_id
End node_id Begin node location desc End node location desc BMP EMP Seg len
(mi)Speed lim
(mph) Shldr type- left Shldr type- right Shldr wid left (ft)
Shldr wid right (ft)
Num lanes
Thru lanes- num
Thru lanes- wid (ft)
Lt turn lanes- num
Lt turn lanes- wid (ft)
Rt turn lanes- num
Rt turn lanes- wid (ft) PCR
Kittery 58935 51552 3110055 KIT,236NB CIR,236NB TO 1S CIR 3101123 KIT,RTE 236NB,UNDER BYP BRIDGE 1.08 1.12 0.04 25 Curb present Paved 0 4 1 1 16 0 0 0 0 3.58Kittery 51552 51551 3101123 KIT,RTE 236NB,UNDER BYP BRIDGE 3101122 KIT,RTE 236NB,SML.01W/O 1A BRG 1.12 1.13 0.01 25 Curb present Paved 0 4 1 1 16 0 0 0 0 3.58Kittery 51551 58946 3101122 KIT,RTE 236NB,SML.01W/O 1A BRG 3110066 KIT,RTE 236NB,RAMP TO BYP SB 1.13 1.15 0.02 25 Curb present Paved 0 4 1 1 16 0 0 0 0 3.58Kittery 58946 58928 3110066 KIT,RTE 236NB,RAMP TO BYP SB 3110048 KIT,RTE 1S,RTE 236NB 1.15 1.23 0.08 45 Curb present Curb present 2 12 1 1 16 0 0 0 0 3.58Kittery 58928 58929 3110048 KIT,RTE 1S,RTE 236NB 3110049 KIT,RTE 236NB,CUT FROM RTE 1S 1.23 1.27 0.04 45 Curb present Curb present 2 12 1 1 16 0 0 0 0 3.58Kittery 58929 54090 3110049 KIT,RTE 236NB,CUT FROM RTE 1S 3103702 KIT,236X,FUL S/O I-95 1.27 1.35 0.08 45 Curb present Curb present 0 8 2 2 24 0 0 0 0 3.58Kittery 54090 58859 3103702 KIT,236X,FUL S/O I-95 3109676 KIT,236NB,236S,RMP FR.SLIP RMP 1.35 1.46 0.11 45 Curb present Curb present 0 8 2 2 24 0 0 0 0 3.58Kittery 58859 58858 3109676 KIT,236NB,236S,RMP FR.SLIP RMP 3109675 KIT,236NB,RAMP TO SLIP RAMP 1.46 1.49 0.03 45 Curb present Curb present 0 8 2 2 24 0 0 0 0 3.58Kittery 58858 56674 3109675 KIT,236NB,RAMP TO SLIP RAMP 3107174 KIT,236X,236NB,236S,DANA AVE 1.49 1.57 0.08 45 Curb present Curb present 0 8 2 2 36 0 0 0 0 4.24Kittery 58858 56674 3109675 KIT,236NB,RAMP TO SLIP RAMP 3107174 KIT,236X,236NB,236S,DANA AVE 1.57 1.66 0.09 45 Curb present Curb present 0 8 3 2 36 1 12 0 0 3.58Kittery 56674 56675 3107174 KIT,236X,236NB,236S,DANA AVE 3107175 KIT,RT 236,MARTIN,STEVENSON 1.66 1.98 0.32 45 Paved Paved 8 8 2 2 24 0 0 0 0 4.24Kittery 56674 56675 3107174 KIT,236X,236NB,236S,DANA AVE 3107175 KIT,RT 236,MARTIN,STEVENSON 1.98 2.06 0.08 45 Paved Paved 10 10 2 2 38 0 0 0 0 4.24Kittery 56675 58074 3107175 KIT,RT 236,MARTIN,STEVENSON 3108611 KIT,RTE 236,MACKENZIE LA 2.06 2.42 0.36 45 Paved Paved 8 8 2 2 24 0 0 0 0 4.39Kittery 58074 56676 3108611 KIT,RTE 236,MACKENZIE LA 3107176 KIT,RTE 236,FERNALD RD 2.42 2.55 0.13 45 Paved Paved 8 8 2 2 24 0 0 0 0 4.39Kittery 54447 56677 3104112 KIT,RTE 236,FERNALD RD TL - Eliot, Kittery 2.55 2.74 0.19 45 Paved Paved 8 8 2 2 24 0 0 0 0 4.39Eliot 56677 56678 TL - Eliot, Kittery Int of BOLT HILL RD, HAROLD DOW HWY 2.74 2.76 0.02 45 Paved Paved 8 8 2 2 24 0 0 0 0 4.39Eliot 56678 56679 Int of BOLT HILL RD, HAROLD DOW HWY Int of BEECH RD, HAROLD DOW HWY 2.76 3.68 0.92 35 Paved Paved 8 8 2 2 24 0 0 0 0 4.35Eliot 56679 56680 Int of BEECH RD, HAROLD DOW HWY Int of BRADSTREET LN, HAROLD DOW HWY 3.68 4.48 0.8 45 Paved Paved 8 8 2 2 24 0 0 0 0 4.33Eliot 56680 56681 Int of BRADSTREET LN, HAROLD DOW HWY Int of DEPOT RD, HAROLD DOW HWY 4.48 5.68 0.8 45 Paved Paved 8 8 2 2 24 0 0 0 0 4.39Eliot 56681 56987 Int of DEPOT RD, HAROLD DOW HWY Non-Int HAROLD DOW HWY 5.68 6.12 0.44 45 Paved Paved 8 8 2 2 24 0 0 0 0 4.28Eliot 56987 51527 Non-Int HAROLD DOW HWY Int of AMBUSH ROCK LN, HAROLD DOW HWY 6.12 6.55 0.43 45 Paved Paved 8 8 2 2 24 0 0 0 0 4.19Eliot 51527 56682 Int of AMBUSH ROCK LN, HAROLD DOW HWY Int of HAROLD DOW HWY, STATE RD 6.55 7.04 0.49 45 Paved Paved 8 8 2 2 24 0 0 0 0 4.19Eliot 56682 56683 Int of HAROLD DOW HWY, STATE RD Int of HAROLD DOW HWY, WORSTER RD 7.04 7.15 0.11 45 Paved Paved 8 8 2 2 24 0 0 0 0 4.15Eliot 56683 57897 Int of HAROLD DOW HWY, WORSTER RD Int of HAROLD DOW HWY, HERON COVE RD 7.15 7.33 0.18 45 Paved Paved 8 8 2 2 24 0 0 0 0 4.15Eliot 57897 56684 Int of HAROLD DOW HWY, HERON COVE RD Int of DOVER RD, GOODWIN RD, HAROLD DOW HWY 7.33 7.46 0.08 45 Paved Paved 8 8 2 2 24 0 0 0 0 4.15Eliot 56684 56685 nt of DOVER RD, GOODWIN RD, HAROLD DOW HWY TL - Eliot, South Berwick 7.46 7.92 0.46 45 Paved Paved 8 8 2 2 24 0 0 0 0 4.29
South Berwick 56685 56686 TL - Eliot, South Berwick Int of SHORE LN, ST RTE 236 7.92 8.09 0.17 55 Paved Paved 8 8 2 2 24 0 0 0 0 4.29South Berwick 56686 56687 Int of SHORE LN, ST RTE 236 Int of LORDS LN, ST RTE 236 8.09 8.58 0.38 55 Paved Paved 8 8 2 2 24 0 0 0 0 4.25South Berwick 56686 56687 Int of SHORE LN, ST RTE 236 Int of LORDS LN, ST RTE 236 8.09 8.58 0.11 55 Paved Paved 8 8 2 2 24 0 0 0 0 4.29South Berwick 56687 56688 Int of LORDS LN, ST RTE 236 Non-Int ST RTE 236 8.58 9.24 0.66 55 Paved Paved 8 8 2 2 24 0 0 0 0 4.25South Berwick 56688 56689 Non-Int ST RTE 236 Int of FIFES LN, ST RTE 236 9.24 9.95 0.71 55 Paved Paved 8 8 2 2 24 0 0 0 0 4.28South Berwick 56689 56690 Int of FIFES LN, ST RTE 236 Int of PINE ST, ST RTE 236, YORK WOODS RD 9.95 10.17 0.05 45 Paved Paved 8 8 2 2 24 0 0 0 0 4.11South Berwick 56689 56690 Int of FIFES LN, ST RTE 236 Int of PINE ST, ST RTE 236, YORK WOODS RD 9.95 10.17 0.02 45 Paved Paved 8 8 2 2 24 0 0 0 0 4.28South Berwick 56689 56690 Int of FIFES LN, ST RTE 236 Int of PINE ST, ST RTE 236, YORK WOODS RD 9.95 10.17 0.15 45 Paved Paved 8 8 2 2 24 0 0 0 0 4.29South Berwick 56690 56691 Int of PINE ST, ST RTE 236, YORK WOODS RD Int of ROUTE 236, ST RTE 236 10.17 10.45 0.28 45 Paved Paved 8 8 2 2 24 0 0 0 0 4.11South Berwick 56691 58023 Int of ROUTE 236, ST RTE 236 Int of QUARRY DR, ROUTE 236 10.45 10.58 0.13 45 Paved Paved 8 8 2 2 24 0 0 0 0 4.35South Berwick 58023 59560 Int of QUARRY DR, ROUTE 236 Int of FARM GATE RD, ROUTE 236 10.58 10.74 0.16 45 Paved Paved 8 8 2 2 24 0 0 0 0 4.35South Berwick 59560 56692 Int of FARM GATE RD, ROUTE 236 Int of BRATTLE ST, ROUTE 236 10.74 10.79 0.05 45 Paved Paved 8 8 2 2 24 0 0 0 0 4.35South Berwick 56692 51940 Int of BRATTLE ST, ROUTE 236 3101514 S.BER,RTE.236,ACADEMY ST. 10.79 10.83 0.04 45 Paved Paved 8 8 2 2 24 0 0 0 0 4.35South Berwick 51940 56693 3101514 S.BER,RTE.236,ACADEMY ST. 3107193 S.BER,RTE.236,OLD MILL RD. 10.83 10.9 0.07 45 Paved Paved 8 8 2 2 24 0 0 0 0 4.35South Berwick 56693 54405 3107193 S.BER,RTE.236,OLD MILL RD. 3104069 S.BER,RTE.236,.41 BK.VINE ST. 10.9 10.98 0.02 45 Paved Paved 8 8 2 2 24 0 0 0 0 4.35South Berwick 56693 54405 3107193 S.BER,RTE.236,OLD MILL RD. 3104069 S.BER,RTE.236,.41 BK.VINE ST. 10.9 10.98 0.06 45 Paved Paved 8 8 2 2 24 0 0 0 0 4.38South Berwick 54405 56694 3104069 S.BER,RTE.236,.41 BK.VINE ST. 3107194 S.BER,RTE.236,VINE ST. 10.98 11.39 0.41 45 Paved Paved 8 8 2 2 24 0 0 0 0 4.38South Berwick 56694 56695 3107194 S.BER,RTE.236,VINE ST. 3107195 S.BER,RTE.236,.31 BK.MAIN ST. 11.39 11.57 0.17 45 Paved Paved 8 8 2 2 24 0 0 0 0 4.16South Berwick 56694 56695 3107194 S.BER,RTE.236,VINE ST. 3107195 S.BER,RTE.236,.31 BK.MAIN ST. 11.39 11.57 0.01 45 Paved Paved 8 8 2 2 24 0 0 0 0 4.38South Berwick 56695 56696 3107195 S.BER,RTE.236,.31 BK.MAIN ST. 3107197 S.BER,RTE.236,MAIN ST. 11.57 11.88 0.31 25 Paved Paved 8 8 2 2 24 0 0 0 0 4.16South Berwick 56696 56697 3107197 S.BER,RTE.236,MAIN ST. 3107198 S,BER,MAIN,ACADEMY ST. 11.88 11.95 0.07 25 Curb present Curb present 0 6 3 2 24 0 0 0 0 3.45South Berwick 56697 57011 3107198 S,BER,MAIN,ACADEMY ST. 3107530 S.BER,MAIN,PAUL ST. 11.95 12.06 0.01 25 Curb present Curb present 0 6 3 2 24 0 0 0 0 3.45South Berwick 56697 57011 3107198 S,BER,MAIN,ACADEMY ST. 3107530 S.BER,MAIN,PAUL ST. 11.95 12.06 0.01 25 Curb present Curb present 0 6 3 2 24 0 0 0 0 3.45South Berwick 56697 57011 3107198 S,BER,MAIN,ACADEMY ST. 3107530 S.BER,MAIN,PAUL ST. 11.95 12.06 0.01 25 Curb present Curb present 8 6 3 2 24 0 0 0 0 3.82South Berwick 56697 57011 3107198 S,BER,MAIN,ACADEMY ST. 3107530 S.BER,MAIN,PAUL ST. 11.95 12.06 0.01 25 Curb present Curb present 8 8 2 2 20 0 0 0 0 3.82South Berwick 56697 57011 3107198 S,BER,MAIN,ACADEMY ST. 3107530 S.BER,MAIN,PAUL ST. 11.95 12.06 0.01 25 Curb present Curb present 8 8 2 2 20 0 0 0 0 3.82South Berwick 56697 57011 3107198 S,BER,MAIN,ACADEMY ST. 3107530 S.BER,MAIN,PAUL ST. 11.95 12.06 0.02 25 Curb present Curb present 8 8 3 2 20 0 0 0 0 3.82South Berwick 56697 57011 3107198 S,BER,MAIN,ACADEMY ST. 3107530 S.BER,MAIN,PAUL ST. 11.95 12.06 0.03 25 Curb present Curb present 8 8 3 2 20 0 0 1 13 3.82South Berwick 56697 57011 3107198 S,BER,MAIN,ACADEMY ST. 3107530 S.BER,MAIN,PAUL ST. 11.95 12.06 0.01 25 Curb present Curb present 8 8 3 2 20 0 0 1 13 3.82South Berwick 57011 56698 3107530 S.BER,MAIN,PAUL ST. 3107199 S,BER,MAIN,PORTLAND ST. 12.06 12.09 0.03 25 Curb present Curb present 8 8 3 2 20 0 0 1 13 3.82

Appendix IV A-25

Appendix IV A-26

Appendix IV A-27

Appendix IV A-28

Appendix IV A-29

Appendix IV A-30

Appendix IV A-31

Appendix IV A-32

Appendix IV A-33

Appendix IV A-34

Appendix IV A-35

Appendix IV A-36

Appendix IV A-37

Appendix IV A-38

Appendix IV A-39

Appendix IV A-40

Appendix IV A-41

Appendix IV A-42

Appendix IV A-43

Appendix IV A-44

Appendix V A-45
Route 236 NorthboundTrip Descriptions Run 1 Run 2 Run 3 Run 4 Run 5 Run 6 Run 7 Run 8 Run 9 Run 10 Run 11 Run 12 Run 13 Run 14 Run 15 Run 16 Run 17 Run 18 Run 19 Run 20 Run 21 Run 22 Run 23 Run 24 Run 25 Run 26 Run 27 Run 28 Run 29 Run 30 Run 31 ATS
Point Town and Junctions Noted 1:08 PM 1:50 PM 2:43 PM 3:28 PM 4:09 PM 4:56 PM 5:43 PM 6:18 AM 6:55 AM 7:43 AM 8:34 AM 9:27 AM 10:04 AM 10:39 AM 12:02 PM 12:40 PM 1:23 PM 2:03 PM 2:42 PM 3:27 PM 4:08 PM 4:52 PM 5:34 PM 6:22 AM 7:00 AM 7:43 AM 8:34 AM 9:37 AM 10:12 AM 10:56 AM 11:37 AM (mph)A Kittery Kittery Circle
B Kittery NB Off-Ramp Cross Over 34.94 34.94 37.13 34.94 34.94 37.13 37.13 37.13 34.94 33.00 29.70 34.94 34.94 34.94 34.94 29.70 33.00 33.00 29.70 33.00 31.26 34.94 33.00 33.00 33.00 34.94 31.26 37.13 33.00 33.00 33.00 33.8C Kittery SB Off-Ramp Cross Over 57.86 42.63 47.65 42.63 45.00 47.65 42.63 45.00 42.63 45.00 38.57 42.63 40.50 40.50 42.63 40.50 40.50 40.50 42.63 40.50 40.50 45.00 40.50 40.50 38.57 42.63 42.63 45.00 40.50 40.50 38.57 42.4
D Kittery Dana Rd (End of Island&4-lan) 45.00 48.00 51.43 42.35 40.00 48.00 48.00 48.00 48.00 48.00 45.00 48.00 51.43 45.00 48.00 45.00 42.35 45.00 48.00 48.00 40.00 48.00 45.00 40.00 42.35 45.00 45.00 45.00 42.35 40.00 45.00 45.3E Kittery Martin Road 32.23 46.20 37.46 21.66 17.54 15.75 47.79 49.50 44.71 47.79 44.71 47.79 47.79 28.29 33.80 43.31 43.31 39.60 46.20 46.20 25.20 42.00 44.71 40.76 44.71 26.65 46.20 35.54 42.00 33.00 28.29 35.1F Kittery MacKenzie Lane 40.65 50.40 40.65 32.31 39.38 38.18 50.40 46.67 48.46 46.67 48.46 42.00 48.46 39.38 38.18 40.65 46.67 45.00 42.00 46.67 42.00 46.67 34.05 45.00 46.67 37.06 46.67 36.00 46.67 39.38 40.65 42.4G Eliot Bolt Hill Road 52.43 50.25 46.38 44.67 46.38 50.25 54.82 44.67 50.25 44.67 44.67 44.67 48.24 52.43 40.20 46.38 48.24 43.07 46.38 44.67 40.20 46.38 46.38 46.38 44.67 36.55 44.67 44.67 50.25 48.24 44.67 46.0
H Eliot Drive For Boat Buisness (end 2-lanes NB) 53.03 50.31 45.63 51.63 40.04 51.63 45.63 46.71 50.31 46.71 44.59 44.59 51.63 53.03 41.74 47.85 44.59 46.71 47.85 44.59 42.65 45.63 47.85 50.31 46.71 37.02 42.65 44.59 44.59 50.31 45.63 46.4
I Eliot Beech Road 35.05 28.34 40.36 33.30 21.48 44.40 26.12 42.97 41.62 28.96 36.00 40.36 31.71 45.93 18.76 28.96 36.00 20.18 42.97 35.05 19.59 26.12 26.64 30.27 36.00 36.00 22.58 27.75 38.06 32.49 33.30 30.6
J Eliot Passamaquoddy (Begin 2-lanes NB) 37.03 35.35 38.88 38.88 35.35 43.20 40.93 38.88 43.20 33.81 37.03 40.93 35.35 45.74 35.35 37.03 43.20 31.10 45.74 37.03 37.03 37.03 32.40 37.03 38.88 43.20 35.35 37.03 38.88 37.03 38.88 38.0
K Eliot 35/45 MPH Zone Change 51.84 45.74 48.60 38.88 38.88 59.82 48.60 55.54 45.74 51.84 38.88 48.60 45.74 59.82 48.60 33.81 48.60 45.74 48.60 38.88 40.93 43.20 37.03 45.74 45.74 43.20 45.74 51.84 40.93 51.84 48.60 45.6L Eliot BradStreet(-End of G Rail) 46.67 46.67 43.56 46.67 46.67 43.56 50.26 48.40 48.40 46.67 46.67 46.67 43.56 50.26 48.40 45.06 50.26 50.26 31.11 24.66 26.14 28.41 22.93 30.39 28.41 29.04 29.70 31.11 39.60 43.56 50.26 38.3
M Eliot NB School Zone Limit Lights 45.98 47.11 45.98 51.57 17.27 50.21 50.21 51.57 47.11 47.70 47.70 47.70 43.86 53.75 53.75 39.34 53.00 51.57 54.51 44.89 19.08 47.11 42.40 51.57 38.94 48.92 48.30 53.75 42.88 54.51 47.70 43.4N Eliot Depot Road 43.71 40.80 40.80 13.91 32.21 40.80 40.80 26.61 11.33 25.50 43.71 38.25 38.25 51.00 26.61 26.61 47.08 15.30 47.08 11.77 17.00 36.00 27.82 43.71 13.02 18.00 36.00 51.00 47.08 47.08 43.71 27.1
O Eliot SB School Zone Limit Lights 57.00 42.75 42.75 34.20 34.20 42.75 42.75 26.31 26.31 28.50 42.75 42.75 42.75 48.86 28.50 31.09 48.86 21.37 48.86 28.50 28.50 42.75 38.00 48.86 21.37 28.50 31.09 42.75 42.75 42.75 38.00 35.3P Eliot Ambush Rock Lane 49.66 45.71 50.53 51.43 42.35 53.33 51.43 54.34 19.59 25.26 52.36 50.53 53.33 53.33 53.33 42.35 56.47 51.43 55.38 51.43 47.21 49.66 40.56 50.53 45.71 24.00 48.81 54.34 55.38 49.66 54.34 44.9Q Eliot Route 103 45.00 43.85 43.85 46.22 40.71 46.22 47.50 46.22 38.86 31.67 47.50 42.75 50.29 40.71 47.50 43.85 48.86 50.29 48.86 41.71 46.22 45.00 36.38 42.75 42.75 27.14 45.00 46.22 47.50 45.00 48.86 43.3R Eliot Heron Cove Road 41.04 51.30 44.61 44.61 38.00 42.75 46.64 48.86 42.75 38.00 44.61 44.61 48.86 39.46 48.86 44.61 51.30 46.64 51.30 38.00 44.61 42.75 35.38 39.46 41.04 31.09 48.86 48.86 48.86 46.64 51.30 43.7S Eliot Route 101 27.00 36.00 43.20 39.27 16.62 30.86 43.20 18.78 16.00 39.27 18.00 20.57 48.00 39.27 48.00 39.27 48.00 43.20 48.00 33.23 20.57 27.00 12.71 18.78 9.19 39.27 48.00 48.00 28.80 18.78 43.20 26.6T Eliot End of SB G Rail (x sign) 33.75 38.57 49.09 45.00 33.75 33.75 45.00 33.75 30.00 38.57 31.76 33.75 45.00 33.75 38.57 45.00 38.57 36.00 38.57 36.00 33.75 36.00 36.00 30.00 28.42 31.76 41.54 41.54 33.75 30.00 38.57 36.1
U Eliot 45/55 mph Sign (Grails/oTL) 45.28 53.78 50.61 50.61 47.80 50.61 53.78 47.80 43.02 47.80 50.61 47.80 50.61 47.80 50.61 47.80 53.78 50.61 47.80 45.28 45.28 47.80 50.61 47.80 47.80 45.28 50.61 50.61 50.61 40.97 50.61 48.6V S. Berwick Lord's Road 53.42 58.07 55.65 47.70 51.37 53.42 49.47 55.65 47.70 58.07 56.83 49.47 58.07 54.51 55.65 49.47 56.83 55.65 49.47 51.37 50.40 48.57 50.40 53.42 49.47 47.70 48.57 55.65 50.40 47.70 54.51 52.2W S. Berwick NB 15 School Zone Speed 51.08 52.50 51.08 49.74 55.59 55.59 52.50 55.59 45.00 57.27 57.27 49.74 59.06 55.59 57.27 49.74 51.08 49.74 54.00 46.10 54.00 52.50 51.08 54.00 42.95 45.00 48.46 54.00 52.50 52.50 52.50 51.8X S. Berwick SB 15 School Zone Speed 47.06 21.25 47.06 50.68 54.90 47.06 43.92 54.90 20.59 50.68 54.90 47.06 50.68 43.92 50.68 50.68 43.92 18.30 47.06 47.06 50.68 50.68 47.06 50.68 16.89 41.18 47.06 50.68 38.75 47.06 43.92 40.0Y S. Berwick 55/45 mph Speed Zone 49.75 49.75 51.06 55.44 57.07 55.44 53.90 53.90 45.13 55.44 58.80 49.75 57.07 55.44 57.07 52.44 49.75 51.06 55.44 53.90 55.44 55.44 47.33 53.90 44.10 45.13 51.06 53.90 45.13 53.90 51.06 52.1Z S. Berwick Route 91 45.60 54.72 49.75 52.11 54.72 47.58 45.60 52.11 49.75 45.60 54.72 47.58 52.11 49.75 49.75 52.11 45.60 52.11 49.75 47.58 47.58 49.75 42.09 47.58 49.75 42.09 40.53 47.58 43.78 45.60 52.11 48.3
AA S. Berwick Quarry Drive 47.61 49.20 46.13 46.13 42.17 46.13 46.13 50.90 47.61 43.41 50.90 42.17 50.90 49.20 49.20 43.41 43.41 50.90 44.73 44.73 46.13 46.13 41.00 46.13 47.61 44.73 41.00 50.90 47.61 50.90 49.20 46.5
BB S. Berwick Brattle St (Vaughan Woods) 45.32 48.15 45.32 48.15 42.80 45.32 48.15 48.15 48.15 38.52 45.32 38.52 45.32 45.32 48.15 40.55 40.55 42.80 40.55 42.80 45.32 42.80 42.80 42.80 42.80 40.55 40.55 45.32 42.80 45.32 51.36 44.0CC S. Berwick Vine St. (school area) 45.94 50.31 46.96 46.96 49.14 46.96 46.96 45.94 50.31 43.13 49.14 49.14 49.14 48.03 46.96 44.03 43.13 44.03 44.03 43.13 45.94 46.96 38.42 44.96 39.13 42.26 40.64 45.94 45.94 46.96 46.96 45.5DD S. Berwick 45/25 mph Speed Zone 42.80 55.03 44.45 36.11 50.24 37.28 44.45 44.45 48.15 46.22 50.24 48.15 48.15 48.15 48.15 46.22 41.27 46.22 44.45 44.45 37.28 46.22 39.85 44.45 48.15 44.45 42.80 48.15 44.45 46.22 48.15 44.9EE S. Berwick Route 4 12.71 27.16 6.87 12.45 3.15 4.94 5.53 23.90 21.34 11.07 21.34 18.68 19.92 28.46 23.90 21.34 16.15 22.13 3.32 10.13 4.30 11.95 14.94 28.46 24.90 22.13 17.58 23.90 21.34 19.92 22.13 11.3FF S. Berwick Academy St 23.40 23.40 10.80 23.40 56.16 25.53 25.53 23.40 25.53 21.60 23.40 28.08 23.40 25.53 20.06 23.40 25.53 25.53 23.40 12.76 11.23 23.40 23.40 21.60 25.53 18.72 25.53 25.53 23.40 16.52 28.08 21.7GG S. Berwick Route4/Portland St 21.60 24.00 11.08 20.57 22.74 24.00 24.00 22.74 20.57 19.64 20.57 22.74 24.00 22.74 16.62 19.64 19.64 20.57 13.50 11.37 13.94 20.57 21.60 20.57 21.60 17.28 22.74 20.57 19.64 10.80 21.60 18.8HH S. Berwick Route4/Highland Ave 25.32 26.23 23.69 27.20 17.08 25.32 26.23 29.38 26.23 25.32 26.23 25.32 26.23 25.32 23.69 24.48 24.48 23.69 20.98 23.69 23.69 22.95 22.25 25.32 26.23 21.60 22.25 25.32 22.95 20.98 24.48 24.1II S. Berwick Route4 / Agamenticus 33.20 31.45 31.45 31.45 22.98 29.88 35.15 35.15 33.20 29.88 33.20 33.20 29.88 31.45 29.88 31.45 31.45 29.88 28.46 31.45 29.88 33.20 29.88 31.45 31.45 25.98 29.88 29.88 31.45 28.46 28.46 30.6
Route 236 SouthboundTrip Descriptions Run 1 Run 2 Run 3 Run 4 Run 5 Run 6 Run 7 Run 8 Run 9 Run 10 Run 11 Run 12 Run 13 Run 14 Run 15 Run 16 Run 17 Run 18 Run 19 Run 20 Run 21 Run 22 Run 23 Run 24 Run 25 Run 26 Run 27 Run 28 Run 29 Run 30 Run 31 ATS
Point Town and Junctions Noted 12:48 PM 1:31 PM 2:09 PM 3:10 PM 3:53 PM 4:39 PM 5:20 PM 6:01 AM 6:36 AM 7:20 AM 8:06 AM 8:54 AM 9:47 AM 10:22 AM 11:44 AM 12:23 PM 1:02 PM 1:44 PM 2:24 PM 3:06 PM 3:51 PM 4:34 PM 5:13 PM 6:42 AM 7:24 AM 8:15 AM 8:58 AM 9:55 AM 10:39 AM 11:16 AM 11:53 AM (mph)II S. Berwick Route4 / Agamenticus
HH S. Berwick Route4/Highland Ave 37.35 33.20 28.46 31.45 31.45 29.88 31.45 33.20 31.45 27.16 27.16 31.45 29.88 31.45 27.16 29.88 29.88 31.45 29.88 22.98 31.45 31.45 25.98 24.90 29.88 23.90 25.98 29.88 29.88 29.88 31.45 29.3GG S. Berwick Route4/Portland St 22.95 6.02 3.99 5.03 13.11 22.25 1.58 7.90 4.42 13.11 2.49 13.11 10.06 17.91 11.48 17.08 21.60 6.12 17.91 3.85 24.48 10.64 3.71 17.08 14.69 8.96 6.39 19.33 19.33 9.30 12.66 8.3FF S. Berwick Academy St 21.60 20.57 20.57 16.00 18.78 20.57 20.57 24.00 18.00 17.28 8.31 18.78 19.64 21.60 18.78 19.64 19.64 19.64 19.64 5.92 18.78 20.57 17.28 18.00 18.78 6.17 17.28 20.57 20.57 16.62 20.57 16.3EE S. Berwick Route 4 23.40 25.53 23.40 17.55 14.78 17.55 20.06 23.40 21.60 10.40 14.78 23.40 21.60 23.40 12.21 12.76 14.78 15.60 21.60 9.36 20.06 11.70 7.20 18.72 12.21 11.23 21.60 23.40 23.40 23.40 18.72 16.0DD S. Berwick 25/45 mph Speed Zone 33.20 33.20 31.45 29.88 29.88 29.88 29.88 35.15 33.20 31.45 28.46 29.88 33.20 31.45 29.88 27.16 29.88 29.88 28.46 27.16 31.45 28.46 35.15 29.88 29.88 29.88 37.35 33.20 33.20 31.45 29.88 30.8CC S. Berwick Vine St. (school area) 42.80 42.80 42.80 37.28 41.27 38.52 44.45 46.22 46.22 44.45 41.27 41.27 44.45 41.27 46.22 42.80 41.27 46.22 42.80 41.27 38.52 44.45 42.80 44.45 42.80 39.85 44.45 44.45 44.45 42.80 44.45 42.5
BB S. Berwick Brattle St (Vaughan Woods) 44.96 51.54 49.14 43.13 45.94 44.03 49.14 52.83 49.14 45.94 46.96 49.14 44.96 49.14 46.96 45.94 34.08 49.14 45.94 46.96 46.96 48.03 44.96 45.94 46.96 44.96 49.14 45.94 45.94 50.31 42.26 46.3AA S. Berwick Quarry Drive 42.80 48.15 48.15 48.15 51.36 42.80 51.36 51.36 45.32 42.80 45.32 48.15 42.80 48.15 42.80 45.32 42.80 48.15 45.32 51.36 48.15 48.15 48.15 48.15 45.32 48.15 48.15 45.32 45.32 45.32 45.32 46.5Z S. Berwick Route 91 46.13 52.71 42.17 50.90 52.71 46.13 49.20 44.73 49.20 44.73 47.61 52.71 47.61 49.20 44.73 49.20 50.90 50.90 47.61 43.41 46.13 49.20 50.90 46.13 47.61 46.13 50.90 44.73 44.73 42.17 43.41 51.1Y S. Berwick 45/55 mph Speed Zone 45.60 47.58 42.09 43.78 52.11 47.58 45.60 49.75 45.60 43.78 47.58 52.11 45.60 45.60 45.60 49.75 49.75 47.58 47.58 36.48 45.60 52.11 49.75 45.60 49.75 47.58 52.11 47.58 47.58 47.58 45.60 47.0X S. Berwick SB 15 School Zone Speed 48.51 52.44 46.20 49.75 57.07 47.33 58.80 53.90 53.90 45.13 53.90 55.44 55.44 52.44 57.07 55.44 53.90 57.07 41.29 48.51 53.90 55.44 53.90 43.12 48.51 57.07 51.06 57.07 57.07 57.07 55.44 51.9W S. Berwick NB 15 School Zone Speed 59.89 54.90 22.72 59.89 47.06 50.68 59.89 54.90 54.90 14.97 50.68 54.90 54.90 54.90 59.89 54.90 54.90 54.90 16.47 50.68 54.90 50.68 47.06 43.92 16.89 54.90 50.68 54.90 54.90 59.89 54.90 42.1V S. Berwick Lord's Road 54.00 55.59 34.36 59.06 55.59 51.08 60.97 55.59 57.27 43.95 55.59 60.97 59.06 55.59 60.97 60.97 57.27 54.00 49.74 49.74 51.08 54.00 54.00 47.25 47.25 55.59 54.00 60.97 60.97 59.06 59.06 53.6
U Eliot 55/45 mph Sign (Grails/oTL) 48.57 50.40 31.06 59.36 58.07 51.37 59.36 56.83 52.38 45.27 55.65 59.36 55.65 50.40 59.36 56.83 55.65 49.47 47.70 52.38 49.47 58.07 54.51 44.52 53.42 48.57 50.40 58.07 58.07 56.83 55.65 51.9T Eliot End of SB G Rail (x sign) 30.73 45.28 39.11 61.46 53.78 53.78 61.46 47.80 47.80 35.85 45.28 57.36 53.78 45.28 53.78 47.80 57.36 43.02 47.80 53.78 47.80 53.78 50.61 47.80 50.61 45.28 50.61 57.36 57.36 53.78 57.36 48.9S Eliot Route 101 10.19 22.50 38.57 14.59 41.54 15.88 20.00 16.36 33.75 8.18 11.74 25.71 45.00 33.75 8.85 28.42 36.00 36.00 15.88 45.00 8.31 10.19 7.83 24.55 10.19 33.75 17.42 13.17 13.17 30.00 20.77 16.6R Eliot Heron Cove Road 21.60 33.23 39.27 39.27 30.86 28.80 33.23 30.86 33.23 36.00 36.00 25.41 48.00 28.80 33.23 39.27 36.00 43.20 33.23 39.27 33.23 33.23 33.23 28.80 30.86 36.00 36.00 30.86 30.86 36.00 28.80 32.8Q Eliot Route 103 34.20 46.64 39.46 42.75 41.04 51.30 51.30 41.04 44.61 42.75 44.61 38.00 46.64 32.06 46.64 41.04 46.64 44.61 44.61 42.75 46.64 34.20 39.46 39.46 42.75 41.04 44.61 48.86 48.86 44.61 46.64 42.7P Eliot Ambush Rock Lane 40.71 45.00 42.75 47.50 46.22 51.82 48.86 46.22 43.85 42.75 43.85 45.00 46.22 36.38 47.50 50.29 50.29 34.90 47.50 47.50 47.50 43.85 47.50 40.71 43.85 41.71 47.50 51.82 51.82 42.75 47.50 45.2
O Eliot SB School Zone Limit Lights 50.53 47.21 26.92 58.78 51.43 56.47 60.00 53.33 46.45 15.24 48.00 48.81 52.36 45.71 50.53 54.34 57.60 47.21 48.00 48.81 51.43 49.66 54.34 45.71 52.36 46.45 47.21 56.47 56.47 46.45 50.53 45.9N Eliot Depot Road 16.29 42.75 20.12 48.86 42.75 48.86 48.86 42.75 38.00 7.28 42.75 15.55 19.00 34.20 42.75 13.15 48.86 31.09 24.43 42.75 42.75 34.20 9.24 18.00 19.00 8.77 42.75 42.75 42.75 12.67 7.95 21.4
M Eliot NB School Zone Limit Lights 38.25 51.00 27.82 47.08 38.25 43.71 51.00 47.08 38.25 29.14 43.71 29.14 36.00 36.00 47.08 36.00 51.00 36.00 19.74 43.71 43.71 43.71 36.00 32.21 36.00 36.00 43.71 40.80 40.80 38.25 38.25 37.6L Eliot BradStreet(-End of G Rail) 51.57 55.30 53.75 47.11 48.30 45.43 50.21 52.27 44.89 43.86 50.88 45.98 47.11 41.48 50.21 42.40 56.12 47.11 48.92 51.57 45.43 42.88 48.92 43.86 47.70 50.88 49.56 45.98 45.98 47.11 50.21 47.7K 45/35 MPH Zone Change 48.40 52.27 52.27 46.67 45.06 45.06 48.40 50.26 46.67 43.56 45.06 48.40 43.56 42.15 48.40 42.15 45.06 46.67 52.27 46.67 43.56 43.56 50.26 43.56 46.67 48.40 50.26 48.40 48.40 43.56 48.40 46.6
J Eliot Passamaquoddy (Begin 2-lanes NB) 37.03 48.60 48.60 48.60 40.93 40.93 45.74 45.74 45.74 37.03 40.93 45.74 38.88 43.20 48.60 45.74 37.03 45.74 45.74 37.03 45.74 40.93 51.84 48.60 45.74 45.74 38.88 45.74 45.74 40.93 45.74 43.4
I Eliot Beech Road 31.10 23.56 40.93 24.30 38.88 20.46 14.95 26.81 43.20 35.35 43.20 45.74 32.40 35.35 14.40 25.08 18.08 18.08 19.44 18.08 28.80 25.08 23.56 43.20 26.81 17.67 38.88 45.74 45.74 37.03 40.93 27.2
H Eliot Drive For Boat Buisness (end 2-lanes NB) 33.30 39.18 41.62 39.18 36.00 38.06 34.15 38.06 42.97 35.05 44.40 44.40 38.06 40.36 39.18 38.06 37.00 36.00 38.06 37.00 29.60 36.00 38.06 37.00 36.00 37.00 37.00 44.40 44.40 39.18 44.40 38.3
G Eliot Bolt Hill Road 42.65 53.03 44.59 49.05 40.88 40.04 41.74 47.85 49.05 43.60 47.85 50.31 45.63 51.63 46.71 41.74 47.85 44.59 50.31 49.05 42.65 43.60 47.85 40.88 39.24 47.85 49.05 46.71 46.71 42.65 53.03 45.7F Kittery MacKenzie Lane 40.20 52.43 46.38 54.82 43.07 44.67 40.20 48.24 46.38 44.67 44.67 54.82 46.38 52.43 52.43 43.07 50.25 50.25 48.24 50.25 48.24 46.38 48.24 43.07 48.24 50.25 50.25 43.07 43.07 46.38 52.43 47.4E Kittery Martin Road 38.18 50.40 34.05 52.50 42.00 38.18 40.65 45.00 33.16 26.81 34.05 46.67 40.65 50.40 39.38 35.00 46.67 45.00 45.00 50.40 46.67 23.33 43.45 43.45 27.39 46.67 48.46 29.30 29.30 42.00 34.05 38.5
D Kittery Dana Rd (End of Island&4-lan) 42.00 44.71 38.50 40.76 39.60 42.00 42.00 44.71 42.00 33.80 40.76 43.31 39.60 47.79 39.60 42.00 46.20 44.71 43.31 44.71 47.79 34.65 43.31 42.00 38.50 44.71 46.20 37.46 37.46 42.00 38.50 41.5C Kittery SB Off-Ramp Cross Over 45.00 48.00 48.00 45.00 48.00 45.00 48.00 45.00 45.00 42.35 48.00 48.00 45.00 48.00 51.43 48.00 48.00 45.00 42.35 45.00 45.00 42.35 45.00 42.35 42.35 48.00 45.00 45.00 45.00 45.00 45.00 45.6B Kittery NB Off-Ramp Cross Over 42.63 40.50 45.00 45.00 42.63 42.63 47.65 40.50 45.00 40.50 45.00 45.00 45.00 42.63 42.63 42.63 42.63 42.63 40.50 45.00 40.50 42.63 42.63 40.50 38.57 38.57 45.00 40.50 40.50 38.57 38.57 42.1A Kittery Kittery Circle 23.76 34.94 33.00 31.26 27.00 28.29 24.75 33.00 33.00 29.70 34.94 33.00 33.00 33.00 29.70 29.70 33.00 29.70 31.26 31.26 29.70 29.70 34.94 33.00 29.70 31.26 33.00 33.00 33.00 33.00 28.29 31.1