Embed Size (px)
Citation preview

Redistribution through Minimum Wage Regulation:An Analysis of Program Linkages and Budgetary Spillovers
Jeffrey ClemensUCSD (visiting SIEPR) and NBER
September 2015

Motivation
The minimum wage is a hotly debated policy topic
It is also a very difficult policy to evaluate
I Empirics of employment effects
I Nuanced range of potential effects
This paper highlights program and budgetary spillover effects
I Program spillovers and the well being of job losers
I Effects of earnings and employment changes on tax revenue
I Both effects likely depend significantly on macroeconomic context
2 / 29

1. Motivation
2. Data and Estimation Framework
3. Effects on the Wage Distributions of Low-Skilled Workers
4. Effects on the Employment of Low-Skilled Workers
5. Effects on the Earnings Distribution
6. Effects on Program Participation and Payroll Tax Revenues
7. Conclusion
3 / 29

1. Motivation
2. Data and Estimation Framework
3. Effects on the Wage Distributions of Low-Skilled Workers
4. Effects on the Employment of Low-Skilled Workers
5. Effects on the Earnings Distribution
6. Effects on Program Participation and Payroll Tax Revenues
7. Conclusion
4 / 29

Basic Approach: Follows Clemens and Wither (2014)
Analyze recent increases in the federal minimum wage, which weredifferentially binding across states
I “U.S. Troop Readiness, Veterans’ Care, Katrina Recovery, andIraq Accountability Appropriations Act” of 2007.
I Increases went into effect in July 2007, 2008, and 2009
Analysis uses the 2008 panel of the Survey of Income and ProgramParticipation (SIPP)
I SIPP sample begins in August 2008
I 4 years of individual-level panel data
I Samples of low-skilled workers selected on the basis of theiraverage wage between August 2008 and July 2009
5 / 29

Minimum Wage Trends in Bound and Unbound States
$5
.00
$6
.00
$7
.00
$8
.00
Avg
. E
ffe
ctive
Min
. W
ag
e
Jul,06 Jul,08 Jul,10 Jul,12
States Bound by Federal Minimum Wage Increases
States Not Bound by Federal Minimum Wage Increases
Average Effective Minimum Wages
6 / 29

Map of Bound and Unbound States
7 / 29

Research Context
Previous work (Clemens and Wither, 2014) uses this setting toestimate employment effects
Things to note:
I That paper conducts an extensive robustness analysis
I The estimated employment effects are substantial
This paper explores two issues:
I To what extent did safety net programs cushion the incomes ofjob losers?
I What are the implications for the public budgets
8 / 29

Baseline Difference-in-Differences Framework
Yi ,s,t =∑
p(t)6=0
βp(t)Bounds × Periodp(t)
+ α1s States + α2t Timet + α3i Individuali
+ Xs,tγ + εi ,s,t . (1)
Coefficients of interest: βp(t)
I Differential changes in bound vs. unbound states
I Periods include Transition, Post 1, and Post 2
Elements of the robustness analysis
I State level macro conditions: Xs,t and triple-difference approach
I Trends assoc. w/ many baseline characteristics
9 / 29

1. Motivation
2. Data and Estimation Framework
3. Effects on the Wage Distributions of Low-Skilled Workers
4. Effects on the Employment of Low-Skilled Workers
5. Effects on the Earnings Distribution
6. Effects on Program Participation and Payroll Tax Revenues
7. Conclusion
10 / 29

Prob. of Wage between Old and New Fed. Min.
0.1
5.3
.45
Wa
ge
$5
.15
−$
7.2
5
Jul,08 Jul,09 Jul,10 Jul,11 Jul,12
States Bound by Federal Minimum Wage Increases
States Not Bound by Federal Minimum Wage Increases
Wage Between $5.15−$7.25
Ave. Baseline Wages: < $7.50
11 / 29

Estimating “First Stage” Impacts on the Wage Distribution
Yi ,s,t =∑
p(t)6=0
βp(t)Bounds × Periodp(t)
+ α1s States + α2t Timet + α3i Individuali
+ Xs,tγ + εi ,s,t .
Dependent variables for tracking effects on the wage distribution
Y ji ,s,t = 1{W j−1 < Hourly Wagei ,s,t <W j}.
Dependent variables:
I Indicator equal to 1 if wage is between Wj−1 and Wj
I Trace out changes in the wage PMF in 50 cent bins
12 / 29

Shift in the Wage Distribution of Low-Skilled Workers
-.2
-.1
0.1
.2D
-in-D
Coe
ffici
ents
02.
55
7.5
10N
umbe
r of
Obs
. (1,
000'
s)
$6.55$7.25$0.00 $5.00 $10.00 $15.00 $20.00
Hourly Wage Cutoffs
D-in-D Coefficient 95% CI Num. of Obs.
Changes in the Wage Distribution
13 / 29

1. Motivation
2. Data and Estimation Framework
3. Effects on the Wage Distributions of Low-Skilled Workers
4. Effects on the Employment of Low-Skilled Workers
5. Effects on the Earnings Distribution
6. Effects on Program Participation and Payroll Tax Revenues
7. Conclusion
14 / 29

Significant Declines in Paid Employment
Employed Unpaid Work No Earnings(1) (2) (3)
Bound x Post 1 -0.043* 0.015 0.057**(0.018) (0.010) (0.019)
Bound x Post 2 -0.063** 0.019* 0.081***(0.018) (0.009) (0.022)
N 146,933 146,933 146,933Mean of Dep. Var. 0.766 0.187 0.421
Significant decline in paid employmentI Potential contributing forces:
I Binding in low cost of living states ($7.25 was 40-50% of median)I Enacted during a very weak labor marketI Became quite difficult to maintain both employment and Medicaid
eligibility (Clemens and Wither, 2015)
15 / 29

1. Motivation
2. Data and Estimation Framework
3. Effects on the Wage Distributions of Low-Skilled Workers
4. Effects on the Employment of Low-Skilled Workers
5. Effects on the Earnings Distribution
6. Effects on Program Participation and Payroll Tax Revenues
7. Conclusion
16 / 29

Short-Run Change in the Earnings Distribution
-.1
-.05
0.0
5.1
D-in
-D C
oeffi
cien
ts
$0 $1000 $2,000 $3,000 $4,000 $5,000Monthly Income
D-in-D Coefficient95% CI
Short-Run Changes in the Earnings Distribution
17 / 29
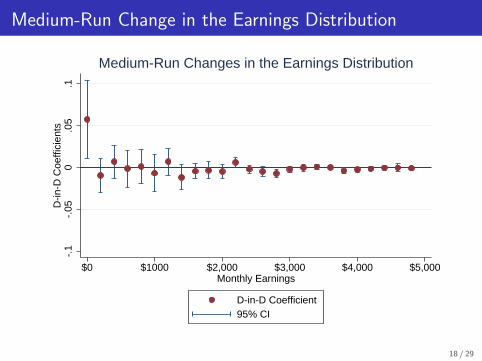
Medium-Run Change in the Earnings Distribution
-.1
-.05
0.0
5.1
D-in
-D C
oeffi
cien
ts
$0 $1000 $2,000 $3,000 $4,000 $5,000Monthly Earnings
D-in-D Coefficient95% CI
Medium-Run Changes in the Earnings Distribution
18 / 29

Earnings and Income
Total Income Earnings Property All Other(1) (2) (3) (4)
Bound x Post 1 -92.087* -87.026* -12.112 7.051(36.474) (38.035) (7.446) (13.330)
Bound x Post 2 -144.042** -165.342** -9.916 31.215+(44.748) (49.490) (8.174) (16.302)
N 147,459 147,459 147,459 147,459Mean of Dep. Var. 748.459 567.782 28.034 152.643
Takeaways:I Earnings declines reflect...
I Significant employment declinesI Lost experience accumulation
I Modest replacement of lost earnings through other sources
19 / 29

Medium-Run Change in the Income Distribution
-.1
-.05
0.0
5.1
D-in
-D C
oeffi
cien
ts
$0 $1000 $2,000 $3,000 $4,000 $5,000Monthly Income
D-in-D Coefficient95% CI
Changes in the Income Distribution
20 / 29

1. Motivation
2. Data and Estimation Framework
3. Effects on the Wage Distributions of Low-Skilled Workers
4. Effects on the Employment of Low-Skilled Workers
5. Effects on the Earnings Distribution
6. Effects on Program Participation and Payroll Tax Revenues
7. Conclusion
21 / 29

Program Participation
Means Cash Food Aid UI Soc. Sec. Any Benefit(1) (2) (3) (4) (5)
Bound x Post 1 0.004 0.000 -0.004 -0.004 0.003(0.005) (0.010) (0.007) (0.006) (0.012)
Bound x Post 2 0.011+ 0.002 -0.002 -0.002 0.012(0.006) (0.013) (0.007) (0.008) (0.016)
N 147,459 147,459 147,459 147,459 147,459Mean of Dep. Var. 0.039 0.139 0.021 0.043 0.205
Takeaways:
I Weak evidence of an increase in means tested cash welfare receipt
I No evidence of changes in other program participation
22 / 29

Benefit Receipt
Means Cash Food Aid UI Soc. Sec. Total Benefits(1) (2) (3) (4) (5)
Bound x Post 1 5.256 2.880 -4.623 -4.623 -1.110(3.700) (3.432) (5.164) (4.291) (7.236)
Bound x Post 2 7.915+ 1.906 5.940 -3.919 11.842(4.288) (5.129) (5.968) (6.807) (11.256)
N 147,459 147,459 147,459 147,459 147,459Mean of Dep. Var. 20.020 37.399 17.927 34.446 109.792
Takeaways:
I Dollar value of benefits also moves marginally
23 / 29

Implications for Payroll Tax Revenues
Soc. Sec. Tax Medicare Tax UI Tax Total Payroll Tax(1) (2) (3) (4)
Bound x Post 1 -10.791* -2.524* -2.176* -15.491*(4.716) (1.103) (0.951) (6.770)
Bound x Post 2 -20.502** -4.795** -4.134** -29.431**(6.137) (1.435) (1.237) (8.809)
N 147,459 147,459 147,459 147,459Mean of Dep. Var. 70.405 16.466 14.195 101.065
Takeaways:
I Reduced payroll tax revenues reflect net earnings declines
24 / 29

Aggregate Payroll Tax Implications
Inputs to back-of-the-envelope calculation
I “Target” population in affected states: ≈ 7 million
I Estimated decline in monthly payroll tax: $29.4
Implied annual in-sample reduction in payroll tax revenues
I 7 million× $29.4× 12 ≈ $2.5 billion
I Standard error: ≈ $1 billion
25 / 29

Other Potential Tax Impacts
Other potential effects on revenueI Personal income tax of targeted workers
I Earned Income Tax Credit
I Personal income tax of higher skilled workers
I Corporate income
26 / 29

Aggregate Benefit Expenditure Implications
Inputs to back-of-the-envelope calculation
I “Target” population in affected states: ≈ 7 million
I Estimated change in monthly benefits: $11.8
Implied annual in-sample reduction in payroll tax revenues
I 7 million× $11.8× 12 ≈ $1 billion
I Standard error: ≈ $1 billion
27 / 29

1. Motivation
2. Data and Estimation Framework
3. Effects on the Wage Distributions of Low-Skilled Workers
4. Effects on the Employment of Low-Skilled Workers
5. Effects on the Earnings Distribution
6. Effects on Program Participation and Payroll Tax Revenues
7. Conclusion
28 / 29

Conclusion
Program and budgetary spillovers are important policy-making inputs
Program linkages:
I Potential to cushion incomes of job losers
I Few data sources contain the relevant information
Budgetary spillovers:
I Can occur through a large number of channels
I Likely depend on macroeconomic conditions
29 / 29