Embed Size (px)
Citation preview
Nationalizing SDGs in
Sustainable Development Strategy: Egypt Vision
2030
Measuring and Monitoring SDGs in Egypt – UNDP & IFPRI
Dr. Nihal El-Megharbel
Vice Minister for Monitoring Ministry of Planning, Monitoring & Administrative
Reform
Thursday, 23rd of June 2016

Agenda
Introduction
Overview on Sustainable Development Strategy: Egypt Vision 2030
SDS Background
SDS Methodology
Components of SDS
Sustainable Development Strategy: Egypt Vision 2030 Pillars.
Sustainable Development Strategy: Egypt Vision 2030 vs. Sustainable
Development Goals
Summary
2

Introduction
The preparation for the SDS started in 2014 and lasted for two years.
It is the first formulated strategy in accordance with the methodology of long-term
strategic participatory planning. It has been prepared with wide social participation,
taking into account the visions of civil society, the private sector, ministries, and
government agencies.
A large number of international finance and development institutions gave attention
to the preparation of the strategy and participated in its formulation; ILO, USAID, JICA.
Assurance of consistency and coherence between the targets of Egypt’s national
sustainable development and the universal targets of the United Nations; Sustainable
Development Goals (SDGs).
Egypt has announced its adoption of the SDGs during the 70th round for the United
Nations General Assembly that took place during the period from 25-27 September, 2016,
thus declaring Egypt's precedence in integrating the Sustainable Development Concept and
targets into the national planning system.
3
Overview on Sustainable Development Strategy: Egypt Vision 2030
4
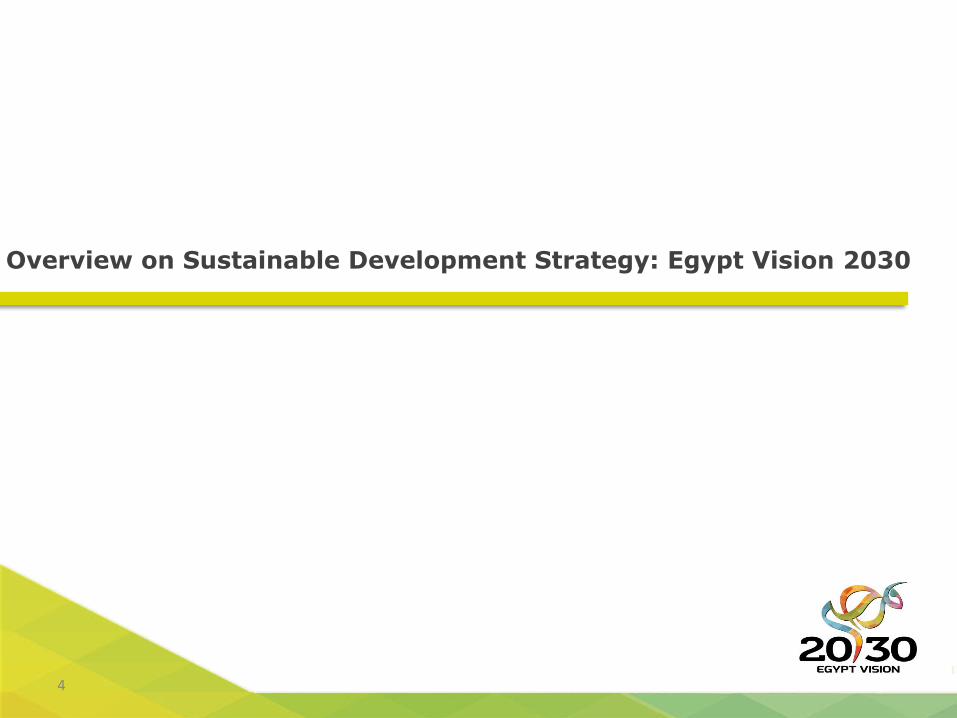
Sustainable Development Strategy (SDS): Egypt Vision 2030
5 5
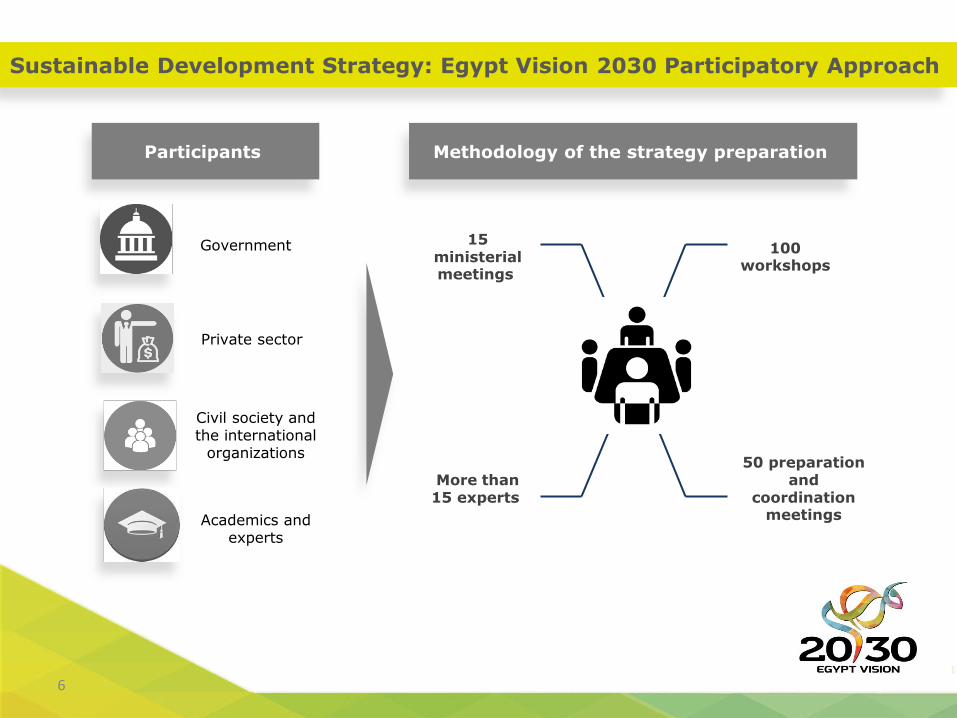
Sustainable Development Strategy: Egypt Vision 2030 Participatory Approach
15 ministerial meetings
100 workshops
50 preparation and
coordination meetings
More than 15 experts
Participants Methodology of the strategy preparation
Government
Private sector
Civil society and the international
organizations
Academics and experts
6

Main Goals of Sustainable Development Strategy: Egypt Vision 2030
7
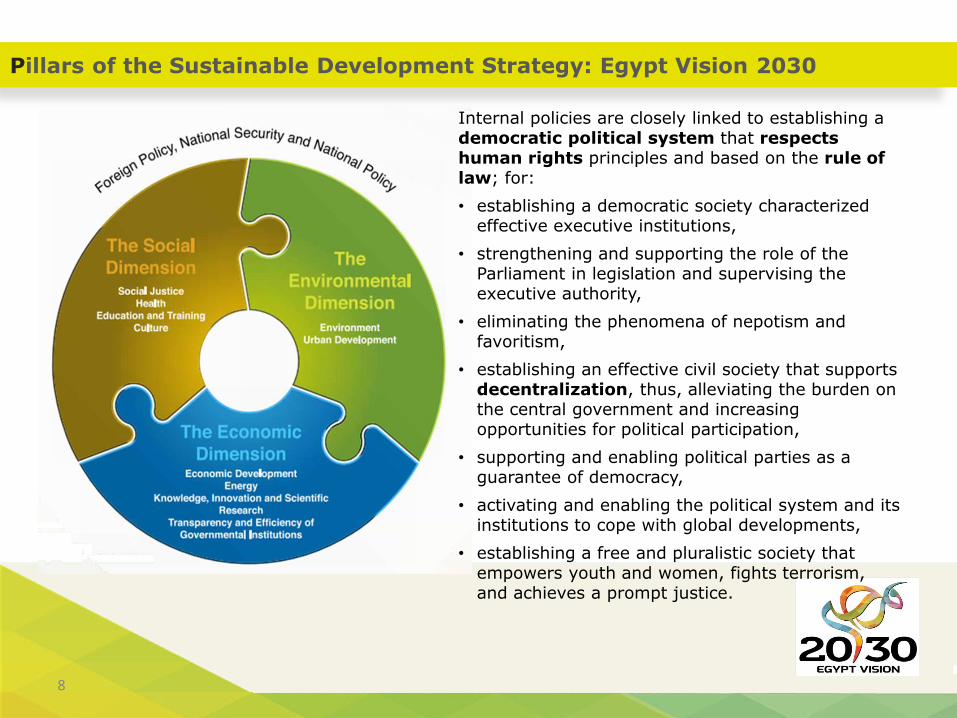
Pillars of the Sustainable Development Strategy: Egypt Vision 2030
Internal policies are closely linked to establishing a democratic political system that respects human rights principles and based on the rule of law; for:
• establishing a democratic society characterized effective executive institutions,
• strengthening and supporting the role of the Parliament in legislation and supervising the executive authority,
• eliminating the phenomena of nepotism and favoritism,
• establishing an effective civil society that supports decentralization, thus, alleviating the burden on the central government and increasing opportunities for political participation,
• supporting and enabling political parties as a guarantee of democracy,
• activating and enabling the political system and its institutions to cope with global developments,
• establishing a free and pluralistic society that empowers youth and women, fights terrorism, and achieves a prompt justice.
8
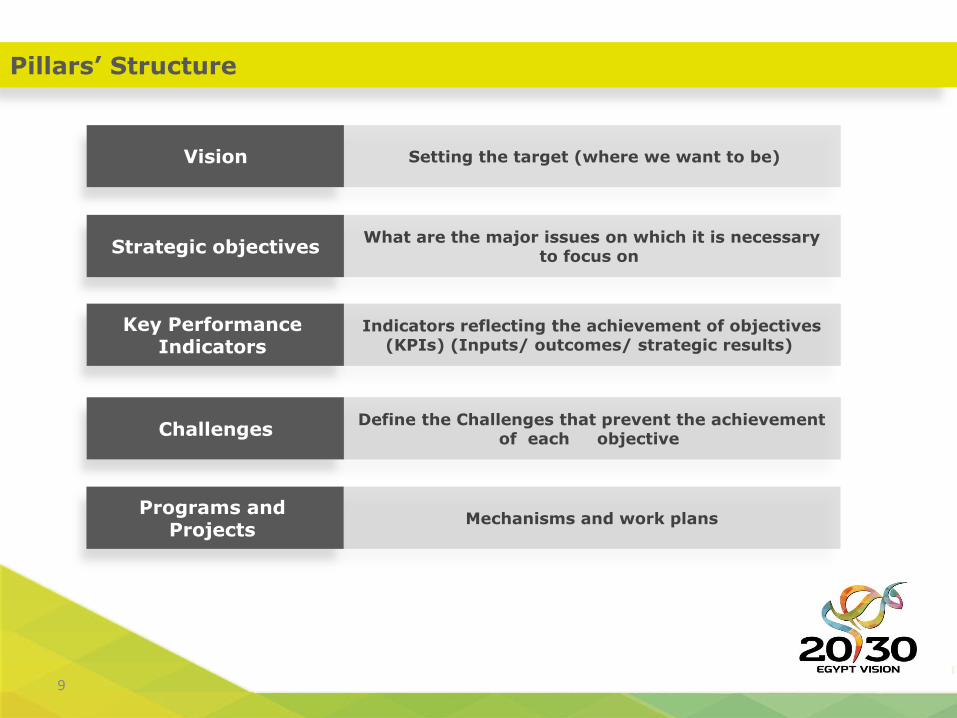
Pillars’ Structure
Setting the target (where we want to be) Vision
What are the major issues on which it is necessary to focus on
Strategic objectives
Indicators reflecting the achievement of objectives (KPIs) (Inputs/ outcomes/ strategic results)
Key Performance Indicators
Define the Challenges that prevent the achievement of each objective
Challenges
Mechanisms and work plans Programs and
Projects
9

SDS Vision for 2030
By 2030, the new Egypt will achieve a competitive, balanced,
diversified and knowledge based economy, characterized by
justice, social integration and participation, with a balanced
and diversified ecosystem, benefiting from its strategic
location and human capital to achieve sustainable
development for a better life to all Egyptians.
10
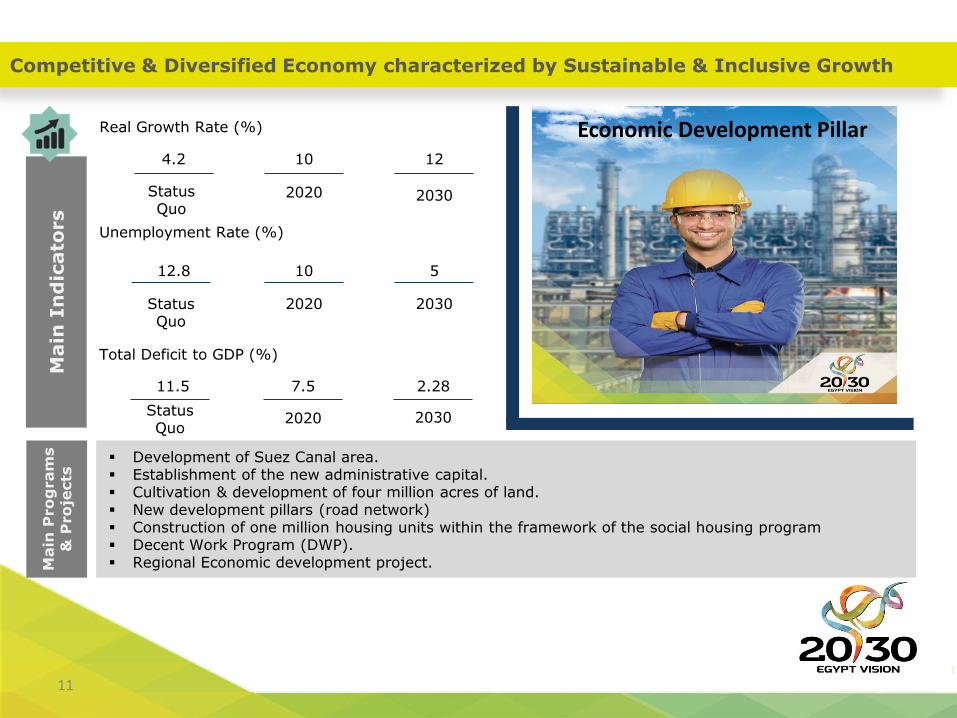
Competitive & Diversified Economy characterized by Sustainable & Inclusive Growth M
ain
In
dic
ato
rs
Main
Pro
gram
s
& P
ro
jects
Development of Suez Canal area. Establishment of the new administrative capital. Cultivation & development of four million acres of land. New development pillars (road network) Construction of one million housing units within the framework of the social housing program Decent Work Program (DWP). Regional Economic development project.
Real Growth Rate (%)
12
2030
10
2020
4.2
Status Quo
5
2030
10
2020
12.8
Status Quo
2.28
2030
7.5
2020
11.5 Status Quo
Unemployment Rate (%)
Total Deficit to GDP (%)
Economic Development Pillar
11

Sustainable Energy that fulfills Development Requirements & Contributes in National Income
Main
In
dic
ato
rs
Main
Pro
gram
s
& P
ro
jects
Promote innovation in the Energy Sector.
Dabb’ah Nuclear Station.
Adoption of environmental standards & expansion in audited measures.
Energy Subsidy Management.
Contribution Share of Energy Sector in Total GDP (%) 25
2030
20
2020
13.1
Status Quo
0
2030
0
2020
242
Status Quo
8
2030
12
2020
15
Status Quo
Fuel Subsidies (in Billions, EGP)
Efficiency of electricity transmission and distribution (%)
Energy Pillar
12

Maximizing the Developmental Return from Innovation and Knowledge, and associating it to national objectives and challenges
Main
In
dic
ato
rs
Main
P
ro
gram
s &
P
ro
jects
Adoption of a comprehensive program that inculcates a culture of innovation and knowledge
in the community.
Stimulating innovation in SMEs through the development of a comprehensive program.
Activating partnership between the state and the private sector to support and stimulate
innovation
Knowledge, innovation & Scientific Research Pillar
Global Innovation Index (rank)
60 2030
85 2020
99 Status Quo
60 2030
100 2020
132 Status Quo
60 2030
100 2020
135 Status Quo
Innovation Capacity of Companies (rank)
Quality of Scientific Research Institutions (rank)
13
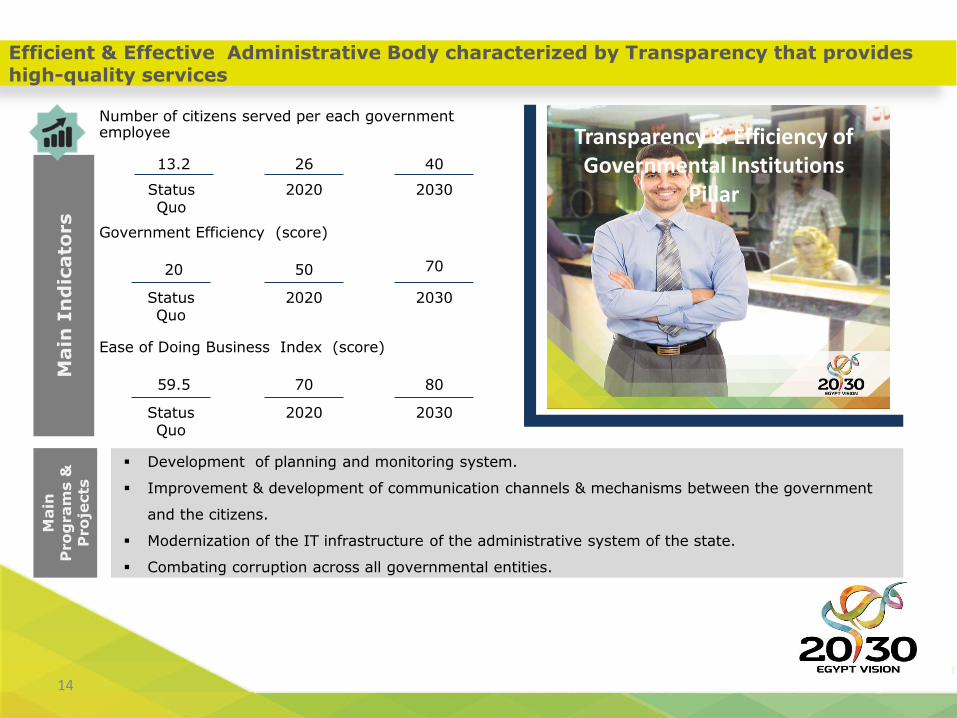
Efficient & Effective Administrative Body characterized by Transparency that provides high-quality services
Main
In
dic
ato
rs
Main
P
ro
gram
s &
P
ro
jects
Development of planning and monitoring system.
Improvement & development of communication channels & mechanisms between the government
and the citizens.
Modernization of the IT infrastructure of the administrative system of the state.
Combating corruption across all governmental entities.
Transparency & Efficiency of Governmental Institutions
Pillar
Number of citizens served per each government employee
40 2030
26 2020
13.2 Status Quo
70
2030
50 2020
20 Status Quo
80 2030
70 2020
59.5 Status Quo
Government Efficiency (score)
Ease of Doing Business Index (score)
14

Promoting Societal Integration & Achieving Equality in rights & Opportunities M
ain
In
dic
ato
rs
Main
P
ro
gram
s &
P
ro
jects
Raising the efficiency of the social protection and subsidy systems , as well as broadening
their scope of influence.
Reducing societal, gender & generational gaps.
Achieving a balanced geographical distribution of services.
Social Justice Pillar Geographical Gap in Human Development Indicator
0.043 2030
0.06 2020
0.086 Status Quo
10 2030
20 2020
31 Status Quo
10000 2030
4000 2020
3436.3 Status Quo
Gini Coefficient
GDP per capita
15
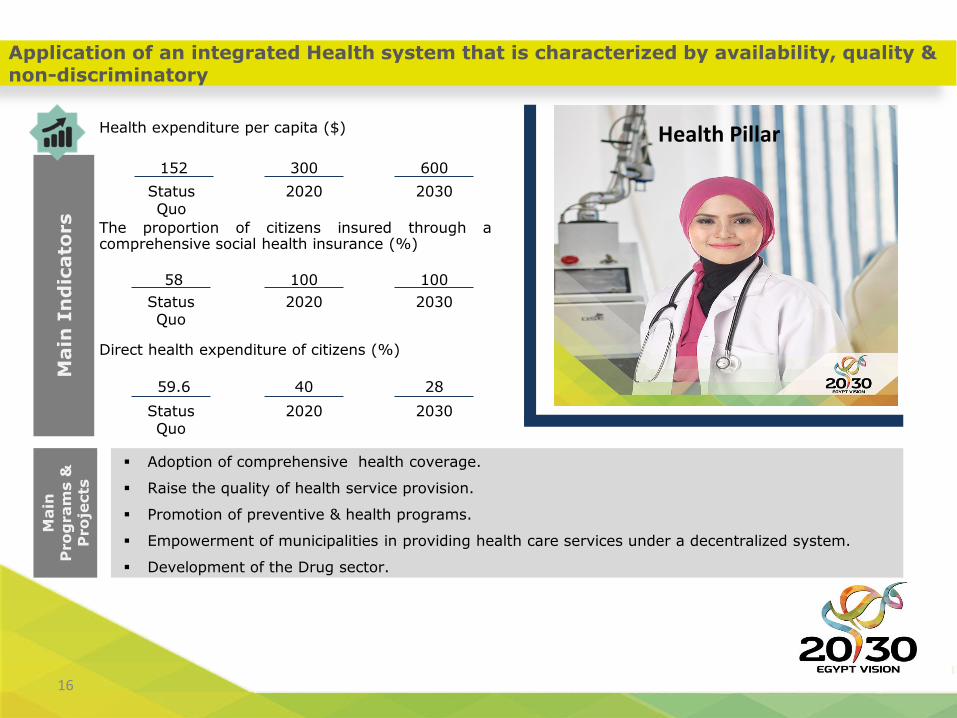
Application of an integrated Health system that is characterized by availability, quality & non-discriminatory
Main
In
dic
ato
rs
Main
P
ro
gram
s &
P
ro
jects
Adoption of comprehensive health coverage.
Raise the quality of health service provision.
Promotion of preventive & health programs.
Empowerment of municipalities in providing health care services under a decentralized system.
Development of the Drug sector.
Health Pillar Health expenditure per capita ($)
600 2030
300 2020
152 Status Quo
100 2030
100 2020
58 Status Quo
28 2030
40 2020
59.6 Status Quo
The proportion of citizens insured through a comprehensive social health insurance (%)
Direct health expenditure of citizens (%)
16

Improve the quality of the education system in alignment with global educational regimes that is available to all without discrimination
Main
In
dic
ato
rs
Main
P
ro
gram
s &
P
ro
jects
Development of teachers’ occupational and technical skills. Development of a Subsidy System for Disadvantaged Families. Mildly Handicapped Students Integration Program. Establishing an academy for technical education specialized in graduating qualified teachers for technical
and vocational education. Developing a mechanism that promotes the participation of the private sector in securing schools and
educational material for the technical education. Application of an accreditation system for Egyptian certifications (internationalization).
Education & Training Pillar Illiteracy Rate (%) (15-35)
2030
7 Zero Default
2020
28
Status Quo
80 2030
60 2020
30 Status Quo
28 2030
40 2020
59.6 Status Quo
Percentage of Technical education graduates working in their fields of specialization (%)
Number of Egyptian universities listed at the order of the top 500 universities in the world (Shanghai Index)
17
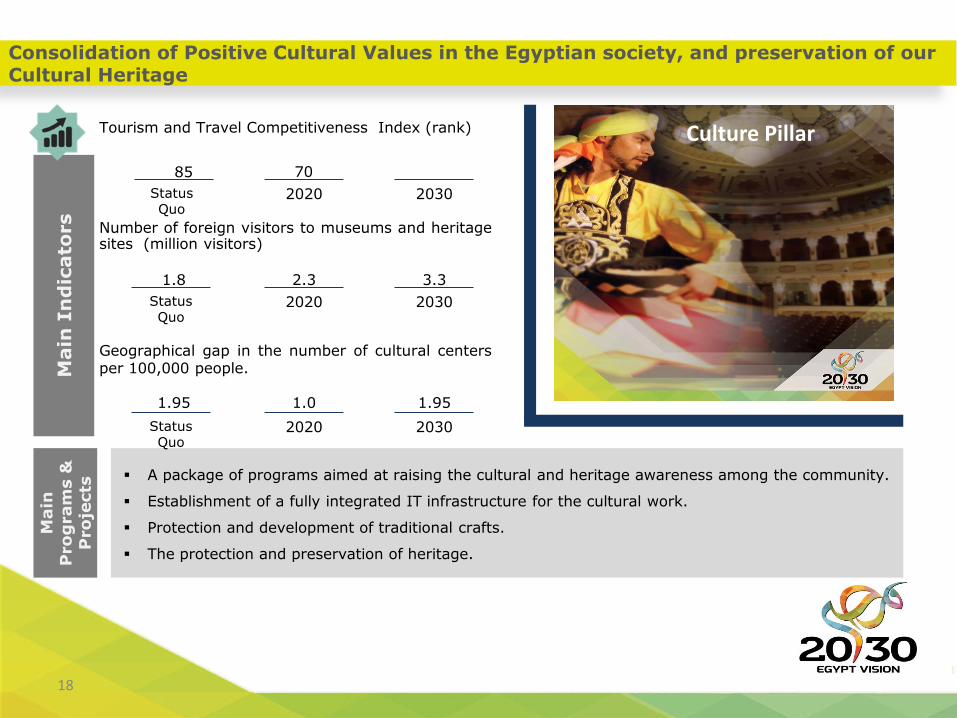
Consolidation of Positive Cultural Values in the Egyptian society, and preservation of our Cultural Heritage
Main
In
dic
ato
rs
Main
P
ro
gram
s &
P
ro
jects
A package of programs aimed at raising the cultural and heritage awareness among the community.
Establishment of a fully integrated IT infrastructure for the cultural work.
Protection and development of traditional crafts.
The protection and preservation of heritage.
Culture Pillar Tourism and Travel Competitiveness Index (rank)
2030
70
2020
85
Status Quo
3.3 2030
2.3 2020
1.8 Status Quo
1.95 2030
1.0 2020
1.95 Status Quo
Number of foreign visitors to museums and heritage sites (million visitors)
Geographical gap in the number of cultural centers per 100,000 people.
18

Good & Sustainable Governance of Natural Resources M
ain
In
dic
ato
rs
Main
P
ro
gram
s &
P
ro
jects
Expansion in the establishment and development of the infrastructure required for achieving a sustainable water system.
Raising the efficiency of solid wastes management system and supporting its sustainability. Developing the necessary policies to reduce air pollution, combat climate changes and protect the
environment. Developing the disposal system of hazardous wastes and raising its efficiency.
Environment Pillar Percentage of non-traditional water resources used/ total water resources used
2030
30
2020
20
Status Quo
80 2030
40 2020
20 Status Quo
-50% 2030
-15% 2020
157 Microgram/m
3 Status Quo
Percentage of domestic solid waste regularly collected and treated (%)
Percentage of reduced rates of pollution caused by fine airborne dust (%)
19

Increasing inhabited area in proportion to the availability of resources and size and distribution of population
Main
In
dic
ato
rs
Main
P
ro
gram
s &
P
ro
jects
Activation of municipalities' role in execution and management of urban plans.
Promoting the population settlement in the new development areas.
Combating the phenomena of slums and insecure areas.
Encouraging the use of green and sustainable building methods.
Urban Development Pillar Number of Egyptian cities in Global Connectedness Index Report
2030
5
2020
1
Status Quo
Less than 5
2030
Less than 8 2020
12 Status Quo
3 (added) 2030
1 (added) 2020 Status
Quo
Housing gap indicator
Area of lands added to Egyptian inhabited areas (%)
7
20
Sustainable Development Strategy: Egypt Vision 2030 vs. Sustainable Development Goals
21

22
Goals SDGs
Goal 1: End poverty in all its forms everywhere
Proportion of population below $1.25 (PPP) per day (MDG Indicator)
Proportion of population living below national poverty line, by urban/rural (modified MDG
Indicator)
Multidimensional Poverty Index.
Percentage of eligible population covered by national social protection programs
Percentage of women, men, indigenous peoples, and local communities with secure rights to
land, property, and natural resources, measured by (i) percentage with documented or
recognized evidence of tenure, and (ii) percentage who perceive their rights are recognized
and protected.
Losses from natural disasters, by climate and non-climate-related events (in US$ and lives
lost)
Total fertility rate
Complementary National Indicators:
1.1. Poverty gap ratio (MDG Indicator) 1.2. Percentage of population using banking services (including mobile banking) 1.3. [Indicator on equal access to inheritance] – to be developed 1.4. [Disaster Risk Reduction Indicator] – to be developed
Sustainable Development Goal 1 - KPIs
23
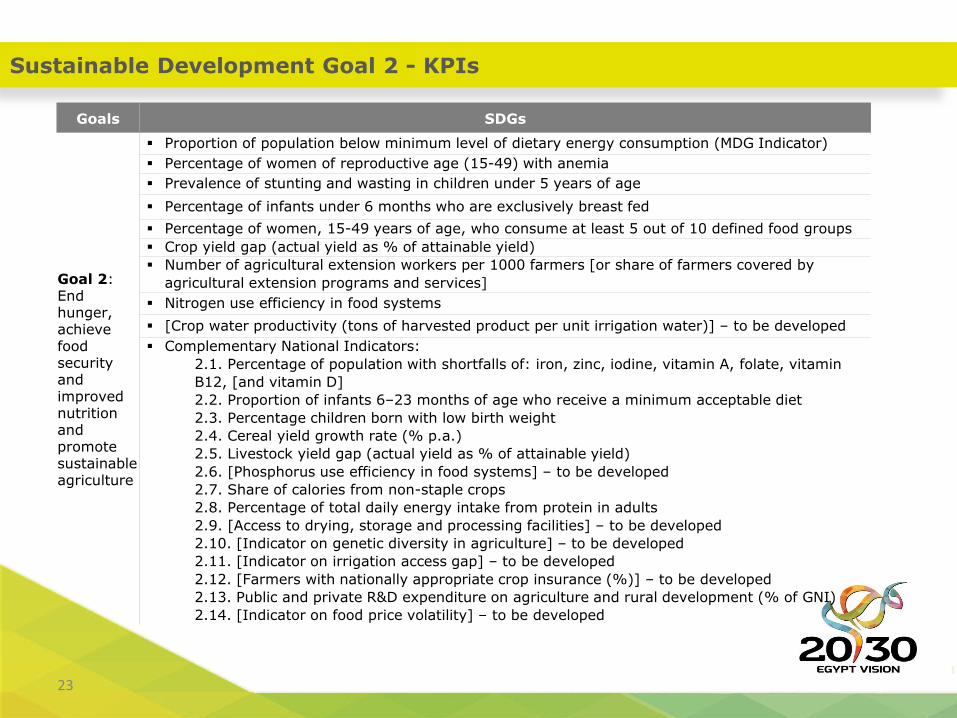
Goals SDGs
Goal 2: End hunger, achieve food security and improved nutrition and promote sustainable agriculture
Proportion of population below minimum level of dietary energy consumption (MDG Indicator)
Percentage of women of reproductive age (15-49) with anemia
Prevalence of stunting and wasting in children under 5 years of age
Percentage of infants under 6 months who are exclusively breast fed
Percentage of women, 15-49 years of age, who consume at least 5 out of 10 defined food groups
Crop yield gap (actual yield as % of attainable yield)
Number of agricultural extension workers per 1000 farmers [or share of farmers covered by
agricultural extension programs and services]
Nitrogen use efficiency in food systems
[Crop water productivity (tons of harvested product per unit irrigation water)] – to be developed
Complementary National Indicators:
2.1. Percentage of population with shortfalls of: iron, zinc, iodine, vitamin A, folate, vitamin
B12, [and vitamin D]
2.2. Proportion of infants 6–23 months of age who receive a minimum acceptable diet
2.3. Percentage children born with low birth weight
2.4. Cereal yield growth rate (% p.a.)
2.5. Livestock yield gap (actual yield as % of attainable yield)
2.6. [Phosphorus use efficiency in food systems] – to be developed
2.7. Share of calories from non-staple crops
2.8. Percentage of total daily energy intake from protein in adults
2.9. [Access to drying, storage and processing facilities] – to be developed
2.10. [Indicator on genetic diversity in agriculture] – to be developed
2.11. [Indicator on irrigation access gap] – to be developed
2.12. [Farmers with nationally appropriate crop insurance (%)] – to be developed
2.13. Public and private R&D expenditure on agriculture and rural development (% of GNI)
2.14. [Indicator on food price volatility] – to be developed
Sustainable Development Goal 2 - KPIs
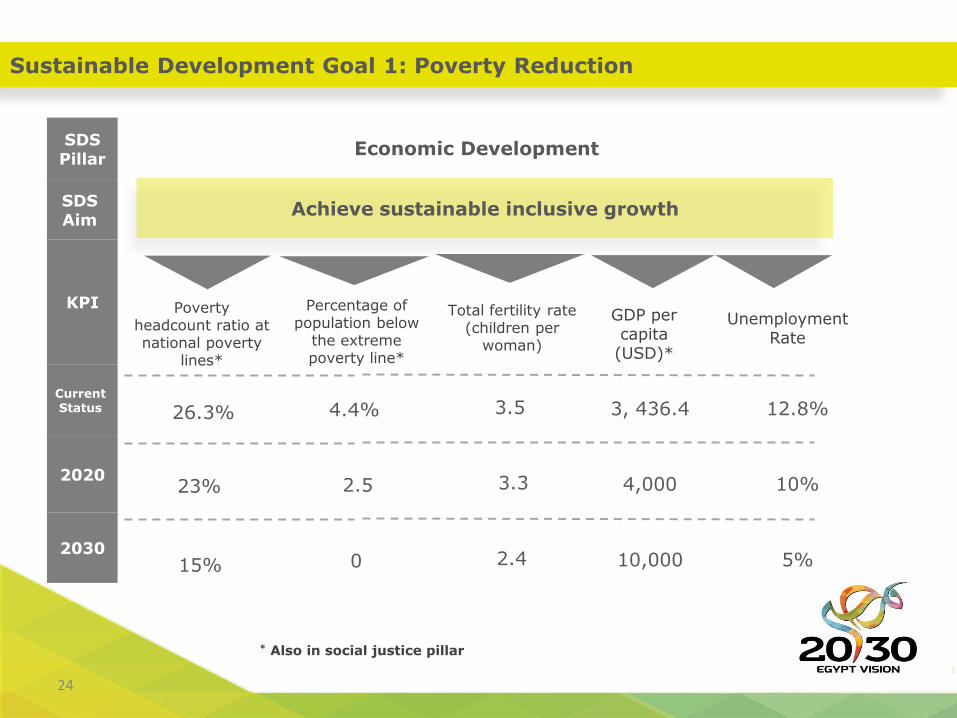
Sustainable Development Goal 1: Poverty Reduction
Economic Development SDS Pillar
SDS Aim
KPI
Current Status
2020
2030
Poverty headcount ratio at national poverty
lines*
26.3%
23%
15%
Percentage of population below
the extreme poverty line*
4.4%
2.5
0
GDP per capita
(USD)*
3, 436.4
4,000
10,000
Achieve sustainable inclusive growth
Unemployment Rate
12.8%
10%
5%
24
* Also in social justice pillar
Total fertility rate (children per
woman)
3.5
3.3
2.4
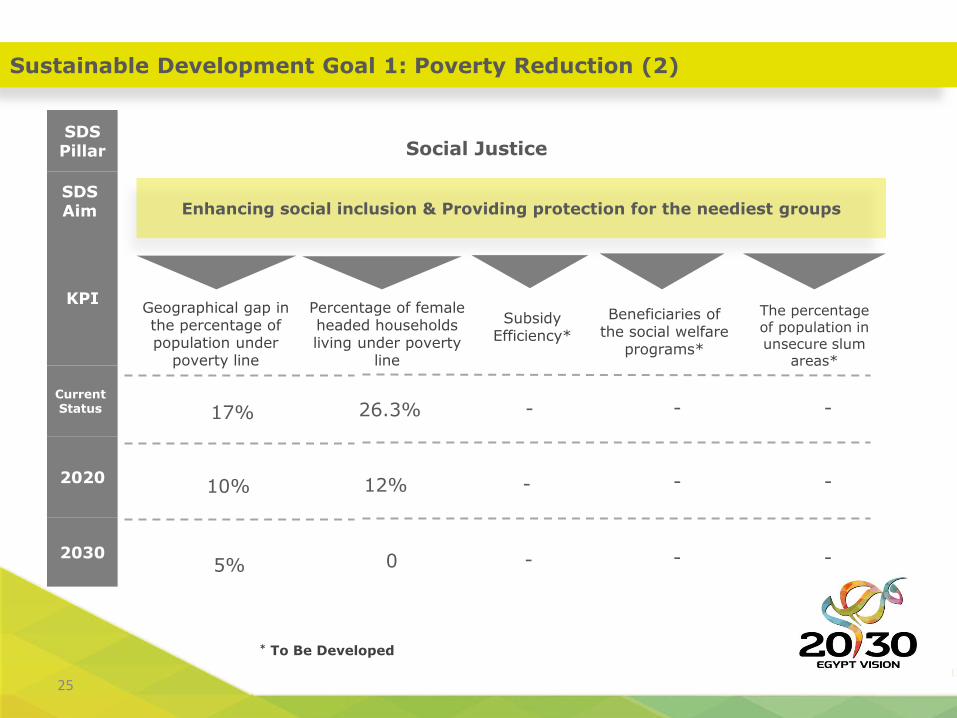
Sustainable Development Goal 1: Poverty Reduction (2)
Social Justice SDS Pillar
SDS Aim
KPI
Current Status
2020
2030
Geographical gap in the percentage of population under
poverty line
17%
10%
5%
Percentage of female headed households living under poverty
line
26.3%
12%
0
-
-
-
-
-
-
Enhancing social inclusion & Providing protection for the neediest groups
Subsidy Efficiency*
* To Be Developed
Beneficiaries of the social welfare
programs*
-
-
-
The percentage of population in unsecure slum
areas*
25
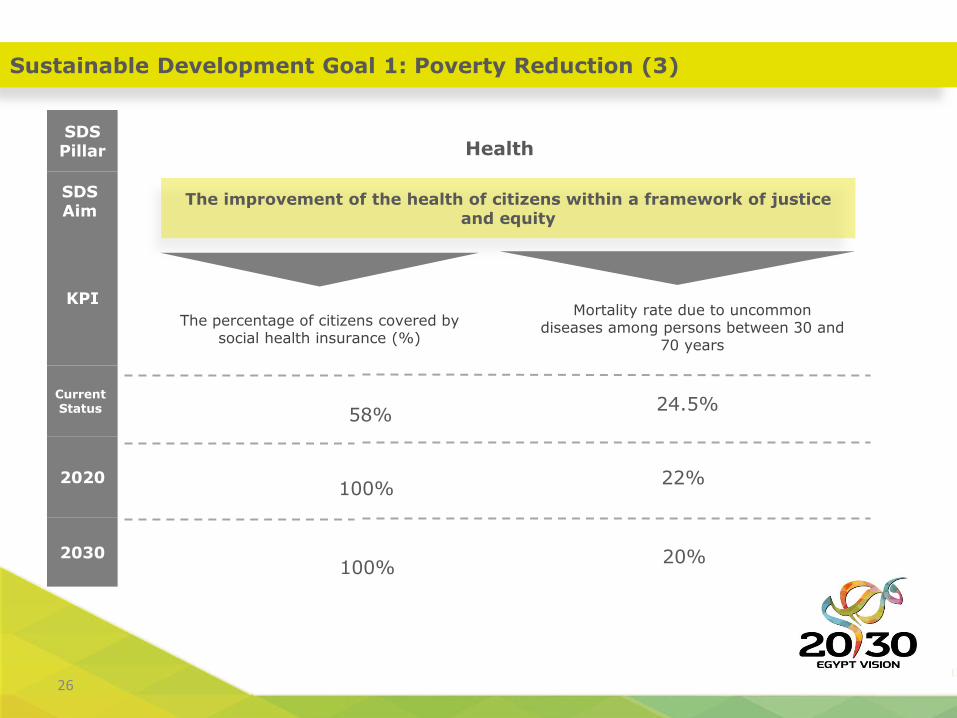
Sustainable Development Goal 1: Poverty Reduction (3)
Health SDS Pillar
SDS Aim
KPI
Current Status
2020
2030
The percentage of citizens covered by social health insurance (%)
58%
100%
100%
The improvement of the health of citizens within a framework of justice and equity
26
Mortality rate due to uncommon diseases among persons between 30 and
70 years
24.5%
22%
20%
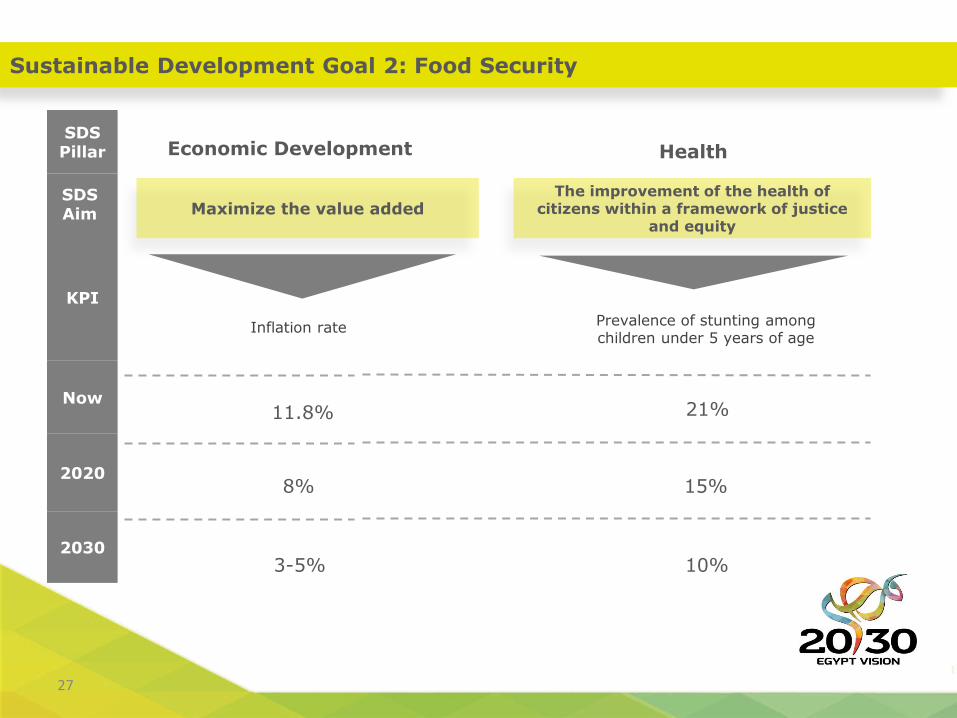
Sustainable Development Goal 2: Food Security
Economic Development SDS Pillar
SDS Aim
KPI
Now
2020
2030
Inflation rate
11.8%
8%
3-5%
Maximize the value added
Health
The improvement of the health of citizens within a framework of justice
and equity
Prevalence of stunting among children under 5 years of age
21%
15%
10%
27

Sustainable Development Goal 2: Food Security (2)
Urban Development SDS Pillar
SDS Aim
KPI
Now
2020
2030
Rate of reduction of agricultural land infringement
30,000 acres
100%
100%
Percentage of population with access to safe drinking water
>90%
>95%
100%
Increase inhabited areas in a way that is suitable for the accessibility of resources, size, and distribution of population
28
Programs
29

Programs for Sustainable Development Goal 1: Poverty Reduction
30
Economic Development
Pillar
Suez Canal Development Project
Decent Work Program
Regional Economic Development Program
Programs and Projects to Formalize the Informal Sector
Curb Inflationary Pressures for Macroeconomic Stability (storage and
logistics centers)
Social Justice Pillar
Improving the social protection and subsidy systems and expanding their
coverage
Achieving a balanced geographical distribution of services
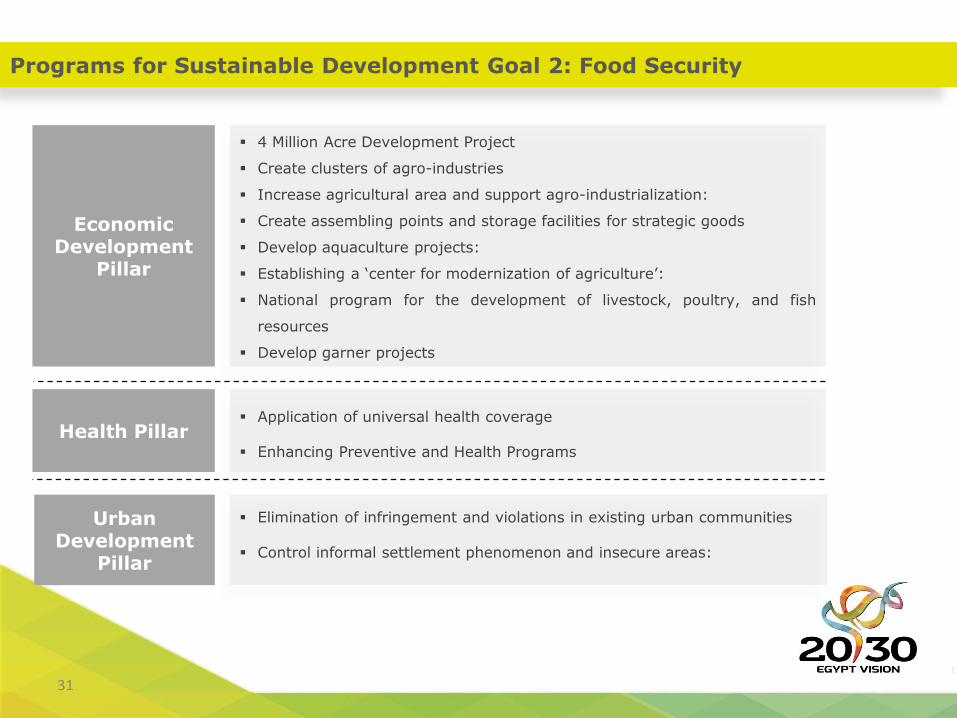
Programs for Sustainable Development Goal 2: Food Security
31
Economic Development
Pillar
4 Million Acre Development Project
Create clusters of agro-industries
Increase agricultural area and support agro-industrialization:
Create assembling points and storage facilities for strategic goods
Develop aquaculture projects:
Establishing a ‘center for modernization of agriculture’:
National program for the development of livestock, poultry, and fish
resources
Develop garner projects
Health Pillar Application of universal health coverage
Enhancing Preventive and Health Programs
Urban Development
Pillar
Elimination of infringement and violations in existing urban communities
Control informal settlement phenomenon and insecure areas: