Embed Size (px)
Citation preview

L obna M. Abde lla tif, Mohamed Ramadan, Sarah A. E l- B akry
A ug- 2016
DO SUPPORTIVE POLICIES TO FE MALE -HE ADE D HOUSEHOLDS INCRE ASE THE INCOME INE QUALITY?

Reviewing the literature on gender inequality shows that some aredefining the inequality in terms of outcomes, and others in terms ofopportunities. However, both approaches have consistently shownthat women stand at a disadvantaged position compared to men.
According to data provided by the 2014 UNDP HumanDevelopment Report, in almost all countries, regardless of theirlevel of development, the labour force participation rate is lower forfemales than for males.
Female- headed households has become an important phenomenonworldwide (Barros et. al 1997).
- 1- Gender Inequality and Poverty literature

Buvinic and Rao Gupta (1997) reviewed 61 studies examining therelationship between female household headship and poverty. Usinga variety of poverty indicators, 38 out of the 61 studies found thatfemale- headed households are overrepresented among the poor. 15other studies found that poverty was associated with certain typesof female heads, and only 8 studies report that there is noevidence for the hypothesis that female -headed householdssuffer from g reater poverty .
- 1- Gender Inequality and Poverty literature

In 1998, Datt and Jolliffe introduced the profile of poverty inEgypt, one of their important results is that the poor tend to havelarger household size and higher dependency ratio, and the higherdependency ratio was due to the extra children that they have tosupport per adult of working age, whom almost the mothers oryoung females.
The successive governments devoted a lot of attention to designdifferent policies and programs to either support or eliminate thepoverty. But the question is: Do these policies really decrease orincrease the inequality?
- 2- E g yptian’s Poverty literature

The percent of poor increased from 19.6 percent in 2004- 05 to 25.2in 2010- 11, to 26.3 percent in 2012- 13.
Due to the Poverty definition as a lack of ability to generate anadequate household income, economic inclusion is extremelyconsidered one of the determinant factors . Therefore, it iscaptured that unemployment rate hit 12.8 percent in 2015,disaggregated to 24.2 percent among females and 9.4 percent amongmales.
- 3- E g yptian’s Poverty Statis tic s

Although the literature on poverty brought to the attention thevulnerability of women because of lack of equal opportunities,which highlighted the feminization of poverty , the most attentionwent to Female-headed Households , and the familycomposition was a miss ing factor.
Therefore, this paper discussed two arguments :
— Aside from who heads the family, families with more females are morevulnerable to poverty symptoms.
— Even the feminization vulnerability depends on many factors, such as: femalesempowerment, economic inclusion, education… etc.
- 4- Research Novelty
- 4- Research Novelty
If these two families have the same general conditions … howcomes one is intentionally selected to be supported?

- 5- Clus terw ise Ordinal Log is tic Reg res s ion Model
If there is a target population, and there is a hypothesis that it couldbe representative in two different formulas

- 5- Clus terw ise Ordinal Log is tic Reg res s ion Model
So, this population should be clustered, first.

- 5- Clus terw ise Ordinal Log is tic Reg res s ion Model
Then, a separate equation could be estimated for each cluster
f2(x )f1(x )

- 5- Clus terw ise Ordinal Log is tic Reg res s ion Model
The clusterwise ordinal logistic regression performs the two steps ina simultaneous approach.
f1(x ) f2(x )
Re late d e rro rs
Uniq ue s e t o f c las s if ic atio n

- 5- Clus terw ise Ordinal Log is tic Reg res s ion Model
minimize Fk𝛃. kCi . kdi.s
+.s−=
k=1
K
i=1
n
kCi × kdi + s+ + s− (1)
Subject to
exp k𝛃′𝐱𝐢
1 + exp k𝛃′𝐱𝐢
+ kdi ≥ 0.5 + ε ∀Yi = 1 i=1.2.⋯.n k=1.2.⋯.K(2)
exp k𝛃′𝐱𝐢
1 + exp k𝛃′𝐱𝐢
− kdi ≤ 0.5 − ε ∀Yi = 0 i=1.2.⋯.n k=1.2.⋯.K(3)
k=1
K
i=1
n
kCi Yi −exp k𝛃
′𝐱𝐢
1 + exp k𝛃′𝐱𝐢
− s+ + s− = 0 (4)
k=1
K
kCi = 1 i=1.2.⋯.n (5)
i=1
n
kCi ≥ 1 k=1.2.⋯.K (6)
kCi . kdi ≥ 0 i=1.2.⋯.n k=1.2.⋯.K (7)
s+. s− ≥ 0 (8)
No n-Line ar Go al Prog ram m ing

- 6- Gender- Based Poverty Detection Model (GB PDM)
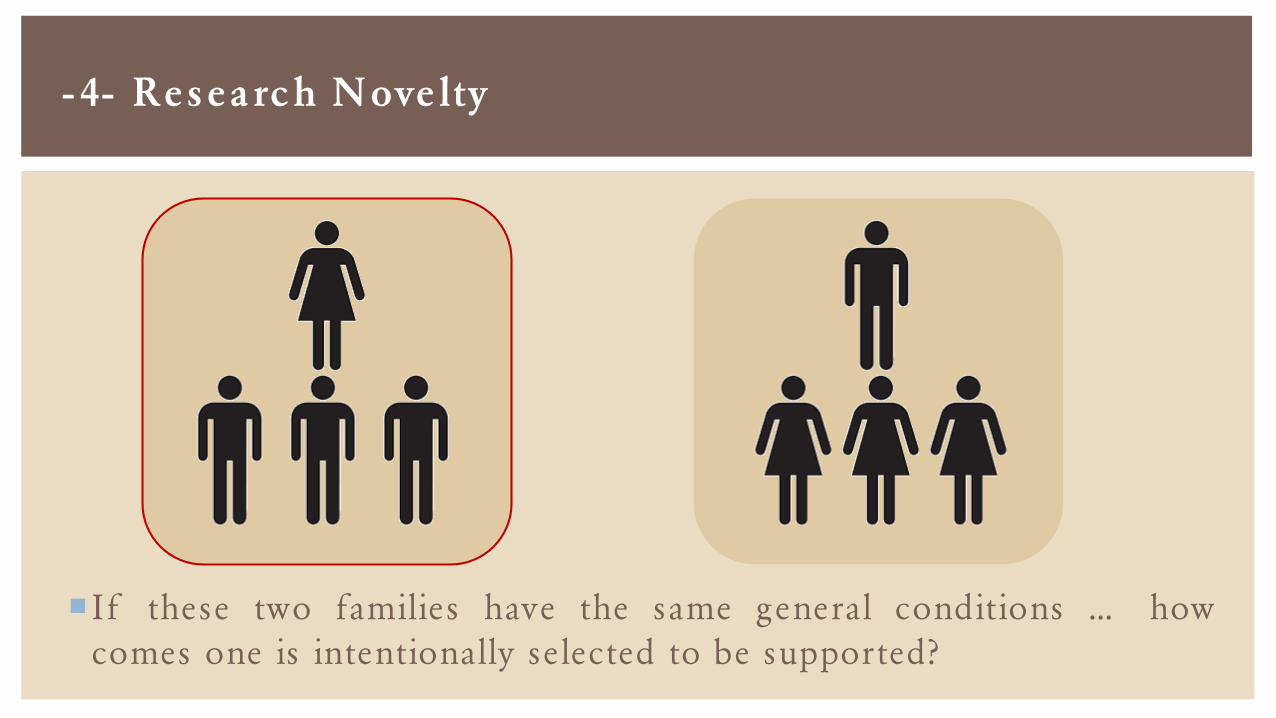
Y: first wealth index quintiles versus other quintiles
X1: rural dummy variable
X2: vulnerable houses dummy variable
X3: do not own resident houses dummy variable
X4: natural logarithm of the household size
X5: Female headed-households dummy variable
X6: HHH with higher education degrees dummy variable
X7: percent of females with higher education degrees to the total household members
X8: percent of number of females 15+ to the total household members 15+
X9: percent of unemployed females to the total household members
X10: percent of females out-of-labour force to the total household members
X11: percent of females out-of-human force to the total household members
X12: percent of casual female workers and females work in private sector to the total household members.
X13: maximum type of work among the females' household members
X14: percent of female household members under the cover of social security to the total household members
X15: percent of female household members under the cover of medical insurance to the total household members
X16: own ration card dummy variable
X17: natural logarithm of percent of household expenditure on health to the total household income
- 6- Gender- Based Poverty Detection Model (GB PDM)
Re s id e nc y
Ho us ing Co nd itio ns
Ge ne ral Fam ily
Fe m ale s E duc atio n
Fe m ale s E c o no m ic Inc lus io n
- 6- Gender- Based Poverty Detection Model (GB PDM)
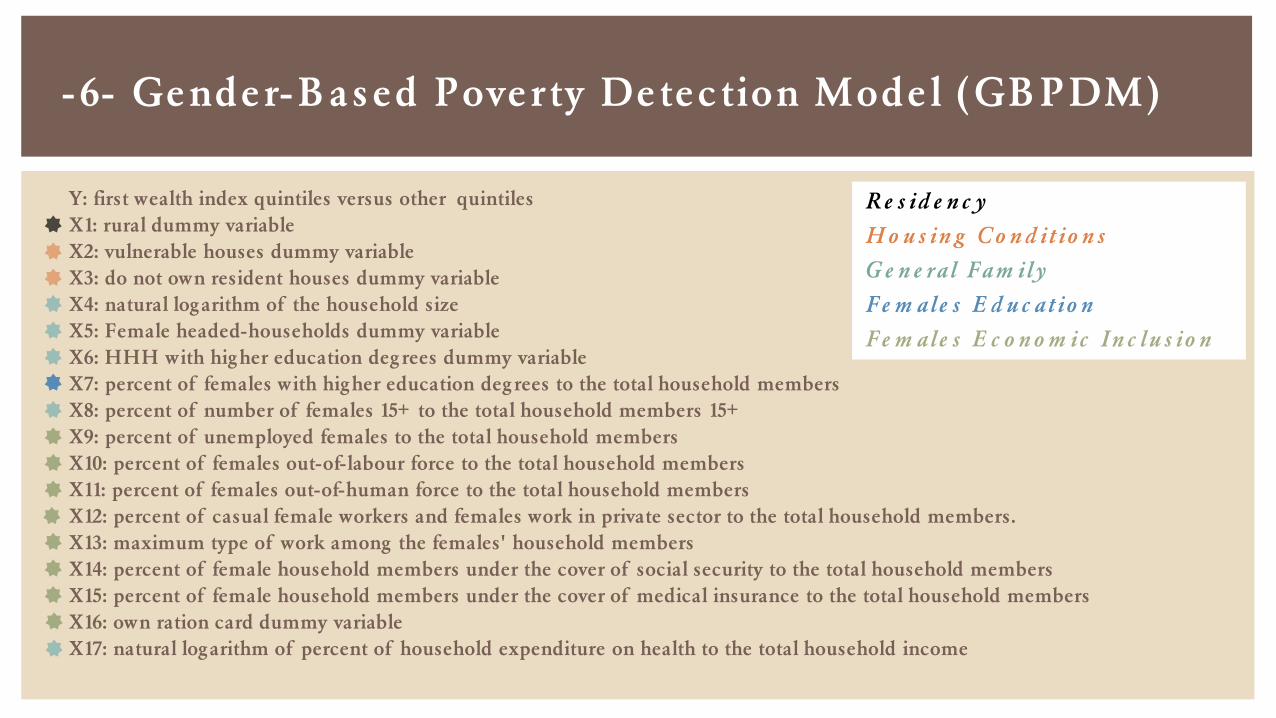
Urban Lower Upper Frontier
In-sample 250 250 250 124
Refresh Sample 1119 3094 2441 0
To b uild th e m o de l
To te s t th e m o de l
Four models were constructed, one per each region.
Urban Lower Upper Frontier
Sensitivity: the percent of correctly classified poor
households as poor households.98% 100% 98% 88.9%
100-Specificity (Fall-out): the percent of
misclassified non-poor households as poor households.30% 46% 26% 18.9%
- 7- Results and Discuss ion
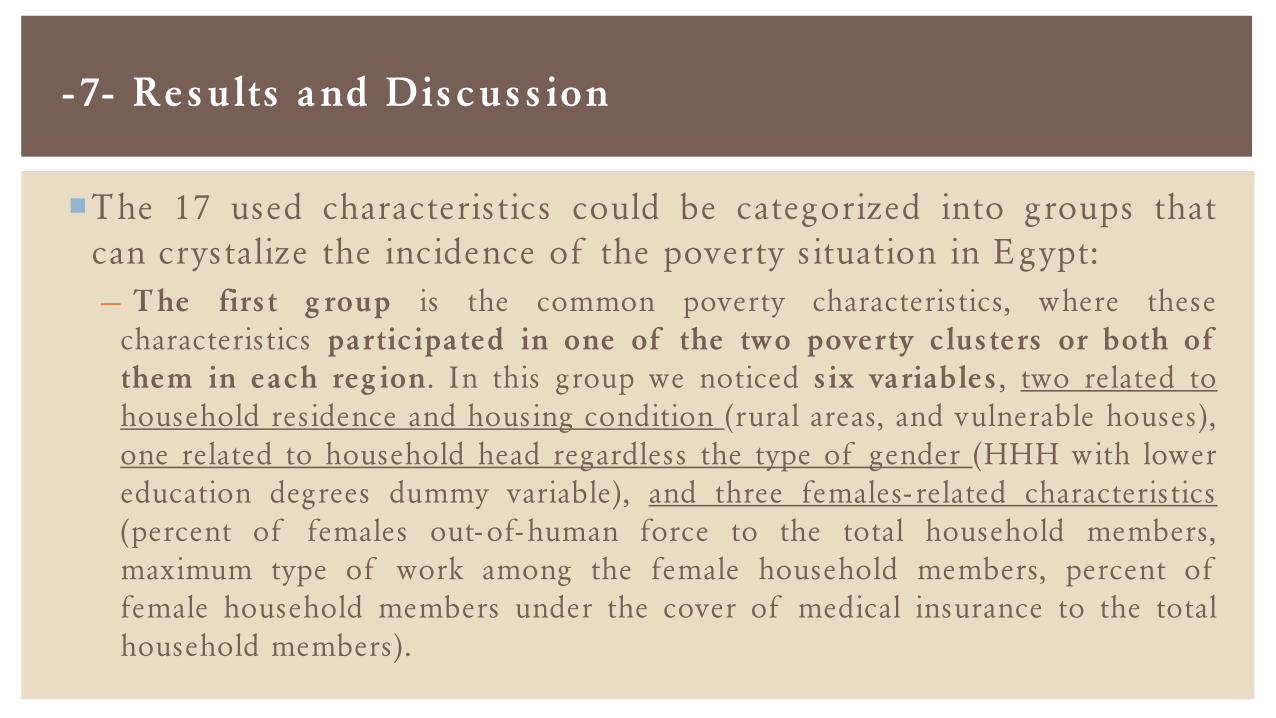
The 17 used characteristics could be categorized into groups thatcan crystalize the incidence of the poverty situation in Egypt:
— The first g roup is the common poverty characteristics, where thesecharacteristics participated in one of the two poverty clusters or both ofthem in each reg ion. In this group we noticed six variables , two related tohousehold residence and housing condition (rural areas, and vulnerable houses),one related to household head regardless the type of gender (HHH with lowereducation degrees dummy variable), and three females- related characteristics(percent of females out- of- human force to the total household members,maximum type of work among the female household members, percent offemale household members under the cover of medical insurance to the totalhousehold members).

- 7- Results and Discuss ion
— The second g roup , which is close to be generic poverty determinants becauseit showed existence in three regions. the percent of females with highereducation degrees to the total household members appeared in all regionsexcept Urban Governorates, as well as (percent of females out- of- labour forceto the total household members, percent of casual female workers and femalesworking in private sector to the total household members, percent of femalehousehold members under the cover of social security to the total householdmembers, own ration cards) appeared in GBPDM for all regions except FrontierGovernorates.
— On the other hand, the last category showed the importance of the rest ofvariables but for two regions or less.

- 7- Results and Discuss ion
Endogenous variablesRegions
Urban Lower Upper Frontier
X1: rural dummy variable 1st 1st 1st
X2: vulnerable houses dummy variable 2nd 1st 1st 1st
X3: do not own resident houses dummy variable - 1st - 2nd
X4: natural logarithm of the household size 1st - - 1st
X5: Female headed-households dummy variable 2nd - 1st -
X6: HHH with higher education degrees dummy variable Non-poor Non-poor 2nd 1st
X7: percent of females with higher education degrees to the total household members - Non-poor Non-poor 2nd
X8: percent of number of females 15+ to the total household members 15+ - - 2nd 2nd
X9: percent of unemployed females to the total household members - - - -
X10: percent of females out-of-labour force to the total household members 2nd 2nd Non-poor -
X11: percent of females out-of-human force to the total household members 2nd 2nd Non-poor 2nd
X12: percent of casual female workers and females work in private sector to the total household members. 1st 1st 2nd -
X13: maximum type of work among the females' household members 2nd Non-poor 1st 2nd
X14: percent of female household members under the cover of social security to the total household
members1st 1st 2nd -
X15: percent of female household members under the cover of medical insurance to the total household
members1st Non-poor 1st 2nd
X16: own ration card dummy variable 2nd 2nd Non-poor -
X17: natural logarithm of percent of household expenditure on health to the total household income - 1st - -

- 9- Conclus ion and Policy Implications
Egyptian government should revisit their gender- based targetingpolicies, specifically, and the common targeting policies to reshapethe set of targeting characteristics.
The government anywhere should not apply any social benefitspolicies before being sure that these policies offer an efficientlyequitable condition to the targeted population.
Female poverty cannot be restricted to a condition resulting fromhousehold headship, there are however several gender- basedcharacteristics that explain female poverty.

How many households failed- out from the targeting system in Egyptbecause they did not introduce their households as female- headed?
Thank s for well lis tening