Embed Size (px)
Citation preview
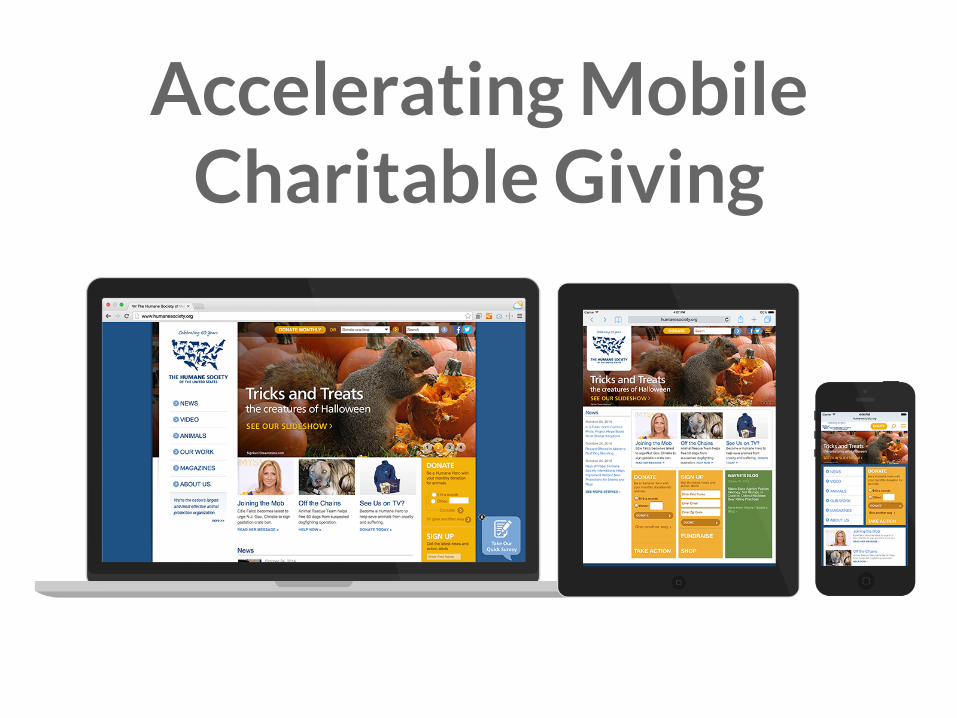
Accelerating Mobile Charitable Giving
David Balcom, Director Strategic Solutions, Moovweb
Stuart Boyd, VP Products, Charity Dynamics
Presenters
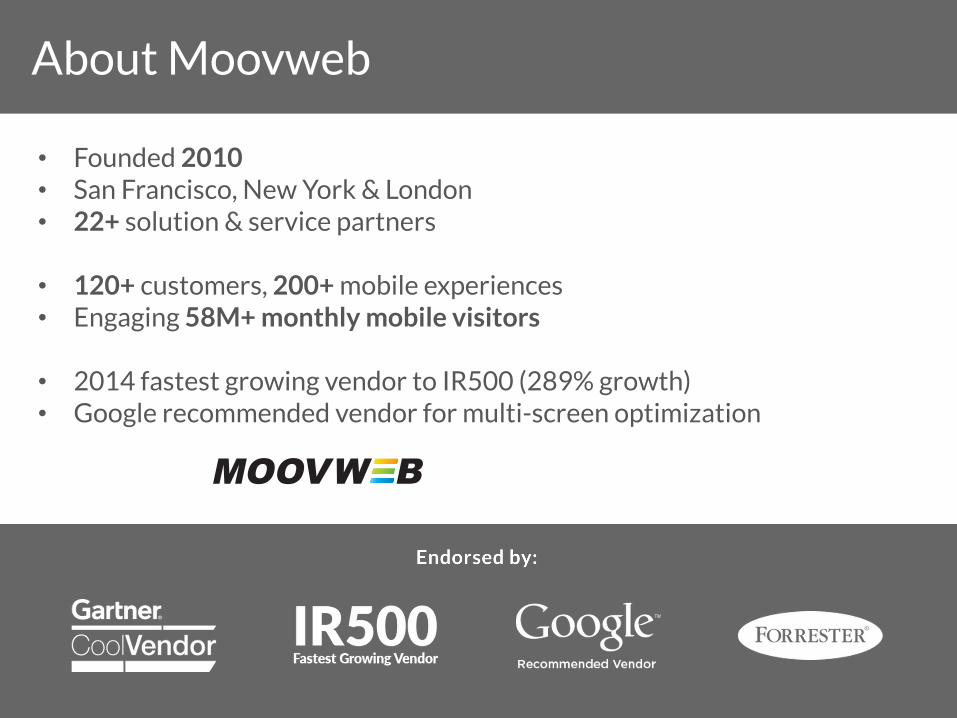
• Founded 2010 • San Francisco, New York & London • 22+ solution & service partners
• 120+ customers, 200+ mobile experiences • Engaging 58M+ monthly mobile visitors
• 2014 fastest growing vendor to IR500 (289% growth) • Google recommended vendor for multi-screen optimization
About Moovweb
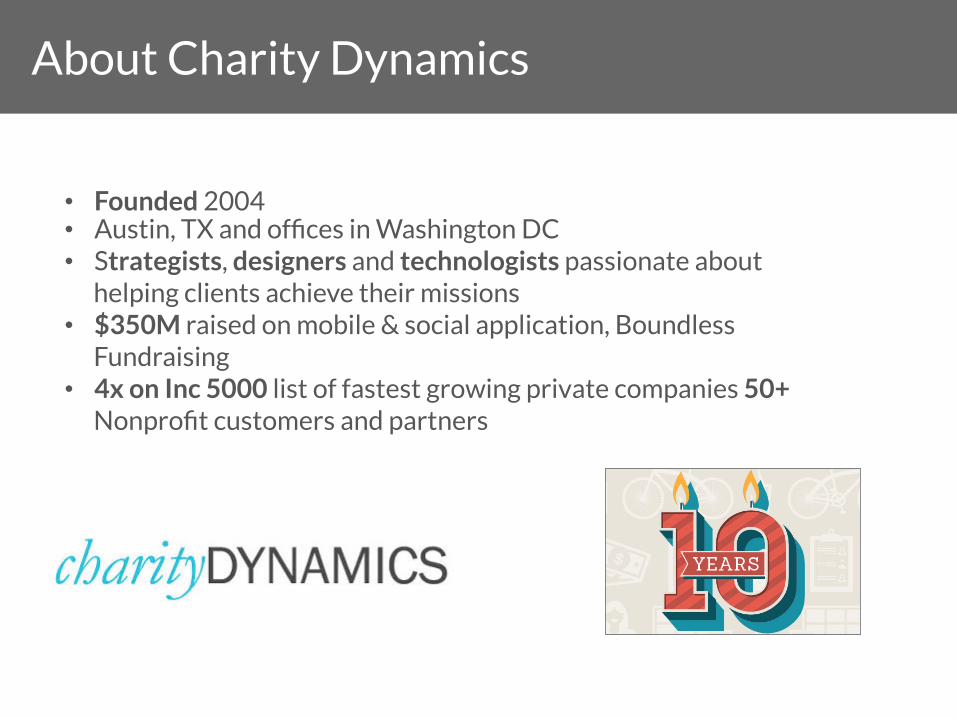
• Founded 2004 • Austin, TX and offices in Washington DC • Strategists, designers and technologists passionate about
helping clients achieve their missions • $350M raised on mobile & social application, Boundless
Fundraising • 4x on Inc 5000 list of fastest growing private companies 50+
Nonprofit customers and partners
About Charity Dynamics
Customers
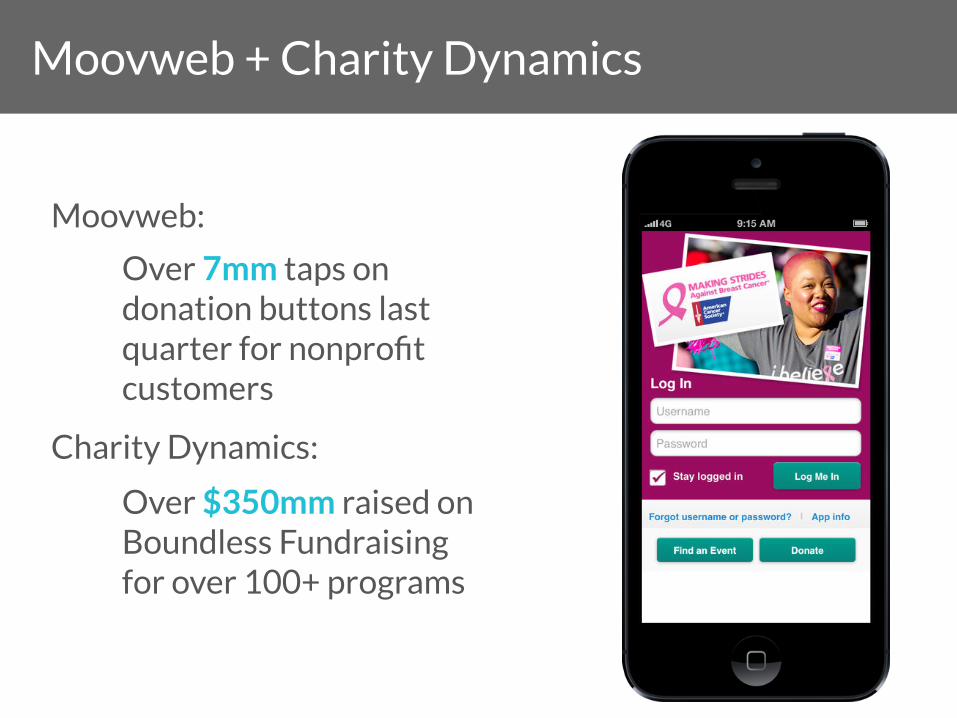
Over $350mm raised on Boundless Fundraising for over 100+ programs
Over 7mm taps on donation buttons last quarter for nonprofit customers
Charity Dynamics:
Moovweb:
Moovweb + Charity Dynamics
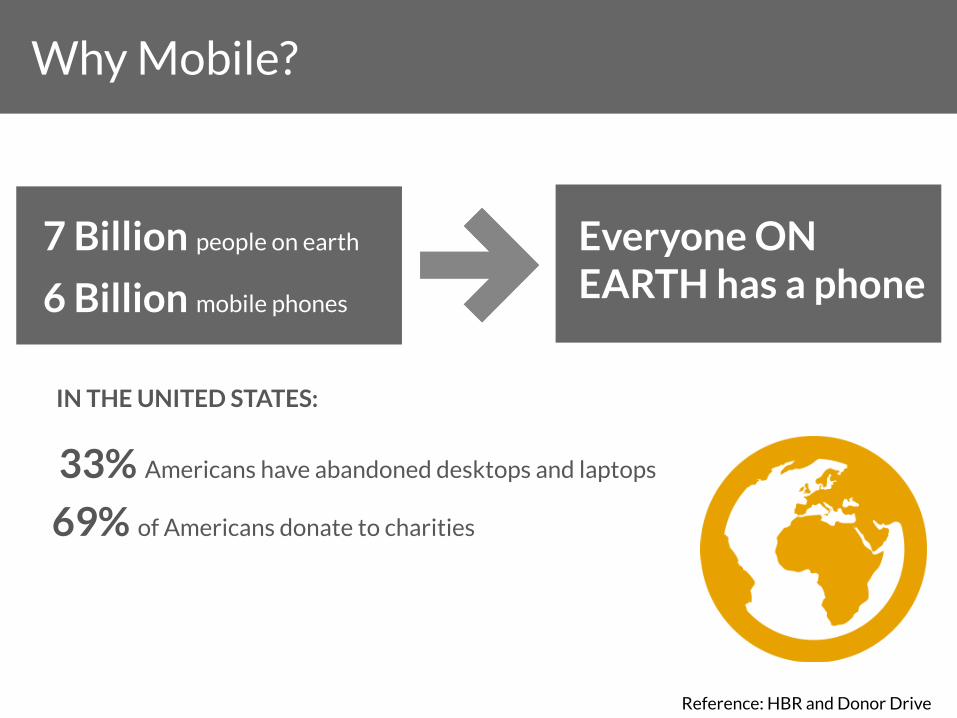
7 Billion people on earth
6 Billion mobile phones
33% Americans have abandoned desktops and laptops
Everyone ON EARTH has a phone
69% of Americans donate to charities
IN THE UNITED STATES:
Reference: HBR and Donor Drive
Why Mobile?
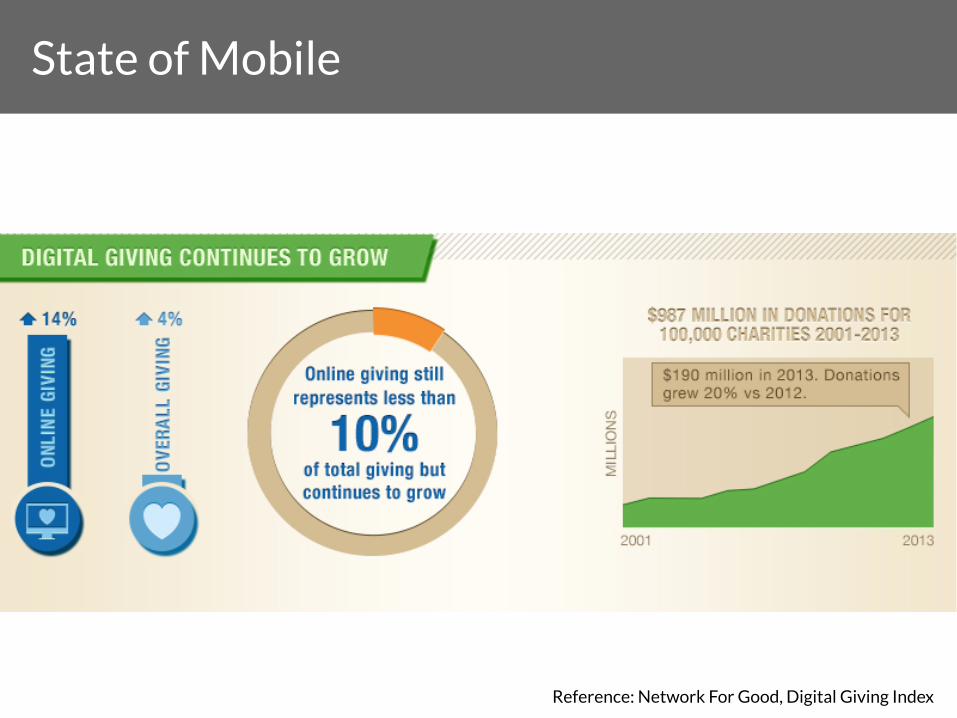
Reference: Network For Good, Digital Giving Index
State of Mobile
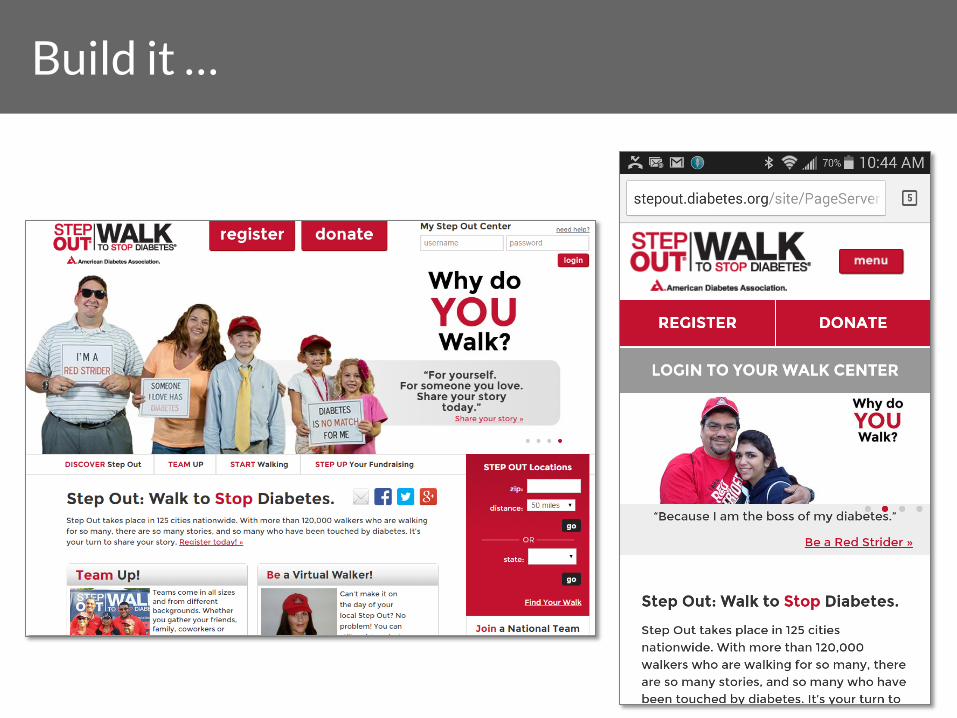
Build it …
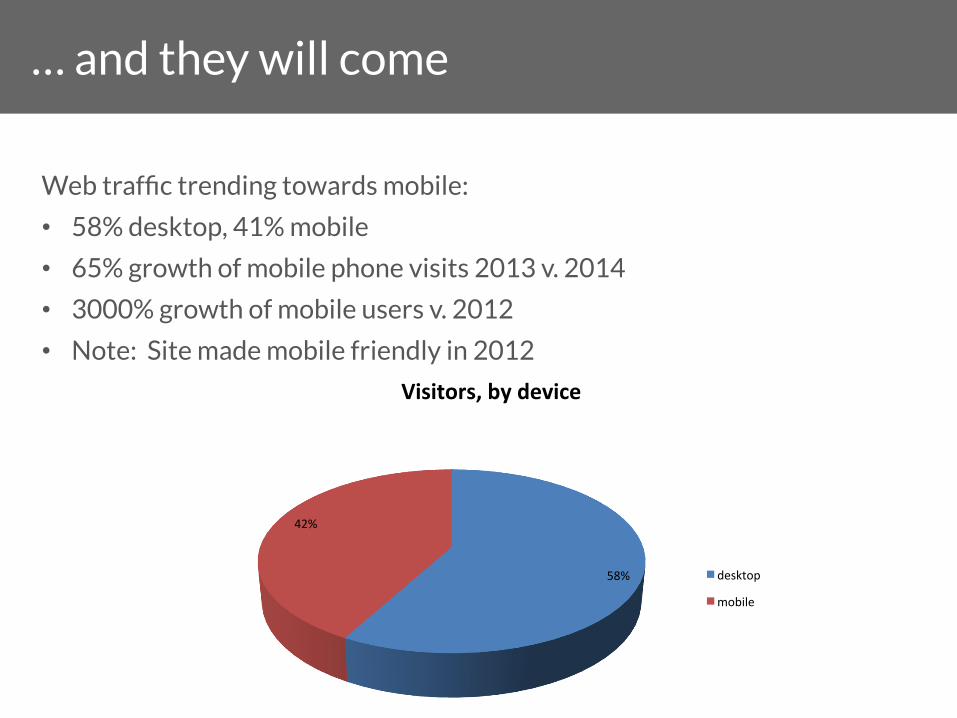
Web traffic trending towards mobile:
• 58% desktop, 41% mobile
• 65% growth of mobile phone visits 2013 v. 2014
• 3000% growth of mobile users v. 2012
• Note: Site made mobile friendly in 2012
58%
42%
Visitors, by device
desktop
mobile
… and they will come
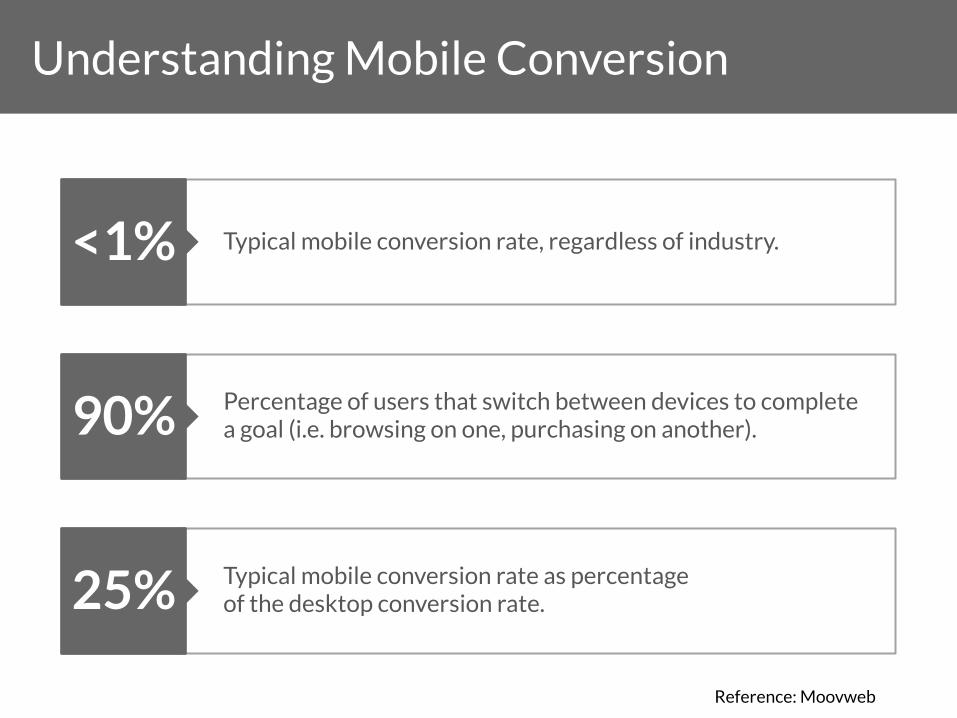
90% Percentage of users that switch between devices to complete a goal (i.e. browsing on one, purchasing on another).
25% Typical mobile conversion rate as percentage of the desktop conversion rate.
<1% Typical mobile conversion rate, regardless of industry.
Understanding Mobile Conversion
Reference: Moovweb
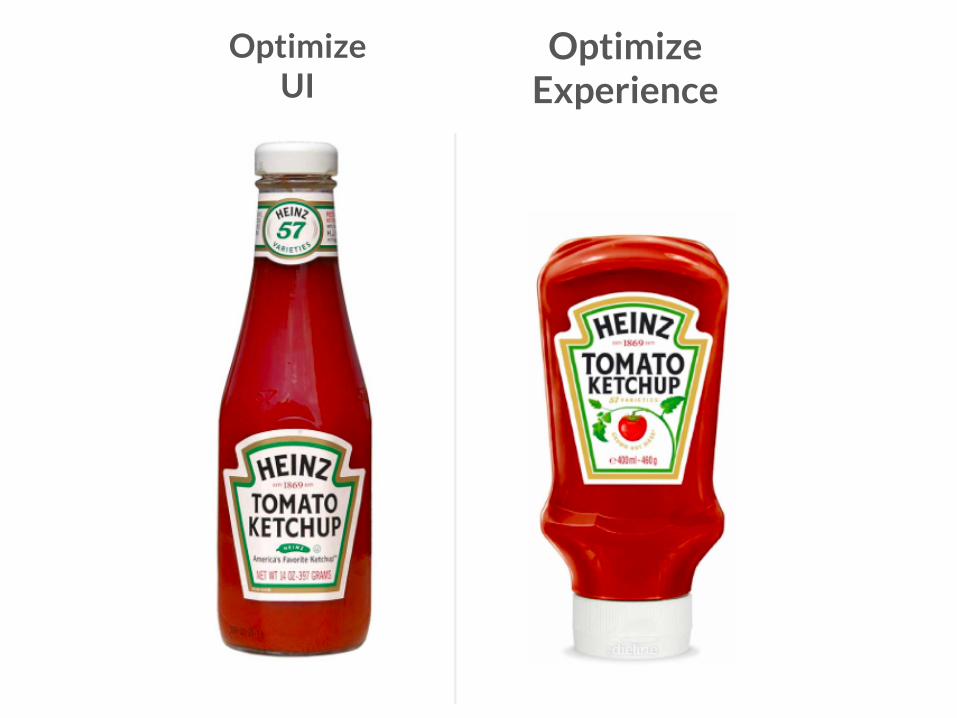
Optimize UI
Optimize Experience
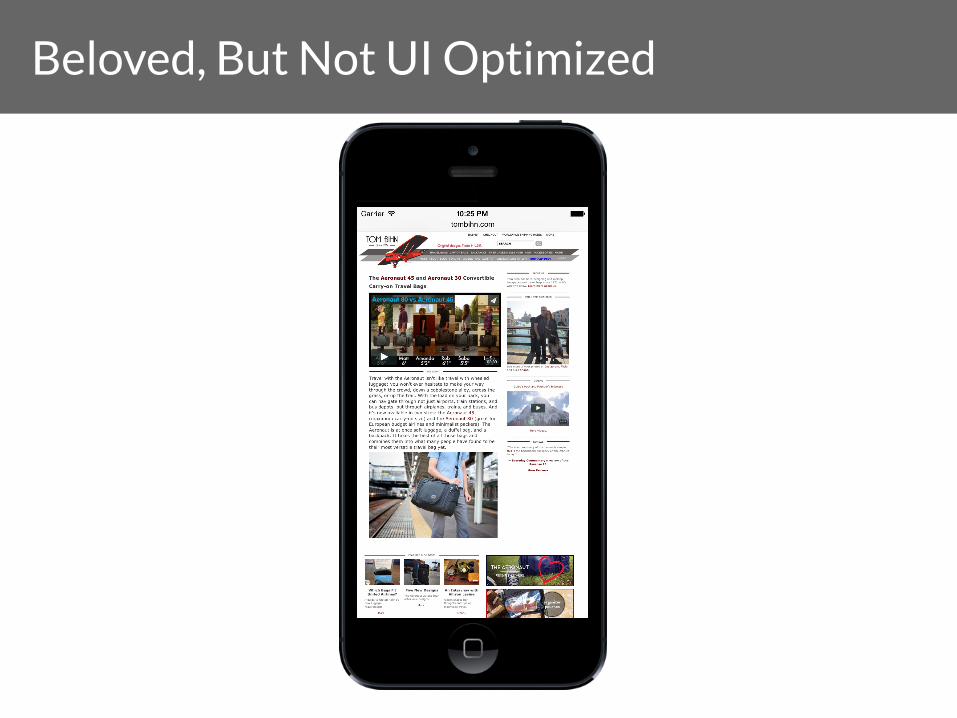
Beloved, But Not UI Optimized
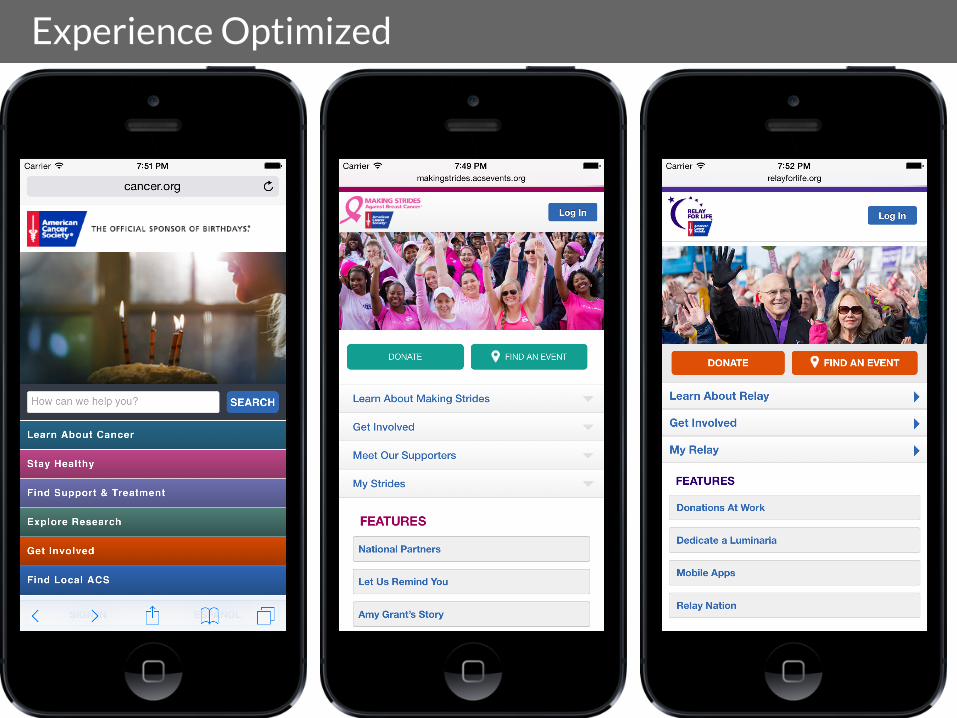
Experience Optimized
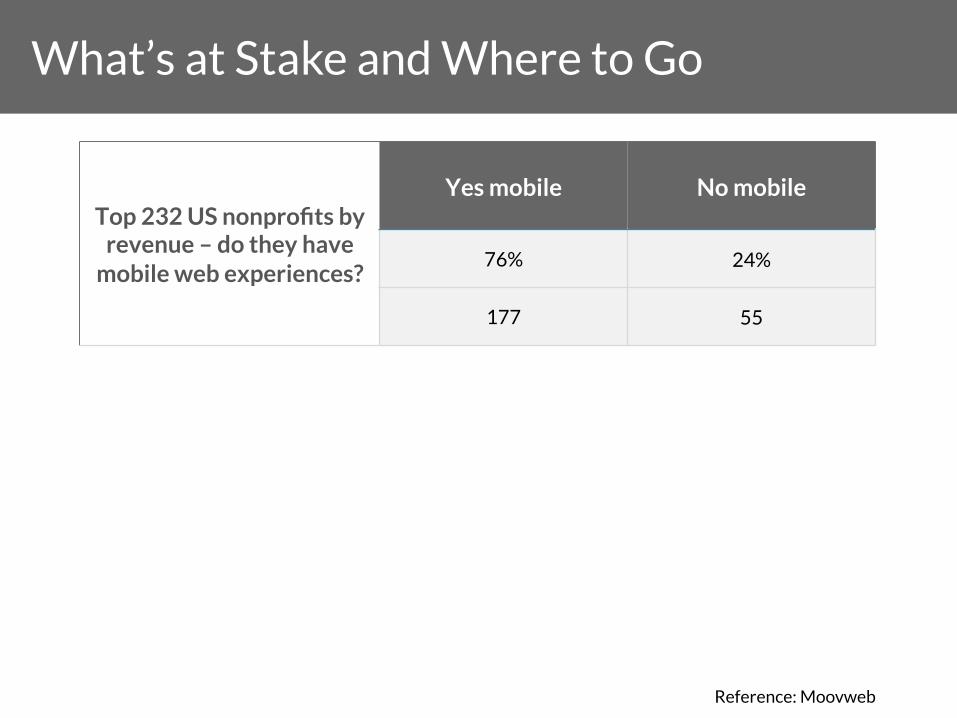
Top 232 US nonprofits by revenue – do they have
mobile web experiences?
Yes mobile No mobile
76% 24%
177 55
Reference: Moovweb
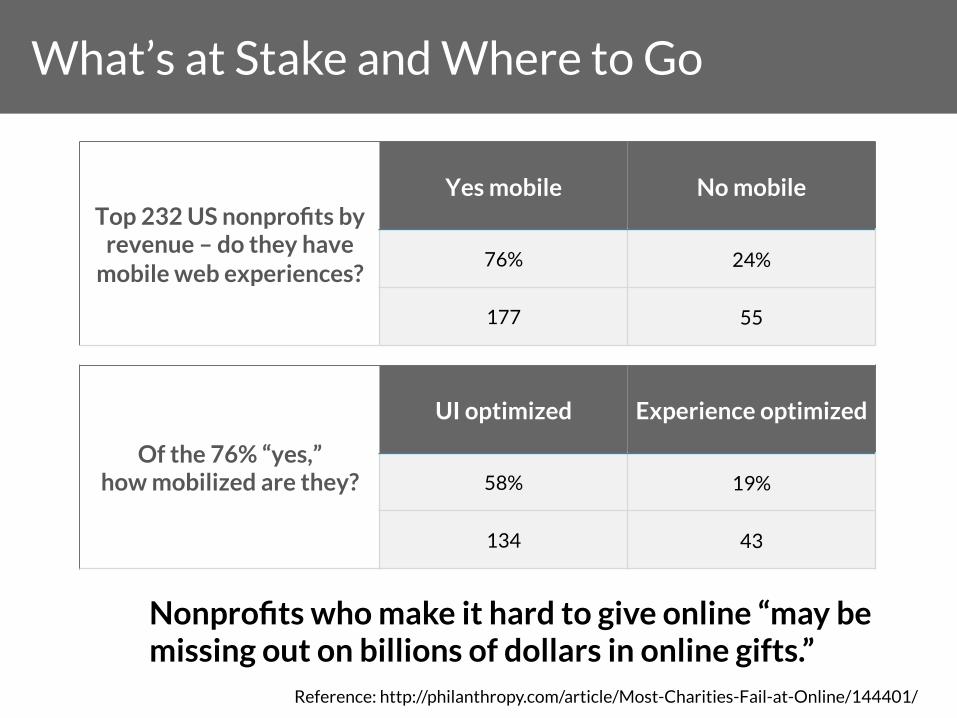
What’s at Stake and Where to Go
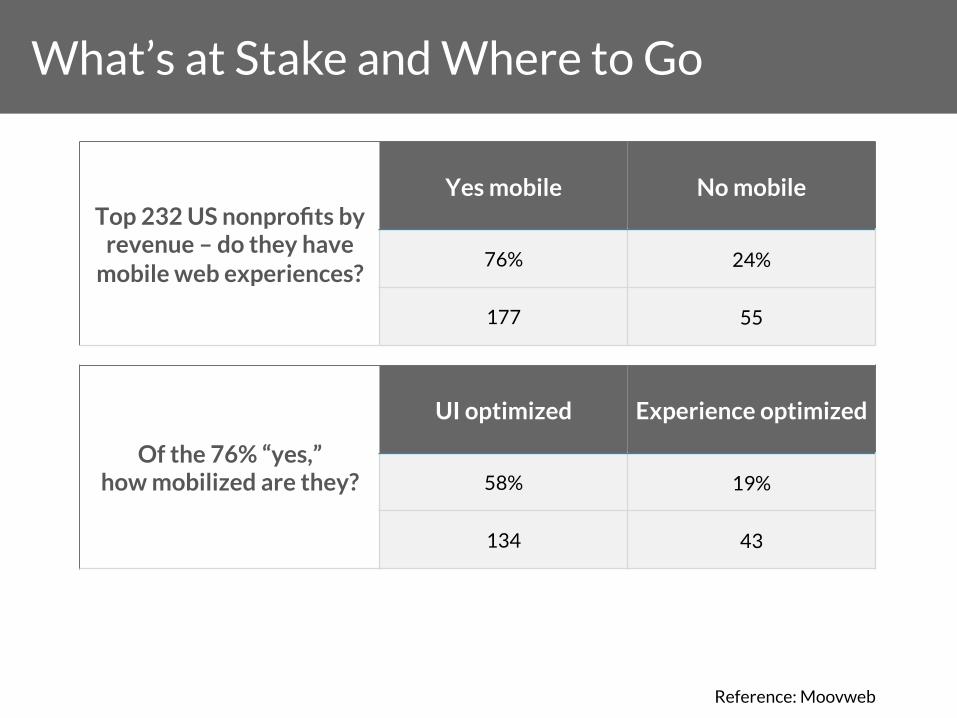
Top 232 US nonprofits by revenue – do they have
mobile web experiences?
Yes mobile No mobile
76% 24%
177 55
Of the 76% “yes,” how mobilized are they?
UI optimized Experience optimized
58% 19%
134 43
Reference: Moovweb
What’s at Stake and Where to Go
Top 232 US nonprofits by revenue – do they have
mobile web experiences?
Yes mobile No mobile
76% 24%
177 55
Of the 76% “yes,” how mobilized are they?
UI optimized Experience optimized
58% 19%
134 43
What’s at Stake and Where to Go
Nonprofits who make it hard to give online “may be missing out on billions of dollars in online gifts.”
Reference: http://philanthropy.com/article/Most-Charities-Fail-at-Online/144401/
Nonprofits who make it hard to give online “may be missing out on billions of dollars in
online gifts.”
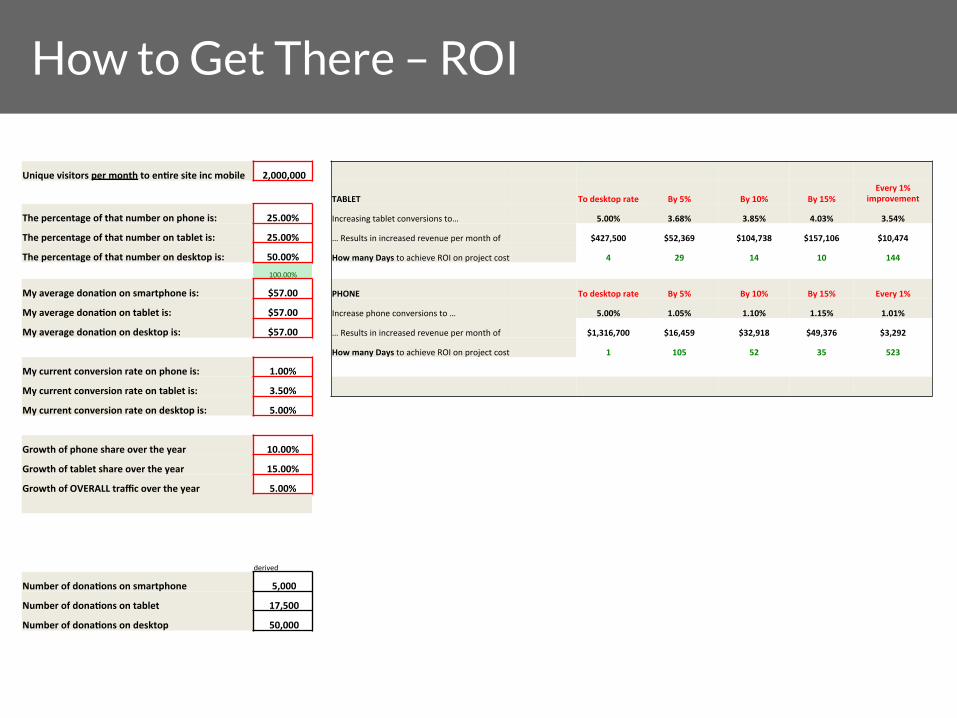
How to Get There – ROI
Unique visitors per month to en6re site inc mobile 2,000,000
TABLET To desktop rate By 5% By 10% By 15% Every 1%
improvement
The percentage of that number on phone is: 25.00% Increasing tablet conversions to… 5.00% 3.68% 3.85% 4.03% 3.54%
The percentage of that number on tablet is: 25.00% … Results in increased revenue per month of $427,500 $52,369 $104,738 $157,106 $10,474
The percentage of that number on desktop is: 50.00% How many Days to achieve ROI on project cost 4 29 14 10 144
100.00%
My average dona6on on smartphone is: $57.00 PHONE To desktop rate By 5% By 10% By 15% Every 1%
My average dona6on on tablet is: $57.00 Increase phone conversions to … 5.00% 1.05% 1.10% 1.15% 1.01%
My average dona6on on desktop is: $57.00 … Results in increased revenue per month of $1,316,700 $16,459 $32,918 $49,376 $3,292
How many Days to achieve ROI on project cost 1 105 52 35 523
My current conversion rate on phone is: 1.00%
My current conversion rate on tablet is: 3.50%
My current conversion rate on desktop is: 5.00%
Growth of phone share over the year 10.00% TABLET PROJECT COST IN YEAR ONE $49,600
Growth of tablet share over the year 15.00% Implementa6on $25,000
Growth of OVERALL traffic over the year 5.00% Maintenance and support $1,500
$550
derived SMARTPHONE PROJECT COST IN YEAR ONE $56,600
Number of dona6ons on smartphone 5,000 Implementa6on $32,000
Number of dona6ons on tablet 17,500 Maintenance and support $1,500
Number of dona6ons on desktop 50,000 $550
What does this mean for your digital strategy?
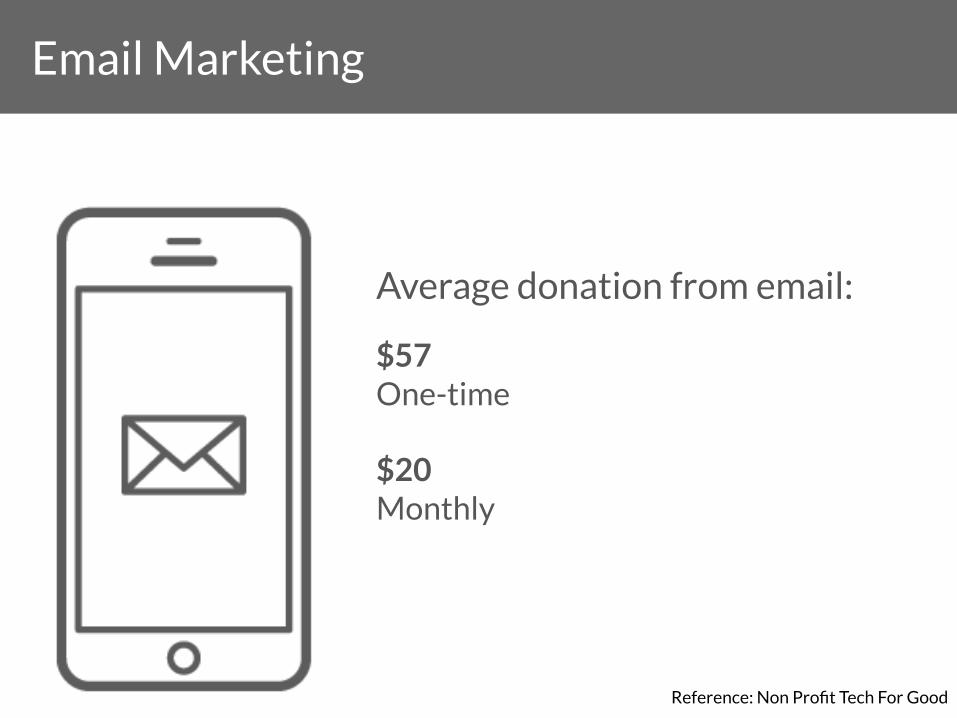
Average donation from email:
$57 One-time $20 Monthly
Reference: Non Profit Tech For Good
Email Marketing
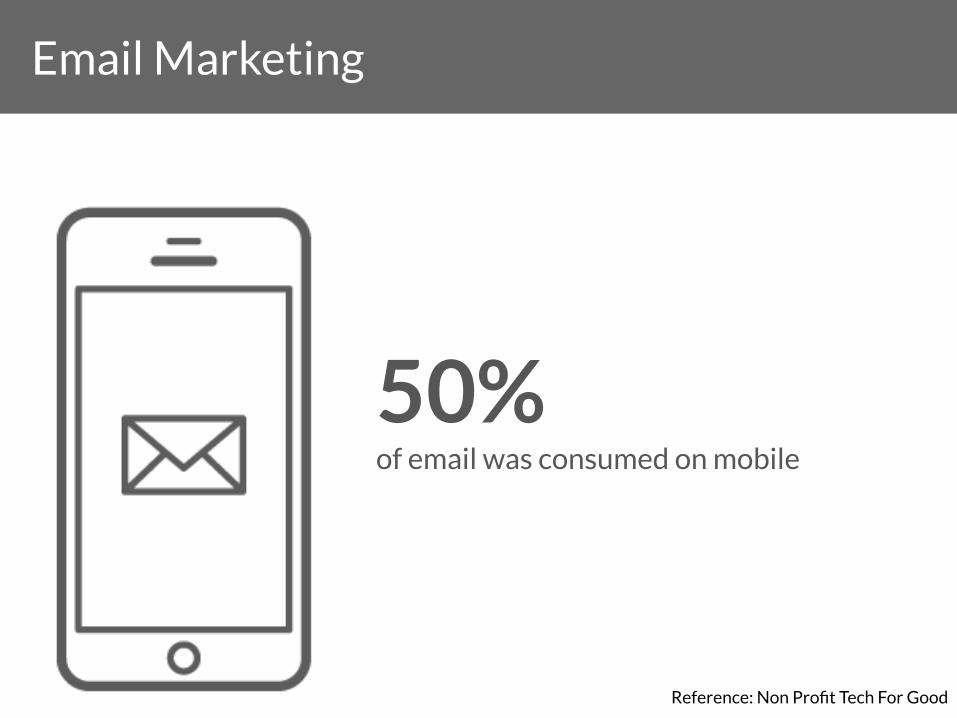
50% of email was consumed on mobile
Reference: Non Profit Tech For Good
Email Marketing
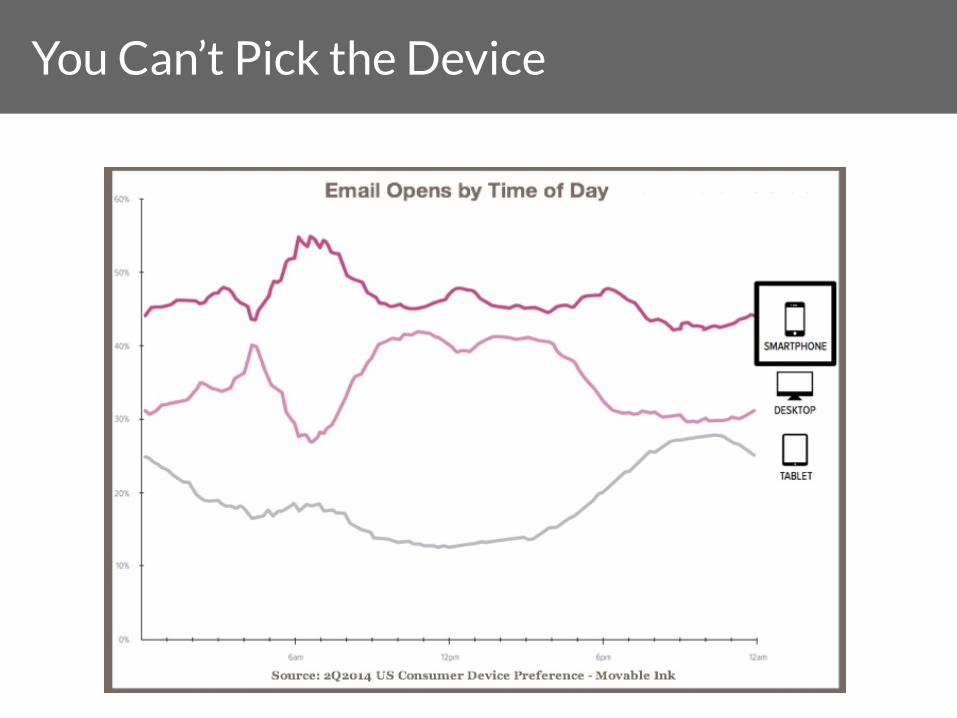
You Can’t Pick the Device
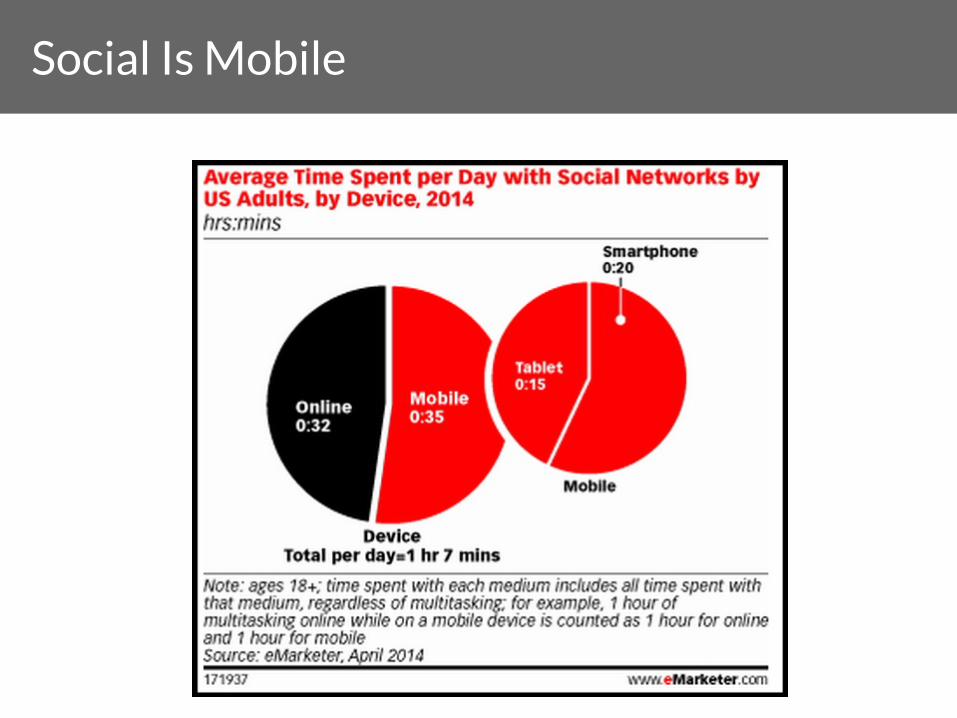
Social Is Mobile
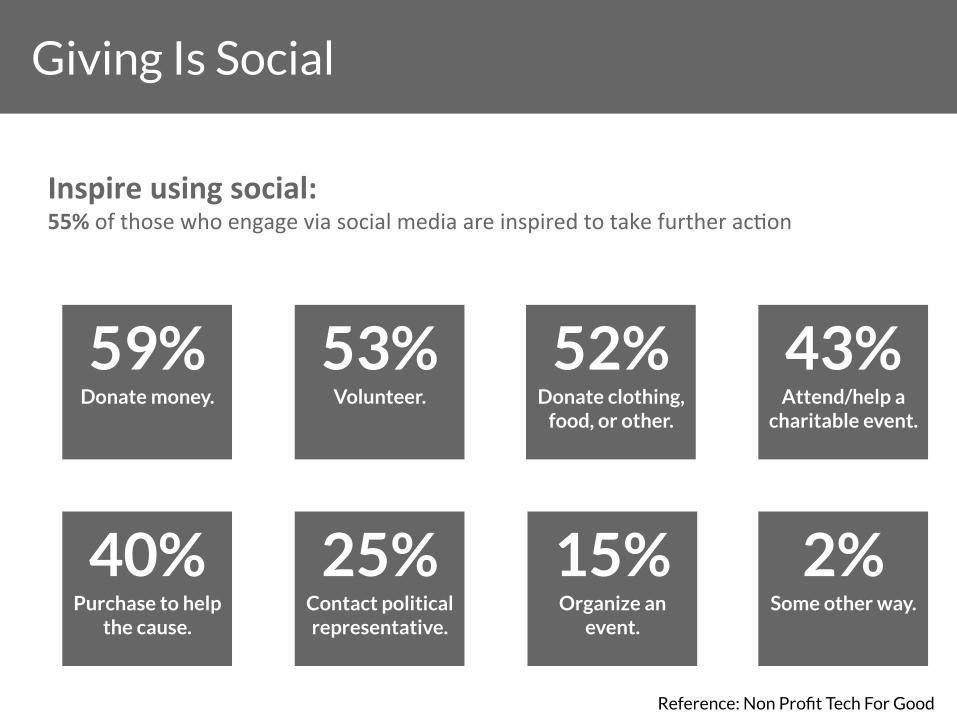
Inspire using social: 55% of those who engage via social media are inspired to take further acDon
Donate money.
59% Volunteer.
53%
Donate clothing, food, or other.
52%
Attend/help a charitable event.
43%
Purchase to help the cause.
40%
Contact political representative.
25%
Organize an event.
15% Some other way.
2%
Reference: Non Profit Tech For Good
Giving Is Social
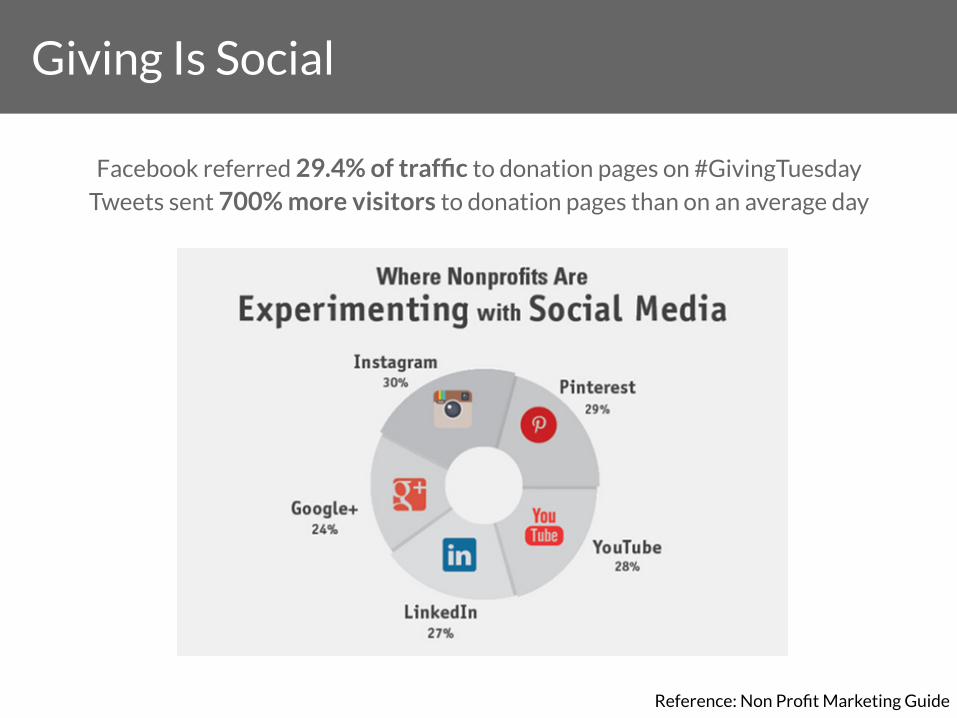
Facebook referred 29.4% of traffic to donation pages on #GivingTuesday
Tweets sent 700% more visitors to donation pages than on an average day
Reference: Non Profit Marketing Guide
Giving Is Social
How does this apply to your end of year giving?
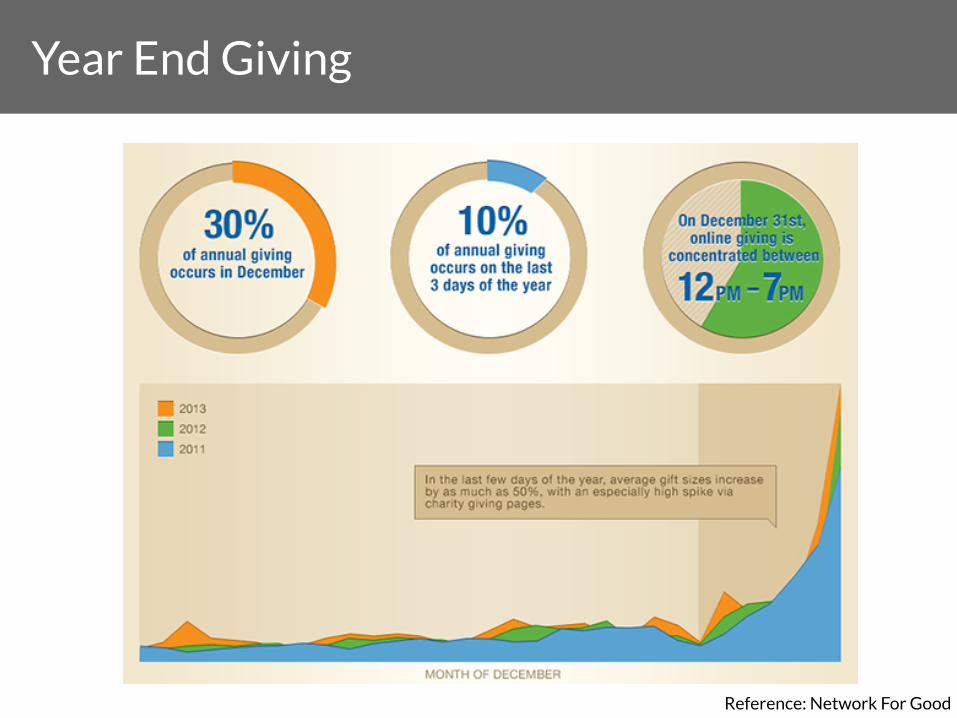
Year End Giving
Reference: Network For Good
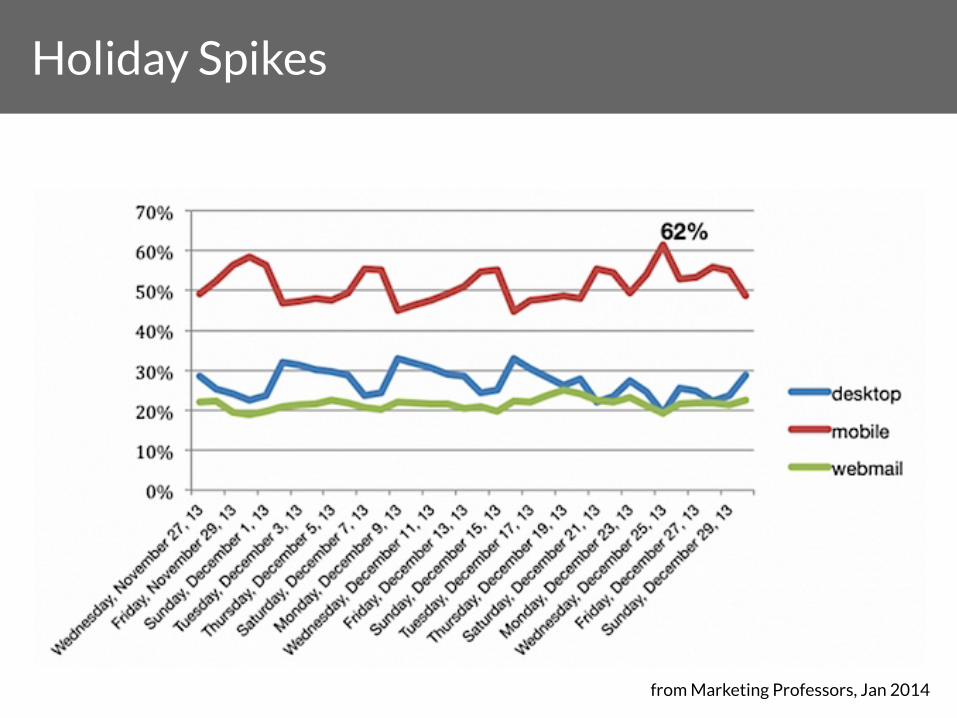
from Marketing Professors, Jan 2014
Holiday Spikes
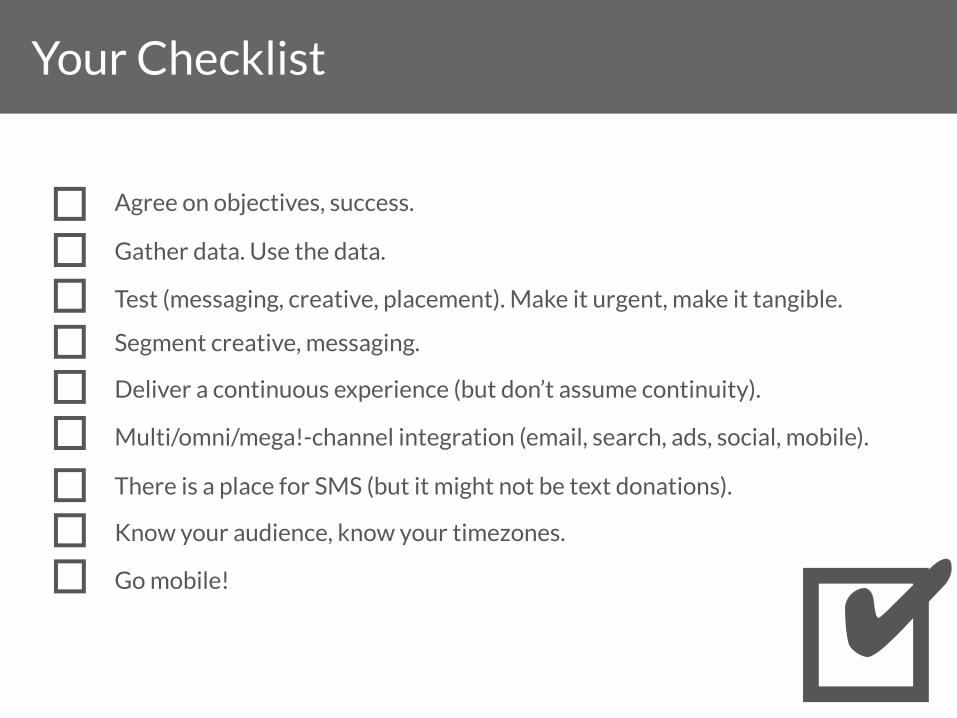
Agree on objectives, success.
Gather data. Use the data.
Test (messaging, creative, placement). Make it urgent, make it tangible.
Segment creative, messaging.
✔
Deliver a continuous experience (but don’t assume continuity).
Multi/omni/mega!-channel integration (email, search, ads, social, mobile).
Your Checklist
There is a place for SMS (but it might not be text donations).
Know your audience, know your timezones.
Go mobile!
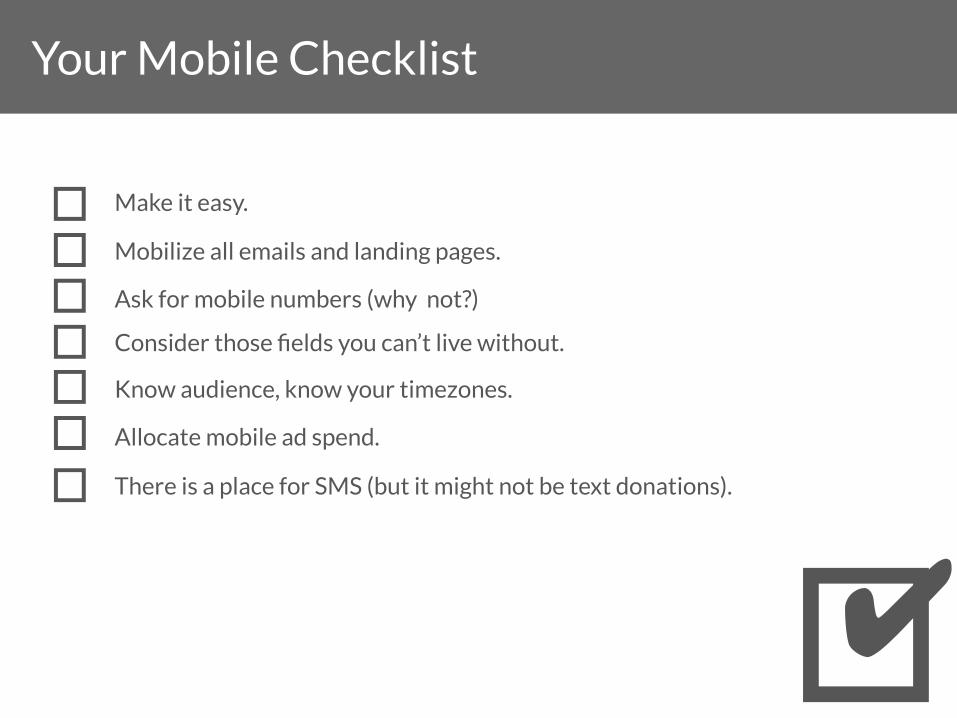
Make it easy.
Mobilize all emails and landing pages.
Ask for mobile numbers (why not?)
Consider those fields you can’t live without.
✔
Know audience, know your timezones.
Allocate mobile ad spend.
Your Mobile Checklist
There is a place for SMS (but it might not be text donations).