Embed Size (px)
Citation preview

Size, Share, Sources and Segments: Analysis
and Forecasts for Value-added Protein
Ingredient
April 2014
Virtual Client Briefing - 2014 Protein Trends &
Technologies Seminar
2
Today’s Agenda
• Market Overview of the
Global Protein and Amino
Acid Ingredients Market
• Mega Trends and
Opportunity Identification
in the Protein and Amino
Acid Ingredients Market
• Final Remarks and a Look
into the Crystal Ball

3
Market Overview of the Global Protein and
Amino Acid Ingredients Market

4
Market Segmentation of the Global Protein and
Amino Acid Ingredients Market
The protein ingredients product space is highly fragmented, where there is a lot of competition for a limited
number of end applications. This makes the importance of quickly identifying and addressing
opportunities and threats critical.
Protein Ingredients
Animal Protein Ingredients Plant Protein Ingredients
Wheat
Protein
Rice
Protein
Potato
Protein
Canola
Protein
Soy
Protein
Isolate
(SPI)
Soy
Protein
Concent
rate
(SPC)
Texture
d Soy
Protein
(TSP)
Pea
Protein
Soy
Protein
Other
Protein Dairy Protein
Ingredients
Milk Protein Concentrate (MPC)
Whey Protein Isolate (WPI)
Whey Protein Concentrates (WPC35 and WPC80)
Whey Protein Hydrolysate (WPH)
Casein/Caseinates
Egg Proteins Gelatine Algae
Amino Acid Ingredients
Animal and Plant Source which includes
L-glutamate
D, L. Methionine
L-Lysine HCL
Glycine
L-Phenylalanine
L-Aspartic acid
L-Threonine
L-Cysteine
D, L –Alanine
L- Glutamine
L-Arginine
L- Tryptophan
L – Valine
L –Leucine
L –Alanine
L –Isoleucine
L – Histidine
L – Proline
L – Serine
L - Tyrosine

5
Note: All figures are rounded.
The base year is 2013.
Source: Frost & Sullivan analysis.
Steady demand from nutritional applications such as nutritional formulas, infant formulas, milk-based
nutritional drinks, sports nutrition, and weight management products drives the demand for a wide range of
protein and amino acid ingredient solutions.
2 Emerging regions are creating
new opportunities for all protein
and amino acid suppliers.
3
The industry’s drive to promote
the potential health benefits of
protein and amino acids spurs
demand.
1
The food industry is looking for
improved functionality from its
specialist protein ingredients. The
demand for such products will
continue to drive demand.
Top Three Growth Factors
Total Proteins and Amino Acid Ingredients—
Global Market Opportunity Dashboard
Stable Increasing Decreasing
$46.83
($ B) 7.0%
Market Size (Revenue) Market Revenue Size
CAGR
(2013) (2013-2020)
7,834
(‘000 MT) 5.7%
Market Size (Unit
Shipment) Unit Shipment
CAGR
(2013) (2013-2020)

6
Proteins and Amino Acids—Market Size By
Region
Proteins and Amino Acids: Unit Shipment by Region, Global (2013)
Note: All figures are rounded. The base year is 2012. Source: Frost & Sullivan
Europe
2013 Market Size: 2,547
(‘000 MT)
A mature market, Europe represents
33% of the global consumption.
United States
2013 Market Size: 2,633
(‘000 MT)
Contributes 34% of global
consumption and is approaching
market maturity.
Asia-Pacific
2013 Market Size: 1,689
(‘000 MT)
Fastest growing region due to
growth in infant formulas.
Rest of the World
2013 Market Size: 965
(‘000 MT)
Rest of World is also fast growing sector
due to general and infant nutrition
growth

7
Total Proteins and Amino Acid Ingredients—%
of Sales by Chemistry/Source
Total Protein and Amino Acids Market: %
of Revenue by Category, Global, 2013
Source: Frost & Sullivan analysis.
Animal Protein 61.2%
Plant Protein 13.8%
Amino Acids 25.0%
Animal-based proteins is the largest segment in the total market for proteins and amino acids. The
advantages that animal-based proteins offers include convenience and ease of formulation, consistent
performance, and better product stability and functionality.

8
-
5
10
15
20
25
30
0
500
1000
1500
2000
2500
Global Market Revenue, 2013 Growth
Glo
ba
l M
ark
et
Re
ve
nu
e (
$U
S M
illio
n) G
row
th, C
AG
R,, 2
01
3 - 2
02
0 (%
)
Protein Ingredients, Global Revenue, 2013 - 2018
Specifically in the protein segment, it is expected that the incumbent ingredients will continue to dominate
the market, but niche ingredients such as pea, rice, and canola-based protein ingredients will emerge as a
serious contenders.
Focus on Protein Ingredients—Opportunity
Overview

9
Total Proteins and Amino Acid Ingredients—%
of Sales by Chemistry/Source
Animal Protein Ingredients Market: % of
Revenue by Category, Global, 2013
Source: Frost & Sullivan analysis.
Collagen 1.9%
Egg Proteins 69.9%
MPCs 3.7%
Whey Proteins 12.5%
Casein/ caseinates
7.5%
Gelatin 4.6%
Egg proteins hold the largest segment as its more preferred by food formulators for its emulsifier,
sensory, and textural properties. Dairy proteins are more preferred in higher-valued applications such as
sports and infant nutrition formulas.

10
Total Proteins and Amino Acid Ingredients—%
of Sales by Chemistry/Source
Plant Protein Ingredients Market: % of Revenue by
Category, Global, 2013
Source: Frost & Sullivan analysis.
Textured soy protein
18.5%
Wheat 22.2%
Soy protein isolate 26.7%
Soy protein concentrate
32.2%
Pea 0.2%
Others (rice & canola)
0.1%
Soy proteins, the market leader in the plant-based protein space, offer formulators a cost-effective way
to reduce fat and match or increase the protein content of a variety of dairy products such as cheese,
milk, frozen dairy desserts, whipped toppings, yogurt and coffee whiteners.
Pea Proteins
Pea proteins are one of the
few plant protein ingredients
that scores high on
organoleptic acceptance by
consumers. Pea protein
isolates typically consists of
85 percent protein.
Applications include meat
substitutes, processed foods
such as soups, sauces, and
baked goods, snacks,
nutraceuticals, and sports
nutrition.

11
Proteins and Amino Acid Ingredients—Product
Attribute Selection Criteria
Source: Frost & Sullivan analysis.
Cost effectiveness and organoleptic properties play a key role in protein and amino acid ingredient
selection by customers.
1 5 2 3 4 7 6
Low High
Low High
Low High
Low High
Low High
Low High
Low High
Low High
Low High
Bioavailability
Safety
Regulatory
compliance
Green Source
Efficacy
Water
solubility
Cost
effectiveness
Organoleptic
Properties
Storage form
Protein and amino acids formulated into food should be stable
and bioavailable for the complete period.
It is important that ingredients are regulatory approved for their
health benefits.
Safety is an important attribute as ingredients are processed in
foods.
Cost effectiveness plays a key role in ingredient selection as the
volume required is very high for food processing.
Green source of ingredients acts as a value added benefit for
customers in marketing their functional food.
Ingredient performance should be evidently demonstrated,
through comparative analysis.
Water solubility of proteins is critical, as food manufacturers are
looking for ingredients that are completely soluble.
Organoleptic properties improvement is imperative for sustaining
growth.
Protein and amino acids should be available in solid, liquid and
powder form for easy compatibility with different type of foods.

12
88%
56% 60%
40%
85%
30%
12%
44% 40%
60%
15%
70%
Egg Proteins Dairy Proteins Gluten Soy Protein Wheat gluten Other Plant protein
Proteins and Amino Acids Usage Analysis, US, 2013
Functional Benefits Nutritional Benfits
At the total level, functional demand of proteins hold the largest share with 59.8 percent. The functional
properties are often enhanced by associated nutritional benefits.
Protein Ingredient Usage Trends

13
Mega Trends and Opportunity Identification
Assessment for Protein Ingredients

14
The Objective is to Filter Top Level Mega Trends
into Actionable Portfolio Prioritization
RELEVANT MEGA
TRENDS
Sustainable
Addressable Market
Detailed
Opportunities
Mega Trends Identification and
Prioritization
Final output: Prioritized
sustainable
addressable markets
and potential
opportunities
Detailed analysis of specific
need-based opportunities in
each sustainable addressable
market to provide actionable
data and outcomes
Determination Which
Addressable Markets are
Sustainable and Driven by Mega
Trends
Identified core total
addressable market and
specific opportunities
Green and Safe
Need-based
Opportunities
Economic Development
Health & Wellness

15
Heart Health Ingredients Market—Opportunity
Overview
• Cardiovascular diseases is a major cause for
mortality globally. This factor drives the demand
for heart healthy functional foods.
• The key heart health ingredients include proteins,
omega-3 fatty acids, phytosterols, and fiber.
• The current trend in this market is to develop
specialized ingredients for targeted applications
such as cholesterol lowering, blood pressure
control, and heart energy.
Source: Frost & Sullivan
Cardiovascular disease is the most costly non-communicable disease in the world in terms of medical spending and mortality. Protein ingredients have a big play here in this space if
managed wisely.

16
Cardiovascular diseases and diabetes, deaths
per 100,000 by country
The frequency of cardiovascular death is
correlated more with access to health care services as opposed to demand for
services. Thus, this unmet need in emerging economies could feasibly be addressed by value-added nutritional
protein ingredients.
0 200 400 600
Japan France
Australia Spain Israel
Canada Netherlands
Norway Italy
Belgium United Kingdom
Republic of Korea Denmark
Austria United States of America
Chile Germany
Greece Mexico
Czech Republic Brazil China
South Africa Hungary
India Indonesia
Turkey Saudi Arabia
Russian Federation
Cardiovascular diseases and diabetes, deaths per 100,000 (age-standardized estimate)
Source: World Health Organization

17
Weight Management Solutions is Needed
Obesity is a leading current and
future indicator for the prevalence
of heart disease, and
consequently an effective
indicator of where the demand for
nutritional protein ingredients is
and will be in coming years.
0 10 20 30 40
Japan
South Korea
Switzerland
Italy
Netherlands
Austria
Sweden
France
Denmark
Belgium
Germany
Portugal
Poland
Israel
Spain
Turkey
Greece
Finland
Iceland
Czech Republic
Luxembourg
Ireland
Canada
Australia
Chile
United Kingdom
New Zealand
Hungary
Mexico
United States
Obese population, measured, % of total population*
Source: OECD Health Data 2012
* % of total adult population with a BMI>30 kg/m2,
based on measures of height and weight
18
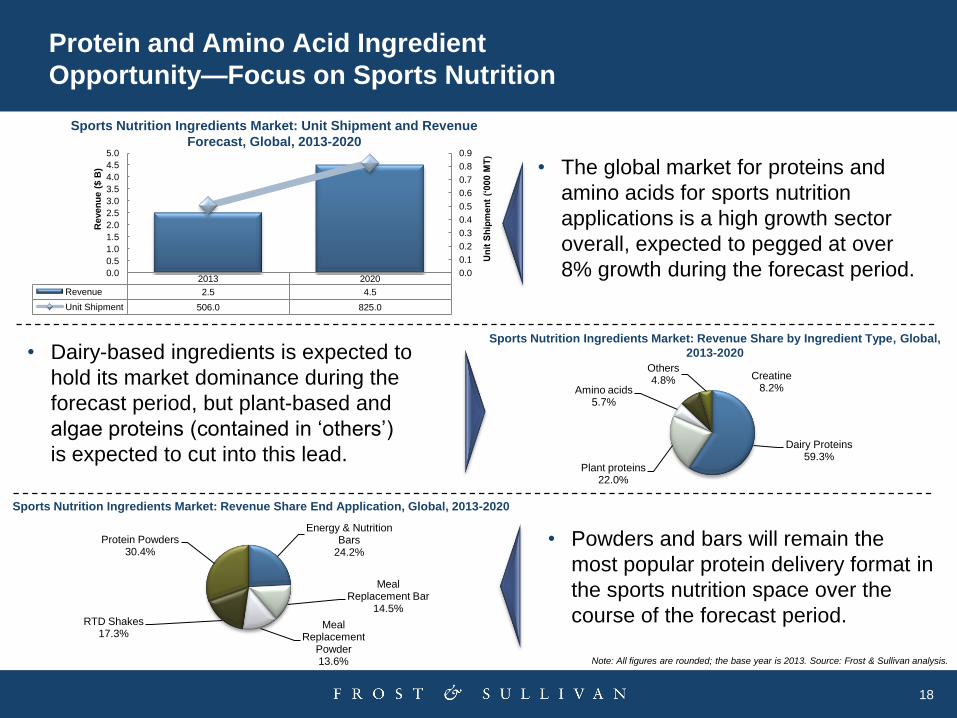
2013 2020
Revenue 2.5 4.5
Unit Shipment 506.0 825.0
0.0
0.1
0.2
0.3
0.4
0.5
0.6
0.7
0.8
0.9
0.0
0.5
1.0
1.5
2.0
2.5
3.0
3.5
4.0
4.5
5.0
Un
it S
hip
men
t (‘
000 M
T)
Reven
ue (
$ B
)
Dairy Proteins 59.3%
Plant proteins 22.0%
Amino acids 5.7%
Creatine 8.2%
Others 4.8%
Sports Nutrition Ingredients Market: Unit Shipment and Revenue
Forecast, Global, 2013-2020
Sports Nutrition Ingredients Market: Revenue Share by Ingredient Type, Global,
2013-2020
Energy & Nutrition Bars
24.2%
Meal Replacement Bar
14.5%
Meal Replacement
Powder 13.6%
RTD Shakes 17.3%
Protein Powders 30.4%
Sports Nutrition Ingredients Market: Revenue Share End Application, Global, 2013-2020
Note: All figures are rounded; the base year is 2013. Source: Frost & Sullivan analysis.
Protein and Amino Acid Ingredient
Opportunity—Focus on Sports Nutrition
• The global market for proteins and
amino acids for sports nutrition
applications is a high growth sector
overall, expected to pegged at over
8% growth during the forecast period.
• Dairy-based ingredients is expected to
hold its market dominance during the
forecast period, but plant-based and
algae proteins (contained in ‘others’)
is expected to cut into this lead.
• Powders and bars will remain the
most popular protein delivery format in
the sports nutrition space over the
course of the forecast period.

19
Economic Development drives the demand for
higher nutritionally-valued food products
• During the forecast period,
China will likely become a first
world country in terms of
economic might and, coupled
with the continued economic
strength of Japan and South
Korea, will make East Asia the
global center of economic
activity.
• However, North America will
continue to be an economic
powerhouse and the primary
bread-basket of the world.
• West Europe will eventually
shake off the currently Long
Recession and maintain its
place as the third pillar of the
global economy.
Based on current projections, it is expected that by 2030, East Asia will surpass the North America as
the biggest global economy in terms of total gross domestic product.
Africa
MENA
Central Europe
East Asia
EE&CA
Latin America
North America
Oceania
South Asia
West Europe
0
5000
10000
15000
20000
25000
GD
P (
$U
S b
illi
on
)
Africa MENA Central Europe East Asia
EE&CA Latin America North America Oceania
South Asia West Europe Note: MENA = Middle East and North Africa. EE&CA = East Europe and Central Asia.
Source: Source: The World Bank and Frost & Sullivan analysis
Gross Domestic Product by Region, $US billion, 2002 - 2035

20
Greater Sao
Paulo
28.78 million
Greater
Buenos Aires
36.48 million
Central Mexico
31.41 million
Chennai,
Kanchipuram,
Pondicherry
15.01 Million
Greater Los
Angeles
20.9 million
Tri State Area
36.86 million
Lagos and Eko
Atlantic City
25 million
Marmara Mega Region
Istanbul, Kocaeli
20.58 million
Mumbai, Bhiwandi,
Kalyan, Thane,
Ulhasnagar
34.42 Million
New Delhi, Noida,
Greater Noida,
Ghaziabad,
Gurgaon, Faridabad
28.53 Million
Population above
40 Million
Population between 20-
40 Million
Population between
15-20 Million
Beijing-Tianjin
51 Million
Shanghai
67.90 Million
Chongqing-
Chengdu
28.91 Million
Washington DC
Baltimore Area
15.63 million
Greater Rio de
Janeiro
17.24 million
Cairo-Giza
17.64 million
Source: : United Nations, Department of Economic and Social Affairs, Population Division
(2012). World Urbanization Prospects: The 2011 Revision , Frost & Sullivan, 2012
National Capital Region
in the Philippines
27.75 Million
Guangdong Region
58.75 Million
Greater Jakarta
29.8 million
Greater Bangkok
19.2 million
Kolkata,
Howrah
21.62 Million
By 2025, globally there will be 21 Mega Regions. Shanghai and Guangdong Mega Region to house 9% of
total population of China and increasingly fuel its economic development. Understanding food use drivers will
highly dependent on understanding the various needs of these urban agglomerations.
Economic Development: What is
Urbanization?—Centers of Demand for Value-
added Food Products
21
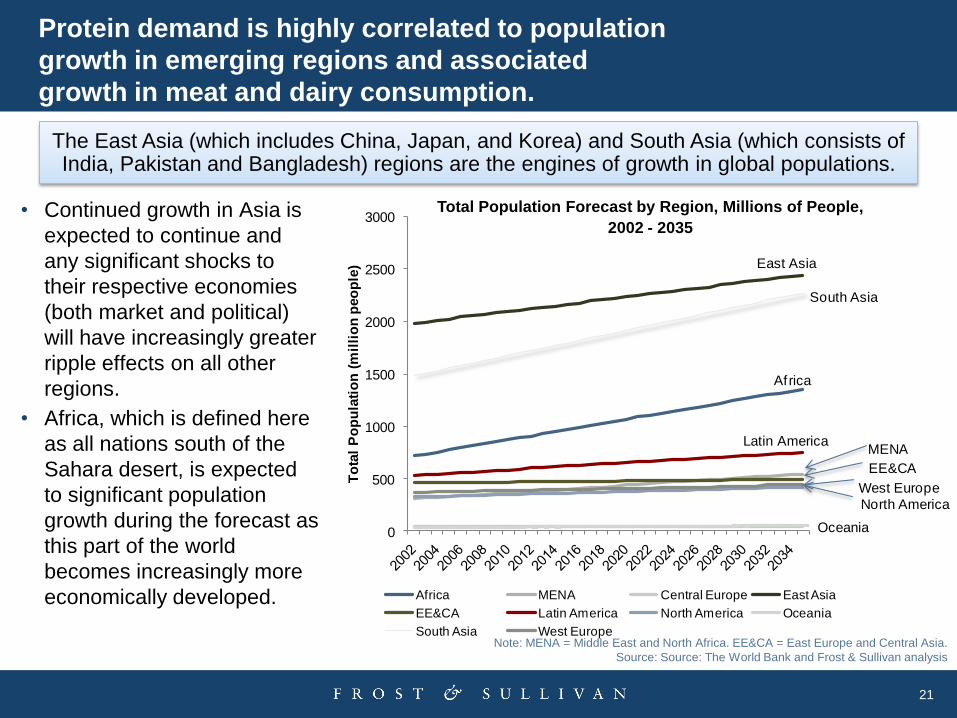
Protein demand is highly correlated to population
growth in emerging regions and associated
growth in meat and dairy consumption.
• Continued growth in Asia is
expected to continue and
any significant shocks to
their respective economies
(both market and political)
will have increasingly greater
ripple effects on all other
regions.
• Africa, which is defined here
as all nations south of the
Sahara desert, is expected
to significant population
growth during the forecast as
this part of the world
becomes increasingly more
economically developed.
Note: MENA = Middle East and North Africa. EE&CA = East Europe and Central Asia.
Source: Source: The World Bank and Frost & Sullivan analysis
The East Asia (which includes China, Japan, and Korea) and South Asia (which consists of India, Pakistan and Bangladesh) regions are the engines of growth in global populations.
Africa
MENA
East Asia
EE&CA
Latin America
North America
Oceania
South Asia
West Europe
0
500
1000
1500
2000
2500
3000
To
tal
Po
pu
lati
on
(m
illi
on
peo
ple
)
Africa MENA Central Europe East Asia
EE&CA Latin America North America Oceania
South Asia West Europe
Total Population Forecast by Region, Millions of People,
2002 - 2035

22
Cereal Demand though Meat Consumption
Strengthens with Economic Development
• The production of meat products through raising livestock is very
cereal use-intensive and consequently the demand for cereal
increases markedly when the demand for meat products increases.
This in turn will drive cereal prices upward in heavy meat
consuming regions.
Source: The World Bank, USDA, and Frost & Sullivan
A general rule of thumb which is validated through many historical observations, as a given region’s income increases, so does its taste for food rich in animal proteins, and thus the demand for proteins.
477
411
150
242
1,073
0.0
20.0
40.0
60.0
80.0
100.0
120.0
140.0
(0) 10,000 20,000 30,000 40,000 50,000 60,000
Me
at
Co
ns
um
pti
on
Pe
r C
ap
ita (
kg
)
Gross Domestic Product Per Capita ($US)
Cereal Demand Intensity as a Function of Meat Demand and Income, Selected Countries, 2012
United States
Brazil
Russia China
India
Note: Bubble Size Indicates Cereal Per Capita Annual Consumption (kg).
• For example, in the United States, the
per capita demand for cereal is more
than double due to its population’s
generally high level of income and
consequently animal protein-rich diet.
• Today, India’s per capita level of income
and cereal demand is relatively low for
an emerging nation, but it is expected
that even if and when India’s per capita
income increases, per capita meat
consumption will remain low due to
cultural factors.

23
Final Remarks and a Look into the Crystal Ball

24
CEO’s Perspective
Source: Frost & Sullivan
2
The consumption pattern of protein
ingredients varies across geographies and by
income. Hence, higher-valued concentrated
ingredients are more prominent in the west
than the east.
3 Vertical integration is a critical success factor
in this market.
5 Best practices like customer service, product
differentiation and value addition boost
company growth.
1
The global protein and amino ingredients
market is a relatively fragmented and
competitive, meaning price matters.
4 As the market is becoming more technology
intensive, increase in R&D spending serves
as a competitive edge.

25
Suggested Promotion Strategy—Communicating
Health Care Cost Savings
• A significant amount of scientific research has
been conducted involving dietary supplements
and many demonstrate a positive impact on
reducing the risk of a disease event through
supplement use
• Disease events require costly treatment
services, but until now there has been little effort
to effectively calculate the cost-effectiveness of
such supplement use.
• Our report demonstrates that significant cost
savings can be realized through the smart use
of scientifically-substantiated dietary
supplements among high risk populations.
Understanding the link between smart prevention and health care cost savings will help key
stakeholders, including patients, health care professionals, governments, insurance
companies and employers, make better-informed decisions on the best course of action that
minimizes current and future health care costs and maximizes long term potential benefits.

26
Suggested Promotion Strategy—
Communicating Health Care Cost Savings
(continued)
Determine Hospital Utilization Costs in the Current State
Avoided Hospital Utilization Costs Given 100% Use of Dietary Supplement Regimen
at Preventive Intake Levels
Costs of Dietary Supplement Utilization
Potential Net Cost Savings from
Dietary Supplement Usage
Once the expected risk reduction factor is derived from the scientific literature review, the
potential cost savings derived from increasing nutrient intake among a given high risk
population can be calculated.
Revised Hospital Utilization Costs Accounting for
Dietary Supplement Usage

27
Finally...the end. But before we go, let’s look into
the Crystal Ball
• Increasingly, dietary supplement companies are directly marketing to healthcare providers for two key reasons—it increases the creditability (and differentiation) of product attributes in the minds of the final end user and it is a way to avoid the marketing noise many companies face in the dietary supplement channel.
Marketing to
Healthcare Providers
• In the long run, consumers will increasingly prefer a non-prescription option due to personal budget and hassle constraints. The key challenge that could emerge however is to ensure that the market wont further digress into the noisy dietary supplement channel dynamics.
“Over-the-Counter”-
like Marketing will be
the New Normal
• As stated, the production of meat products through raising livestock is very cereal use-intensive and consequently the demand for cereal increases markedly when the demand for meat products increases. This is a prime, and growing, opportunity for protein ingredient suppliers to help supplement nutritional needs in the emerging world where meat is still a luxury.
The Global Demand
for Cereal will Drives
Up Food Prices
Across the Board

28
I mean it this time…The Last Word
2 Pea, canola, rice, and algae-based protein suppliers are ready to
compete….are you?
3 The new emerging markets (beyond BRIC) represents a promising
potential for global protein and amino acid manufacturers to
penetrate.
1 The Health and Wellness Mega Trend will sustain the growth of
the protein and amino acid ingredients market.
Source: Frost & Sullivan

29
Q&A
10+ years experience in agricultural, chemical, and natural
resource markets. Expert in ingredients, chemicals, material,
and agriculture markets with a focus on food & agriculture,
organic polymers, energy, and natural resources
Education
Master of Science in Agricultural Economics, The Ohio State
University,
Christopher Shanahan
Global Program Manager
Food Ingredients & Feed
For more information:
Jeannette Garcia
Corporate Communications
210-477-8419

30
Legal Disclaimer
Frost & Sullivan takes no responsibility for any incorrect information supplied to us by
manufacturers or users. Quantitative market information is based primarily on interviews
and therefore is subject to fluctuation. Frost & Sullivan research services are limited
publications containing valuable market information provided to a select group of
customers. Our customers acknowledge, when ordering or downloading, that Frost &
Sullivan research services are for customers’ internal use and not for general publication
or disclosure to third parties. No part of this research service may be given, lent, resold or
disclosed to noncustomers without written permission. Furthermore, no part may be
reproduced, stored in a retrieval system, or transmitted in any form or by any means,
electronic, mechanical, photocopying, recording or otherwise, without the permission of
the publisher.
For information regarding permission, write to:
Frost & Sullivan
331 E. Evelyn Ave. Suite 100
Mountain View, CA 94041
©2014 Frost & Sullivan. All rights reserved. This document contains highly confidential information and is the sole property of Frost & Sullivan.
No part of it may be circulated, quoted, copied or otherwise reproduced without the written approval of Frost & Sullivan.