Embed Size (px)
Citation preview
A REPORT SAMPLE CURIOUS TRENDS: THE FOOD INDUSTRY 2015 The Year of Transition
The past year in the food industry has been a year of
transitions. The consumer is moving from paper to digital
lists. Price has risen as a consideration both at the grocery
and when selecting a restaurant and Millennials are
impacting food consumption behavior.
Methodology900 M/F 18-99 over 4 quarters (a full year of data)
U.S. only; Quotaed to Census for age, gender and ethnicity
At least 50% responsibility for grocery shopping, meal planning, choosing restaurants when dining out OR in, preparing meals in the home OR planning parties or events in the home
Q2 2015Q3 2015
Q1 2015
Q4 2015
Q4 2014
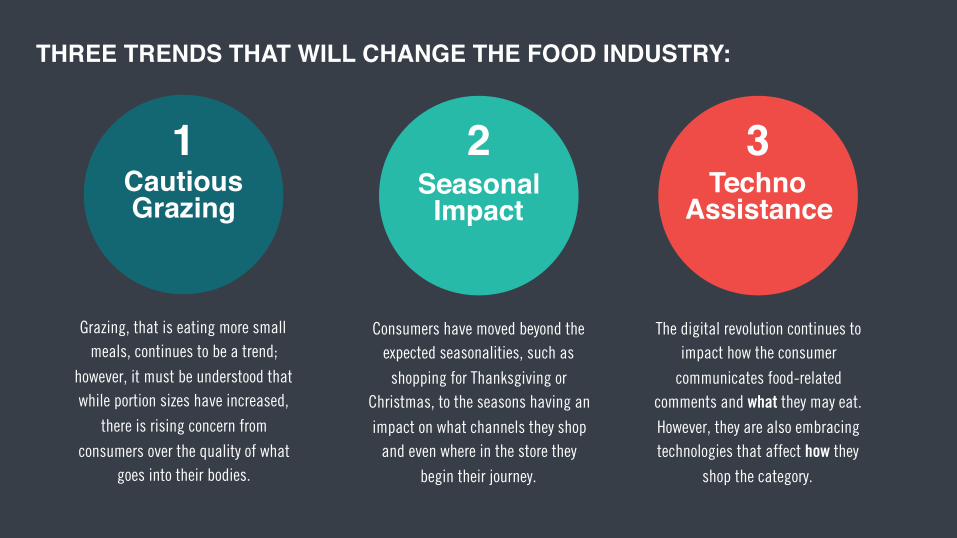
TechnoAssistance
The digital revolution continues to
impact how the consumer
communicates food-related
comments and what they may eat.
However, they are also embracing
technologies that affect how they
shop the category.
THREE TRENDS THAT WILL CHANGE THE FOOD INDUSTRY:
SeasonalImpact
Consumers have moved beyond the
expected seasonalities, such as
shopping for Thanksgiving or
Christmas, to the seasons having an
impact on what channels they shop
and even where in the store they
begin their journey.
2CautiousGrazing
Grazing, that is eating more small
meals, continues to be a trend;
however, it must be understood that
while portion sizes have increased,
there is rising concern from
consumers over the quality of what
goes into their bodies.
1 3

4
CautiousGrazing
1
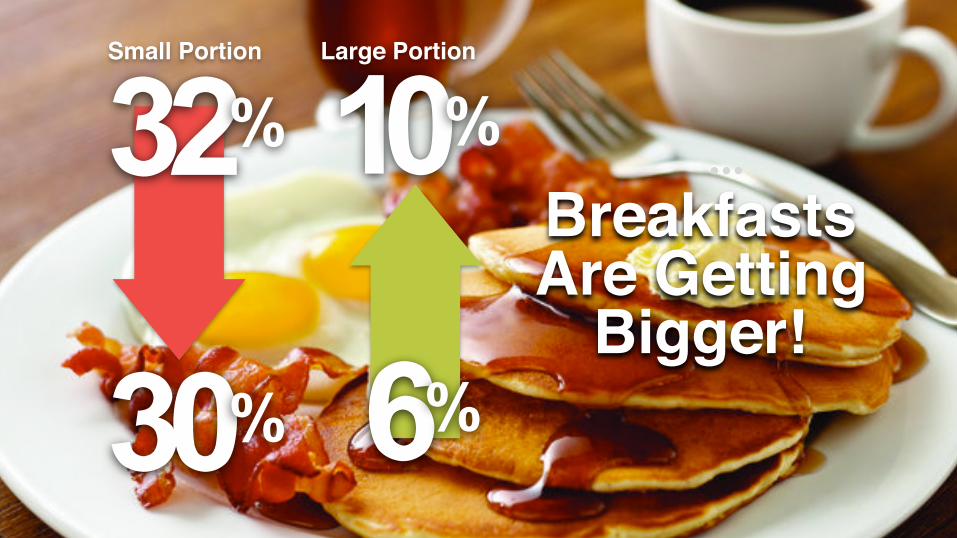
Small Portion
BreakfastsAre Getting
Bigger!
30%
10%32%
6%
Large Portion
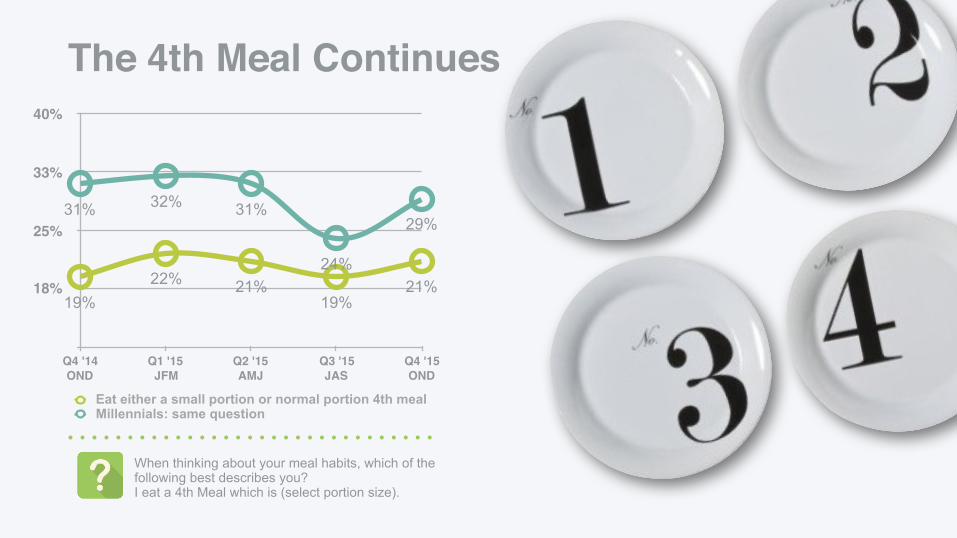
The 4th Meal Continues
18%
25%
33%
40%
Q4 '14OND
Q1 '15JFM
Q2 '15AMJ
Q3 '15JAS
Q4 '15OND
31% 32% 31%
24%
29%
19%22% 21%
19%21%
Eat either a small portion or normal portion 4th mealMillennials: same question
When thinking about your meal habits, which of the following best describes you? I eat a 4th Meal which is (select portion size).
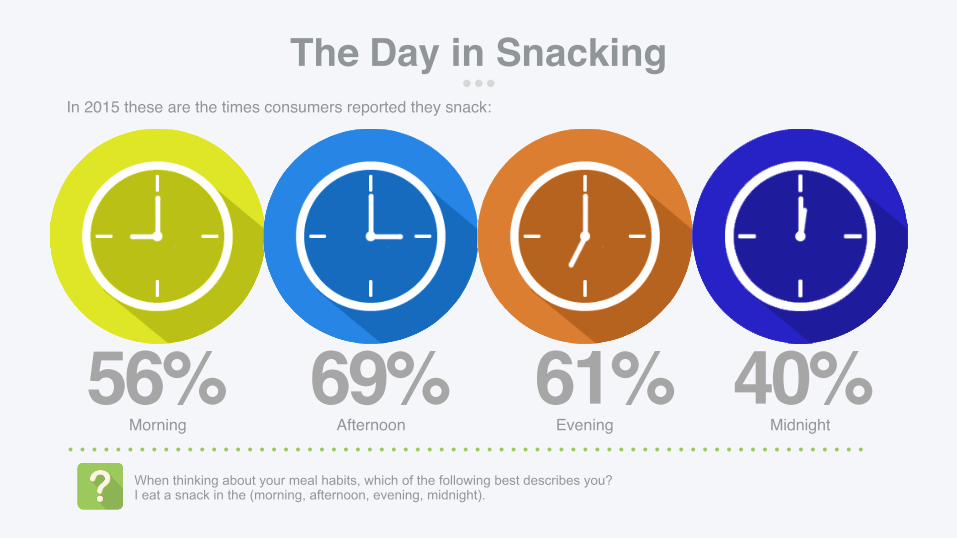
In 2015 these are the times consumers reported they snack:
The Day in Snacking
56% 69% 61% 40%Morning Afternoon Evening Midnight
When thinking about your meal habits, which of the following best describes you? I eat a snack in the (morning, afternoon, evening, midnight).
Variety
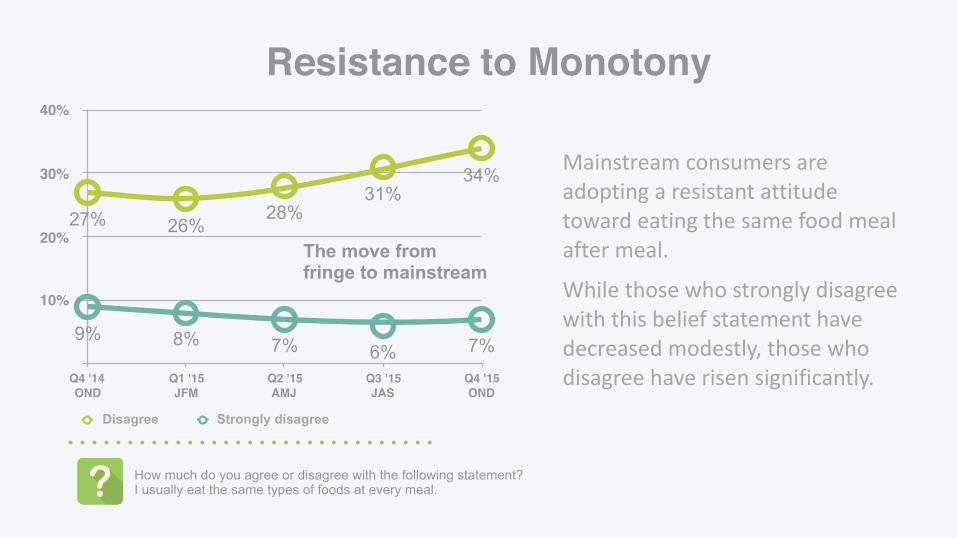
Resistance to Monotony
10%
20%
30%
40%
Q4 '14OND
Q1 '15JFM
Q2 '15AMJ
Q3 '15JAS
Q4 '15OND
9% 8% 7% 6% 7%
27% 26%28%
31%34%
Disagree Strongly disagree
Mainstream consumers are adopting a resistant attitude toward eating the same food meal after meal.
While those who strongly disagree with this belief statement have decreased modestly, those who disagree have risen significantly.
How much do you agree or disagree with the following statement? I usually eat the same types of foods at every meal.
The move from fringe to mainstream

Health
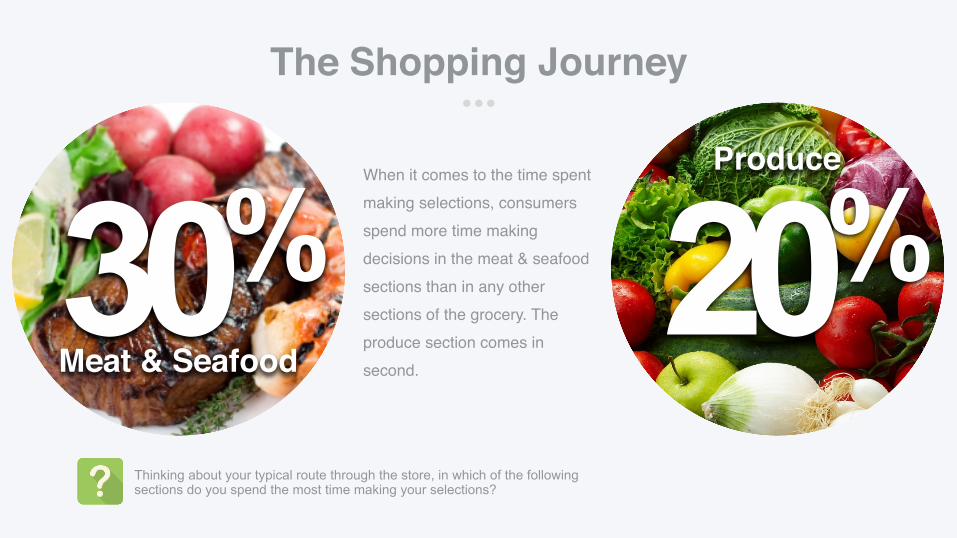
When it comes to the time spent making selections, consumers spend more time making decisions in the meat & seafood sections than in any other sections of the grocery. The produce section comes in second.
The Shopping Journey
20%Produce
30%Meat & Seafood
Thinking about your typical route through the store, in which of the following sections do you spend the most time making your selections?
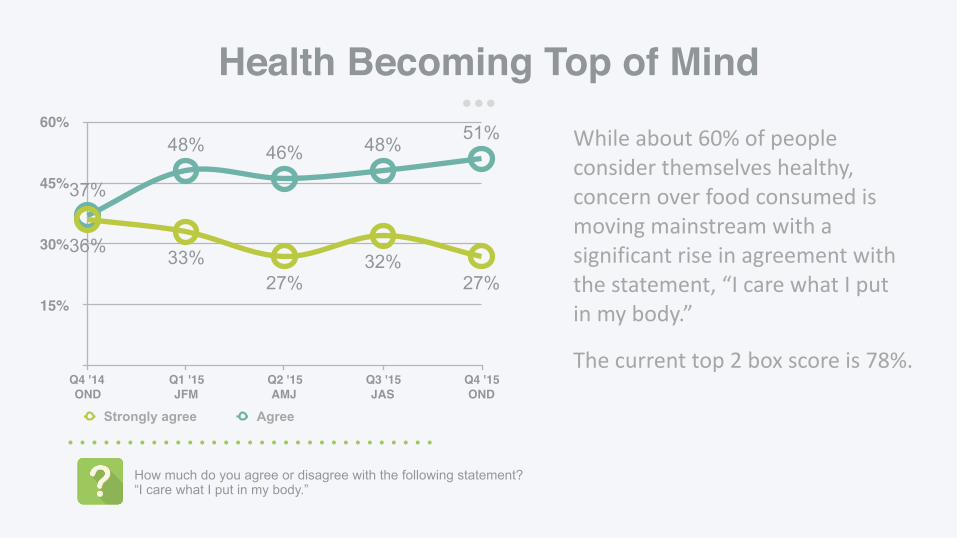
Health Becoming Top of Mind
15%
30%
45%
60%
Q4 '14OND
Q1 '15JFM
Q2 '15AMJ
Q3 '15JAS
Q4 '15OND
37%
48% 46% 48% 51%
36% 33%27%
32%27%
Strongly agree Agree
While about 60% of people consider themselves healthy, concern over food consumed is moving mainstream with a significant rise in agreement with the statement, “I care what I put in my body.”
The current top 2 box score is 78%.
How much do you agree or disagree with the following statement? “I care what I put in my body.”
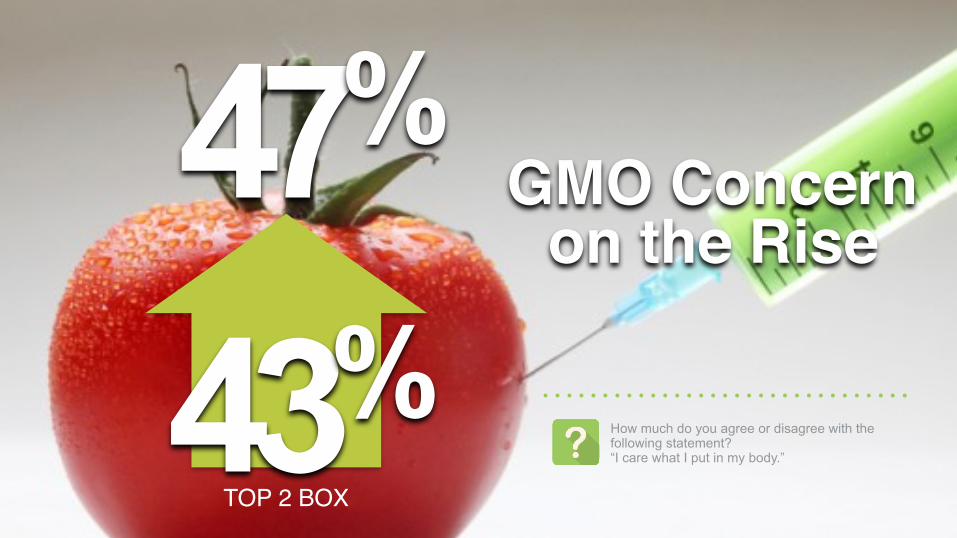
47%
43%GMO Concern
on the Rise
How much do you agree or disagree with the following statement? “I care what I put in my body.”
TOP 2 BOX

Price
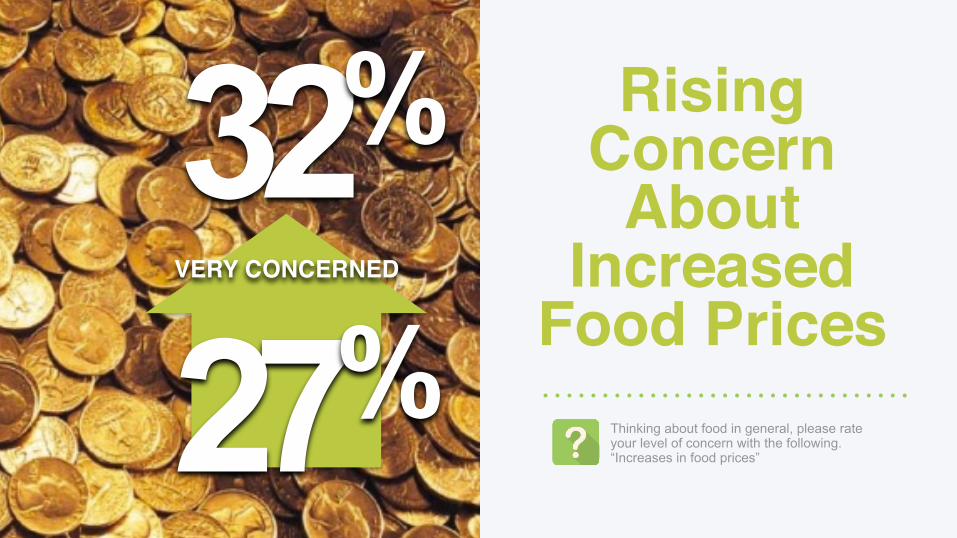
32%
27%
Rising Concern
AboutIncreased
Food PricesThinking about food in general, please rate your level of concern with the following. “Increases in food prices”
VERY CONCERNED
48%
55%
63%
70%
Q4 '14OND
Q1 '15JFM
Q2 '15AMJ
Q3 '15JAS
Q4 '15OND
50% 51%
60%62%
59%
T2B
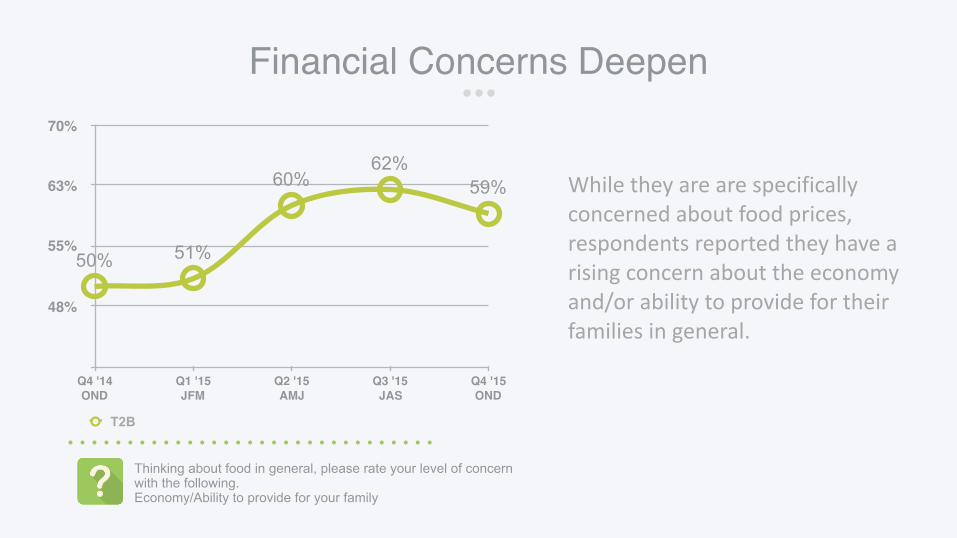
While they are are specifically concerned about food prices, respondents reported they have a rising concern about the economy and/or ability to provide for their families in general.
Thinking about food in general, please rate your level of concern with the following. Economy/Ability to provide for your family
Financial Concerns Deepen
24.5%
29%
33.5%
38%
Q4 '14OND
Q1 '15JFM
Q2 '15AMJ
Q3 '15JAS
Q4 '15OND
32%30%
38% 38%36%
Stongly Agree
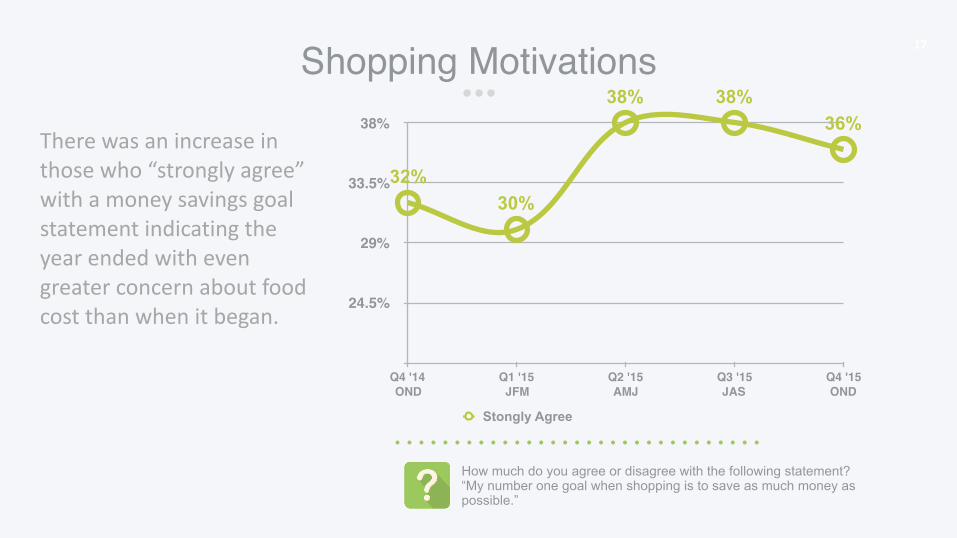
Shopping Motivations 17
There was an increase in those who “strongly agree” with a money savings goal statement indicating the year ended with even greater concern about food cost than when it began.
How much do you agree or disagree with the following statement? “My number one goal when shopping is to save as much money as possible.”
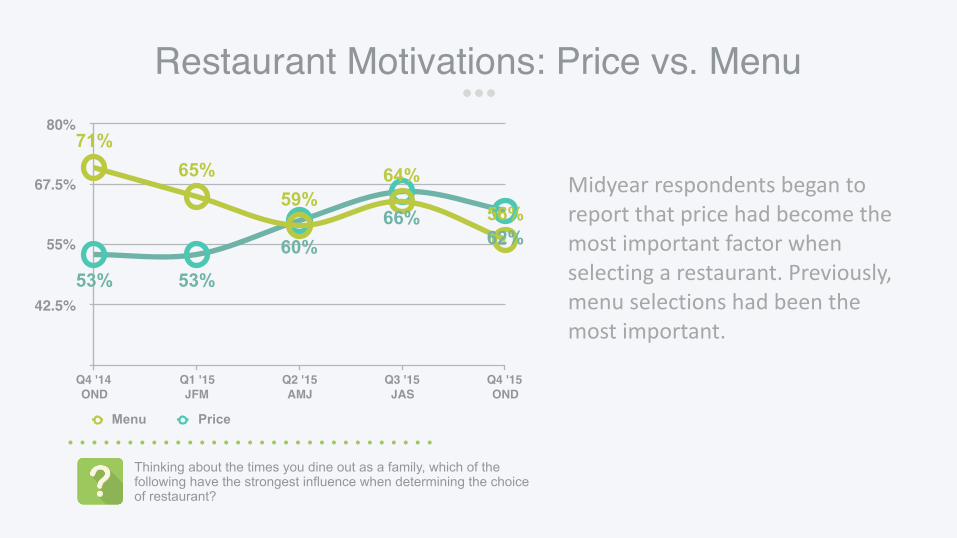
Restaurant Motivations: Price vs. Menu
42.5%
55%
67.5%
80%
Q4 '14OND
Q1 '15JFM
Q2 '15AMJ
Q3 '15JAS
Q4 '15OND
53% 53%
60%66%
62%
71%65%
59%64%
56%
Menu Price
Midyear respondents began to report that price had become the most important factor when selecting a restaurant. Previously, menu selections had been the most important.
Thinking about the times you dine out as a family, which of the following have the strongest influence when determining the choice of restaurant?

SeasonalImpact
2
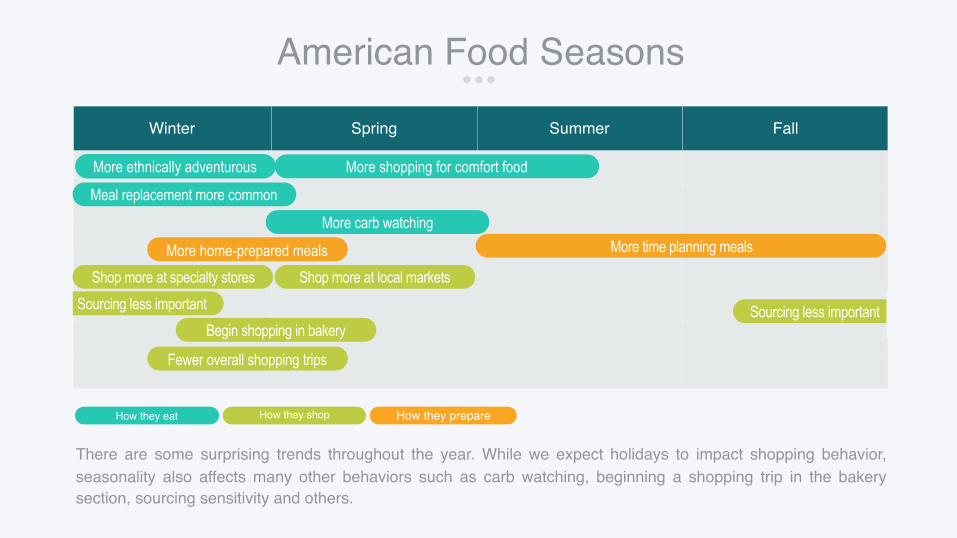
American Food Seasons
Winter Spring Summer Fall
More ethnically adventurous
How they shop How they prepareHow they eat
Fewer overall shopping trips
More home-prepared mealsShop more at specialty stores Shop more at local markets
More time planning meals
Begin shopping in bakery Sourcing less importantSourcing less important
More shopping for comfort food
Meal replacement more common
More carb watching
There are some surprising trends throughout the year. While we expect holidays to impact shopping behavior, seasonality also affects many other behaviors such as carb watching, beginning a shopping trip in the bakery section, sourcing sensitivity and others.
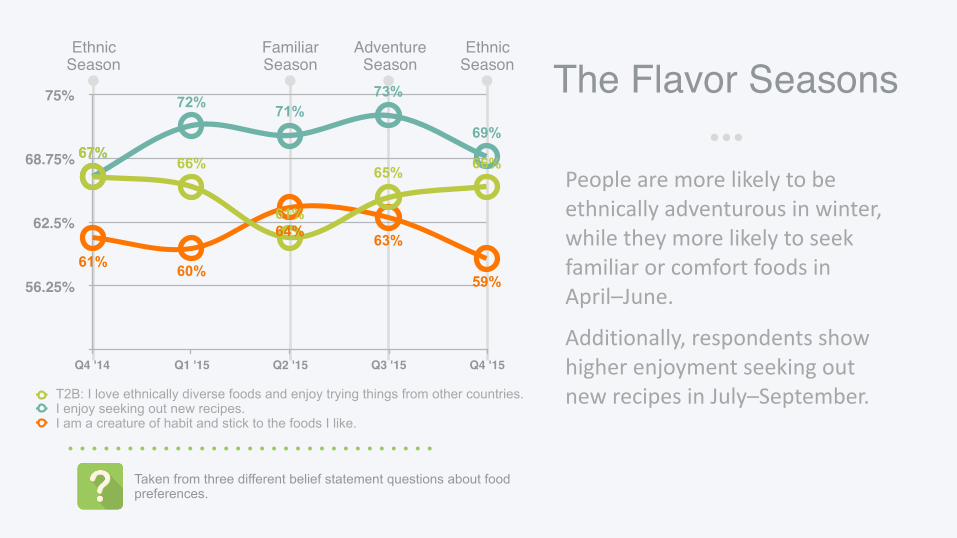
People are more likely to be ethnically adventurous in winter, while they more likely to seek familiar or comfort foods in April–June.
Additionally, respondents show higher enjoyment seeking out new recipes in July–September.
The Flavor Seasons
56.25%
62.5%
68.75%
75%
Q4 '14 Q1 '15 Q2 '15 Q3 '15 Q4 '15
61% 60%
64% 63%
59%
67%
72% 71%73%
69%67%
66%
61%
65% 66%
T2B: I love ethnically diverse foods and enjoy trying things from other countries.I enjoy seeking out new recipes.I am a creature of habit and stick to the foods I like.
EthnicSeason
EthnicSeason
AdventureSeason
FamiliarSeason
Taken from three different belief statement questions about food preferences.
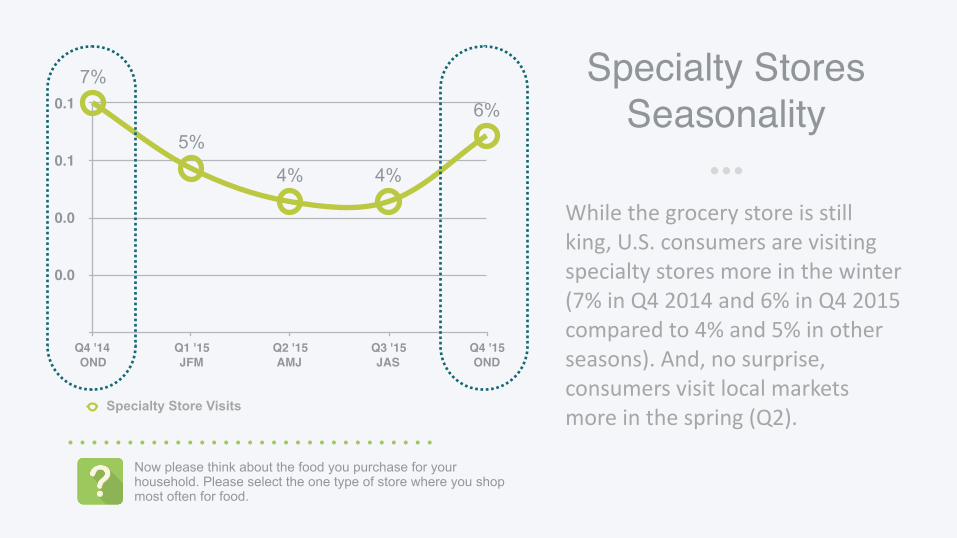
While the grocery store is still king, U.S. consumers are visiting specialty stores more in the winter (7% in Q4 2014 and 6% in Q4 2015 compared to 4% and 5% in other seasons). And, no surprise, consumers visit local markets more in the spring (Q2).
Specialty StoresSeasonality
0.0
0.0
0.1
0.1
Q4 '14OND
Q1 '15JFM
Q2 '15AMJ
Q3 '15JAS
Q4 '15OND
7%
5%
4% 4%
6%
Specialty Store Visits
Now please think about the food you purchase for your household. Please select the one type of store where you shop most often for food.
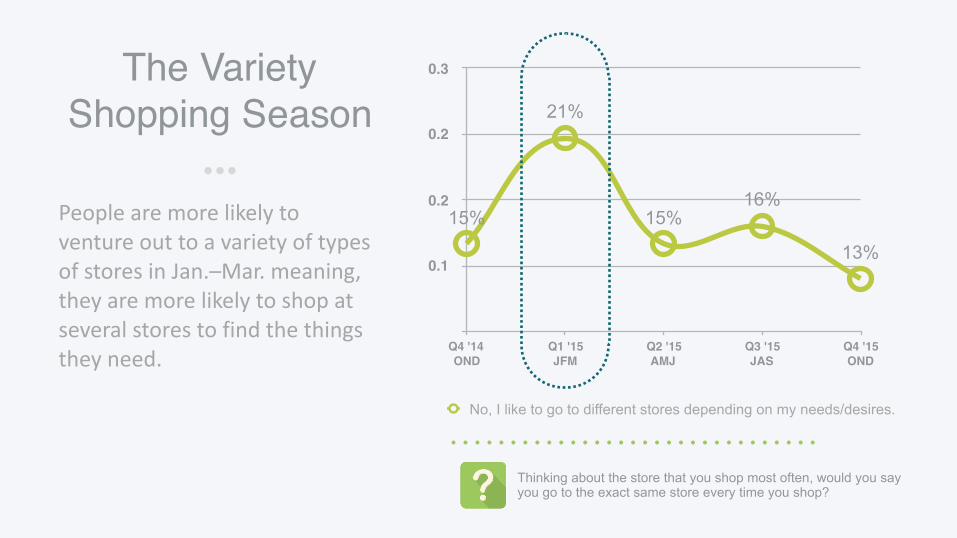
People are more likely to venture out to a variety of types of stores in Jan.–Mar. meaning, they are more likely to shop at several stores to find the things they need.
The Variety Shopping Season
0.1
0.2
0.2
0.3
Q4 '14OND
Q1 '15JFM
Q2 '15AMJ
Q3 '15JAS
Q4 '15OND
15%
21%
15%16%
13%
No, I like to go to different stores depending on my needs/desires.
Thinking about the store that you shop most often, would you say you go to the exact same store every time you shop?
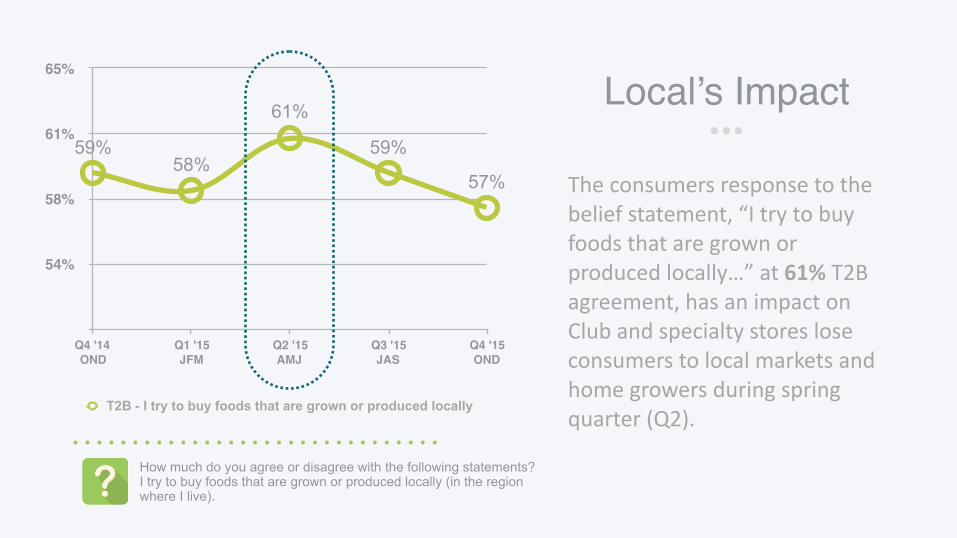
The consumers response to the belief statement, “I try to buy foods that are grown or produced locally…” at 61% T2B agreement, has an impact on Club and specialty stores lose consumers to local markets and home growers during spring quarter (Q2).
Local’s Impact
54%
58%
61%
65%
Q4 '14OND
Q1 '15JFM
Q2 '15AMJ
Q3 '15JAS
Q4 '15OND
59%58%
61%
59%
57%
T2B - I try to buy foods that are grown or produced locally
How much do you agree or disagree with the following statements? I try to buy foods that are grown or produced locally (in the region where I live).
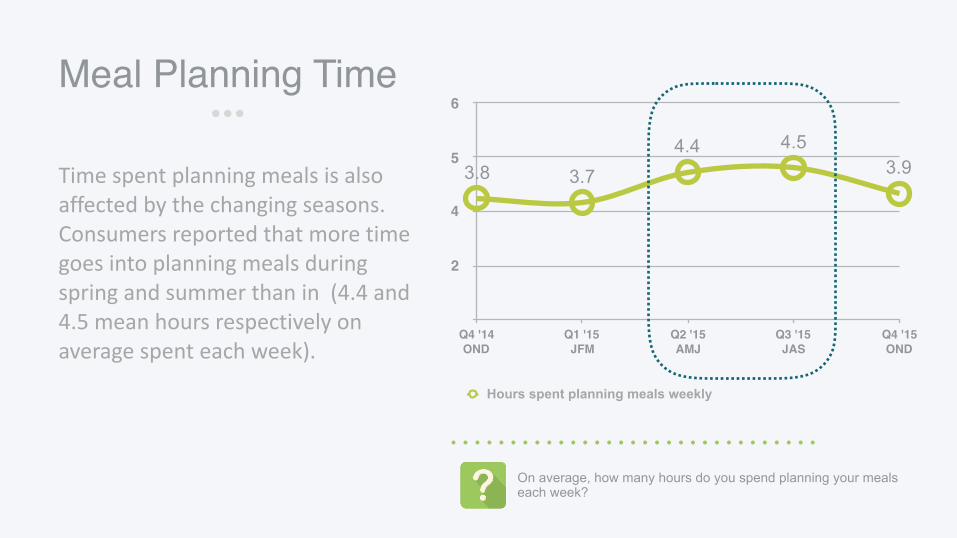
Time spent planning meals is also affected by the changing seasons. Consumers reported that more time goes into planning meals during spring and summer than in (4.4 and 4.5 mean hours respectively on average spent each week).
Meal Planning Time
2
4
5
6
Q4 '14OND
Q1 '15JFM
Q2 '15AMJ
Q3 '15JAS
Q4 '15OND
3.8 3.74.4 4.5
3.9
Hours spent planning meals weekly
On average, how many hours do you spend planning your meals each week?

thank you.Contact: Jeff Dattilo Email: [email protected]