Embed Size (px)
Citation preview
Carbohydrates and Health
2015
Carbohydrates and Health
Scientific Advisory Committee on Nutrition
2015
London: TSO
Published by TSO (The Stationery Office) and available from:
Online www.tsoshop.co.uk
Mail, Telephone, Fax & E-mail TSO PO Box 29, Norwich, NR3 1GN Telephone orders/General enquiries: 0870 600 5522 Fax orders: 0870 600 5533 E-mail: [email protected] Textphone: 0870 240 3701
TSO@Blackwell and other Accredited Agents Customers can also order publications from: TSO Ireland 16 Arthur Street, Belfast BT1 4GD Tel: 028 9023 8451 Fax: 028 9023 5401
© Crown copyright 2015
Published for Public Health England under licence from the Controller of Her Majesty’s Stationery Office
ISBN: 978 0 11 708284 7
Printed in the UK by The Stationery Office Limited
Preface
Dietary carbohydrates and their role in health were last considered by the Committee on the Medical Aspects of Food Policy in reports published in the 1980s and 1990s. Since then, considerable evidence has emerged on the role of carbohydrates in cardio-metabolic, colo-rectal and oral health. The present report details the evidence SACN has considered and the approach SACN has taken to reviewing the relationships between dietary carbohydrates and health. The evidence was assessed using the SACN Framework for the Evaluation of Evidence and graded according to a system developed specifically for this review. SACN commissioned systematic reviews of the evidence on cardio-metabolic, colo-rectal and oral health to inform this report and this is the first time the committee has taken that approach. The findings of the systematic reviews have been used to inform the very detailed main body of the text which thereby provides a comprehensive and transparent account of the evidence and how SACN drew its conclusions.
As a result of its deliberations, SACN is now recommending that a new definition of dietary fibre be adopted in the UK and that a definition of ‘free sugars’ be used in nutrition advice in place of ‘non-milk extrinsic sugars’. Following careful consideration of the evidence, SACN is also recommending that the dietary reference value for carbohydrates be maintained at a population average of approximately 50% of total dietary energy intake and that the dietary reference value for dietary fibre for adults should be increased to 30g/day. Furthermore, SACN is recommending that population average intake of free sugars should not exceed 5% of total dietary energy. This advice, that people’s intake of ‘free sugars’ should be lower than that currently recommended for non-milk extrinsic sugars, is based on SACN’s assessment of evidence on the effect of free sugars on the risk of dental caries and on total energy intake. A higher sugars intake increases the risk of higher energy intakes - the higher the consumption of sugars, the more likely people are to exceed their estimated average requirement (EAR) for energy. Therefore, if intakes of free sugars are lowered, the more likely it is that the EAR for energy will not be exceeded, and this could go some way to addressing the significant public health problem of obesity.
I would like to thank those who provided comments on the draft version of this report during the public consultation. All the comments were carefully considered before the report was finalised. The process assisted the Committee in refining the text and its approach to making recommendations.
This has been a challenging and large undertaking for SACN and I would like to thank the Carbohydrates Working Group, particularly the Chair, Professor Ian Macdonald, and the Secretariat for their great commitment in producing this report. Particular thanks also go to those in the Nutritional Epidemiology Group at the University of Leeds who
iii

performed the systematic review on cardio-metabolic health and the update search, and to Dr Peter Sanderson who performed the colo-rectal health and oral health systematic reviews; they thereby made substantial contributions to this report.
Dr Ann Prentice Chair of the Scientific Advisory Committee on Nutrition
iv
Contents
Membership of Scientific Advisory Committee on Nutrition: Carbohydrates Working Group ix
Membership of Scientific Advisory Committee on Nutrition xi
Summary 1 Background to this review 1 Terms of reference 1 Methodology 2 Conclusions and recommendations 2
1 Introduction and methods 7 Background 7 Terms of Reference 7 Methodology 7 Interpretation of studies 8
2 Classification, biochemistry, absorption, metabolism and definitions of carbohydrates 10 Chemical classification 11 Digestion and absorption 13 Metabolism 14 Definitions used in different dietary recommendations 17 A comparison of the previous UK dietary reference values for carbohydrate with dietary recommendations from other international authorities 20
3 Dietary sources and intakes of carbohydrates 23
4 Background on health outcomes (disease prevention) 30 Cardiovascular disease 30 Obesity 30 Type 2 diabetes mellitus 31 Colo-rectal health 31 Oral health 33 Markers and measures and their related health outcomes 34
5 Total carbohydrates 36 Adults 37 Cardiovascular disease events 37 Coronary events 38 Stroke 38 Vascular function 39 Blood pressure 39 Fasting blood lipids 43 Type 2 diabetes mellitus 56 Glycaemia and insulinaemia 57 Obesity 64
v
Colo-rectal health 70 Children and adolescents 71 Body mass index and body fatness 71 Outcomes where there is insufficient or inconsistent evidence 72 Summary and conclusions 74
6 Sugars and sugars-sweetened foods and beverages 76 Adults 76 Sugars 76 Individual sugars 82 Sugars-sweetened beverages 83 Children and adolescents 85 Body mass index and body fatness 85 Oral health 88 Outcomes where there is insufficient evidence 92 Summary and conclusions 94
7 Starch and starch-rich foods 97 Adults 97 Starch 97 Starch-rich foods 98 Outcomes where there is insufficient or inconsistent evidence 101 Summary and conclusions 102
8 Dietary fibre 104 Adults 104 Dietary fibre 104 Insoluble fibre 111 Soluble fibre 112 Fruit fibre 114 Vegetable fibre 115 Fruit and vegetable fibre 117 Legume fibre 118 Legume intake 119 Cereal fibre 120 Higher dietary fibre breakfast cereals 131 Whole grain bread 132 Total cereals 133 Whole grains 133 Children and adolescents 139 Body fatness and fat distribution 140 Outcomes where there is insufficient or inconsistent evidence 140 Summary and conclusions 143
9 Non-digestible oligosaccharides, resistant starch, polyols and polydextrose 145 Adults 146 Non-digestible oligosaccharides 146 Resistant starch 154 Polyols 157
vi
Polydextrose 158 Infants, children and adolescents 160 Non-digestible oligosaccharides 160 Polyols 163 Outcomes where there is insufficient or inconsistent evidence 164 Summary and Conclusions 165
10 Glycaemic index and glycaemic load 167 Glycaemic index 168 Glycaemic load 174 Outcomes where there is insufficient or inconsistent evidence 178 Summary and conclusions 179
11 Dietary recommendations 181 Total carbohydrate 181 Sugars 181 Dietary fibre 185
12 Overall summary and conclusions 191 Approach taken in the consideration of the evidence 191 Total dietary carbohydrate 192 Sugars and sugars-sweetened foods and beverages 192 Starch and starch-rich foods 194 Dietary fibre 194 Glycaemic index and glycaemic load 195 Dietary carbohydrate recommendations 196
Annexes
1 Cardio-metabolic, colo-rectal and oral heath systematic reviews, additional meta-analyses and update search 201
2 Summary of review methodology 202 Data analysis 203 Grading system for judging the evidence 204 Upgrading criteria 207 Concluding statements for judging the strength of the evidence 207
3 Commentary on the evidence on fructose and health 209
4 Dietary acids and tooth wear (including dental erosion) 212 Introduction 212 Prospective cohort studies 213 Randomised controlled trials 217 Risk of bias assessment 222 Results 226 Summary and conclusions 232
vii
5 Fibre isolates 233 Psyllium 233 Pectin 235 Cellulose 236 Mixed isolated fibres 236 Outcomes where there is insufficient or inconsistent evidence 242 Summary and conclusions 243
6 Abbreviations 244
7 Carbohydrate intake in pregnancy in relation to birth weight and cardio-metabolic health outcomes 246 Introduction 246 Birth weight 246 Gestational diabetes mellitus 249 Outcomes where there is insufficient evidence 252 Summary and conclusions 253
8 Dietary sources and intakes of carbohydrates 254
9 Meta-analysis and meta-regression of trials that presented evidence on diets differing in the proportion of sugars in relation to total dietary energy intake 300
References 305
viii
Membership of Scientific Advisory Committee on Nutrition: Carbohydrates Working Group
Chair Prof. Ian Macdonald SACN member;
Prof. of Metabolic Physiology at the University of Nottingham and Director of Research in the Faculty of Medicine and Health Sciences.
Members Prof. Annie Anderson (until May 2011)
SACN member; Prof. of Food Choice, Centre for Public Health Nutrition Research, University of Dundee.
Dr Mark Beattie (September 2010 to September 2011)
External expert; Consultant Paediatric Gastroenterologist and Honorary Senior Lecturer, Southampton General Hospital.
Alison Eastwood (March 2009 to November 2011)
External expert; Reviews Manager, Centre for Reviews and Dissemination, University of York.
Christine Gratus (until April 2013)
SACN member, lay representative; Retired advertising and marketing research director.
Prof. Alan Jackson (until May 2010)
SACN member; Prof. of Human Nutrition, University of Southampton.
Prof. Ian Johnson (since Mar 2009)
External expert; Expert in diet and colo-rectal health and disease, Institute of Food Research.
Prof. Timothy Key SACN member; Prof. in Epidemiology and Deputy Director of Cancer Epidemiology Unit, University of Oxford.
Prof. Julie Lovegrove (since September 2010)
SACN member; Prof. of Human Nutrition, Head of the Hugh Sinclair Unit of Human Nutrition & Deputy Director of the Institute for Cardiovascular and Metabolic Research, University of Reading.
ix
Dr David Mela SACN member, industry representative; Science Leader, Unilever R&D Vlaardingen, The Netherlands.
Prof. Angus Walls SACN member; (since January 2010) Prof. of Restorative Dentistry and Director of the
Edinburgh Dental Institute.
Prof. Ian Young SACN member; (since September 2010) Pr of. of Medicine, Queen’s University Belfast.
External Consultants Dr Peter Sanderson (until March 2012)
Dr Victoria Burley, University of Leeds
Dr Charlotte Evans, University of Leeds
Dr Darren Greenwood, University of Leeds
Diane Threapleton, University of Leeds
Secretariat Dr Alison Tedstone (Scientific)
Dr Vivien Lund (Scientific)
Dr Peter Sanderson (Scientific) (from January 2014)
Vicki Pyne (Scientific)
Jennifer Lynas (Scientific)
Heiko Stolte (Scientific)
Dr Sheela Reddy (Scientific)
Dr Elaine Stone (Scientific)
Rachel Marklew (Scientific)
Dr Marie-Ann Ha (Scientific)
Emma Peacock (Scientific)
Verity Kirkpatrick (Scientific)
Observers Dr Gillian Purdon (Food Standards Agency Scotland)
x
Membership of Scientific Advisory Committee on Nutrition
Chair Dr Ann Prentice Director, MRC Human Nutrition Research, (chair since June 2010) Cambridge.
Prof. Alan Jackson Prof. of Human Nutrition, University of (until June 2010) Southampton.
Members Prof. Peter Aggett Honorary Prof., School of Medicine and Health,
Lancaster University, and Emeritus Prof. and Past Head of School of Postgraduate Medicine and Health.
Prof. Annie Anderson Prof. of Food Choice, Centre for Public Health (until February 2011) Nutrition Research, University of Dundee.
Late Prof. Sheila Bingham Formerly Director, Medical Research Council’s (until March 2009) Dunn Human Nutrition Unit, Cambridge.
Prof. John Cummings Prof. in Experimental Gastroenterology, (until July 2007) Department of Pathology and Neuroscience,
University of Dundee.
Gill Fine Public Health Nutritionist. (since October 2011)
Christine Gratus Lay representative; Retired advertising and (until March 2013) marketing research director.
Prof. Paul Haggarty Head of Lifelong Health, Rowett Institute of Nutrition and Health, University of Aberdeen.
Prof. Timothy Key Prof. in Epidemiology and Deputy Director of Cancer Epidemiology Unit, University of Oxford.
Prof. Peter Kopelman Principal, St George’s, University of London. (until November 2010)
Prof. Susan Lanham-New Head of the Nutritional Sciences Division, (since February 2010) University of Surrey.
Prof. Julie Lovegrove Prof. of Human Nutrition, Head of the Hugh (since February 2010) Sinclair Unit of Human Nutrition and Deputy
Director of the Institute for Cardiovascular and Metabolic Research, University of Reading.
xi
Prof. Ian Macdonald Prof. of Metabolic Physiology at the University of Nottingham and Director of Research in the Faculty of Medicine and Health Sciences.
Prof. Harry McArdle Professor of Biomedical Sciences, Rowett (since February 2010) Institut e of Nutrition and Health, University of
Aberdeen.
Dr David Mela Industry r epresentative; Science Leader, Unilever R&D Vlaardingen, The Netherlands.
Gemma Paramor Lay representative; Finance professional in (since May 2013) accounting and fund management.
Prof. Hilary Powers Prof. of Nutritional Biochemistry and Head of (since February 2010) Human Nutrition Unit, Univ ersity of Sheffield.
Prof. Monique Raats Director of the Food, Consumer Behaviour and (since August 2011) Health Research Centre, University of Surrey.
Dr Anita Thomas Consultant Physician in Acute Medicine, (until February 2011) Plymouth Hospitals NHS Trust.
Prof. Angus Walls Prof. of Restorative Dentistry and Director of the (since February 2010) Edinburgh Dental Institute.
Dr Stella M Walsh Consumer representative.
Dr Anthony F Williams F ormerly, Reader in Child Nutrition and Consultant in Neonatal Paediatrics, St George’s, University of London.
Christine Williams Head of School of Food Biosciences and Prof. of (until July 2007) Human Nutrition, University of Reading.
Prof. Ian Young Prof. of Medicine, Queen’s University Belfast. (since July 2010)
Secretariat Dr Alison Tedstone (Scientific)
Dr Louis Levy (Scientific)
Dr Vivien Lund (Scientific)
Rachel Elsom (Scientific)
Mamta Singh (Scientific)
Emma Peacock (Scientific)
Vicki Pyne (Scientific)
Rachel White (Scientific)
Michael Griffin (Administrative)
xii

Jennifer Lynas (Scientific)
Heiko Stolte (Scientific)
Dr Sheela Reddy (Scientific)
Dr Elaine Stone (Scientific)
Rachel Marklew (Scientific)
Lynda Harrop (Scientific)
Observers Ruth Balmer (Food Standards Agency Northern Ireland)
Dr Naresh Chada (Department of Health, Social Services and Public Safety, Northern Ireland)
Maureen Howell (The Welsh Assembly)
Sarah Rowles (The Welsh Assembly)
Anne Milne (Food Standards Agency Scotland)
xiii
Summary
S.1 Carbohydrates are a major source of energy in the diet. Classified according to their chemistry, carbohydrates can be divided into sugars (monosaccharides and disaccharides), polyols, oligosaccharides (malto-oligosaccharides and non-digestible oligosaccharides) and polysaccharides (starch and non-starch polysaccharides). However, this classification does not allow a simple translation into nutritional effects since each class of carbohydrates has overlapping physiological properties and effects on health. Carbohydrates can also be classified according to their digestion and absorption in the human small intestine. Digestible carbohydrates are absorbed and digested in the small intestine; non-digestible carbohydrates are resistant to hydrolysis in the small intestine and reach the large intestine where they are at least partially fermented by the commensal bacteria present in the colon. There is no universal definition of the term ‘dietary fibre’; broadly speaking, it refers to some or all of the constituents of non-digestible carbohydrates and may also include other quantitatively minor components (e.g. lignin) that are associated with non-digestible carbohydrates in plant cell walls.
Background to this review S.2 Dietary carbohydrates and their role in health were last considered by the
Committee on the Medical Aspects of Food Policy (COMA) in reports published in the 1980s and 1990s. Since then, considerable evidence has emerged on the role of carbohydrates in cardio-metabolic, colo-rectal and oral health. In 2008, the Food Standards Agency and the Department of Health asked SACN to provide clarification of the relationship between dietary carbohydrates and health and to make public health recommendations. This report was prepared in response to this request.
Terms of reference S.3 The terms of reference of the carbohydrates working group were to review:
• the evidence on dietary carbohydrate and colo-rectal health in adults (including colo-rectal cancer, irritable bowel syndrome, constipation) and in childhood and infancy;
• the evidence on dietary carbohydrate and cardio-metabolic health (including cardiovascular disease, insulin resistance, glycaemic response and obesity);
• the evidence on dietary carbohydrates and oral health;
• the terminology, classification and definitions of types of carbohydrates in the diet.
1
Methodology S.4 Only evidence from prospective cohort studies and randomised controlled trials
was considered for this report. SACN commissioned systematic reviews of the evidence on cardio-metabolic, colo-rectal and oral health in literature published from 1990 up to and including December 2009, November 2010 and January 2011 respectively. In order to ensure that the evidence base was as current as possible while SACN was undertaking this review, the literature searches were subsequently updated for studies on important health outcomes published up to June 2012. The evidence was assessed using the SACN Framework for the Evaluation of Evidence and graded according to a system devised specifically for this review.
S.5 SACN has evaluated evidence assessing whether intakes of specific carbohydrates are a factor in the risk for cardiovascular disease, obesity, type 2 diabetes mellitus and colo-rectal cancers. The relationship between dietary carbohydrate intake and a large number of risk factors and markers related to these diseases has been considered. Evidence on the relationship of carbohydrates to oral health has also been discussed. For many of the risk factors and disease markers identified, there was insufficient evidence of the required quality, therefore SACN has based its recommendations on those conclusions where the committee considered the evidence base to be of sufficient standard according to the SACN Framework for the Evaluation of Evidence and the grading system developed for this review.
S.6 In this report, evidence has been considered under the broad headings of total carbohydrates; sugars and sugars-sweetened foods and beverages; starch and starch-rich foods; dietary fibre; non-digestible oligosaccharides, resistant starch, polyols and polydextrose; and the glycaemic characteristics of carbohydrate-rich foods and diets (glycaemic index and glycaemic load). The individual chapters provide extensive detail on the evidence considered for each type of carbohydrate in relation to health outcomes, SACN’s view of the strength of the evidence and its conclusions.
Conclusions and recommendations S.7 The main findings of this review of the evidence on carbohydrates and health,
upon which SACN has based its recommendations, are set out below. The report provides a detailed consideration of all the evidence considered by SACN.
Total dietary carbohydrate S.8 Overall, the evidence from both prospective cohort studies and randomised
controlled trials indicates that total carbohydrate intake appears to be neither detrimental nor beneficial to cardio-metabolic health, colo-rectal health and oral health. However, this report highlights that there are specific components or sources of carbohydrates which are associated with other beneficial or detrimental health effects. The hypothesis that diets higher in total carbohydrate cause weight gain is not supported by the evidence from randomised controlled trials considered in this review.
2
Sugars and sugars-sweetened foods and beverages S.9 Prospective cohort studies indicate that higher consumption of sugars and sugars-
containing foods and beverages is associated with a greater risk of dental caries. Prospective cohort studies indicate that greater consumption of sugars-sweetened beverages is associated with increased risk of type 2 diabetes mellitus. Randomised controlled trials conducted in adults indicate that increasing or decreasing the percentage of total dietary energy as sugars when consuming an ad libitum diet leads to a corresponding increase or decrease in energy intake. Reduction in the percentage of dietary energy as sugars was achieved in these trials either through the substitution of other macronutrient components or by replacing sugars with non-caloric sweeteners. Randomised controlled trials conducted in children and adolescents indicate that consumption of sugars-sweetened beverages, as compared with non-calorically sweetened beverages, results in greater weight gain and increases in body mass index.
Starch and starch-rich foods S.10 Prospective cohort studies suggest there is no association between total starch
intake and incidence of coronary events or type 2 diabetes mellitus or between the intake of refined grains and risk of type 2 diabetes mellitus. Consumption of brown rice is associated with a reduction in risk of type 2 diabetes mellitus, but the evidence is limited to a small number of studies. Prospective cohort studies indicate an association between greater consumption of white rice and increased risk of type 2 diabetes mellitus in Asian populations (in Japan and China) consuming amounts of white rice that are not generally achieved in the UK. It is therefore uncertain whether this detrimental association is relevant to the whole UK population. A small number of studies suggest that higher consumption of potatoes is associated with a risk of type 2 diabetes mellitus, but it is not possible to exclude confounding by other dietary variables e.g. cooking methods for potatoes such as frying. There is insufficient evidence to draw a conclusion on the association between starch intake and weight gain.
Dietary fibre S.11 There is strong evidence from prospective cohort studies that increased intakes of
total dietary fibre, and particularly cereal fibre and wholegrain, as they are classified in this report, are associated with a lower risk of cardio-metabolic disease and colo-rectal cancer. Randomised controlled trials indicate that total dietary fibre, wheat fibre and other cereal fibres, as they are classified in this report, increase faecal mass and decrease intestinal transit times. Randomised controlled trials also indicate that higher intake of oat bran and isolated β-glucans leads to lower total cholesterol, LDL cholesterol and triacylglycerol concentrations and lower blood pressure.
Non-digestible oligosaccharides, resistant starch, polyols and polydextrose
S.12 In this report there is evidence to show that non-digestible oligosaccharides, resistant starch, polyols and polydextrose increase faecal mass. SACN concluded
3
that whilst there is evidence of potentially beneficial effects of these compounds on physiological parameters the health benefits relating to the consumption of these specific compounds is uncertain.
Glycaemic index and glycaemic load S.13 Prospective cohort studies indicate that diets with a higher glycaemic index or
glycaemic load are associated with a greater risk of type 2 diabetes mellitus. Limited evidence from cohort studies and randomised controlled trials suggests that there may also be other adverse health effects. However, higher and lower glycaemic index/glycaemic load diets will, in most cases, differ in many ways other than the carbohydrate fraction and therefore study results are difficult to interpret as it is not possible to exclude confounding by other dietary variables.
Dietary carbohydrate recommendations for ages 2 years and above S.14 SACN’s recommendations are set out below; the reasoning behind them is
described, in full, in the report.
S.15 The dietary recommendations for total carbohydrate, free sugars, starch and sugars contained within the cellular structure of food, and milk sugars have been proposed in the context of an energy intake which is appropriate to maintain a healthy weight (SACN, 2011).
S.16 It is recommended that the dietary reference value for total carbohydrate should be maintained at an average population intake of approximately 50% of total dietary energy.1
S.17 It is recommended that the definition for ‘free sugars’ be adopted in the UK. This comprises all monosaccharides and disaccharides added to foods by the manufacturer, cook or consumer, plus sugars naturally present in honey, syrups and unsweetened fruit juices. Under this definition lactose when naturally present in milk and milk products is excluded.
S.18 It is recommended that the average population intake of free sugars should not exceed 5% of total dietary energy for age groups from 2 years upwards.
S.19 With the proposed reduction in the population intake of free sugars, their contribution toward recommended total carbohydrate intake should be replaced by starches, sugars contained within the cellular structure of foods and, for those who consume dairy products, by lactose naturally present in milk and milk products. The complete replacement of energy derived from free sugars by these carbohydrate sources would only apply to those people who are a healthy BMI and in energy balance. In those who are overweight, the reduction of free sugars would be part of a strategy to decrease energy intake.
S.20 It is recommended that the consumption of sugars-sweetened beverages should be minimised in children and adults.
1 The previous recommendation for total carbohydrate was 47% of daily total dietary energy intake or 50% of food energy (excluding alcohol) (COMA, 1991).
4
S.21 It is recommended that dietary fibre should be defined as all carbohydrates that are neither digested nor absorbed in the small intestine and have a degree of polymerisation of three or more monomeric units, plus lignin. For extracted natural carbohydrate components or synthetic carbohydrate products to be defined as dietary fibre, beneficial physiological effects, similar to those demonstrated for the naturally integrated dietary fibre component of foods, must be demonstrated by accepted scientific evidence. Dietary fibre is to be chemically determined using the prevailing AOAC methods agreed by regulatory authorities.
S.22 It is recommended that the dietary reference value for the average population intake of dietary fibre for adults should be 30g/day, as defined in the paragraph above and measured using the AOAC methods agreed by regulatory authorities. The previous dietary reference value of 18g/day of non-starch polysaccharides, defined by the Englyst method, equates to about 23-24 g/day of dietary fibre if analysed using these AOAC methods, thus the new recommendation represents an increase from this current value.
S.23 It is recommended that the average population intake of dietary fibre for children aged 2 to 5 years should approximate 15g/day, for children aged 5 to 11 years 20g/day, for children aged 11 to 16 years 25 g/day and for adolescents aged 16 to 18 years about 30g/day.
S.24 Most of the evidence for the wide range of health benefits of fibre comes from studies where the exposure reflects dietary fibre intakes achieved through a variety of foods where it is present as a naturally integrated component. There is evidence to show that particular extracted and isolated fibres have positive effects on blood lipids and colorectal function but due to the smaller evidence base, it is not known whether these components confer the full range of health benefits associated with the consumption of a mix of dietary fibre rich foods. Therefore, it is recommended that fibre intakes should be achieved through a variety of food sources.
S.25 No quantitative recommendations are made for children aged under 2 years, due to the absence of information, but from about six months of age, gradual diversification of the diet to provide increasing amounts of whole grains, pulses, fruits and vegetables is encouraged.
Recommended dietary pattern in relation to carbohydrates S.26 The National Diet and Nutrition Survey shows that mean intakes of total
carbohydrate meet, or are close to, the levels recommended by COMA in 1991 but that the population overall consumes more than the recommended amount of sugars and less than the recommended amount of dietary fibre. With the proposed increase in the dietary reference value for fibre and the new lower recommendation for free sugars, the difference between recommended intakes and current dietary intakes of the population would become greater for both. In order to address this imbalance, there needs to be a change in the population’s diet so that people derive a greater proportion of total dietary energy from foods
5
that are lower in free sugars and higher in dietary fibre whilst continuing to derive approximately 50% of total dietary energy from carbohydrates.
S.27 Evidence considered in this report shows that increasing sugars intake leads to a corresponding increase in energy intake. For overweight individuals, reducing the percentage energy intake from free sugars, in the absence of increased energy intake from other sources, could contribute to a reduction in total energy intake and result in weight loss. For individuals who are maintaining a healthy body weight, the reduced intake of energy from free sugars should be replaced by energy from starches, sugars contained within the cellular structure of foods and for those who consume dairy products, by lactose naturally present in milk and milk products. Reducing consumption of free sugars would help to lower the risk of dental caries in all individuals.
Research recommendations S.28 While discussing the evidence considered for this report, SACN noted gaps in
the evidence base relating carbohydrates to health; the committee has therefore made a number of recommendations for research which are set out in Chapter 12.
6
1 Introduction and methods
Background 1.1 Dietary carbohydrates and their role in health were last considered by the
Committee on Medical Aspects of Food Policy (COMA, the predecessor of the Scientific Advisory Committee on Nutrition) in the following reports: Sugars and Human Disease (COMA, 1989), Dietary Reference Values for Food Energy and Nutrients for the United Kingdom (COMA, 1991) and Nutritional Aspects of Cardiovascular Disease (COMA, 1994). Considerable evidence has emerged since these reports were published, particularly in the areas of cardio-metabolic, colo-rectal and oral health. It was therefore considered important to review the literature on carbohydrate intake in relation to these health outcomes and to ensure that the dietary reference values reflect the current evidence base.
Terms of Reference 1.2 The Scientific Advisory Committee on Nutrition (SACN) was requested by the
Food Standards Agency and the Department of Health to provide clarification of the relationship between dietary carbohydrate and health and make public health recommendations. To achieve this they were asked to review:
• The evidence for the role of dietary carbohydrate in colo-rectal health in adults (including colo-rectal cancer, irritable bowel syndrome, constipation) and in childhood and infancy.
• The evidence on dietary carbohydrate and cardio-metabolic health (including cardiovascular disease, insulin resistance, glycaemic response and obesity).
• The evidence in respect to dietary carbohydrates and oral health.
• The terminology, classification and definitions of types of carbohydrates in the diet.
Methodology 1.3 Due to the wealth of data available and because of the concerns around their
limitations, case-control, cross-sectional and ecological studies were not considered. Only prospective cohort studies and randomised controlled trials were considered for this report. Evidence on adverse effects of very high intakes of specific carbohydrates, e.g. gastrointestinal symptoms, was not part of the remit of this report.
1.4 Systematic reviews on cardio-metabolic, colo-rectal and oral health in relation to carbohydrates and food sources of carbohydrates were commissioned to inform this report (see Annex 1 for individual systematic reviews). These were based on literature published through December 2009, November 2010 and January 2011, respectively. The search strategy and inclusion and exclusion criteria are described
7
in the relevant systematic reviews and the cardio-metabolic health protocol in Annex 1.
1.5 Due to the cut-off dates used in the systematic reviews, there was concern that the evidence base would be incomplete (out of date) when the report was published. Therefore an updated literature search was performed using the search terms provided in the individual reviews from January 2010 (cardio-metabolic health), December 2010 (colo-rectal health review) and February 2011 (oral health review) up to June 2012. The same inclusion and exclusion criteria as detailed in the individual reviews were used to identify relevant articles; however, the update search was not a systematic review. After this cut-off date, additional studies were considered only if they were thought potentially to impact on, or inform, the conclusions drawn in this report.
1.6 More than two hundred prospective cohort studies and more than four hundred randomised controlled trials have been considered in this report. For the individual systematic reviews and the update search see Annex 1. A supplementary review of carbohydrate intake during pregnancy in relation to birth weight and cardio-metabolic health outcomes was conducted and is reported in Annex 7.
1.7 The evidence was assessed using the SACN framework for the evaluation of evidence (SACN, 2012) and graded according to the system described in Annex 2. This system was devised specifically for grading the evidence included in this report.
Interpretation of studies 1.8 With cohort studies there is substantial potential for biases and the possibility of
confounding by factors that correlate with both the exposure and the outcome (residual confounding) and any associations must be interpreted with caution. As a range of dietary and lifestyle factors may be associated with the health outcome considered, it is possible that an indicated association could be due to an unidentified factor that correlates with the studied factor. The dietary assessment methods used in cohort studies are potentially subject to measurement error due to the inability to estimate portion sizes, under- and over-reporting of food items, and inherent limitations in the quality and completeness of food nutrient databases. A further issue is that the quality of the dietary assessment varies between studies, with some studies only making a single assessment before following up a health outcome many years later. Overall, this can affect the ability of studies to observe an association as well as affecting the magnitude of an indicated association with a dietary factor, e.g. under-reporting would diminish any indicated association with that dietary factor. Another consideration is that the definitions used in cohort studies to characterise and quantify a specific dietary exposure, e.g. ‘whole grains’, may vary between studies.
1.9 Dietary intake is difficult to measure, and any single method cannot assess dietary exposure perfectly (Shim et al., 2014). Twenty four hour recalls, dietary history, and food frequency questionnaires are subjective estimates and there are intrinsic problems related to self-reporting. Food frequency questionnaires are widely
8
used as the primary dietary assessment tool in epidemiological studies, although substantial measurement error may exist. While food frequency questionnaires are generally validated against other methods of assessment, validity is an issue of degree rather than a dichotomy and a perfect standard for comparison is rarely available (Freedman et al., 2007; Willett & Hu, 2007). Considerable efforts to improve the accuracy and feasibility of large epidemiological studies are still on going and a combination of subjective estimates with dietary biomarker measures may provide more accurate estimates of dietary intakes than that of individual methods. Any errors in dietary assessments generally inflate variance in a random rather than directional way and (in contrast to confounders) tend to obscure rather than generate observation of diet-outcome relationships. Thus, where relationships are observed it is in spite of rather than due to the difficulty of measuring actual food intakes.
1.10 The development of dietary biomarkers, which are able to objectively assess dietary consumption (or exposure) without the bias of self-reported dietary intake errors would improve dietary intake assessment (Hedrick et al., 2012). Biomarkers of sugars intake and dietary fibre intake, in particular, are needed to support existing dietary recommendations. In relation to carbohydrate exposures there are, as yet, no biomarkers of dietary exposure that are validated, reproducible and able to detect changes in intake over time that are suitable for the general population. There are several potential biomarkers of carbohydrate exposure currently being investigated, such as: 24-hour urinary sucrose (Tasevska et al., 2005; Joosen et al., 2008; Tasevska et al., 2009; Tasevska et al., 2011); carbon stable isotope biomarkers of sugar intake from corn and sugar cane (Jahren et al., 2014); and several studies have examined plasma alkylresorcinol and its metabolite concentrations as a possible whole grain wheat and rye intake biomarker (Landberg et al., 2008; Söderholm et al., 2009).
1.11 A general limitation with randomised controlled trials is that they investigate markers and risk factors, but not disease outcomes. Consideration of disease outcomes in relation to carbohydrate intake is, therefore, dependent on prospective cohort studies. Many of the trials included in this report involve mixed interventions that modify other dietary components, e.g. the proportion and type of fat or micronutrient content, and also involve energy restriction goals that result in weight loss, both of which could potentially affect the outcomes considered. This limits the conclusions that can be drawn; in particular this applies to the effect of variation in total carbohydrate intake and glycaemic index and glycaemic load on cardio-metabolic risk factors. A further limitation of some trials is that the dietary interventions vary greatly between trials examining a specific outcome and it is often not possible to consider dose-response effects; this is especially so with regard to trials varying total carbohydrate intake.
1.12 Where possible, the dose-response relationships between carbohydrate intakes and health outcomes has been considered and used to inform the dietary recommendations.
9
2 Classification, biochemistry, absorption, metabolism and definitions of carbohydrates
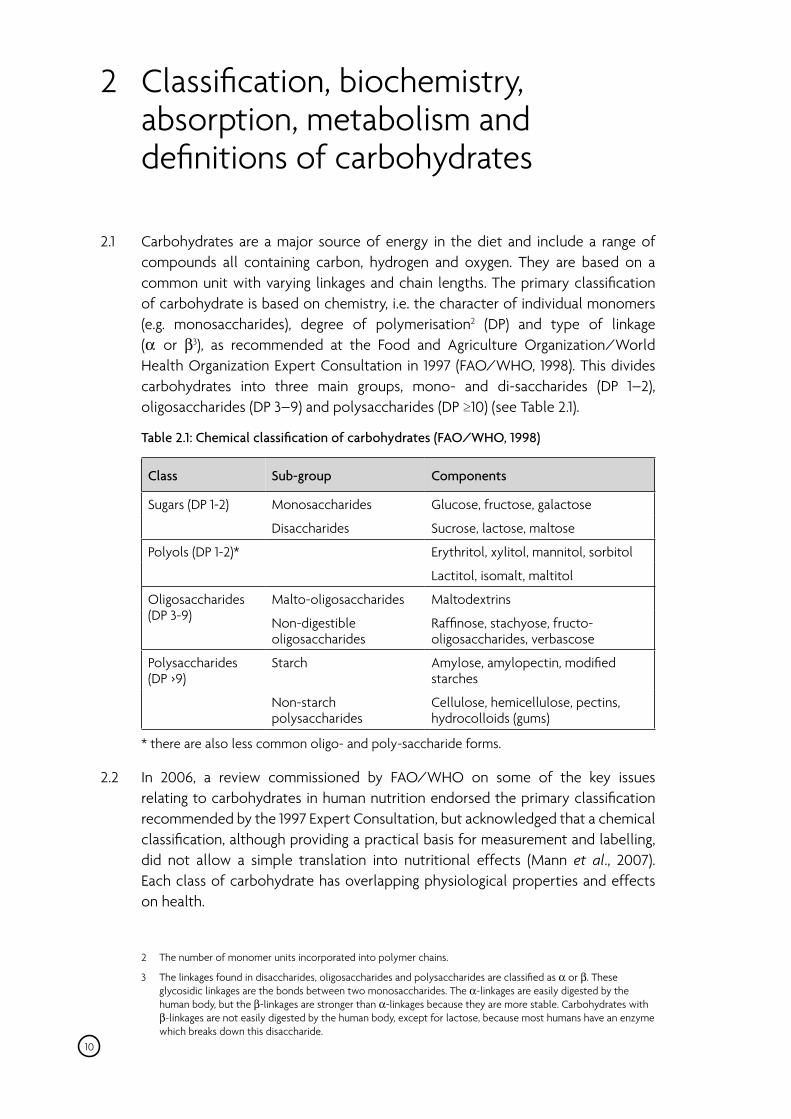
2.1 Carbohydrates are a major source of energy in the diet and include a range of compounds all containing carbon, hydrogen and oxygen. They are based on a common unit with varying linkages and chain lengths. The primary classification of carbohydrate is based on chemistry, i.e. the character of individual monomers (e.g. monosaccharides), degree of polymerisation2 (DP) and type of linkage (α or β3), as recommended at the Food and Agriculture Organization/World Health Organization Expert Consultation in 1997 (FAO/WHO, 1998). This divides carbohydrates into three main groups, mono- and di-saccharides (DP 1–2), oligosaccharides (DP 3–9) and polysaccharides (DP ≥10) (see Table 2.1).
Table 2.1: Chemical classification of carbohydrates (FAO/WHO, 1998)
Class Sub-group Components
Sugars (DP 1-2) Monosaccharides Glucose, fructose, galactose
Disaccharides Sucrose, lactose, maltose
Polyols (DP 1-2)* Erythritol, xylitol, mannitol, sorbitol
Lactitol, isomalt, maltitol
Oligosaccharides (DP 3-9)
Malto-oligosaccharides Maltodextrins
Non-digestible oligosaccharides
Raffinose, stachyose, fructo-oligosaccharides, verbascose
Polysaccharides (DP >9)
Starch Amylose, amylopectin, modified starches
Non-starch polysaccharides
Cellulose, hemicellulose, pectins, hydrocolloids (gums)
10
* there are also less common oligo- and poly-saccharide forms.
2.2 In 2006, a review commissioned by FAO/WHO on some of the key issues relating to carbohydrates in human nutrition endorsed the primary classification recommended by the 1997 Expert Consultation, but acknowledged that a chemical classification, although providing a practical basis for measurement and labelling, did not allow a simple translation into nutritional effects (Mann et al., 2007). Each class of carbohydrate has overlapping physiological properties and effects on health.
2 The number of monomer units incorporated into polymer chains.
3 The linkages found in disaccharides, oligosaccharides and polysaccharides are classified as α or β. These glycosidic linkages are the bonds between two monosaccharides. The α-linkages are easily digested by the human body, but the β-linkages are stronger than α-linkages because they are more stable. Carbohydrates with β-linkages are not easily digested by the human body, except for lactose, because most humans have an enzyme which breaks down this disaccharide.
2.3 Carbohydrates can be classified based on their digestion and absorption in the small intestine rather than their chemical characteristics. Digestible carbohydrates are absorbed and digested in the small intestine; non-digestible carbohydrates are resistant to hydrolysis in the small intestine and reach the human large intestine where they are at least partially fermented by the commensal bacteria present in the colon. The term ‘dietary fibre’ refers to either some or all of the constituents of non-digestible carbohydrates and may also include other quantitatively minor components, e.g. lignin, that are associated with non-digestible carbohydrates in plant cell walls (see paragraphs 2.29 to 2.36 for a consideration of different dietary fibre definitions).
Chemical classification Sugars
2.4 The term ‘sugars’ conventionally describes mono- and di-saccharides. Pentoses are five-carbon sugars that occur in polymeric forms and are collectively known as pentosans. Xylose and arabinose are the constituents of pentosans present in the non-starch polysaccharides hemicelluloses and pectin (McNaught, 1997). The three principal hexoses (six-carbon sugars) are glucose, fructose and galactose, which are the building blocks of naturally occurring di-, oligo- and poly-saccharides. The hexose mannose is present in some plant polysaccharides collectively termed mannans and is present in hemicelluloses. Glucose is widely distributed in small amounts in fruits, plant juices and honey. Fructose is found in the free state alongside glucose in ripening fruits and honey. Sucrose is the predominant disaccharide occurring in the free form and is composed of the monosaccharides glucose and fructose. Galactose occurs in milk, in chemical combination with glucose as lactose, while the disaccharide maltose, derived from starch hydrolysis, comprises two glucose molecules (Cummings & Stephen, 2007).
Polyols 2.5 Polyols include hydrogenated mono- and disaccharides (‘sugar alcohols’) used
as sugar replacers, as well as hydrogenated oligo- and polysaccharides, e.g. hydrogenated starch hydrolysate and polyglycitol, respectively (Livesey, 2003). They are found naturally in some fruits and are made commercially by using aldose reductase to convert the aldehyde group of the glucose molecule to the alcohol (Cummings & Stephen, 2007). There is wide variation in the absorption of different polyols, ranging from almost complete absorption of erythritol, to partial absorption of sorbitol and almost complete lack of absorption of lactitol (Livesey, 2003). The metabolism of erythritol is, however, minimal and being poorly reabsorbed via the kidneys it is excreted in the urine. There is also a wide range in the colonic fermentation of polyols ranging from almost complete fermentation of lactitol, to almost complete lack of fermentation of erythritol (Livesey, 2003). This variation in availability for energy production leads to estimated caloric values ranging from almost 0 to about 3 kcal/g.
11
Oligosaccharides 2.6 Oligosaccharides include maltodextrins, which principally occur from the
hydrolysis of starch and are widely used in the food industry to modify the texture of food products. Maltodextrins are digested and absorbed in the small intestine. Oligosaccharides that are not digested and absorbed in the small intestine include raffinose, stachyose and verbascose, which are three, four and five sugar polymers respectively. In effect these are sucrose joined to varying numbers of galactose molecules and are found in a variety of plant seeds e.g. peas, beans and lentils. Other non-digestible oligosaccharides are inulin and fructo-oligosaccharides. These have saccharide backbones that are mainly composed of fructose (fructans) and are the storage carbohydrates in artichokes and chicory; small amounts of low molecular weight substances are found in wheat, rye, asparagus and members of the onion, leek and garlic family (Cummings & Stephen, 2007). The DP of inulin varies from 2-60 sugar units (Roberfroid, 1993).
2.7 Human milk contains more than 100 different oligosaccharides of great diversity of structure that are predominantly galactose containing (Bode, 2006). The principal oligosaccharide in human milk is lacto-N-tetraose. Total oligosaccharides in human milk are in the range 5.0–8.0 g/l, but only trace amounts are present in cow’s milk and these differ from those found in human milk (Ward et al., 2006). Human milk oligosaccharides, among other functions, may serve as substrates for colonic fermentation (Kunz et al., 1999; Bode, 2006). Small-chain non-digestible oligosaccharides, abundantly present in the early stage of lactation, are selectively fermented by specific strains of Bifidobacterium longum biovar, infantis (Ninonuevo & Lebrilla, 2009).
Polysaccharides 2.8 Starch is a high molecular weight polymer of glucose, and is the principal storage
carbohydrate in plants, and the principal carbohydrate in most diets. Starch is defined as α1-4 linked glucan (a polysaccharide of glucose monomers), which can have straight (amylose) or branched (amylopectin) chains. Amylopectin also has α1-6 glycosidic bonds to branched chains. (Elia & Cummings, 2007). Enzymes capable of catalysing the hydrolysis of starch (α-amylases) are produced in the salivary gland and the pancreas.
2.9 Non-starch polysaccharides are plant cell wall constituents and comprise all other polysaccharides in the diet. They are not digested or absorbed in the small intestine. Non-starch polysaccharides are the most diverse of all the carbohydrate groups and comprise a mixture of many molecular forms, of which cellulose, a straight chain β1–4-linked glucan (DP 103–106) is the most widely distributed (McNaught, 1997).
2.10 Other non-starch polysaccharides in common occurrence are the hemicelluloses and pentosans. Hemicellulose (e.g. arabinoxylan) contains a mixture of hexose and pentose sugars, often in highly branched chains. Common to all cell walls is pectin, which is primarily a galacturonic acid polymer, although 10–25% other sugars such as rhamnose, galactose and arabinose, may also be present as side chains.
12
β-glucans are a heterogeneous group of non-starch polysaccharides, consisting of D-glucose monomers linked by β-glycosidic bonds (Cummings & Stephen, 2007).
2.11 Plant gums and storage polysaccharides, e.g. gum Arabic, karaya (sterculia) and guar gum, plant mucilages, e.g. psyllium, and algal polysaccharides e.g. agar and carrageenan are all non-starch polysaccharides primarily found in manufactured foods, usually at low concentrations, as modifiers of texture or viscosity (Cummings & Stephen, 2007). Each sub-type comprises a diversity of naturally occurring and chemically modified molecular structures and weights, resulting in different properties.
Soluble and insoluble dietary fibre 2.12 The terms ‘soluble’ and ‘insoluble’ fibre arose out of the early chemistry of
non-starch polysaccharides, which showed that the fractional extraction of non-starch polysaccharides could be controlled by changing the pH of solutions. This divides non-starch polysaccharides into those which may have effects on glucose and lipid absorption from the small intestine (soluble) and those which are slowly and incompletely fermented in the colon and have more pronounced effects on bowel habit (insoluble) (Cummings & Stephen, 2007). The separation of soluble and insoluble fractions is very pH dependent, making the link with specific physiological properties less certain. Much insoluble fibre is completely fermented and not all soluble fibre has effects on glucose and lipid absorption; furthermore, the various forms of fibre exist together mostly in intact plant cell walls.
2.13 As the differentiation is method-dependent, and solubility does not always predict physiological effects, it has been proposed that the distinction between soluble and insoluble fibre should be phased out (FAO, 2003). The terms are, however, still widely used. The soluble fibres include pectin and β-glucans and the insoluble fibres include cellulose and hemicelluloses.
Digestion and absorption 2.14 Only glucose and galactose are actively absorbed in the human small intestine via
the sodium dependent transporter (SGLT1). Fructose is not actively absorbed, but is taken up via a specific facilitative transport pathway (Thorens & Mueckler, 2010).
2.15 Di-, oligo- and poly-saccharides must be hydrolysed to their component monosaccharides before being absorbed. Starch occurs in plants in the form of semi-crystalline granules that must be gelatinized by processing or cooking prior to digestion. The digestion of solubilised starch polysaccharides begins with salivary amylase, but this activity is much less important than that of pancreatic amylase in the small intestine. Amylase hydrolyses starch, with the primary end products being maltose, maltotriose, and α-dextrins, although some glucose is also produced. The products of α-amylase digestion are hydrolysed into their component monosaccharides by enzymes expressed on the brush border of the small intestinal cells, the most important of which are maltase, sucrase, isomaltase and lactase (FAO/WHO, 1998). Carbohydrates containing glycosidic linkages that are resistant to cleavage by the pancreatic and brush border enzymes, i.e.
13
non-digestible carbohydrates, are not hydrolysed in the small intestine and reach the human large intestine. There they may be fermented, to some degree, by the commensal bacteria which contain enzymes capable of hydrolysing the glycosidic linkages (Hawksworth et al., 1971).
2.16 Resistant starch is the sum of starch and products of starch digestion that are not absorbed in the small bowel (Englyst et al., 1992; Champ et al., 2003). While all unmodified starch, if solubilised, can be hydrolysed by pancreatic α-amylase, the rate and extent to which starch is broken down is altered by a number of physical and chemical properties of food. This has led to the classification of resistant starch into four types (Englyst et al., 1992):
• Physically inaccessible starch (RS1), such as occurs in whole, and partly milled grains, seeds, and legumes;
• Resistant starch granules (RS2), such as in raw potato, banana, and high amylose corn;
• Retrograded amylose (RS3), formed in foods such as cooked, cooled potato, bread, and cornflakes; and
• Chemically modified starch (RS4), which is commercially manufactured.
Metabolism 2.17 Carbohydrates are principally substrates for energy metabolism. The human body
is able to capture some of the chemical energy from carbohydrates through cellular metabolism, resulting in the generation of an intermediary chemical form, adenosine triphosphate. Hydrolysis of the terminal phosphate bond generates free energy, which can be used for cellular processes. Adenosine triphosphate is regenerated from adenosine diphosphate using the energy in food. The brain, nervous system and red blood cells have an obligatory requirement for glucose as an energy source.
2.18 Following absorption, monosaccharides are transported to the liver and from there to the systemic circulation. The plasma concentration of insulin increases immediately after the ingestion of glucose in the form of sugars or digestible starch. Cellular uptake is via a family of glucose transporters (GLUT), and in some tissues (adipose tissue, skeletal muscle) is insulin-dependent. Fructose uptake into tissues is not insulin-dependent. Intracellular glucose is metabolised via glycolysis following phosphorylation by hexokinase (all cells) and glucokinase (liver only). Hexokinase and phosphofructokinase catalyse early regulatory steps in glycolysis. Galactose and mannose are metabolised to glycolytic intermediates (glucose 6 phosphate and fructose 6 phosphate, respectively) and progress through glycolysis is, therefore, subject to regulation by phosphofructokinase. In the adipose tissue and muscle, fructose can also be converted to the glycolytic intermediate fructose 6 phosphate, although this is probably not quantitatively very important; fructose metabolism in the liver is not directly under the regulation of hexokinase and phosphofructokinase (Feinman & Fine, 2013).
14
2.19 The amount of energy yielded by carbohydrates that are digested in the small intestine varies according to the molecular form e.g. for glucose, sucrose and starch the available energy content per unit weight is 15.56 kJ (3.72 kcal/g), 16.48 kJ (3.94 kcal/g) and 17.48 kJ (4.18 kcal/g), respectively (Elia & Cummings, 2007). Carbohydrate that is not digested and absorbed in the small intestine may also provide energy, as fermentation in the colon results in the formation of short-chain fatty acids, some of which are absorbed into the blood stream and are used as sources of energy. An available energy content per unit weight has been estimated as 8 kJ/g (1.9 kcal/g) for fermentable non-starch polysaccharide, 9 kJ/g (2.2 kcal/g) for resistant starch, 8-9 kJ/g (1.9-2.2 kcal/g) for non-digestible oligosaccharides and 6-10 kJ/g (1.4-2.4 kcal/g) for non-digestible polyols (Elia & Cummings, 2007).
Glycaemic index and glycaemic load 2.20 Glycaemic index (GI) and glycaemic load (GL) are two measures of the glycaemic
characteristic of foods. GI is a relative measure of the capillary blood glucose response to a specific ingredient, food or portion of a meal, as compared with the response to a reference food having the same amount of available carbohydrate (usually 50g). The reference food can be either pure glucose or another, alternative, carbohydrate food (e.g. white bread). When alternative foods are used as reference they are calibrated against glucose (Brouns et al., 2005). A food’s GL is the product of GI and its available carbohydrate content (Brouns et al., 2005), so taking into account both the quality of the carbohydrate food and the amount of available carbohydrate it contains. GI (thus also GL) is influenced mostly by the types and structures of carbohydrates present in foods and to lesser extents by the types and amounts of protein, fat and non-starch polysaccharide present. External influences on a food’s GI include milling, cooking, cooling and storage conditions (Brouns et al., 2005; Venn & Green, 2007). Variation in GI among foods reflects the variation in rates of carbohydrate digestion and absorption, as well as effects on variation in the rates of glucose production and its disposal from the circulation into the tissues (Schenk et al., 2003; Eelderink et al., 2012a; Eelderink et al., 2012b). A benefit of lower GI and GL might be anticipated where a risk/benefit is mediated by post-prandial glycaemia. The majority of the literature on GI and GL, however, does not allow for certainty that the carbohydrate content of an exposure is the sole influence on the GI or GL of a diet, nor that a similar GI or GL for different foods has the same physiological basis. This limits the confidence in assigning cause-effect relationships for outcomes based on variation in diet GI or GL.
Fermentation of sugars in the oral cavity 2.21 Dental caries is the result of demineralisation of enamel and dentine in the
presence of acid. The pH associated with decay is close to the ‘critical pH for demineralisation’ of the tissue or about 5.5 for enamel and about 6.0 for dentine. The acids that induce demineralisation at this level are produced by the fermentation of dietary sugars (including sugars produced by hydrolysis of starch in the mouth), particularly sucrose, by acidogenic bacteria from the oral microbiota. Lactose is fermented more slowly than sucrose (Birkhed et al., 1993). Demineralisation from bacterially-derived acids (predominantly lactic acid) occurs during virtually every
15
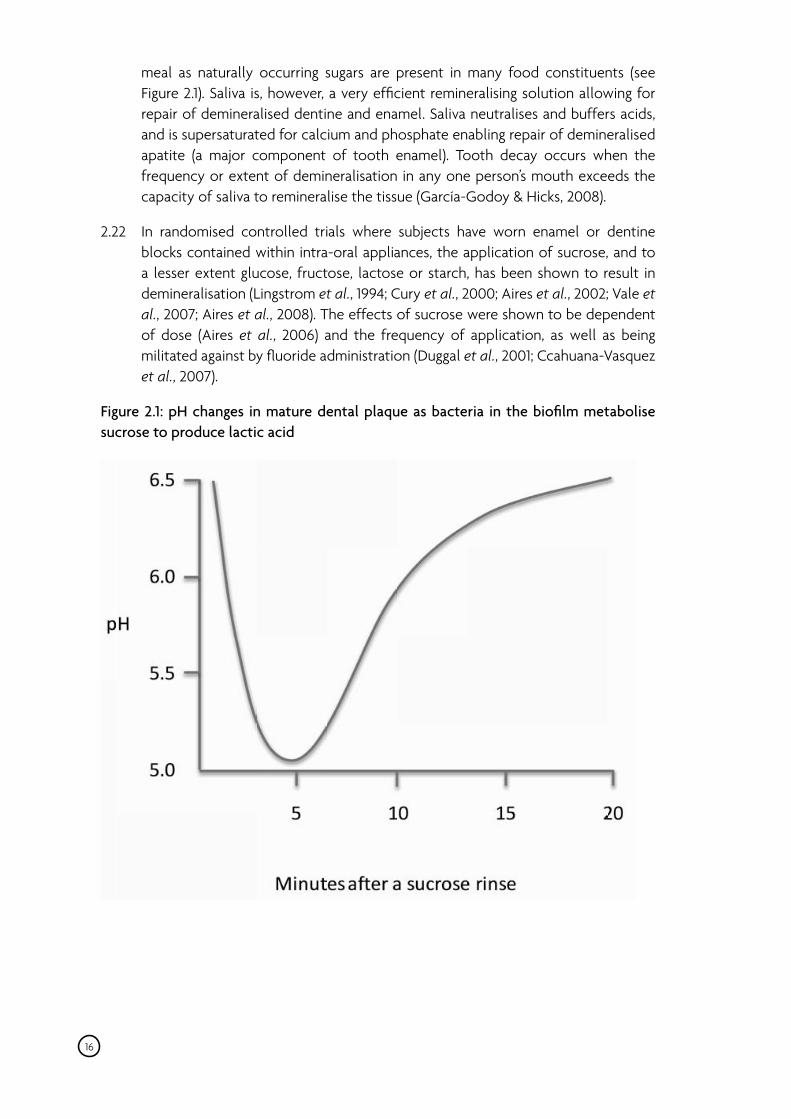
meal as naturally occurring sugars are present in many food constituents (see Figure 2.1). Saliva is, however, a very efficient remineralising solution allowing for repair of demineralised dentine and enamel. Saliva neutralises and buffers acids, and is supersaturated for calcium and phosphate enabling repair of demineralised apatite (a major component of tooth enamel). Tooth decay occurs when the frequency or extent of demineralisation in any one person’s mouth exceeds the capacity of saliva to remineralise the tissue (García-Godoy & Hicks, 2008).
2.22 In randomised controlled trials where subjects have worn enamel or dentine blocks contained within intra-oral appliances, the application of sucrose, and to a lesser extent glucose, fructose, lactose or starch, has been shown to result in demineralisation (Lingstrom et al., 1994; Cury et al., 2000; Aires et al., 2002; Vale et al., 2007; Aires et al., 2008). The effects of sucrose were shown to be dependent of dose (Aires et al., 2006) and the frequency of application, as well as being militated against by fluoride administration (Duggal et al., 2001; Ccahuana-Vasquez et al., 2007).
Figure 2.1: pH changes in mature dental plaque as bacteria in the biofilm metabolise sucrose to produce lactic acid
16
Definitions used in different dietary recommendations 2.23 The classification of carbohydrate components in dietary recommendations
may vary between different authorities. The terms carbohydrate and starch have distinct chemical definitions that do not differ between different organisations. There is diversity of opinion regarding the measurement of dietary components defined on the basis of functionality rather than chemical composition (Englyst et al., 2007). The classification used to define sugars and dietary fibre in dietary recommendations varies between different authorities and these differences are considered below.
Sugars 2.24 While the term ‘sugars’ refers to monosaccharides and disaccharides, various terms
are used to define the types of sugars described in dietary recommendations. A summary of the different definitions for sugars is given in Table 2.2.
2.25 In the UK, dietary reference values have been provided for ‘non-milk extrinsic sugars’. Intrinsic sugars are those naturally incorporated into the cellular structure of foods; extrinsic sugars are those sugars not contained within the cellular structure of a food. The extrinsic sugars in milk and milk products (i.e. lactose) were deemed to be exempt from the classification of sugars in relation to the dietary reference value (COMA, 1991). Non-milk extrinsic sugars include sugars added to foods, e.g. sucrose, glucose and fructose, and sugars naturally present in fruit juices, e.g. glucose and fructose.
2.26 The 2002 FAO/WHO Expert Consultation defined the term ‘free sugars’ as all monosaccharides and disaccharides added to foods by the manufacturer, cook or consumer, plus sugars naturally present in honey, syrups and fruit juices (WHO, 2003). In 2015, the term was elaborated to ‘free sugars include monosaccharides and disaccharides added to foods and beverages by the manufacturer, cook or consumer, and sugars naturally present in honey, syrups, fruit juices and fruit juice concentrates (WHO, 2015).
2.27 In the United States, dietary reference intakes are set for ‘added sugars’, which are defined as sugars and syrups that are added to foods during processing and preparation. Added sugars do not include naturally occurring sugars such as lactose in milk or fructose in fruits (Institute of Medicine, 2005).
2.28 The European Food Safety Authority (EFSA) defines sugars as total sugars, including both endogenous (sugars naturally present in foods such as fruit, vegetables, cereals and lactose in milk products) and added sugars (EFSA, 2009). The term ‘added sugars’ refers to sucrose, fructose, glucose, starch hydrolysates (glucose syrup, high-fructose syrup, isoglucose) and other isolated sugar preparations used as such, or added during food preparation and manufacturing.
17
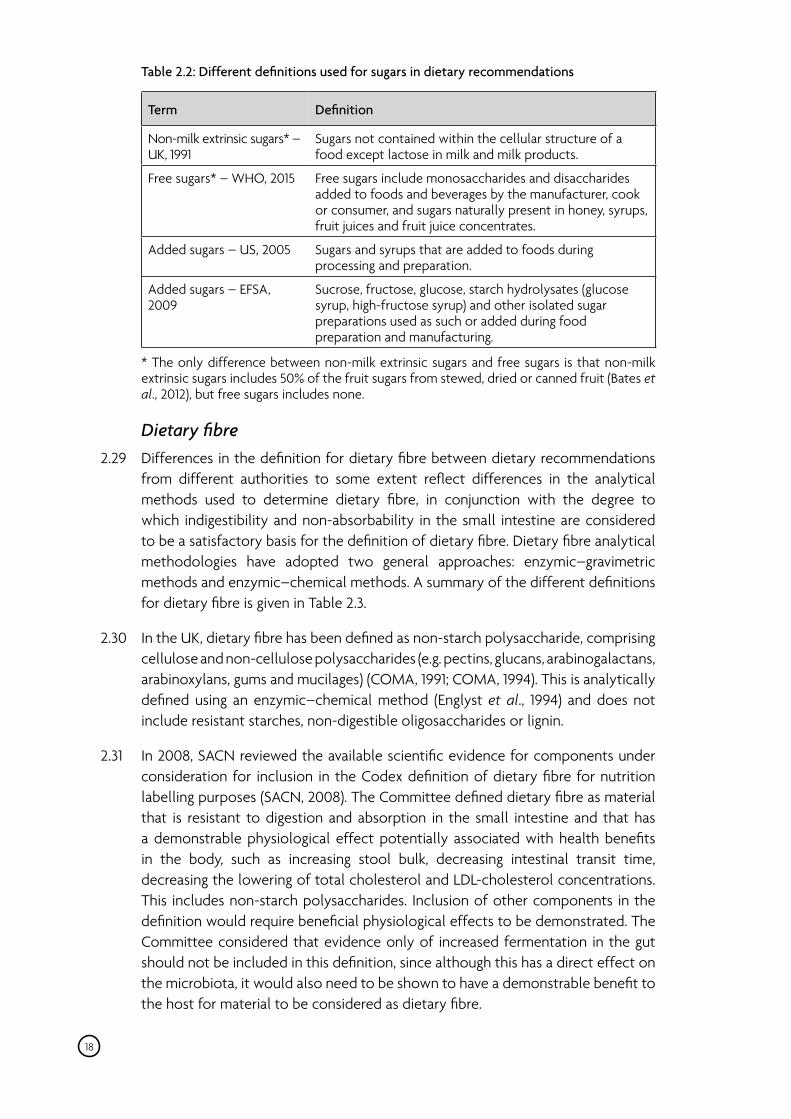
Table 2.2: Different definitions used for sugars in dietary recommendations
Term Definition
Non-milk extrinsic sugars* – Sugars not contained within the cellular structure of a UK, 1991 food except lactose in milk and milk products.
Free sugars* – WHO, 2015 Free sugars include monosaccharides and disaccharides added to foods and beverages by the manufacturer, cook or consumer, and sugars naturally present in honey, syrups, fruit juices and fruit juice concentrates.
Added sugars – US, 2005 Sugars and syrups that are added to foods during processing and preparation.
Added sugars – EFSA, Sucrose, fructose, glucose, starch hydrolysates (glucose 2009 syrup, high-fructose syrup) and other isolated sugar
preparations used as such or added during food preparation and manufacturing.
18
* The only difference between non-milk extrinsic sugars and free sugars is that non-milk extrinsic sugars includes 50% of the fruit sugars from stewed, dried or canned fruit (Bates et al., 2012), but free sugars includes none.
Dietary fibre 2.29 Differences in the definition for dietary fibre between dietary recommendations
from different authorities to some extent reflect differences in the analytical methods used to determine dietary fibre, in conjunction with the degree to which indigestibility and non-absorbability in the small intestine are considered to be a satisfactory basis for the definition of dietary fibre. Dietary fibre analytical methodologies have adopted two general approaches: enzymic–gravimetric methods and enzymic–chemical methods. A summary of the different definitions for dietary fibre is given in Table 2.3.
2.30 In the UK, dietary fibre has been defined as non-starch polysaccharide, comprising cellulose and non-cellulose polysaccharides (e.g. pectins, glucans, arabinogalactans, arabinoxylans, gums and mucilages) (COMA, 1991; COMA, 1994). This is analytically defined using an enzymic–chemical method (Englyst et al., 1994) and does not include resistant starches, non-digestible oligosaccharides or lignin.
2.31 In 2008, SACN reviewed the available scientific evidence for components under consideration for inclusion in the Codex definition of dietary fibre for nutrition labelling purposes (SACN, 2008). The Committee defined dietary fibre as material that is resistant to digestion and absorption in the small intestine and that has a demonstrable physiological effect potentially associated with health benefits in the body, such as increasing stool bulk, decreasing intestinal transit time, decreasing the lowering of total cholesterol and LDL-cholesterol concentrations. This includes non-starch polysaccharides. Inclusion of other components in the definition would require beneficial physiological effects to be demonstrated. The Committee considered that evidence only of increased fermentation in the gut should not be included in this definition, since although this has a direct effect on the microbiota, it would also need to be shown to have a demonstrable benefit to the host for material to be considered as dietary fibre.
2.32 In the United States ‘total dietary fibre’ is defined as the sum of dietary fibre and functional fibre (Institute of Medicine, 2005). Dietary fibre is defined as non-digestible carbohydrates and lignin that are intrinsic and intact in plants. Functional fibre is defined as isolated, non-digestible carbohydrate components that have beneficial physiological effects in humans, with a DP of 3 or more, and which may be isolated or extracted using chemical, enzymatic, or aqueous steps. Excluded are non-digestible mono- and disaccharides and all polyols, some resistant starch and non-digestible animal carbohydrates.
2.33 Total dietary fibre is analytically defined as the material isolated by enzymic– gravimetric methods approved by the AOAC, generally AOAC Methods 985.29 and 991.43 (Prosky et al., 1988; Lee et al., 1992). These AOAC methods determine non-starch polysaccharides, some resistant starches, lignin and some inulin, but do not measure most non-digestible oligosaccharides. AOAC methods have subsequently been developed to measure all resistant starches and low molecular weight dietary fibres such as non-digestible oligosaccharides and inulin, e.g. AOAC method 2009.01 (McCleary et al., 2010; McCleary et al., 2012).
2.34 The 2006 FAO/WHO scientific update on carbohydrates in human nutrition considered that the term ‘dietary fibre’ should be reserved for the cell wall polysaccharides of vegetables, fruits and whole grains, the health benefits of which have been clearly established, rather than synthetic, isolated or purified oligosaccharides and polysaccharides with diverse, and in some cases unique, physiological effects (Mann et al., 2007).
2.35 In 2008, the Codex Committee on Nutrition and Foods for Special Dietary Uses agreed a definition of dietary fibre, which was agreed by the Codex Alimentarius Committee in 2009 (Cummings et al., 2009; FAO/WHO, 2010). This defines dietary fibre as carbohydrate polymers with ten or more monomeric units, which are not hydrolysed by endogenous enzymes in the small intestine of human beings plus lignin and/or other compounds when associated with polysaccharides in plant cell walls. The decision on whether to include carbohydrates from three to nine monomeric units in the definition of dietary fibre was left to national authorities.
2.36 In 2010, EFSA established a dietary reference value for dietary fibre and concluded that dietary fibre should include all non-digestible carbohydrates and lignin (EFSA, 2010a). This includes non-starch polysaccharides, all resistant starches, all non-digestible oligosaccharides with three or more monomeric units and other non-digestible, but quantitatively minor components that are associated with dietary fibre polysaccharides, especially lignin. As in the Codex definition, to be defined as dietary fibre, natural carbohydrate polymers obtained from raw material in food by physical, enzymatic, chemical means, or synthetic polymers, must have beneficial physiological effects demonstrated by accepted scientific evidence (EFSA, 2010a). The Codex and European Food Safety Authority dietary fibre definitions are chemically defined using AOAC method 2009.01 (McCleary et al., 2010; McCleary et al., 2012).
19
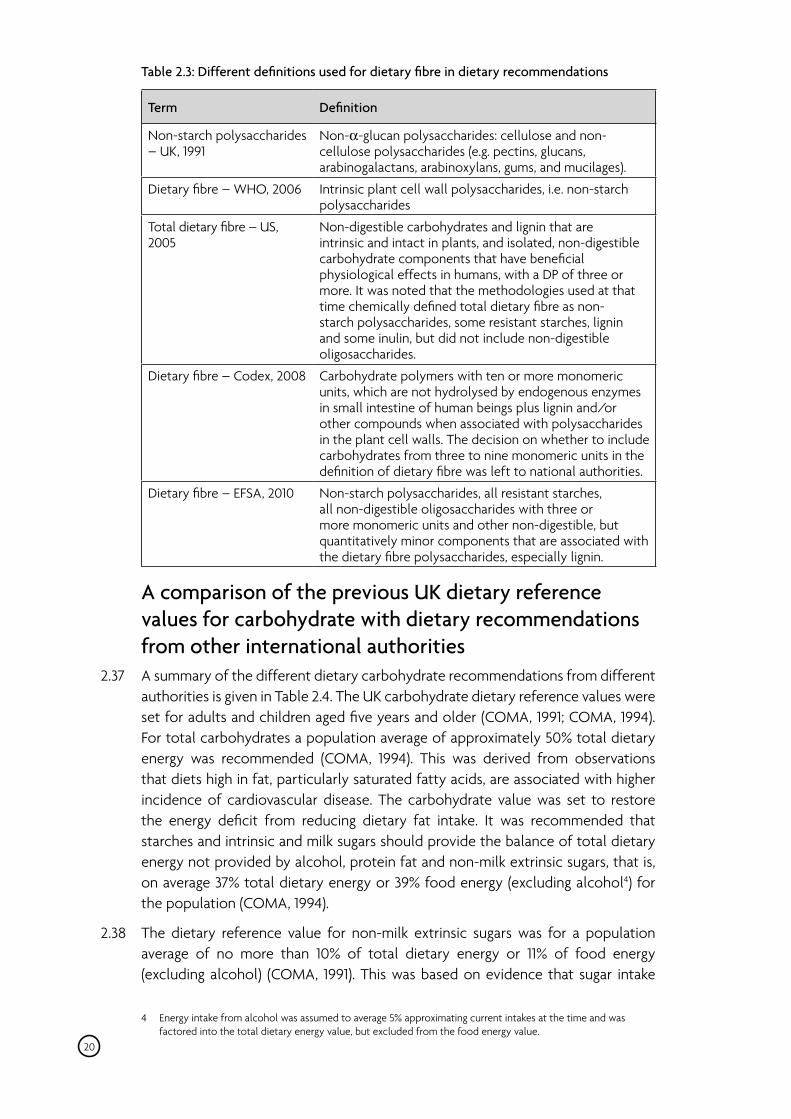
Table 2.3: Different definitions used for dietary fibre in dietary recommendations
Term Definition
Non-starch polysaccharides – UK, 1991
Non-α-glucan polysaccharides: cellulose and non-cellulose polysaccharides (e.g. pectins, glucans, arabinogalactans, arabinoxylans, gums, and mucilages).
Dietary fibre – WHO, 2006 Intrinsic plant cell wall polysaccharides, i.e. non-starch polysaccharides
Total dietary fibre – US, 2005
Non-digestible carbohydrates and lignin that are intrinsic and intact in plants, and isolated, non-digestible carbohydrate components that have beneficial physiological effects in humans, with a DP of three or more. It was noted that the methodologies used at that time chemically defined total dietary fibre as non-starch polysaccharides, some resistant starches, lignin and some inulin, but did not include non-digestible oligosaccharides.
Dietary fibre – Codex, 2008 Carbohydrate polymers with ten or more monomeric units, which are not hydrolysed by endogenous enzymes in small intestine of human beings plus lignin and/or other compounds when associated with polysaccharides in the plant cell walls. The decision on whether to include carbohydrates from three to nine monomeric units in the definition of dietary fibre was left to national authorities.
Dietary fibre – EFSA, 2010 Non-starch polysaccharides, all resistant starches, all non-digestible oligosaccharides with three or more monomeric units and other non-digestible, but quantitatively minor components that are associated with the dietary fibre polysaccharides, especially lignin.
A comparison of the previous UK dietary reference values for carbohydrate with dietary recommendations from other international authorities
2.37 A summary of the different dietary carbohydrate recommendations from different authorities is given in Table 2.4. The UK carbohydrate dietary reference values were set for adults and children aged five years and older (COMA, 1991; COMA, 1994). For total carbohydrates a population average of approximately 50% total dietary energy was recommended (COMA, 1994). This was derived from observations that diets high in fat, particularly saturated fatty acids, are associated with higher incidence of cardiovascular disease. The carbohydrate value was set to restore the energy deficit from reducing dietary fat intake. It was recommended that starches and intrinsic and milk sugars should provide the balance of total dietary energy not provided by alcohol, protein fat and non-milk extrinsic sugars, that is, on average 37% total dietary energy or 39% food energy (excluding alcohol4) for the population (COMA, 1994).
2.38 The dietary reference value for non-milk extrinsic sugars was for a population average of no more than 10% of total dietary energy or 11% of food energy (excluding alcohol) (COMA, 1991). This was based on evidence that sugar intake
4 Energy intake from alcohol was assumed to average 5% approximating current intakes at the time and was factored into the total dietary energy value, but excluded from the food energy value.
20
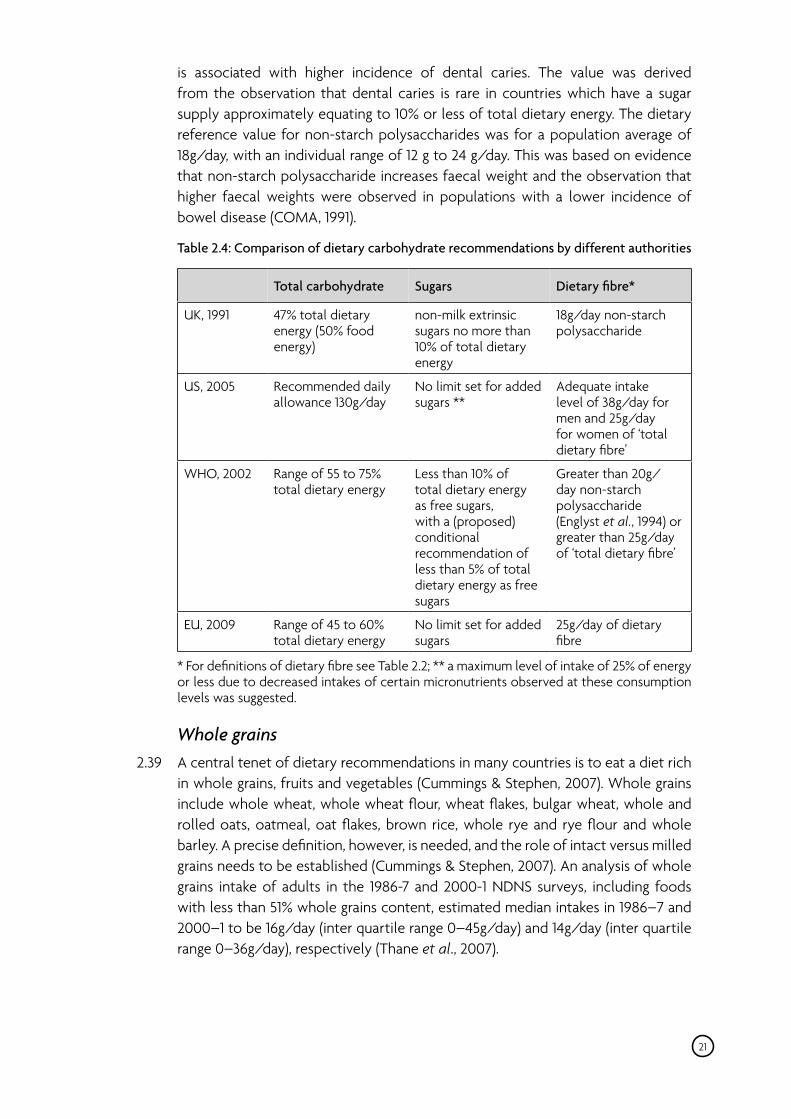
is associated with higher incidence of dental caries. The value was derived from the observation that dental caries is rare in countries which have a sugar supply approximately equating to 10% or less of total dietary energy. The dietary reference value for non-starch polysaccharides was for a population average of 18g/day, with an individual range of 12 g to 24 g/day. This was based on evidence that non-starch polysaccharide increases faecal weight and the observation that higher faecal weights were observed in populations with a lower incidence of bowel disease (COMA, 1991).
Table 2.4: Comparison of dietary carbohydrate recommendations by different authorities
Total carbohydrate Sugars Dietary fibre*
UK, 1991 47% total dietary energy (50% food energy)
non-milk extrinsic sugars no more than 10% of total dietary energy
18g/day non-starch polysaccharide
US, 2005 Recommended daily allowance 130g/day
No limit set for added sugars **
Adequate intake level of 38g/day for men and 25g/day for women of ‘total dietary fibre’
WHO, 2002 Range of 55 to 75% total dietary energy
Less than 10% of total dietary energy as free sugars, with a (proposed) conditional recommendation of less than 5% of total dietary energy as free sugars
Greater than 20g/ day non-starch polysaccharide (Englyst et al., 1994) or greater than 25g/day of ‘total dietary fibre’
EU, 2009 Range of 45 to 60% total dietary energy
No limit set for added sugars
25g/day of dietary fibre
* For definitions of dietary fibre see Table 2.2; ** a maximum level of intake of 25% of energy or less due to decreased intakes of certain micronutrients observed at these consumption levels was suggested.
Whole grains 2.39 A central tenet of dietary recommendations in many countries is to eat a diet rich
in whole grains, fruits and vegetables (Cummings & Stephen, 2007). Whole grains include whole wheat, whole wheat flour, wheat flakes, bulgar wheat, whole and rolled oats, oatmeal, oat flakes, brown rice, whole rye and rye flour and whole barley. A precise definition, however, is needed, and the role of intact versus milled grains needs to be established (Cummings & Stephen, 2007). An analysis of whole grains intake of adults in the 1986-7 and 2000-1 NDNS surveys, including foods with less than 51% whole grains content, estimated median intakes in 1986–7 and 2000–1 to be 16g/day (inter quartile range 0–45g/day) and 14g/day (inter quartile range 0–36g/day), respectively (Thane et al., 2007).
21
2.40 There are discrepancies between definitions of a whole grain food (including whole grain flour) used for labelling purposes between countries and within and outside the EU. In the UK and the USA whole grain foods must contain 51% or more whole grain ingredients by wet weight, whereas in Sweden and Denmark the requirement is 50% or more whole grain ingredients on a dry matter basis. In Germany, whole grain bread must be 90% whole grains (EFSA, 2010b).
2.41 An EU research project (The Healthgrain Consortium) developed a single definition of whole grains for use across Europe and, where possible equivalent to definitions outside Europe, which aimed to also be in line with definitions outside of Europe, such as the American Association of Cereal Chemists International definition5
(van der Kamp et al., 2014). A full definition describing the grains included and the processing aspects was developed and an overall definition of whole grains given as follows:
• Whole grains shall consist of the intact, ground, cracked or flaked kernel after the removal of inedible parts such as the hull and husk. The principal anatomical components – the starchy endosperm, germ and bran – are present in the same relative proportions as they exist in the intact kernel.
• Small losses of components – that is, less than 2% of the grain/10% of the bran – that occur through processing methods consistent with safety and quality are allowed.
5 Whole grains consist of the ‘intact, ground, cracked or flaked caryopsis (grain), whose principal components-the starchy endosperm, germ and bran-are present in the same relative proportions as they exist in the intact caryopsis’ (American Association of Cereal Chemists International, 1999). To be considered whole grain, a food may contain intact grains, minimally processed grains, or milled grains from which no component has been removed during the milling process.
22
3 Dietary sources and intakes of carbohydrates
3.1 Nationally representative data on carbohydrate intakes of the UK population were drawn from the National Diet and Nutrition Survey (NDNS) rolling programme, a continuous survey of diet and nutrition in adults and children aged 18 months upwards. Data presented in this chapter are based on 3450 adults aged 19 years and over and 3378 children aged 1½-18 years collected over years 1-4 combined (2008/09 to 2011/12) (Bates et al., 2014).
3.2 Carbohydrate intake data are also available for infants and young children aged 4-18 months from the 2011 UK Diet and Nutrition Survey of Infants and Young Children (Lennox et al., 2013). Carbohydrate intakes for the UK low income/ materially deprived population, collected in 2003-2005, are available from the Low Income Diet and Nutrition Survey (Nelson et al., 2007).
3.3 Dietary sources of carbohydrates are presented at a broad category level6, for example, cereals and cereal products, milk and milk products (Annex 8). The top twenty contributors are also presented at a more detailed food group level (Annex 8).
3.4 In the NDNS rolling programme, diet was assessed by the participant (or the parent/carer for children) keeping a diary of all foods and drinks consumed for four consecutive days, using household measures and other methods to estimate quantities consumed. The survey was designed to represent all days of the week equally in the final data; however there is a slight over-representation of Fridays and weekend days in the dataset compared with other days (Bates et al., 2014).
3.5 Dietary surveys are reliant on self-reported measures of intake. Misreporting of food consumption in dietary surveys, generally under-reporting, is known to be a problem in the NDNS, as it is in dietary surveys worldwide. A doubly-labelled water sub-study carried out as part of the NDNS rolling programme (Bates et al., 2014) found that reported energy intake in adults aged 16-64 years was, on average, 34% lower than total energy expenditure (TEE) measured by doubly labelled water. The difference for other age groups was similar except for children aged 4-10 years where reported energy intake was 12% lower than TEE. This discrepancy between reported energy intake and TEE is likely to be due to a combination of underreporting actual dietary consumption, and changing the diet during the recording period. It is not possible to extrapolate these estimates of underreporting of energy intake to individual foods or nutrients, nor is it possible to correct or adjust the intake estimates to take account of under-reporting.
6 ‘Cereals and cereal products’, ‘milk and milk products ‘, ‘eggs and egg dishes’, ‘fat spreads’, ‘meat and meat products’, ‘fish and fish dishes’, ‘vegetables and potatoes’, ‘savoury snacks’, ‘nuts and seeds’, ‘fruit’, ‘sugar, preserves and confectionery’, ‘non-alcoholic beverages’ and ‘alcoholic beverages’ are the broad food categories reported in the NDNS.
23
3.6 The carbohydrate intakes of the UK population have been tabulated and are included in Annex 8. Dietary intakes reported in this chapter are compared with the current dietary reference values (DRVs) set by COMA in 1991. Carbohydrate intakes are presented as grams/day, as a percentage of total dietary energy intake (that is including energy from alcohol) and as a percentage of food and drink energy intake (that is, excluding energy from alcohol).
Total carbohydrate intakes and dietary sources 3.7 In the UK, mean intakes of total carbohydrate in adults and children aged 4 years
and over were 200-240g/day, and 150g/day in children aged 1½- 3 years. Mean intakes of total carbohydrate as a percentage of total dietary energy were 51-52% in children and 46% in adults. Mean intakes in children met the DRV and in adults were close to the DRV (Annex 8).
3.8 Cereals and cereal products were the main source of total carbohydrate intake in all age groups, providing around 45% of intake. Bread was the largest single source of total carbohydrate. The other food groups that made a substantial contribution to total carbohydrate intake were potatoes, fruit, drinks (soft and alcoholic), and table sugar, preserves and confectionery; each providing up to 10% of intake (Annex 8).
3.9 White bread was the top contributor to intake of total carbohydrate in adults and children aged 4 years and over, providing 10-12% of intake. In children aged 1½-3 years fruit and milk were the top contributors, each providing about 10% of intake. Soft drinks provided 10% of total carbohydrate intake in children aged 11-18 years (Annex 8).
3.10 In children aged 4-18 months, mean intakes of total carbohydrate ranged from 93 to 126g/day and contributed 49-52% of total dietary energy intake. The major contributor to total carbohydrate intake for children aged 4 to 11 months was infant formula which provided 46% of intake in the youngest children reducing to 28% in those aged 10-11 months. For children aged 12 to 18 months, the major contributor to total carbohydrate intake was cereals and cereal products (34%). Commercial infant foods were also major contributors to total carbohydrate intakes at the younger end of the age range, and milk and milk products at the older end.
Total and individual sugar intakes and dietary sources 3.11 Mean intakes of total sugar were around 95-103g/day in adults and children over
4 years and 76g/day in children aged 18 months to 3 years. This represented about a fifth of total dietary energy intake in older children and adults, and a quarter in children under 11 years. About half of total sugar intake was sucrose; mean intakes were 40-50g/day for adults and children over 4 years. Mean intakes of glucose and fructose (exclusive of that delivered as sucrose) were 15-18g/day each, lactose 10-13g/day and maltose 5-8g/day. The proportion of total sugar intake from lactose was slightly higher in children under 3 years (18g/day) due to higher milk consumption (Annex 8).
24
3.12 In adults aged 19-64 years, soft drinks and fruit were the top contributors to total sugar intakes, each providing 13% of intake, with table sugar providing 9% of intake. In older adults aged 65 years and over, fruit was the top contributor providing 18% of total sugar intake with table sugar and milk each providing 10%. Soft drinks were the main contributor to total sugar in children aged 11-18 years, providing 24% of intake. In the 4-10 year age group, fruit was the top contributor at 14% of total sugars intake, followed by soft drinks at 11% of intake, milk at 10% and fruit juice at 9%. In the youngest age group, 1½-3 years, fruit and milk each provided a fifth of total sugar intake (Annex 8).
3.13 In children aged 4-18 months, mean intakes of total sugar were 71g/day in the youngest group reducing to 66g/day in the oldest. Total sugars provided 38% of energy in the youngest group and 26% in the 12-18 month age group. For children aged 4 to 11 months the main contributor to total sugar intake was infant formula, providing over 50% of intake in the youngest age group and 40% in older children. For children aged 12 to 18 months, milk and milk products were the main source of total sugars (33%) followed by fruit (19%).
Non-milk extrinsic sugar intakes and dietary sources 3.14 Mean intakes of non-milk extrinsic sugars (NMES) exceed the DRV (that the
population average intake should not exceed 10% of total dietary energy) in all age/sex groups. Older adults aged 65 years and over had mean intakes closest to the DRV (11.2% total dietary energy). The highest mean intakes of NMES were in children aged 4-10 years and 11-18 years (14.7% and 15.4% of total dietary energy respectively). Intakes at the 97.5th percentile provided 25-30% of total dietary energy intake (Annex 8).
3.15 The main contributors to NMES intake differed for adults and children. For older children aged 11-18 years, soft drinks were the largest single source of NMES providing 30% of intake, with a further 10% of intake from fruit juice. In younger children aged 4-10 years soft drinks provided 16% of NMES intake and fruit juice 13%. Cereals and cereal products provided about a quarter (22-29%) of NMES intake in children, mainly from sugars added to biscuits, buns, cakes, pastries and breakfast cereals. Table sugar, preserves and confectionery provided a fifth of intake. In adults aged 19-64 years, soft and alcoholic drinks and fruit juice combined provided a third of intake, table sugar, preserves and confectionery provided a quarter of intake (table sugar the largest source) and cereals and cereal products provided a fifth of intake. In older adults aged 65 years and over, the contribution from cereals and cereal products was higher and that from drinks was lower (Annex 8).
3.16 In children aged 4-18 months, mean intakes of NMES were 4.3% of energy intake in the youngest group and 7.7% in the 12-18 month age group. The main contributor to NMES intake for children aged 4-6 months and 7-9 months was commercial infant foods, which provided 44% of intake in children aged 4-6 months. Milk and milk products provided a fifth of NMES intake in this age group (from sugars added to yogurts, dairy desserts and ice-cream). For children aged 10 to 18 months, milk and milk products was the single largest contributor to NMES intake.
25
Intrinsic and milk sugars intakes and dietary sources 3.17 Mean intakes of intrinsic and milk sugars were 30-43g/day across the age groups,
providing 6-10% of total dietary energy intake in adults and children aged 4 years upwards and 13% in children aged 1½-3 years. The main sources of intrinsic and milk sugars were milk and fruit (Annex 8).
3.18 In children aged 4-18 months, mean intakes of intrinsic and milk sugars were 34% of energy intake in 4-6 month olds, and 18% in 12-18 month olds. Infant formula was the largest contributor to intake of intrinsic and milk sugars intake for children aged 4-11 months. The second largest contributors were breast milk for those aged 4-6 months and 7-9 months and fruit for those aged 10-11 months. For the 12-18 month age group, the largest contributor was milk and milk products followed by fruit.
Starch intakes and dietary sources 3.19 Mean starch intakes were 110-135g/day in adults and children over 4 years, and
76g/day in younger children aged 1½-3 years. This represented 25-29% of total dietary energy (Annex 8).
3.20 White bread was the top contributor to starch intake in all age groups, providing around a fifth of intake in adults and children aged 4 years and over, and 16% in children aged 1½-3 years. Chips, fried and roast potatoes and potato products was the second largest contributor in children from 4 years and adults aged 19-64 years. Boiled, mashed and baked potatoes was the second largest contributor in older adults and high fibre breakfast cereals was the second largest contributor in children aged 1½-3 years. Pasta and pasta-based dishes provided 6-8% of starch intake in children and adults aged 19-64 years (Annex 8).
3.21 In children aged 4-18 months, mean starch intakes were 22g/day in the youngest group (11% of energy), increasing to 60g/day in the 12-18 month group (23% of energy). For children aged 4-6 months, the main contributor to starch intake was commercial infant foods. For children aged 7-9 months, the main contributors were commercial infant foods and cereals and cereal products. For children aged 10-11 months and 12-18 months, the main source of starch was cereals and cereal products.
Intrinsic and milk sugars and starch intakes 3.22 The DRV for intrinsic and milk sugars and starch combined is 37% of total dietary
energy (including energy from alcohol) as a population average. The mean intakes for intrinsic and milk sugars and starch were 34-35% of total dietary energy in adults and children aged 11 years and over and 37-39% in younger children (Annex 8).
Non-starch polysaccharides intakes and dietary sources 3.23 In adults, mean intakes of non-starch polysaccharides were 14g/day, well below
the population average DRV for adults of 18g/day, but above the individual minimum of 12g/day. Intakes at the 97.5th percentile were 25-26g/day. Mean intakes for children were lower at 11-12g/day (8g/day in children under 4 years) (Annex 8).
26
3.24 At a broad food category level, the main sources of non-starch polysaccharides were cereals and cereal products, which provided about 40% of intake across age groups, and vegetables and potatoes (a quarter to a third of intake) (Annex 8).
3.25 Vegetables and vegetable-based dishes was the single largest contributor to non-starch polysaccharides intake in all age groups, providing just under a fifth of intake in children and a quarter in adults. Fruit was the second largest contributor in all age groups except 11-18 years providing 13-17% of intake in children under ten years and 10-14% in adults. In the 11-18 year age group, white bread and chips and fried potatoes were the second largest sources each providing about 10% of intake (Annex 8).
3.26 In the 4-18 month age group, mean non-starch polysaccharide intakes were 4-7 grams per day. The main contributors to non-starch polysaccharide intake for children aged 4 to 11 months were commercial infant foods and infant formula. For children aged 12-18 months, the main contributor to non-starch polysaccharides intake was cereals and cereal products followed by vegetables and potatoes.
Consumption of selected carbohydrate-containing foods 3.27 Tables 3.13 to 3.15 in Annex 8 present consumption of selected carbohydrate-
containing foods, based on data from NDNS. Consumption data are presented as population averages (including participants who did not consume the food over the four day diary) and as averages for consumers only (excluding non-consumers) with the percentage who consumed over four days.
3.28 Consumption of sugary soft drinks was highest in the 11-18 year age group. Population mean consumption of sugary soft drinks in boys aged 11-18 years was 310g/day, 80% of boys in this age group consumed sugary soft drinks over the four day period. For girls in the same age group, 75% consumed sugary soft drinks over the four days and mean population consumption was 210g/day. Mean consumption in the 4-10 year ago group was lower at 128g/day with 69% consumers over four days.
3.29 Mean consumption of fruit juice was highest in children aged 4-10 years, 93g/day with 62% consumers over 4 days, followed by children aged 11-18 years, 83g/day with 49% consumers over 4 days. Mean consumption in other age groups was 50-60g/day with 40-50% consumers over four days.
3.30 White bread was the most commonly consumed food type and eaten in the greatest quantities in all age groups. Mean consumption of all bread was 80-90g/ day in adults and older children.
3.31 Mean consumption of breakfast cereals was 22-28g/day across the age groups except in older adults aged 65 years and over for whom it was higher at 47g/day. Consumption of high fibre breakfast cereals was higher than that of other breakfast cereals in all age groups except for children aged 11-18 years.
3.32 Mean consumption of potatoes was about 90g/day for adults and older children. Children aged 11-18 years consumed 54g/day of chips and fried potatoes and 33g/day of boiled, mashed and baked potatoes.
27
3.33 Children aged 4-18 years consumed 18-19 g/day of sugar and chocolate confectionery. Adults consumed 11-14g/day of table sugar, preserves and sweet spreads (mainly as table sugar).
Socio-economic differences in carbohydrate intakes 3.34 Analysis by equivalised household income in NDNS showed that for adults aged
19-64 years the lowest income quintile for both men and women consumed a higher percentage of energy from total carbohydrate than did the highest quintile. No clear pattern was seen in other age groups.
3.35 Overall, mean intakes of NMES for adults tended to be higher in the lowest income quintile compared with the highest. For example in women aged 19-64 years mean NMES intake was significantly higher in the lowest quintile (12.7% total dietary energy) compared with the highest (10.0%). This pattern was not seen in children and in boys 4-10 years the lowest quintile had significantly lower % energy from NMES than did the highest.
3.36 There is a clear income gradient in non-starch polysaccharide intake with the NDNS showing lower intakes in the lowest income quintile compared to the highest in most age groups. This partly reflects lower fruit and vegetable consumption in lower income groups. For example in women 19-64 years, latest NDNS data show a significantly lower non-starch polysaccharide intake in the lowest quintile (11.8g/day) compared with the highest quintile (13.7g/day). However mean intakes were below the DRV in all income quintiles.
3.37 Evidence from other surveys confirm the socio-economic gradient. The Family Food Survey, based on household food purchases, found that the proportion of energy coming from NMES in the household diet was higher in the lowest income quintile compared with the highest while the non-starch polysaccharide content of food purchased by households in the lowest income quintile was lower than that of the food purchased by households in the highest quintile.
3.38 The UK Low income diet and nutrition survey carried out in 2003-2005 found that intakes of carbohydrates were generally similar to those in the general population although where intakes failed to meet DRVs this tended to be more marked in the low income/materially deprived population. Mean intakes of total carbohydrate were similar to intakes in the current NDNS (2008-2012) but mean intakes of non-milk extrinsic sugars as a percentage of energy were higher than the current NDNS and also higher than in previous NDNS carried out in the 1990s while mean intakes of non-starch polysaccharides were lower than current and previous intakes in NDNS.
Summary 3.39 UK NDNS data show that mean intakes of total carbohydrate meet or are close
to meeting recommendations in all age groups while intake of NMES exceeded recommendations in all age groups and were particularly high in children. Soft drinks provided almost a third of the intake of non-milk extrinsic sugars in children aged 11-18 years. Biscuits, buns, cakes, and puddings, confectionery and fruit juice
28

were also significant contributors. Non-starch polysaccharide intakes were below recommended levels for adults. There is evidence from NDNS and other surveys of a socio-economic gradient in intakes of both sugar and fibre, with higher intakes of NMES as a percentage of energy for adults and lower intakes of non-starch polysaccharide for both adults and children in the lower income groups.
3.40 Intake data for non-digestible oligosaccharides and resistant starches are not available from the UK NDNS. A consideration of other dietary surveys in the UK and other countries that do provide estimates of non-digestible oligosaccharides and resistant starches intakes is given in Chapter 9.
29
4 Background on health outcomes (disease prevention)
4.1 The relationships between dietary carbohydrate intake and cardio-metabolic, colo-rectal and oral health outcomes have been considered in this report. Evidence has been evaluated to assess whether intakes of specific carbohydrates are a factor in the risk for cardiovascular disease, obesity, type 2 diabetes mellitus, and colo-rectal cancers. The relationship between dietary carbohydrate intake and risk factors and markers related to these diseases has also been considered. Table 4.1 lists the risk factors and measures with the references substantiating their use for a given disease or function.
Cardiovascular disease 4.2 Cardiovascular disease is a major cause of disability and premature death
throughout the world, and contributes substantially to the escalating costs of health care. Coronary heart disease is the UK’s single biggest killer and is responsible for almost 74,000 deaths each year, while stroke causes more than 41,000 deaths in the UK each year (British Heart Foundation, 2014). The underlying pathology is atherosclerosis, which develops over many years and is usually advanced by the time symptoms occur, generally in middle age (WHO, 2007a).
4.3 The rate of progression of atherosclerosis is influenced by cardiovascular risk factors: poor diet and physical inactivity (which together increase the risk of obesity), tobacco use, elevated blood pressure (hypertension), abnormal blood lipids (dyslipidaemia) and elevated blood glucose (diabetes) (see the blood pressure, fasting blood lipid concentration, coronary and vascular factors, inflammatory markers and type 2 diabetes mellitus related risk factors sections in Table 4.1). Continuing exposure to these risk factors leads to further progression of atherosclerosis, resulting in unstable atherosclerotic plaques, narrowing of blood vessels and obstruction of blood flow to vital organs, such as the heart and the brain. The clinical manifestations of these diseases include angina, myocardial infarction, transient cerebral ischaemic attacks and strokes (WHO, 2007a).
Obesity 4.4 The prevalence of obesity (BMI 30 kg/m2 or over) in the UK is high; for example
in England there was an increase in obesity from 13.2% of men in 1993 to 24.4% in 2012 and from 16.4% of women in 1993 to 25.1% in 2012 (Health and Social Care Information Centre, 2013a). Obesity is associated with a range of health problems including type 2 diabetes mellitus, cardiovascular diseases and cancer (see the body weight and body composition section in Table 4.1). Type 2 diabetes and other metabolic diseases can also occur in non-obese individuals.
30
4.5 Obesity occurs when energy intake from food and drink consumption is greater than energy expenditure through the body’s metabolism and physical activity over a prolonged period, resulting in the accumulation of excess body fat. There are, however, many complex behavioural and societal factors that combine to contribute to the causes of obesity, e.g. people’s latent biological susceptibility interacting with a changing environment that includes more sedentary lifestyles and increased dietary abundance (Foresight, 2007). Dietary factors affecting energy intake and eating motivation are important factors in the aetiology of obesity (Blundell et al., 2010).
Type 2 diabetes mellitus 4.6 In 2013, 6% of the UK population, over 3.2 million people, were identified as having
diabetes, of which 90% had type 2 diabetes mellitus (Diabetes UK, 2014). Plasma glucose concentration is used to diagnose diabetes (WHO, 2006). A considerable body of research has indicated that diabetes is a strong independent risk factor for cardiovascular disease (Sarwar et al., 2010). Often, cardiovascular disease and type 2 diabetes mellitus exist together as they share common modifiable risk factors such as obesity, and in particular elevated central adiposity. Of all serious diseases, type 2 diabetes has the strongest association with obesity, and body weight control is a key factor in the prevention of progression from impaired glycaemic control to type 2 diabetes mellitus (American Diabetes Association and National Institute of Diabetes Digestive and Kidney Diseases, 2002; Pi-Sunyer, 2007). (See the type 2 diabetes mellitus related risk factors and body weight and body composition sections in Table 4.1).
4.7 Diet and lifestyle management are of upmost importance in reducing the incidence of type 2 diabetes mellitus (Diabetes UK, 2013). It is important to identify which dietary aspects improve glycaemia, insulinaemia and insulin resistance in individuals with normal or moderately compromised glycaemic control to further elucidate the role of diet in the prevention of type 2 diabetes mellitus.
Colo-rectal health 4.8 Colo-rectal cancer is the third most common cancer in men and women in the UK,
surpassed only by lung and breast cancers in women and lung and prostate cancers in men (Cancer Research UK, 2014b). While a small proportion (<5%) of colo-rectal cancers are attributable to familial cancer syndromes, familial adenomatous polyposis and hereditary non-polyposis colo-rectal cancer, the majority appear to arise sporadically. There is strong epidemiological evidence for environmental factors in the development of sporadic colo-rectal cancer.
4.9 A large body of evidence indicates that adenomatous polyps are the precursor for most colo-rectal cancers (Kinzler & Vogelstein, 1996; Leslie et al., 2002), but only a small proportion of adenomas progress to invasive cancer (Schatzkin & Gail, 2002). There are, however, no other validated risk factors for colo-rectal cancer, and the evidence for faecal parameters in relation to colo-rectal cancer is putative
31
at best (see the colo-rectal cancer risk factor and colo-rectal function sections in Table 4.1).
4.10 The parameters faecal weight, moisture content and intestinal transit time are quantifiable aspects of colo-rectal function used as measures of laxation. They have, to a limited extent, been associated with different diseases, but these relationships are, as yet, not well defined (Cummings et al., 1992; Lewis & Heaton, 1999). There is no single accepted definition of what constitutes normal laxation (Weaver, 1988). EFSA has suggested that an intestinal transit time of about two to three days, a defecation frequency of once a day and a faecal moisture of >70%, with a faecal weight of about 150g/day, may be considered adequate for normal laxation in adults and that this requires an intake of about 25g/day dietary fibre (EFSA, 2010a) (for EFSA’s definition of fibre see Chapter 2).
4.11 Differences in faecal microbiota, short chain fatty acid content and pH have been associated with different diseases, but these relationships are, as yet, not well defined (Björkstén et al., 2001; Kalliomaki et al., 2001; Penders et al., 2007; Takaishi et al., 2008; Kalliomaki et al., 2008; Packey & Sartor, 2009; Schwiertz et al., 2010). In infants, comparisons between breast feeding and breast milk substitute feeding have shown differences in these faecal parameters, where breast milk fed infant faecal microbiota and short chain fatty acid content and pH are defined as optimal or normal (Ogawa et al., 1992; Penders et al., 2006). In children and adults it is not possible to define optimal or normal faecal microbiota and short chain fatty acid content and pH, but they can act as indices for effects on colonic fermentation.
4.12 The human intestinal microbiota is a complex ecosystem, consisting of several hundred different bacterial species, and Bifidobacterium spp. is just one factor in the infant intestinal microbiota. In the first year of life, the infant intestinal tract progresses from sterility to extremely dense colonization, ending with a mixture of microbes that is broadly very similar to that found in the adult intestine. Being breast fed, mode of birth, perinatal antibiotics and country of birth are major factors influencing the composition of the infant intestinal microbiota (Fallani et al., 2010). The composition of oligosaccharides in human milk is very complex, with great diversity of structure, and does not contain the non-milk oligosaccharides fructo-oligosaccharide and galacto-oligosaccharide (Boehm & Stahl, 2007).
4.13 Constipation is defecation that is unsatisfactory because of infrequent stools, difficult stool passage, or seemingly incomplete defecation. Faeces are often dry and hard, and may be abnormally large or abnormally small. Functional constipation is chronic constipation without a known cause. Constipation is more common in women, the elderly, and during pregnancy (Higgins & Johanson, 2004; Cullen & O'Donoghue, 2007). Reported prevalence rates vary widely, at least partly because criteria for diagnosis vary.
4.14 Constipation was traditionally defined as less than three bowel movements per week (Connell et al., 1965). Subsequent evidence has suggested effort to defecate, and stool consistency, or form, to be more important in defining constipation (Spiller & Thompson, 2010). While hard stools correlate well with slow transit, and
32
loose stools with fast transit through the colon, difficulty with defecation and stool frequency do not, as they are determined by factors other than colon transit time (Spiller & Thompson, 2010).
Oral health 4.15 Humans have two dentitions, the deciduous (colloquially known as ‘milk teeth’)
and the permanent. Deciduous teeth begin to erupt during the first year of life; the 20 teeth of the deciduous dentition are normally all present by the age of four years. These are progressively shed between the ages of 6 and 12 years, during the ‘mixed dentition’ phase. Each deciduous tooth is normally replaced by a permanent tooth during this time and as a consequence some deciduous and some permanent teeth are present in the mouth at the same time. In addition to the replacement of the 20 deciduous teeth, three pairs of permanent molar teeth erupt behind the rearmost tooth of the deciduous dentition in both the upper and lower jaws as they grow. The permanent dentition has 32 teeth in total; 16 in each of the lower and upper jaws, including the three molar teeth that erupt behind the deciduous dentition, and 20 teeth (premolars, canines and incisors) that directly replace the deciduous teeth during the ‘mixed dentition’ phase. Dental development and eruption is complete by around the age of 21 when the third molar teeth (colloquially known as ‘wisdom teeth’ have erupted. However the third molars often fail to develop or do not erupt into the mouth so many people have fewer than a full compliment of teeth.
4.16 The major disease processes that affect oral health are dental caries, periodontal disease, tooth wear and oral cancer. Sugars in the diet exert an effect after eruption when the teeth are exposed to the oral environment.
4.17 Oral health has improved among adults in the UK since the first Adult Dental Health Survey in 1968. However, there are many people whose oral health is poor and variations with social class are marked (Steele & O’ Sullivan, 2011). In 2009, just under a third of adults (31%) had obvious dental caries, with more men having dental caries than women (34% compared to 28%). Adults from routine and manual occupation households7 are more likely to have dental decay than those from managerial and professional occupational households (37% compared with 26%). Despite marked improvements in tooth retention over the past 40 years, pervasive inequalities in tooth loss by social class remain among British adults. In the whole adult population fewer people have no natural teeth or limited dentition now than previously; however the burden of edentulism is much greater in individuals from poorer social backgrounds (Bernabe & Sheiham, 2014).
4.18 In 15-year old children, 13% had obvious dental caries in permanent teeth in 2003 (Pitts et al., 2006). In 2012 almost a third (27.9%) of 5-year olds in England had tooth decay (Public Health England, 2013). As in adults, the prevalence of dental decay among children is associated with social factors. Children from more deprived
7 The National Statistics Socio-economic Classification (NS-SEC) (routine and manual, intermediate, and managerial and professional occupations) replace Social Class based on Occupation (SC, formerly Registrar General’s Social Class) and Socio-economic Groups (SEG).
33
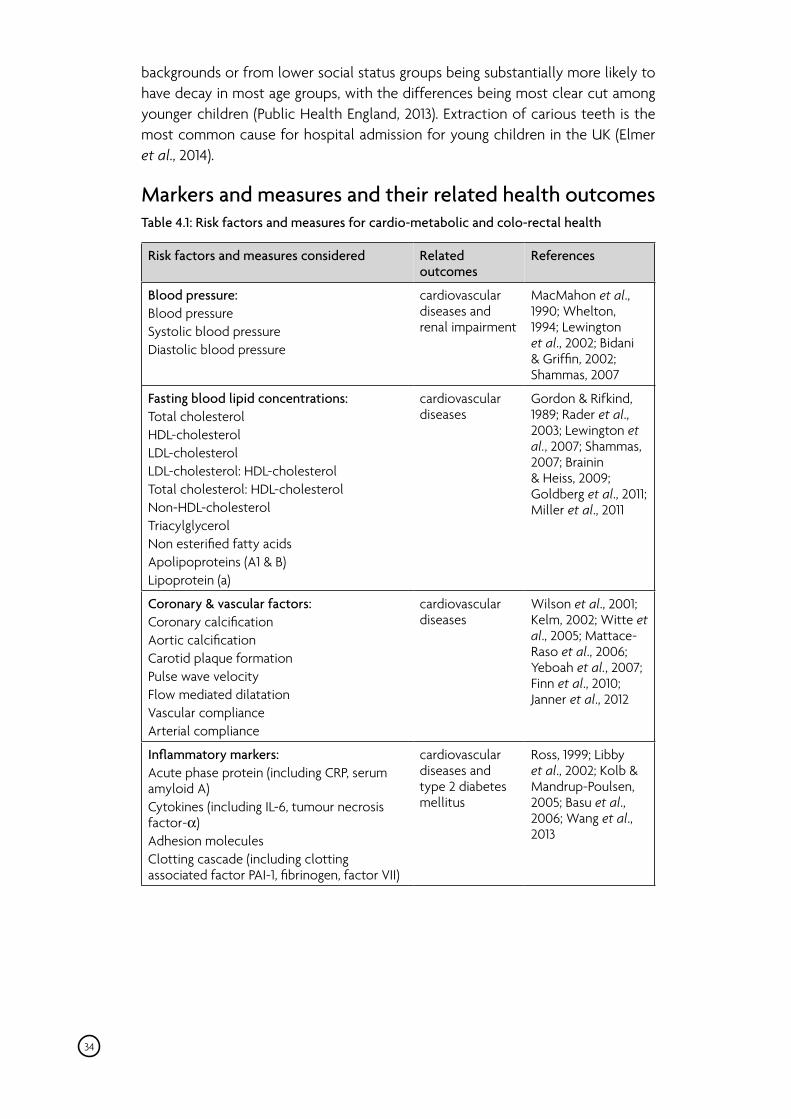
backgrounds or from lower social status groups being substantially more likely to have decay in most age groups, with the differences being most clear cut among younger children (Public Health England, 2013). Extraction of carious teeth is the most common cause for hospital admission for young children in the UK (Elmer et al., 2014).
Markers and measures and their related health outcomes Table 4.1: Risk factors and measures for cardio-metabolic and colo-rectal health
Risk factors and measures considered Related outcomes
References
Blood pressure: Blood pressure Systolic blood pressure Diastolic blood pressure
cardiovascular diseases and renal impairment
MacMahon et al., 1990; Whelton, 1994; Lewington et al., 2002; Bidani & Griffin, 2002; Shammas, 2007
Fasting blood lipid concentrations: Total cholesterol HDL-cholesterol LDL-cholesterol LDL-cholesterol: HDL-cholesterol Total cholesterol: HDL-cholesterol Non-HDL-cholesterol Triacylglycerol Non esterified fatty acids Apolipoproteins (A1 & B) Lipoprotein (a)
cardiovascular diseases
Gordon & Rifkind, 1989; Rader et al., 2003; Lewington et al., 2007; Shammas, 2007; Brainin & Heiss, 2009; Goldberg et al., 2011; Miller et al., 2011
Coronary & vascular factors: Coronary calcification Aortic calcification Carotid plaque formation Pulse wave velocity Flow mediated dilatation Vascular compliance Arterial compliance
cardiovascular diseases
Wilson et al., 2001; Kelm, 2002; Witte et al., 2005; Mattace-Raso et al., 2006; Yeboah et al., 2007; Finn et al., 2010; Janner et al., 2012
Inflammatory markers: Acute phase protein (including CRP, serum amyloid A) Cytokines (including IL-6, tumour necrosis factor-α) Adhesion molecules Clotting cascade (including clotting associated factor PAI-1, fibrinogen, factor VII)
cardiovascular diseases and type 2 diabetes mellitus
Ross, 1999; Libby et al., 2002; Kolb & Mandrup-Poulsen, 2005; Basu et al., 2006; Wang et al., 2013
34
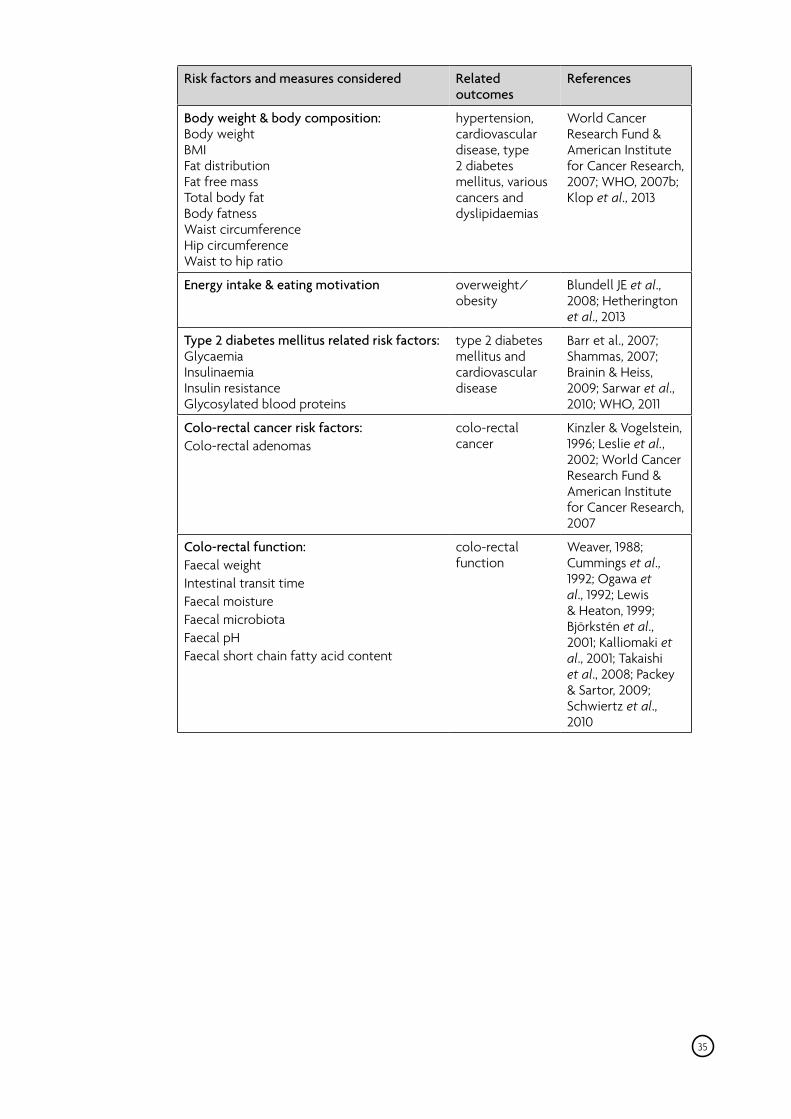
Risk factors and measures considered Related outcomes
References
Body weight & body composition: Body weight BMI Fat distribution Fat free mass Total body fat Body fatness Waist circumference Hip circumference Waist to hip ratio
hypertension, cardiovascular disease, type 2 diabetes mellitus, various cancers and dyslipidaemias
World Cancer Research Fund & American Institute for Cancer Research, 2007; WHO, 2007b; Klop et al., 2013
Energy intake & eating motivation overweight/ obesity
Blundell JE et al., 2008; Hetherington et al., 2013
Type 2 diabetes mellitus related risk factors: Glycaemia Insulinaemia Insulin resistance Glycosylated blood proteins
type 2 diabetes mellitus and cardiovascular disease
Barr et al., 2007; Shammas, 2007; Brainin & Heiss, 2009; Sarwar et al., 2010; WHO, 2011
Colo-rectal cancer risk factors: Colo-rectal adenomas
colo-rectal cancer
Kinzler & Vogelstein, 1996; Leslie et al., 2002; World Cancer Research Fund & American Institute for Cancer Research, 2007
Colo-rectal function: Faecal weight Intestinal transit time Faecal moisture Faecal microbiota Faecal pH Faecal short chain fatty acid content
colo-rectal function
Weaver, 1988; Cummings et al., 1992; Ogawa et al., 1992; Lewis & Heaton, 1999; Björkstén et al., 2001; Kalliomaki et al., 2001; Takaishi et al., 2008; Packey & Sartor, 2009; Schwiertz et al., 2010
35
5 Total carbohydrates
5.1 This assessment is based on prospective cohort studies and randomised controlled trials investigating the relationship between total carbohydrate intake and cardio-metabolic, colo-rectal and oral health outcomes. Links to the individual systematic reviews and update search are given in Annex 1.
5.2 Evidence on health/disease outcomes has been discussed in detail only where there are sufficient data for a conclusion to be drawn from studies meeting the pre-agreed inclusion criteria. Outcomes where there are too few studies to reach a conclusion are listed at the end of the chapter (see Tables 5.1 and 5.2). Outcomes where the evidence was considered too inconsistent to make a valid judgement are also listed at the end of the chapter (see Tables 5.3 and 5.4).
5.3 Prospective cohort studies included in this chapter either provide data on total carbohydrate intake, as g/day or % energy, or on dietary patterns. For dietary patterns, a low-carbohydrate-diet score based on the percentage of energy from carbohydrate, fat and/or protein in the diet has been constructed: the higher the score, the more closely the participant followed a low carbohydrate diet. Alternatively, cohort studies have used substitution models to observe the outcome of replacing fat with total carbohydrate or lower, medium or higher glycaemic index carbohydrates.
5.4 For the prospective cohort study meta-analyses the relative risks for total carbohydrate intake are presented for either each 8% energy or each 70g/day increase, both equivalent to approximately one standard deviation in adult carbohydrate intake, as based on UK data from the National Diet and Nutrition Survey (Bates et al., 2009).
5.5 The randomised controlled trials considered in this section involve manipulating the macronutrient composition of the diet so that subjects consume differing proportions of total carbohydrate. Where there are only a few studies, the evidence has been considered under a heading of higher carbohydrate diets. If there are enough trials, these have been grouped into three main categories according to whether the dominant dietary change was in total carbohydrate and fat, total carbohydrate and protein or whether the changes involved all three macronutrients. The mean macronutrient intakes values from NDNS were used to determine whether intakes in the trials were high, average or low. For inclusion in a meta-analysis, a 5% difference in energy from total carbohydrate and a 2% difference in fat and/or protein are considered as being meaningful. Where possible, actual consumption is used rather than the intended diet.
5.6 Nearly all trials are conducted in overweight or obese individuals and the diets involve energy restriction goals and most trials result in weight loss. Consideration has been given to whether an effect indicated on the studied parameters could be due to greater weight loss in one of the experimental groups. This is particularly
36
important in trials assessing effects on cardio-metabolic risk markers, as weight loss and gain influence fasting insulin levels and insulin sensitivity (Weyer et al., 2000), blood pressure (Truesdale et al., 2008) and fasting blood lipids (Poobalan et al., 2004).
5.7 Nearly all the trials presenting evidence on diets differing in the proportion of carbohydrate to fat or fat and protein result in a reduction of saturated fatty acid intake in the higher carbohydrate group, as well as affecting the proportion of total fat in the diet. As variation in fat and fatty acid intake affects fasting blood lipid concentrations (Mensink et al., 2003) consideration has been given to whether an effect indicated on the studied parameters could be due to greater fat or saturated fatty acid intake in one of the experimental groups. The degree by which saturated fatty acid intakes are affected differs greatly between trials. For example in some trials saturated fatty acids are reduced and replaced with carbohydrate, whereas in others unsaturated fatty acids are replaced with carbohydrate, leading to different effects.
Adults Cardiovascular disease events
5.8 Four cohort studies were identified that presented evidence on total carbohydrate intake as % energy in relation to incident cardiovascular disease events (Farchi et al., 1995; Esrey et al., 1996; Liu et al., 2000c; Oh et al., 2005), three of which were included in a meta-analysis. One cohort study could not be included in the meta-analysis and indicated no significant association between carbohydrate intake as % energy and incident cardiovascular disease events (Farchi et al., 1995). Two cohort studies were identified in the update search (Nilsson et al., 2012; Wallstrom et al., 2012) (Cardio-metabolic review, cardiovascular disease chapter; Update search).
5.9 No significant association is indicated between carbohydrate intake as % energy and incidence of stroke and coronary events combined (RR 1.00, 95% CI 0.89, 1.12, for each 8% energy increase; p=0.97). The meta-analysis combines different cardiovascular events including both ischaemic and haemorrhagic strokes. These events have different aetiologies and associated risks. The two cohort studies identified in the update search indicate no significant association between carbohydrate intake as % energy and incidence of stroke and coronary events.
5.10 Four cohort studies were identified that presented evidence on total carbohydrate intake as g/day and incident cardiovascular disease events (Fehily et al., 1993; Esrey et al., 1996; Beulens et al., 2007; Drogan et al., 2007). Three cohort studies could not be included in a meta-analysis, which left an insufficient number of studies to provide a meta-analysis. No further studies were identified in the update search (Cardio-metabolic review, cardiovascular disease chapter).
5.11 No significant association is observed in any of the studies between total carbohydrate intake as g/day and cardiovascular disease events.
37
Total carbohydrate (g/day or % energy) and cardiovascular disease events
• No association • Moderate evidence
Total carbohydrate (g/day or % energy) and coronary events
• No association • Limited evidence
38
Coronary events 5.12 Three cohort studies were identified that presented evidence on total carbohydrate
intake as % energy and incidence of coronary events (Farchi et al., 1995; Esrey et al., 1996; Liu et al., 2000c). One cohort study could not be included in a meta-analysis (Farchi et al., 1995), which left an insufficient number of studies to provide a meta- analysis. No further cohort studies were identified in the update search (Cardio-metabolic review, cardiovascular disease chapter).
5.13 There is no consistent direction of association in these studies and overall they indicate no significant association between total carbohydrate intake as % energy and incidence of coronary heart disease.
5.14 Three cohort studies were identified that presented evidence on total carbohydrate intake as g/day and incidence of coronary events (Fehily et al., 1993; Esrey et al., 1996; Beulens et al., 2007). Two cohort studies could not be included in a meta-analysis, which left an insufficient number of studies to provide a meta-analysis. Two cohort studies were identified in the update search (Sieri et al., 2010; Burger et al., 2011) (Cardio-metabolic review, cardiovascular disease chapter; Update search).
5.15 The three cohort studies identified in the original review indicate no significant association between carbohydrate intake as g/day and incidence of coronary events. Of the two cohort studies identified in the update search, one indicates higher carbohydrate intake as g/day is associated with a higher incidence of coronary events in men, but not in women (Burger et al., 2011). The other study indicates higher incidence of coronary events in women, but not men, is associated with higher carbohydrate intake as g/day (Sieri et al., 2010).
Stroke 5.16 One cohort study was identified that presented evidence on total carbohydrate
intake as % energy and incident stroke events (Oh et al., 2005). One cohort study was identified in the update search (Wallstrom et al., 2012) (Cardio-metabolic review, cardiovascular disease chapter; Update search).
5.17 No significant association is indicated between total carbohydrate intake as % energy and incident stroke events in either study.
5.18 Two cohort studies were identified in the update search that presented evidence on total carbohydrate intake as g/day and incidence of stroke (Oba et al., 2010a; Burger et al., 2011) (Update search).
5.19 No significant association is indicated between total carbohydrate intake as g/ day and incident stroke events in either study. There is inadequate evidence to distinguish the impact of total carbohydrate consumption on ischaemic or haemorrhagic stroke separately.
Total carbohydrate (g/day or % energy) and stroke
• No association • Limited evidence
Vascular function 5.20 Three randomised controlled trials were identified that presented evidence on
diets differing in the proportion of carbohydrate in relation to flow mediated dilatation, all of which were included in a meta-analysis (Keogh et al., 2007; Keogh et al., 2008; Phillips et al., 2008). One trial was identified in the update search (Wycherley et al., 2010) (Cardio-metabolic review, vascular function chapter; Update search).
5.21 No significant effect is demonstrated for diets differing in the proportion of carbohydrate in relation to flow mediated dilatation (0.68% difference between groups, 95% CI -0.47, 1.83; p=0.25). The trial identified in the update search reports a decrease in flow mediated dilatation in the lower carbohydrate group compared with the lower fat (higher carbohydrate) group. All trials employ energy restricted weight loss diets with wide ranges of both carbohydrate (between 5% and 60% energy) and fat intakes (between 18% and 37% energy) between groups.
Higher carbohydrate diets and vascular function
• No effect • Limited evidence
39
Blood pressure 5.22 Thirty one randomised controlled trials were identified that presented evidence
on diets differing in the proportion of carbohydrate in relation to blood pressure. Five trials were not included in any of the meta-analyses: one trial (Tinker et al., 2008) duplicated the results of the study by Howard et al., (2006); three trials (Wolever & Mehling, 2002; O’Brien et al., 2005; Noakes et al., 2006) did not provide sufficient information and one trial was excluded because the differences in carbohydrate intake were less than 5% energy between groups (Dale et al., 2009) (Cardio-metabolic review, incident hypertension and blood pressure chapter). The trials have been stratified according to whether fat or protein, or both, were adjusted as a result of changes in carbohydrate intake.
Higher carbohydrate, lower fat diets and systolic blood pressure
• No effect • Adequate evidence
Higher carbohydrate, lower fat diets and diastolic blood pressure
• No effect • Adequate evidence
40
Higher carbohydrate and lower fat diets compared with lower carbohydrate higher fat diets
5.23 Fourteen randomised controlled trials were identified that presented evidence on diets differing in the proportion of carbohydrate to fat on blood pressure, all of which were included in the meta-analysis (Golay et al., 2000; Foster et al., 2003; Lovejoy et al., 2003; Clifton et al., 2004; Ley et al., 2004; Dansinger et al., 2005; Ebbeling et al., 2005; Howard et al., 2006b; Ebbeling et al., 2007; Gardner et al., 2007; Maki et al., 2007b; Phillips et al., 2008; Frisch et al., 2009; Sacks et al., 2009). Five trials were identified in the update search (Foster et al., 2010; Gulseth et al., 2010; Jebb et al., 2010; Howard et al., 2010; Brooking et al., 2012). All trials report effects on systolic and diastolic blood pressure, except one that reported effects on diastolic blood pressure only (Howard et al., 2010) (Cardio-metabolic review, incident hypertension and blood pressure chapter; Update search).
5.24 No significant effect is demonstrated for diets differing in the proportion of carbohydrate to fat on systolic blood pressure at the end of the intervention (0.71mmHg, 95% CI -0.71, 2.14; p=0.33). Of the five trials identified in the update search, three report no significant effect of diets differing in the proportion of carbohydrate to total fat on systolic blood pressure (Gulseth et al., 2010; Jebb et al., 2010; Brooking et al., 2012). The other two trials provide follow-up measures from trials already included in the meta-analysis and report no significant effect on systolic blood pressure (Foster et al., 2010; Howard et al., 2010). Nearly all trials employ energy restricted weight loss diets that varied both carbohydrate (from 5% to 65% energy) and fat (from 20% to 40% energy) between groups.
5.25 No significant effect is demonstrated for diets differing in the proportion of carbohydrate to fat on diastolic blood pressure (0.02mmHg, 95% CI -0.81, 0.86; p=0.96). Of the four trials identified in the update search which reported on diastolic blood pressure, three report no significant effect of diets differing in the proportion of carbohydrate to total fat on diastolic blood pressure (Gulseth et al., 2010; Jebb et al., 2010; Brooking et al., 2012). The other trial provides follow-up measures from trials already included in the meta-analysis and reports no significant effect on diastolic blood pressure (Foster et al., 2010). Nearly all trials employ energy restricted weight loss diets that varied both carbohydrate (from 5% to 65% energy) and fat (from 20% to 40% energy) between groups.
Higher carbohydrate, average protein diets compared with lower carbohydrate higher protein diets
5.26 Four randomised controlled trials were identified that presented evidence on diets differing in the proportion of carbohydrate to protein on systolic and diastolic blood pressure, all of which were included in the meta-analysis (Appel et al., 2005; Leidy et al., 2007; Claessens et al., 2009; Delbridge et al., 2009). Three trials were identified in the update search (Aldrich et al., 2011; Gogebakan et al., 2011; Toscani et al., 2011) (Cardio-metabolic review, incident hypertension and blood pressure chapter; Update search). The proportion of carbohydrate in the diets varies between 40-62% energy and protein varies between 15-30% energy.
5.27 An effect is demonstrated, with higher carbohydrate, average protein diets resulting in less of a reduction in systolic blood pressure (2.17mmHg, 95% CI 0.08, 4.25; p=0.04) as compared with the lower carbohydrate, higher protein diets. Body weight is kept constant in one of the trials (Appel et al., 2005), but the other three are weight loss trials. When the difference in weight loss between experimental groups in these trials is plotted on a forest plot it is proportional for each trial to the relative reduction in systolic blood pressure. It is not possible, therefore, to exclude confounding by concomitant weight loss on the effect on systolic blood pressure. The trials identified in the update search report no significant effect of diets differing in the proportion of carbohydrate to protein on systolic blood pressure.
Higher carbohydrate, average protein diets and systolic blood pressure
• Effect • Limited evidence • A higher carbohydrate, average protein diet may result in less of a reduction in systolic blood pressure as compared with a lower carbohydrate, higher protein diet, but it is not possible to exclude confounding by other variables, e.g. less weight loss in one of the experimental groups • The effect is biologically relevant
5.28 No significant effect is demonstrated for diets differing in the proportion of carbohydrate to protein on diastolic blood pressure (0.81mmHg, 95% CI -0.83, 2.46; p=0.33). The three trials identified in the update search report no significant effect of diets differing in the proportion of carbohydrate to protein on diastolic blood pressure.
Higher carbohydrate, average protein diets and diastolic blood pressure
• No effect • Limited evidence
41
Higher carbohydrate, lower fat and average protein diets compared with lower carbohydrate, average or higher fat and higher protein diets
5.29 Seven randomised controlled trials were identified that presented evidence on diets differing in the proportion of carbohydrate to protein and fat on systolic and diastolic blood pressure, all of which were included in the meta-analysis (Brehm et al., 2003; Meckling et al., 2004; Brehm et al., 2005; Keogh et al., 2007; Meckling & Sherfey, 2007; Keogh et al., 2008; de Luis et al., 2009b). Two trials were identified in the update search (Lim et al., 2010; Wood et al., 2012) (Cardio-metabolic review, incident hypertension and blood pressure chapter; Update search).
5.30 No significant effect is demonstrated for diets differing in the proportion of carbohydrate to protein and fat on systolic blood pressure (0.55mmHg, 95% CI -3.01, 1.91; p=0.44). One of the trials identified in the update search reported no significant effect of diets differing in the proportion of carbohydrate to protein and fat on systolic blood pressure. The other trial reported a significant decrease in systolic blood pressure with very low carbohydrate, very low fat and high unsaturated fat diets compared to the control diet; however, there was no significant difference between the intervention groups (Lim et al., 2010). All trials employ energy restricted weight loss diets that varied carbohydrate (from 12% to 57% energy), fat (from 54% to 20% energy) and protein (from 18% to 37% energy) between groups.
Higher carbohydrate, lower fat, average protein diets and systolic blood pressure
• No effect • Adequate evidence
5.31 No significant effect is demonstrated for diets differing in the proportion of carbohydrate to protein and fat on diastolic blood pressure (1.16mmHg, 95% CI -0.96, 3.27; p=0.29). One of the trials identified in the update search report no significant effect of diets differing in the proportion of carbohydrate to protein and fat on diastolic blood pressure. The other trial reported a significant decrease in diastolic blood pressure with very low carbohydrate, very low fat and high unsaturated fat diets compared to the control diet; however, there was no significant difference between the intervention groups (Lim et al., 2010). All trials employ energy restricted weight loss diets that varied carbohydrate (from 12% to 57% energy), fat (from 54% to 20% energy) and protein (from 18% to 37% energy) between groups.
Higher carbohydrate, lower fat, average protein diets and diastolic blood pressure
• No effect • Adequate evidence
42
Fasting blood lipids 5.32 Fifty eight randomised trials were identified that presented evidence on diets
differing in the proportion of carbohydrate on fasting blood lipid concentration. The outcomes examined were fasting total cholesterol, LDL-cholesterol, HDL-cholesterol, triacylglycerol, total cholesterol: HDL-cholesterol ratio and LDL-cholesterol: HDL-cholesterol ratio. For fasting total cholesterol concentration, ten trials could not be included in a meta-analysis as they did not report sufficient information (Peterson & Jovanovic-Peterson, 1995; Wolever & Mehling, 2002; Drummond et al., 2003; Foster et al., 2003; O’Brien et al., 2005; Johnston et al., 2006; Dyson et al., 2007; Kirkwood et al., 2007; Dale et al., 2009; Layman et al., 2009) (Cardio-metabolic review, hyper lipidaemias and blood lipids chapter). For fasting LDL-cholesterol concentration, six trials could not be included in a meta-analysis as they did not report sufficient information (Wolever & Mehling, 2002; Johnston et al., 2006; Kirkwood et al., 2007; Dyson et al., 2007; Lasker et al., 2008; Layman et al., 2009) and for triacylglycerol concentration, eight trials could not be included in a meta-analysis as they did not report sufficient information (Peterson & Jovanovic-Peterson, 1995; Wolever & Mehling, 2002; Johnston et al., 2006; Kirkwood et al., 2007; Dyson et al., 2007; Lasker et al., 2008; Dale et al., 2009; Layman et al., 2009) (Cardio-metabolic review, hyperlipidaemias and blood lipids chapter). The trials have been stratified according to whether fat or protein, or both, were adjusted as a result of changes in carbohydrate intake.
Higher carbohydrate and lower fat diets compared with lower carbohydrate higher fat diets
Fasting total cholesterol 5.33 Nineteen randomised controlled trials that presented evidence on diets differing
in the proportion of carbohydrate to fat on fasting total cholesterol were included in the meta-analysis (Campos et al., 1995; Nelson et al., 1995; Ginsberg et al., 1998; Turley et al., 1998; Zambon et al., 1999; Golay et al., 2000; Colette et al., 2003; Couture et al., 2003; Lovejoy et al., 2003; Clifton et al., 2004; Ley et al., 2004; Pelkman et al., 2004; Segal-Isaacson et al., 2004; Cornier et al., 2005; Lofgren et al., 2005; Petersen et al., 2006; Howard et al., 2006b; Due et al., 2008b; Frisch et al., 2009). Four trials were identified in the update search (Jebb et al., 2010; Howard et al., 2010; Haufe et al., 2011; Brooking et al., 2012) (Cardio-metabolic review, hyperlipidaemias and blood lipids chapter; Update search).
5.34 An effect is demonstrated, with diets higher in carbohydrate and lower in fat decreasing fasting total cholesterol concentration (-0.16mmol/L, 95% CI -0.28, -0.04; p=0.01), but in some of the trials that also result in weight loss in both experimental groups, a difference in the reduction of fasting total cholesterol concentration is reported. The diets vary both in carbohydrate (between 5% and 65% energy) and fat (between 18% and 40% energy), including saturated fatty acid intakes, between groups. Saturated fatty acid intakes, in particular, are reduced in most of the higher carbohydrate diets. In those trials which try to maintain saturated fatty acid intakes at similar levels between experimental groups there
43
is still a lower intake of between 1-3% energy in the higher carbohydrate diets (Golay et al., 2000; Couture et al., 2003; Colette et al., 2003; Pelkman et al., 2004; Appel et al., 2005; Due et al., 2008; Jebb et al., 2010; de Souza et al., 2012). It is not possible, therefore, to exclude confounding by concomitant decreases in saturated fatty acid intake or possibly weight loss on the effect on fasting total cholesterol concentration. Of the trials identified in the update search, two report no significant effect of diets differing in the proportion of carbohydrate and fat on fasting total cholesterol concentration (Howard et al., 2010; Brooking et al., 2012). One reports a higher carbohydrate and lower fat diet to reduce fasting total cholesterol concentration as compared with a lower carbohydrate and higher fat diet, with a higher saturated fatty acid content, but not a higher monounsaturated fatty acid content (Jebb et al., 2010). The other trial reports weight loss in both experimental groups and a higher carbohydrate and lower fat diet result in a greater reduction in fasting total cholesterol concentration as compared with a lower carbohydrate and higher fat diet (Haufe et al., 2011).
5.35 A meta-analysis has been conducted for fasting LDL-cholesterol concentration, but the heterogeneity is above the pre-specified cut-off of 75% (I2=76%) and, therefore, the pooled estimate has not been reported. There is, however, no evidence of an effect of higher carbohydrate, lower fat diets on fasting LDL-cholesterol concentration, which is inconsistent with effects on fasting total cholesterol concentration (Cardio-metabolic review, hyperlipidaemias and blood lipids chapter).
Higher carbohydrate, lower fat diets and fasting total cholesterol concentration
• Effect • Adequate evidence • A diet higher in carbohydrate and lower in fat may decrease fasting total cholesterol
concentration, but it is not possible to exclude confounding by other variables, e.g. a concomitant reduction in saturated fat intake and/or weight loss
• The effect is biologically relevant
Fasting LDL-cholesterol 5.36 Twenty randomised controlled trials that presented evidence on diets differing in
the proportion of carbohydrate to fat on fasting LDL cholesterol were included in the meta-analysis (Campos et al., 1995; Nelson et al., 1995; Ginsberg et al., 1998; Turley et al., 1998; Zambon et al., 1999; Colette et al., 2003; Couture et al., 2003; Foster et al., 2003; Lovejoy et al., 2003; Clifton et al., 2004; Ley et al., 2004; Pelkman et al., 2004; Segal-Isaacson et al., 2004; Cornier et al., 2005; Bhargava, 2006; Howard et al., 2006; Petersen et al., 2006; Ebbeling et al., 2007; Due et al., 2008; Frisch et al., 2009). Six trials were identified in the update search (Jebb et al., 2010; Howard et al., 2010; Foster et al., 2010; Haufe et al., 2011; de Souza et al., 2012; Brooking et al., 2012) (Cardio-metabolic review, hyperlipidaemias and blood lipids chapter; Update search).
5.37 A meta-analysis has been conducted for fasting LDL-cholesterol concentration, but the heterogeneity is above the pre-specified cut-off of 75% (I2=76%) and, therefore, the pooled estimate has not been reported. There is, however, no
44
evidence of an effect of higher carbohydrate, lower fat diets on fasting LDL-cholesterol concentration, which is inconsistent with effects on fasting total cholesterol concentration (Cardio-metabolic review, hyperlipidaemias and blood lipids chapter). Of the trials identified in the update search, four report no significant effect of diets differing in the proportion of carbohydrate to fat on fasting LDL-cholesterol concentration (Howard et al., 2010; Haufe et al., 2011; de Souza et al., 2012; Brooking et al., 2012). One trial reports a decrease in fasting LDL-cholesterol concentration on the higher total carbohydrate, lower fat diet compared with the lower carbohydrate, higher fat diets (both higher saturated and higher monounsaturated fatty acid diets) (Jebb et al., 2010). A follow-up of a trial included in the meta-analysis reports fasting LDL-cholesterol concentration to be lower after the higher carbohydrate, lower fat diet as compared with the lower carbohydrate, lower fat diet (Foster et al., 2010).
Higher carbohydrate, lower fat diets and fasting LDL-cholesterol concentration
• No effect • Adequate evidence
45
Fasting HDL-cholesterol 5.38 Twenty two randomised controlled trials that presented evidence on diets differing
in the proportion of carbohydrate to fat on fasting HDL-cholesterol were included in the meta-analysis (Campos et al., 1995; Nelson et al., 1995; Ginsberg et al., 1998; Turley et al., 1998; Zambon et al., 1999; Golay et al., 2000; Wolever & Mehling, 2002; Foster et al., 2003; Colette et al., 2003; Couture et al., 2003; Lovejoy et al., 2003; Clifton et al., 2004; Ley et al., 2004; Pelkman et al., 2004; Segal-Isaacson et al., 2004; Cornier et al., 2005; Bhargava, 2006; Petersen et al., 2006; Howard et al., 2006b; Ebbeling et al., 2007; Due et al., 2008b; Frisch et al., 2009). Six trials were identified in the update search (Jebb et al., 2010; Howard et al., 2010; Foster et al., 2010; Haufe et al., 2011; de Souza et al., 2012; Brooking et al., 2012) (Cardio-metabolic review, hyperlipidaemias and blood lipids chapter; Update search).
5.39 No significant effect is demonstrated for diets differing in the proportion of carbohydrate and fat on fasting HDL-cholesterol concentration (0.03mmol/L, 95% CI -0.06, 0.01; p=0.11). Several of the trials were weight loss trials and diets vary both carbohydrate (between 5% and 65% energy) and fat (between 18% and 40% energy) between groups. Of the trials identified in the update search, four report no significant effect of diets differing in the proportion of carbohydrate to fat on fasting HDL-cholesterol concentration (Howard et al., 2010; Haufe et al., 2011; de Souza et al., 2012; Brooking et al., 2012). One trial reports a decrease in fasting HDL-cholesterol concentration on the higher total carbohydrate, lower fat diet compared with the lower carbohydrate, higher fat diets (both higher saturated and higher monounsaturated fatty acid diets) (Jebb et al., 2010). A follow-up of a trial included in the meta-analysis reports fasting HDL-cholesterol concentration to be lower after the higher carbohydrate, lower fat diet as compared with the lower carbohydrate, lower fat diet (Foster et al., 2010).
Higher carbohydrate, lower fat diets and fasting HDL-cholesterol concentration
• No effect • Adequate evidence
Fasting total cholesterol:HDL-cholesterol ratio 5.40 Five randomised controlled trials that presented evidence on diets differing in the
proportion of carbohydrate to fat on fasting total cholesterol:HDL-cholesterol ratio were included in the meta-analysis (Ginsberg et al., 1998; Colette et al., 2003; Ley et al., 2004; Pelkman et al., 2004; Howard et al., 2006b). One trial was identified in the update search (Foster et al., 2010) (Cardio-metabolic review, hyperlipidaemias and blood lipids chapter; Update search).
5.41 A revised meta-analysis was conducted subsequent to the cardio-metabolic health review because the mean difference values used for one of the trials (Howard et al., 2006) were incorrect (Annex 1, additional meta-analyses). The results from the revised meta-analysis are reported below. No statistically significant effect was demonstrated with higher carbohydrate, lower fat diets compared with lower carbohydrate, higher fat diets on fasting total cholesterol:HDL-cholesterol ratio (-0.03, 95% CI -0.12, 0.05; p=0.73). The diets varied both carbohydrate (between 40% and 64% energy) and fat (between 18% and 39% energy), including saturated fatty acid intakes, between groups. The trial identified in the update search reports no significant difference in effect on the total cholesterol:HDL-cholesterol ratio between dietary groups (Foster et al., 2010).
Higher carbohydrate, lower fat diets and fasting total cholesterol:HDL-cholesterol ratio
• No effect • Moderate evidence
Fasting LDL-cholesterol:HDL-cholesterol ratio 5.42 Five randomised controlled trials that presented evidence on diets differing in
the proportion of carbohydrate to fat on fasting LDL-cholesterol:HDL-cholesterol ratio were included in the meta-analysis (Turley et al., 1998; Zambon et al., 1999; Colette et al., 2003; Pelkman et al., 2004; Due et al., 2008b) (Cardio-metabolic review, hyperlipidaemias and blood lipids chapter).
5.43 No significant effect is demonstrated for higher carbohydrate lower fat diets compared with lower carbohydrate higher fat diets on fasting LDL-cholesterol:HDL-cholesterol ratio (0.04, 95% CI -0.36, 0.44; p=0.84). The diets vary both carbohydrate (between 40% and 64% energy) and fat (between 18% and 39% energy) between groups.
46
Higher carbohydrate, lower fat diets and fasting LDL-cholesterol:HDL-cholesterol ratio
• No effect • Moderate evidence
Higher carbohydrate, average protein diets compared with lower carbohydrate higher protein diets
Fasting total cholesterol 5.44 Six randomised controlled trials that presented evidence on diets differing in the
proportion of carbohydrate to protein on fasting total cholesterol were included in the meta-analysis (Due et al., 2004; Appel et al., 2005; Noakes et al., 2005; Leidy et al., 2007; Claessens et al., 2009; Delbridge et al., 2009). Two trials were identified in the update search (Toscani et al., 2011; Gogebakan et al., 2011) (Cardio-metabolic review, hyperlipidaemias and blood lipids chapter; Update search). The proportion of carbohydrate in the diets varies from 40-63% energy and protein varies from 14-31% energy.
5.45 An effect is demonstrated, with higher carbohydrate, average protein diets resulting in less of a reduction in fasting total cholesterol concentration (0.15mmol/L, 95% CI 0.01, 0.28; p=0.03) as compared with the lower carbohydrate, higher protein diet. Of the six trials identified, body weight increases in one (Delbridge et al., 2009), is kept constant in another (Appel et al., 2005) and the remaining four are weight loss trials. When the difference in weight loss between experimental groups in these trials is plotted on a forest plot it is proportional for each trial to the change in fasting blood cholesterol. The heterogeneity is above the pre-specified cut-off of 75% (I2=97%) and, therefore, the pooled estimate is not reported. It is not possible, therefore, to exclude confounding by concomitant weight loss on the effect on fasting total cholesterol. The trials identified in the update search report no significant effect of diets differing in the proportion of carbohydrate to protein on fasting total cholesterol concentration.
Higher carbohydrate, average protein diets and fasting total cholesterol concentration
• Effect • Limited evidence • A higher carbohydrate, average protein diet may result in less of a reduction in fasting cholesterol concentration as compared with the lower carbohydrate, higher protein diet, but it is not possible to exclude confounding by other variables, e.g. less weight loss in one of the experimental groups • The effect is biologically relevant
47
Fasting HDL-cholesterol 5.46 Five randomised controlled trials that presented evidence on diets differing in the
proportion of carbohydrate to protein on fasting HDL-cholesterol concentration were included in the meta-analysis (Due et al., 2004; Appel et al., 2005; Noakes et al., 2005; Claessens et al., 2009; Delbridge et al., 2009). Two trials were identified in the update search (Toscani et al., 2011; Gogebakan et al., 2011) (Cardio-metabolic review, hyperlipidaemias and blood lipids chapter; Update search). The proportion of carbohydrate in the diets varies from 40-63% energy and protein varies from 14-31% energy.
5.47 No significant effect is demonstrated for diets differing in the proportion of carbohydrate to protein on fasting HDL-cholesterol concentration (0.0mmol/L, 95% CI -0.04, 0.04; p=0.98). The trials identified in the update search report no significant effect of diets differing in the proportion of carbohydrate to protein on fasting HDL-cholesterol concentration.
Higher carbohydrate, average protein diets and fasting HDL-cholesterol concentration
• No effect • Adequate evidence
Fasting LDL-cholesterol 5.48 Five randomised controlled trials that presented evidence on diets differing in the
proportion of carbohydrate to protein on fasting LDL-cholesterol concentration were included in the meta-analysis (Due et al., 2004; Appel et al., 2005; Noakes et al., 2005; Claessens et al., 2009; Delbridge et al., 2009). Two trials were identified in the update search (Toscani et al., 2011; Gogebakan et al., 2011) (Cardio-metabolic review, hyperlipidaemias and blood lipids chapter; Update search). The proportion of carbohydrate in the diets varies from 40-63% energy and protein varies from 14-31% energy.
5.49 No significant effect is demonstrated for diets differing in the proportion of carbohydrate to protein on fasting LDL-cholesterol concentration (0.06mmol/L, 95% CI -0.03, 0.16; p=0.20). The trials identified in the update search report no significant effect of diets differing in the proportion of carbohydrate to protein on fasting LDL-cholesterol concentration.
Higher carbohydrate, average protein diets and fasting LDL-cholesterol concentration
• No effect • Adequate evidence
48
Fasting triacylglycerol 5.50 Six randomised controlled trials that presented evidence on diets differing in the
proportion of carbohydrate to protein on fasting triacylglycerol concentration were included in the meta-analysis (Due et al., 2004; Appel et al., 2005; Noakes et al., 2005; Leidy et al., 2007; Claessens et al., 2009; Delbridge et al., 2009). Two trials were identified in the update search (Toscani et al., 2011; Gogebakan et al., 2011) (Cardio-metabolic review, hyperlipidaemias and blood lipids chapter; Update search). The proportion of carbohydrate in the diets varies from 40-63% energy and protein varies from 14-31% energy.
5.51 An effect is demonstrated, with higher carbohydrate, average protein diets resulting in less of a reduction in fasting triacylglycerol concentration (0.18mmol/L, 95% CI 0.07, 0.29; p=0.001) as compared with the lower carbohydrate, higher protein diet. The effect could be due to difference in weight loss between the experimental groups, as discussed in paragraphs 5.27 and 5.45 above, in relation to systolic blood pressure and fasting total cholesterol concentration. It is not possible, therefore,
to exclude confounding by concomitant weight loss on the effect on fasting triacylglycerol. The trials identified in the update search report no significant effect of diets differing in the proportion of carbohydrate to protein on fasting triacylglycerol concentration.
Higher carbohydrate, average protein diets and fasting triacylglycerol concentration
• Effect • Limited evidence • A higher carbohydrate, average protein diet may result in less of a reduction in fasting triacylglycerol concentration as compared with the lower carbohydrate, higher protein diet, but it is not possible to exclude confounding by other variables, e.g. less weight loss in one of the experimental groups • The effect is biologically relevant
49
Fasting total cholesterol 5.52 Twenty three randomised controlled trials that presented evidence on diets
differing in the proportion of carbohydrate to protein and fat on fasting total cholesterol were included in the meta-analysis (Clevidence et al., 1992; Golay et al., 1996; Brehm et al., 2003; Johnston et al., 2004; Meckling et al., 2004; Sharman et al., 2004; Brehm et al., 2005; Dansinger et al., 2005; Ebbeling et al., 2005; Layman et al., 2005; Krauss et al., 2006; McMillan-Price et al., 2006; Noakes et al., 2006; Keogh et al., 2007; Mahon et al., 2007; Meckling & Sherfey, 2007; Maki et al., 2007b; Keogh et al., 2008; Lasker et al., 2008; Phillips et al., 2008; Stoernell et al., 2008; Sacks et al., 2009; de Luis et al., 2009b). Two trials were identified in the update search (Lim et al., 2010; Wycherley et al., 2010) (Cardio-metabolic review, hyperlipidaemias and blood lipids chapter; Update search).
5.53 An effect is demonstrated, with higher carbohydrate, lower fat, average protein diets resulting in a decrease in fasting total cholesterol concentration (-0.26mmol/L, 95% CI -0.40, -0.12; p<0.001), but in some of the trials that also result in weight loss in both experimental groups a difference in the reduction of fasting total cholesterol concentration is reported. The trials vary carbohydrate (from 4% to 67% energy), fat (from 10% to 54% energy), including saturated fatty acid intakes, and protein (from 18% to 37% energy) between groups. Saturated fatty acid intakes, in particular, are reduced in most of the higher carbohydrate diets, although weight loss differences between experimental groups appears to be less of an issue. In the trials which try to maintain saturated fatty acid intakes at similar levels between experimental groups there is still a lower intake of between 1-3% energy in the higher carbohydrate diets (Golay et al., 1996; Krauss et al., 2006; Mahon et al., 2007; Stoernell et al., 2008; Sacks et al., 2009; de Souza et al., 2012). It is not possible, therefore, to exclude confounding by concomitant decreases in saturated fatty acid intake on the effect on fasting total cholesterol concentration. One trial identified in the update search reported a significant decrease in total cholesterol with very low carbohydrate, very low fat and high unsaturated fat diets compared to the control diet (Lim et al., 2010). The other trial reported a significantly greater increase in total cholesterol with a low carbohydrate diet compared to a high carbohydrate low fat diet (Wycherley et al., 2010).
Higher carbohydrate, lower fat, average protein diets and fasting total cholesterol concentration
• Effect • Adequate evidence • A higher carbohydrate, lower fat, average protein diet may decrease fasting total
cholesterol concentration, but it is not possible to exclude confounding by other variables, e.g. a concomitant reduction in saturated fat intake and/or weight loss
• The effect is biologically relevant
Fasting HDL-cholesterol 5.54 Twenty seven randomised controlled trials that presented evidence on diets differing
in the proportion of carbohydrate to protein and fat on fasting HDL-cholesterol were included in the meta-analysis (Clevidence et al., 1992; Golay et al., 1996; Brehm et al., 2003; Johnston et al., 2004; Pereira et al., 2004; Sharman et al., 2004; Meckling et al., 2004; Brehm et al., 2005; Ebbeling et al., 2005; Layman et al., 2005; Appel et al., 2005; Krauss et al., 2006; McMillan-Price et al., 2006; Noakes et al., 2006; Keogh et al., 2007; Gardner et al., 2007; Leidy et al., 2007; Mahon et al., 2007; Meckling & Sherfey, 2007; Maki et al., 2007b; Keogh et al., 2008; Phillips et al., 2008; Stoernell et al., 2008; Layman et al., 2009; Morgan et al., 2009; Sacks et al., 2009; de Luis et al., 2009b). Three trials were identified in the update search (Lim et al., 2010; Wycherley et al., 2010; Wood et al., 2012) (Cardio-metabolic review, hyperlipidaemias and blood lipids chapter; Update search).
5.55 An effect is demonstrated, with higher carbohydrate, lower fat, average protein diets decreasing fasting HDL-cholesterol concentration (-0.06mmol/L, 95% CI -0.01, -0.02; p=0.006), but in some of the trials that also result in weight loss in both experimental groups a lower relative increase of fasting HDL-cholesterol concentration is reported. Nearly all of the trials are weight loss trials. The trials vary carbohydrate (from 4% to 67% energy), fat (from 54% to 10% energy), including saturated fatty acid intakes, and protein (from 18% to 37% energy) between groups. The trials identified in the update search report no significant effect of diets differing in the proportion of carbohydrate to protein and fat on fasting HDL-cholesterol concentration.
5.56 The fat content of the diet may affect fasting HDL-cholesterol concentration, with higher intake raising concentrations, which may in turn be affected by fatty acid composition (Mensink et al., 2003).
Higher carbohydrate, lower fat, average protein diets and fasting HDL-cholesterol concentration
• Effect • Moderate evidence • A higher carbohydrate, lower fat, average protein diet may decrease fasting HDL-
cholesterol concentration, but it is not possible to exclude confounding by other variables, e.g. a concomitant reduction in fat intake
• The effect is biologically relevant
50
Fasting LDL-cholesterol 5.57 Twenty four randomised controlled trials that presented evidence on diets differing
in the proportion of carbohydrate to protein and fat on fasting LDL-cholesterol were included in the meta-analysis (Clevidence et al., 1992; Brehm et al., 2003; Johnston et al., 2004; Pereira et al., 2004; Sharman et al., 2004; Meckling et al., 2004; Brehm et al., 2005; Dansinger et al., 2005; Layman et al., 2005; Krauss et al., 2006; McMillan-Price et al., 2006; Noakes et al., 2006; Gardner et al., 2007; Keogh et al., 2007; Leidy et al., 2007; Mahon et al., 2007; Meckling & Sherfey, 2007; Maki et al., 2007b; Keogh et al., 2008; Phillips et al., 2008; Stoernell et al., 2008; Morgan et al., 2009; Sacks et al., 2009; de Luis et al., 2009b). Two trials were identified in the update search (Lim et al., 2010; Wycherley et al., 2010) (Cardio-metabolic review, hyperlipidaemias and blood lipids chapter; Update search).
5.58 An effect is demonstrated, with higher carbohydrate, lower fat, average protein diets decreasing fasting LDL-cholesterol concentration (-0.27mmol/L, 95% CI -0.36, -0.18; p<0.001), but in some of the trials a difference in the reduction of fasting HDL-cholesterol concentration is reported. Nearly all trials employ energy restricted weight loss diets. The trials vary carbohydrate (from 4% to 67% energy), fat (from 54% to 10% energy), including saturated fatty acid intakes, and protein (from 18% to 37% energy) between groups. Saturated fatty acid intakes, in particular, are reduced in most of the higher carbohydrate diets, although weight loss differences between experimental groups appears to be less of an issue (see paragraph 5.53). It is not possible, therefore, to exclude confounding by concomitant decreases in saturated fatty acid intake on the effect on fasting LDL-cholesterol concentration. The trials identified in the update search report that higher carbohydrate, lower fat, average protein including lower saturated fatty acid, diets reduce fasting LDL-cholesterol.
Higher carbohydrate, lower fat, average protein diets and fasting LDL-cholesterol concentration
• Effect • Adequate evidence • A higher carbohydrate, lower fat, average protein diet may decrease fasting LDL-cholesterol concentration, but it is not possible to exclude confounding by other variables, e.g. a concomitant reduction in saturated fat intake • The effect is biologically relevant
51
Fasting triacylglycerol 5.59 Twenty seven randomised controlled trials that presented evidence on diets
differing in the proportion of carbohydrate to protein and fat on fasting triacylglycerol were included in the meta-analysis (Clevidence et al., 1992; Golay et al., 1996; Brehm et al., 2003; Johnston et al., 2004; Pereira et al., 2004; Meckling et al., 2004; Sharman et al., 2004; Brehm et al., 2005; Dansinger et al., 2005; Ebbeling et al., 2005; Layman et al., 2005; O’Brien et al., 2005; Seshadri et al., 2005; Krauss et al., 2006; McMillan-Price et al., 2006; Noakes et al., 2006; Keogh et al., 2007; Gardner et al., 2007; Mahon et al., 2007; Meckling & Sherfey, 2007; Maki et al., 2007b; Keogh et al., 2008; Phillips et al., 2008; Stoernell et al., 2008; Morgan et al.,
2009; Sacks et al., 2009; de Luis et al., 2009b). Three trials were identified in the update search (Lim et al., 2010; Wycherley et al., 2010; Wood et al., 2012) (Cardio-metabolic review, hyperlipidaemias and blood lipids chapter; Update search).
5.60 An effect is demonstrated, with higher carbohydrate, average protein and lower fat diets resulting in less of a reduction in fasting triacylglycerol concentration, as indicated from the forest plot, but the heterogeneity is above the pre-specified cut-off of 75% (I2=82%) and, therefore, the pooled estimate is not reported. Nearly all trials employ energy restricted weight loss diets. The trials vary carbohydrate (from 4% to 67% energy), fat (from 54% to 10% energy), including saturated fatty acid intakes, and protein (from 18% to 37% energy) between groups. Of the trials identified in the update search two report no significant effect of diets differing in the proportion of carbohydrate to protein and fat on fasting triacylglycerol concentration. One reports an increase in fasting triacylglycerol concentration in response to a higher carbohydrate, average protein and lower fat diet (Wood et al., 2012).
5.61 The fat content of the diet affects fasting triacylglycerol concentration, with higher intakes reducing concentrations (Mensink et al., 2003), thus the effect may be due to a concomitant change in fat intake in relation to carbohydrate intake.
Higher carbohydrate, lower fat, average protein diets and fasting triacylglycerol concentration
• Effect • Moderate evidence • A higher carbohydrate, lower fat, average protein diet may result in less of a
reduction in fasting triacylglycerol concentration as compared with a lower carbohydrate, average or higher fat and higher protein diet, but it is not possible to exclude confounding by other variables, e.g. a concomitant reduction in fat intake
• The effect is biologically relevant
Fasting total cholesterol:HDL-cholesterol ratio 5.62 Nine randomised controlled trials that presented evidence on diets differing in the
proportion of carbohydrate to protein and fat on fasting total cholesterol:HDL-cholesterol ratio were included in the meta-analysis (Clevidence et al., 1992; Johnston et al., 2004; Sharman et al., 2004; Dansinger et al., 2005; Krauss et al., 2006; McMillan-Price et al., 2006; Mahon et al., 2007; Maki et al., 2007b; Layman et al., 2009) (Cardio-metabolic review, hyperlipidaemias and blood lipids chapter).
5.63 No significant effect is demonstrated for diets differing in the proportion of carbohydrate to protein and fat on fasting total cholesterol:HDL-cholesterol ratio (0.06, 95% CI -0.14, 0.27; p=0.42). Nearly all trials employ energy restricted weight loss diets. The trials vary carbohydrate (from 5% to 67% energy), fat (from 46% to 10% energy) and protein (from 18% to 37% energy) between groups.
52
Higher carbohydrate, lower fat, average protein diets and fasting total cholesterol:HDL-cholesterol ratio
• No effect • Moderate evidence
Fasting LDL-cholesterol:HDL-cholesterol ratio 5.64 Three randomised controlled trials that presented evidence on diets
differing in the proportion of carbohydrate to protein and fat on fasting LDL-cholesterol:HDL-cholesterol ratio were included in the meta-analysis (Clevidence et al., 1992; Dansinger et al., 2005; Layman et al., 2009) (Cardio-metabolic review, hyperlipidaemias and blood lipids chapter).
5.65 No significant effect is demonstrated for diets differing in the proportion of carbohydrate to protein and fat on fasting LDL-cholesterol:HDL-cholesterol ratio (-0.10, 95% CI -0.34, 0.14; p=0.43). All trials employ energy restricted weight loss diets. The trials vary carbohydrate (from 10% to 67% energy), fat (from 41% to 19% energy) and protein (from 15% to 30% energy) between groups.
Higher carbohydrate, lower fat, average protein diets and fasting LDL-cholesterol:HDL-cholesterol ratio
• No effect • Limited evidence
Higher carbohydrate diets and fasting non-HDL-cholesterol 5.66 Three randomised controlled trials that presented evidence on diets differing
in the proportion of carbohydrate to protein and/or fat on fasting non-HDL-cholesterol were included in the meta-analysis (Pelkman et al., 2004; Howard et al., 2006b; Gardner et al., 2007). One trial was identified in the update search (Toscani et al., 2011) (Cardio-metabolic review, hyperlipidaemias and blood lipids chapter; Update search).
5.67 An effect is demonstrated, with higher carbohydrate diets resulting in more of a reduction in fasting non-HDL-cholesterol concentration (-0.03mmol/L, 95% CI -0.06, -0.00; p=0.04) as compared with a lower carbohydrate diet. All trials employ energy restricted weight loss diets. The trials vary carbohydrate (from 18% to 64% energy), fat (from 44% to 20% energy) and protein (from 16% to 30% energy) between groups. One trial aims to maintain saturated fatty acid intakes at similar levels between experimental groups (Pelkman et al., 2004). The other two trials reduce saturated fatty acid intakes in the higher carbohydrate group relative to other experimental groups. One trial contributes 87% to the pooled estimate and results in more weight loss and reduced saturated fatty acid intake in the higher carbohydrate diet group (Howard et al., 2006b). It is not possible, therefore, to exclude confounding by concomitant decreases in saturated fatty acid intake on the effect on fasting non-HDL-cholesterol concentration. The trial identified in the update search reports no significant effect of diets differing in the proportion of carbohydrate to protein and/or fat on fasting non-HDL-cholesterol concentration.
53
Higher carbohydrate diets and fasting non-HDL-cholesterol concentration
• Effect • Limited evidence • A higher carbohydrate diet may result in more of a reduction in fasting non-HDL-cholesterol concentration as compared with a lower carbohydrate diet, but it is not possible to exclude confounding by other variables, e.g. a concomitant reduction in saturated fat intake and/or weight loss • The effect is biologically relevant
Higher carbohydrate diets and fasting non-esterified fatty acids 5.68 Nine randomised controlled trials that presented evidence on diets differing in
the proportion of carbohydrate to protein and/or fat on fasting non-esterified fatty acids were included in the meta-analysis (Helge, 2002; Wolever & Mehling, 2003; Due et al., 2004; Cornier et al., 2005; Lofgren et al., 2005; Noakes et al., 2005; McMillan-Price et al., 2006; Claessens et al., 2009; Kirk et al., 2009) (Cardio-metabolic review, hyperlipidaemias and blood lipids chapter).
5.69 No significant effect is demonstrated for diets differing in the proportion of carbohydrate to protein and/or fat on fasting non-esterified fatty acid concentration (0.00mmol/L, 95% CI -0.04, 0.05; p=0.82). All trials employ energy restricted weight loss diets. The trials vary carbohydrate (from 30% to 63% energy), fat (from 41% to 10% energy) and protein (from 15% to 35% energy) between groups.
Higher carbohydrate diets and fasting non-esterified fatty acid concentration
• No effect • Adequate evidence
Higher carbohydrate diets and tumour necrosis factor-α 5.70 Three randomised controlled trials that presented evidence on diets differing in
the proportion of carbohydrate to protein and/or fat on blood tumour necrosis factor-α were included in the meta-analysis (Sharman & Volek, 2004; Seshadri et al., 2005; de Luis et al., 2007). No further trials were identified in the update search (Cardio-metabolic review, markers of inflammation chapter).
5.71 No significant effect is demonstrated for diets differing in the proportion of carbohydrate to protein or fat on blood tumour necrosis factor-α concentration (0.16pg/mL, 95% CI -0.20, 0.51; p=0.39). All trials employ energy restricted weight loss diets. The trials vary carbohydrate (from 8% to 51% energy), fat (from 25% to 63% energy) and protein (from 16% to 25% energy) between groups.
Higher carbohydrate diets and tumour necrosis factor-α
• No effect • Limited evidence
54
55
Carbohydrate diets and C-reactive protein 5.72 Sixteen randomised controlled trials were identified that presented evidence
on diets differing in the proportion of carbohydrate to protein and/or fat on C-reactive protein (CRP). Two trials could not be included in the meta-analyses as they did not report the necessary variance data (O’Brien et al., 2005; Stoernell et al., 2008) (Cardio-metabolic review, markers of inflammation chapter). The trials have been stratified according to whether fat or protein, or both, were adjusted as a result of changes in carbohydrate intake.
Higher carbohydrate and lower fat diets compared with lower carbohydrate higher fat diets
5.73 Five randomised controlled trials that presented evidence on diets differing in the proportion of carbohydrate to fat on blood CRP were included in the meta-analysis (Lovejoy et al., 2003; Dansinger et al., 2005; Johnston et al., 2006; Phillips et al., 2008; Due et al., 2008b). Two trials were identified in the update search (Jebb et al., 2010; Haufe et al., 2011) (Cardio-metabolic review, markers of inflammation chapter; Update search).
5.74 No significant effect is demonstrated for diets differing in the proportion of carbohydrate to fat on blood CRP concentration (-0.38mg/L, 95% CI -1.10, 0.33; p=0.29). Nearly all trials employ energy restricted weight loss diets. The trials vary both carbohydrate (from 20% to 65% energy) and fat (from 20% to 40% energy) between groups. The trials identified in the update search report no significant effect of diets differing in the proportion of carbohydrate to fat on blood CRP concentration.
Higher carbohydrate, lower fat diets and CRP concentration
• No effect • Adequate evidence
Higher carbohydrate, average protein diets compared with lower carbohydrate higher protein diets
5.75 Three randomised controlled trials that presented evidence on diets differing in the proportion of carbohydrate to protein on blood CRP were included in the meta-analysis (Due et al., 2005; Noakes et al., 2005; Mahon et al., 2007). One trial was identified in the update search (Gogebakan et al., 2011) (Cardio-metabolic review, markers of inflammation chapter; Update search).
5.76 No significant effect is demonstrated for diets differing in the proportion of carbohydrate to protein on blood CRP concentration (0.49mg/L, 95% CI -0.19, 1.16; p=0.16). All trials employ energy restricted weight loss diets. The trials vary both carbohydrate (from 10% to 60% energy) and protein (from 18% to 37% energy) between groups. The trial identified in the update search reports no significant effect of a diet differing in the proportion of carbohydrate to protein on blood CRP concentration.
Higher carbohydrate, average protein diets and CRP concentration
• No effect • Limited evidence
Higher carbohydrate, lower fat and average protein diets compared with lower carbohydrate, average or higher fat and higher protein diets
5.77 Six randomised controlled trials that presented evidence on diets differing in the proportion of carbohydrate to fat and protein on blood CRP were included in the meta-analysis (Pereira et al., 2004; Sharman & Volek, 2004; McMillan-Price et al., 2006; Noakes et al., 2006; de Luis et al., 2007; Keogh et al., 2008). One trial was identified in the update search (Lim et al., 2010) (Cardio-metabolic review, markers of inflammation chapter; Update search).
5.78 No significant effect is demonstrated for diets differing in the proportion of carbohydrate to fat and protein on blood CRP concentration (0.09mg/L, 95% CI -0.42, 0.61; p=0.72). Nearly all trials employ energy restricted weight loss diets. The trials vary carbohydrate (from 10% to 67% energy), fat (from 10% to 54% energy) and protein (from 18% to 37% energy) between groups. The trial identified in the update search reports no significant effect of diets differing in the proportion of carbohydrate to fat and protein on blood CRP concentration.
Higher carbohydrate, lower fat, average protein and diets CRP concentration
• No effect • Adequate evidence
Type 2 diabetes mellitus 5.79 Seven cohort studies were identified that presented evidence on total carbohydrate
intake as % energy and incidence of type 2 diabetes mellitus (Feskens et al., 1995; Monterrosa et al., 1995; Schulze et al., 2004a; Lindstrom et al., 2006; Gunderson et al., 2007; Villegas et al., 2007; Schulze et al., 2008). Five cohort studies could not be included in a meta-analysis, which left an insufficient number of studies to enable a meta-analysis to be performed. One cohort study was identified in the update search (Simila et al., 2012) (Cardio-metabolic review, diabetes chapter; Update search).
5.80 The seven cohort studies present conflicting results, but the larger studies that took important covariates into consideration indicate a lack of association between total carbohydrate intake as % energy and incidence of type 2 diabetes mellitus. The cohort study identified in the update search indicates that higher intakes of total carbohydrate as % energy are associated with a lower incidence of type 2 diabetes.
5.81 Nine cohort studies were identified that presented evidence on total carbohydrate intake as g/day and incidence of type 2 diabetes mellitus; two studies could
56
not be included in a meta-analysis because the results were unadjusted for any potential confounders (Leonetti et al., 1996; Montonen et al., 2007). The remaining seven cohort studies were included in the meta-analysis (Salmeron et al., 1997a; Salmeron et al., 1997b; Meyer et al., 2000; Hodge et al., 2004; Barclay et al., 2007; Villegas et al., 2007; Schulze et al., 2008). Two cohort studies were identified in the update search (Sluijs et al., 2010; Mekary et al., 2011), one of which (Mekary et al., 2011) was a later follow-up of the Nurses’ Health Study cohort identified in the initial search (Salmeron et al., 1997b) (Cardio-metabolic review, diabetes chapter; Update search). An updated meta-analysis was performed by the same research group that conducted the cardio-metabolic health review (Greenwood et al., 2013), which included the studies found in the update search and excluded the earlier follow-up of the Nurses’ Health Study cohort (Salmeron et al., 1997b). One study conducted in China presents a very different background diet, and the risk estimates in this cohort are markedly elevated in particular sub groups of women, therefore the findings were not included in the analysis (Villegas et al., 2007). The results from the later meta-analysis are presented below and were used to inform this report.
5.82 No significant association was found between total carbohydrate intake as g/ day and incidence of type 2 diabetes mellitus (RR 0.96, 95% CI 0.86, 1.08 for each 70g/ day increase; p=0.5).
Total carbohydrate (% energy or g/day) and type 2 diabetes mellitus
• No association • Moderate evidence
Higher carbohydrate diets and impaired glucose tolerance 5.83 One randomised controlled trial was identified that presented evidence on
diets differing in the proportion of carbohydrate in relation to impaired glucose tolerance (Swinburn et al., 2001). Two trials were identified in the update search (Toscani et al., 2011; Gogebakan et al., 2011) (Cardio-metabolic review, diabetes chapter; Update search).
5.84 No significant effect is reported of diets differing in the proportion of carbohydrate intake on impaired glucose tolerance in any of the trials.
Higher carbohydrate diets and impaired glucose tolerance
• No effect • Limited evidence
Glycaemia and insulinaemia Cohort studies
5.85 Four cohort studies were identified that presented evidence on total carbohydrate intake as either g/day or % energy and glycaemia (Feskens et al., 1995; Leonetti et al., 1996; Mayer-Davis et al., 2006; Schroeder et al., 2007). No further cohort studies were identified in the update search (Cardio-metabolic review, diabetes chapter).
57
5.86 The outcome measure is defined as either blood glucose level or area under the curve following a two-hour glucose tolerance test. One study also presents results according to fasting glucose concentration (Mayer-Davis et al., 2006). Due to variation in methodologies a meta-analysis is not possible. None of the studies indicate an association between total carbohydrate intake as either g/day or % energy and glycaemia.
Total carbohydrate (g/day or % energy) and glycaemia (blood glucose level or area under the curve following a two-hour glucose tolerance test)
• No association • Moderate evidence
Randomised controlled trials 5.87 Forty six randomised controlled trials were identified that presented evidence
on diets differing in the proportion of carbohydrate to fat and/or protein in relation to measures of glycaemia. Four trials could not be included in the meta-analyses as they did not report the necessary data (Kirkwood et al., 2007; Mahon et al., 2007; Clifton et al., 2008; Dale et al., 2009). The trials have been stratified according to whether fat or protein, or both, were adjusted as a result of changes in carbohydrate intake (Cardio-metabolic review, diabetes chapter).
Higher carbohydrate diets and response to oral glucose tolerance test
5.88 Four randomised controlled trials were identified that presented evidence on diets differing in the proportion of carbohydrate to fat or protein in relation to blood glucose response two hours after an oral glucose tolerance test (Swinburn et al., 2001; Foster et al., 2003; Lasker et al., 2008; Due et al., 2008a). No further trials were identified in the update search (Cardio-metabolic review, diabetes chapter).
5.89 No significant effect is reported for diets differing in the proportion of carbohydrate intake on glucose tolerance test in any of the trials.
Higher total carbohydrate diets and oral glucose tolerance test
• No effect • Adequate evidence
Fasting blood glucose
Higher carbohydrate and lower fat diets compared with lower carbohydrate higher fat diets
5.90 Twenty six randomised controlled trials that presented evidence on diets differing in the proportion of carbohydrate to fat on fasting glucose were included in the meta-analysis (Racette et al., 1995; Golay et al., 1996; Golay et al., 2000; Swinburn et al., 2001; Helge, 2002; Colette et al., 2003; Landry et al., 2003; Lovejoy et al., 2003; Wolever & Mehling, 2003; Clifton et al., 2004; Segal-Isaacson et al., 2004; Dansinger et al., 2005; Lofgren et al., 2005; Raatz et al., 2005; Petersen et al., 2006; Howard et al., 2006b; Ebbeling et al., 2007; Gardner et al., 2007; Maki et al., 2007b;
58
59
Phillips et al., 2008; Due et al., 2008a; Frisch et al., 2009; Grau et al., 2009; Kirk et al., 2009; Morgan et al., 2009; Sacks et al., 2009). Four trials were identified in the update search (Goree et al., 2011; Haufe et al., 2011; Shikany et al., 2011; Brooking et al., 2012) (Cardio-metabolic review, diabetes chapter; Update search). Shikany et al. (2011) presents data from the same trial as Howard et al. (2006b) but over a longer time period.
5.91 No significant effect is demonstrated for diets differing in the proportion of carbohydrate to fat on fasting glucose concentration (-0.01mmol/L, 95% CI -0.06, 0.04; p=0.75). Nearly all trials employ energy restricted weight loss diets that vary both carbohydrate (between 5% and 65% energy) and fat (between 18% and 40% energy) between groups. Of the four trials identified in the update search three report no significant effect, while one reports lower carbohydrate, higher fat diet to increase fasting glucose concentration (Goree et al., 2011).
Higher carbohydrate, lower fat diets and fasting blood glucose concentration
• No effect • Adequate evidence
Higher carbohydrate, average protein diets compared with lower carbohydrate higher protein diets
5.92 Five randomised controlled trials that presented evidence on diets differing in the proportion of carbohydrate to protein on fasting glucose were included in the meta-analysis (Due et al., 2004; Noakes et al., 2005; Bowden et al., 2007; Leidy et al., 2007; Claessens et al., 2009). Two trials were identified in the update search (Gogebakan et al., 2011; Toscani et al., 2011) (Cardio-metabolic review, diabetes chapter; Update search).
5.93 No significant effect is demonstrated for diets differing in the proportion of carbohydrate to protein on fasting glucose concentration (-0.08mmol/L, 95% CI -0.26, 0.09; p=0.36). Nearly all trials are energy restricted weight loss trials. The proportion of carbohydrate in the diets varies from 40-63% energy and protein varies from 14-31% energy. The trials identified in the update search report no significant effect of diets differing in the proportion of carbohydrate to protein on fasting glucose concentration.
Higher carbohydrate, average protein diets and fasting blood glucose concentration
• No effect • Adequate evidence
Higher carbohydrate, lower fat and average protein diets compared with lower carbohydrate, average or higher fat and higher protein diets
5.94 Twelve randomised controlled trials that presented evidence on diets differing in the proportion of carbohydrate to fat and protein on fasting glucose were included in the meta-analysis (Brehm et al., 2003; Johnston et al., 2004; Meckling et al., 2004; Sharman et al., 2004; Seshadri et al., 2005; McMillan-Price et al.,
2006; Noakes et al., 2006; Keogh et al., 2007; Meckling & Sherfey, 2007; Lasker et al., 2008; Keogh et al., 2008; de Luis et al., 2009b). Two trials were identified in the update search (Lim et al., 2010; Wood et al., 2012) (Cardio-metabolic review, diabetes chapter; Update search).
5.95 No significant effect is demonstrated for diets differing in the proportion of carbohydrate to fat and protein on fasting glucose concentration (0.02mmol/L, 95% CI -0.14, 0.17; p=0.84). Nearly all trials employ energy restricted weight loss diets. The trials vary carbohydrate (from 4% to 67% energy), fat (from 10% to 54% energy) and protein (from 18% to 37% energy) between groups. The trials identified in the update search report no significant effect of diets differing in the proportion of carbohydrate to fat and protein on fasting glucose concentration.
Higher carbohydrate, lower fat, average protein diets and fasting blood glucose concentration
• No effect • Adequate evidence
Fasting blood insulin
Higher carbohydrate and lower fat diets compared with lower carbohydrate higher fat diets
5.96 Thirty randomised controlled trials were identified that presented evidence on diets differing in the proportion of carbohydrate to fat on fasting insulin (Peterson & Jovanovic-Peterson, 1995; Racette et al., 1995; Golay et al., 1996; Golay et al., 2000; Swinburn et al., 2001; Helge, 2002; Colette et al., 2003; Landry et al., 2003; Lovejoy et al., 2003; Wolever & Mehling, 2003; Clifton et al., 2004; Cornier et al., 2005; Dansinger et al., 2005; Lofgren et al., 2005; Petersen et al., 2006; Howard et al., 2006b; Ebbeling et al., 2007; Gardner et al., 2007; Kirkwood et al., 2007; Maki et al., 2007b; Phillips et al., 2008; Tinker et al., 2008; Due et al., 2008b; Dale et al., 2009; Grau et al., 2009; Kirk et al., 2009; Morgan et al., 2009; Sacks et al., 2009; Sloth et al., 2009; de Luis et al., 2009a). Five trials were identified in the update search (Jebb et al., 2010; Goree et al., 2011; Haufe et al., 2011; Shikany et al., 2011; Brooking et al., 2012) (Cardio-metabolic review, diabetes chapter ; Update search). Shikany et al. (2011) presents the data from the same trial as Howard et al. (2006b) but over a longer follow-up period.
5.97 Due to variation between the different methodologies used to measure fasting insulin concentration, it was not possible to conduct a meta-analysis. Twenty four trials report no significant effect of diets differing in the proportion of carbohydrate to fat on fasting insulin; six trials do report an effect (Swinburn et al., 2001; Clifton et al., 2004; Dansinger et al., 2005; Due et al., 2008b; Kirk et al., 2009; de Luis et al., 2009a). One of these trials reports that the extent of weight loss predicts the decrease in insulin concentration regardless of dietary group (Dansinger et al., 2005). Nearly all trials employ energy restricted weight loss diets that vary both carbohydrate (between 5% and 65% energy) and fat (between 18% and 40% energy) between groups. It is not possible, therefore, to exclude confounding by
60
concomitant weight loss on fasting insulin concentration. The trials identified in the update search report no significant effect of diets differing in the proportion of carbohydrate to fat on fasting insulin concentration.
Higher carbohydrate, lower fat diets and fasting blood insulin concentration
• No effect • Adequate evidence
Higher carbohydrate, average protein diets compared with lower carbohydrate higher protein diets
5.98 Five randomised controlled trials were identified that presented evidence on diets differing in the proportion of carbohydrate to protein on fasting insulin (Due et al., 2004; Noakes et al., 2005; Clifton et al., 2008; Claessens et al., 2009; Sacks et al., 2009). Two trials were identified in the update search (Gogebakan et al., 2011; Toscani et al., 2011) (Cardio-metabolic review, diabetes chapter; Update search).
5.99 Due to variation between the different methodologies used to measure fasting insulin concentration, it was not possible to conduct a meta-analysis. All trials report no significant effect from diets differing in the proportion of carbohydrate to protein on fasting insulin concentration. Nearly all trials are weight loss trials. The proportion of carbohydrate in the diets varies between 40-63% energy and protein varies between 14-31% energy. The trials identified in the update search report no significant effect of diets differing in the proportion of carbohydrate to protein on fasting insulin concentration.
Higher carbohydrate, average protein diets and fasting blood insulin concentration
• No effect • Moderate evidence
Higher carbohydrate, lower fat and average protein diets compared with lower carbohydrate, average or higher fat and higher protein diets
5.100 Seventeen randomised controlled trials were identified that presented evidence on diets differing in the proportion of carbohydrate to fat and protein on fasting insulin (Golay et al., 1996; Brehm et al., 2003; Johnston et al., 2004; Meckling et al., 2004; Sharman et al., 2004; Dansinger et al., 2005; Layman et al., 2005; Seshadri et al., 2005; McMillan-Price et al., 2006; Noakes et al., 2006; Keogh et al., 2007; Mahon et al., 2007; Meckling & Sherfey, 2007; Keogh et al., 2008; Lasker et al., 2008; Sacks et al., 2009; de Luis et al., 2009a). One trial was identified in the update search (Lim et al., 2010) (Cardio-metabolic review, diabetes chapter; Update search).
5.101 Due to variation between the different methodologies used to measure fasting insulin concentration, it was not possible to conduct a meta-analysis. One trial reports that a higher proportion of dietary carbohydrate to fat and protein increased fasting insulin concentration (Seshadri et al., 2005); whereas all other
61
trials report no significant effect on fasting insulin concentration. Nearly all trials employ energy restricted weight loss diets. The trials vary carbohydrate (from 4% to 67% energy), fat (from 10% to 54% energy) and protein (from 18% to 37% energy) between groups. The trial identified in the update search reports no significant effect of diets differing in the proportion of carbohydrate to fat and protein on fasting insulin concentration.
Higher carbohydrate, lower fat, average protein diets and fasting blood insulin concentration
• •
No effect Adequate evidence
Insulin response to oral glucose tolerance test
Higher carbohydrate and lower fat diets compared with lower carbohydrate higher fat diets
5.102 Five randomised controlled trials were identified that presented evidence on diets differing in the proportion of carbohydrate to fat on the insulin response to an oral glucose tolerance test (Swinburn et al., 2001; Foster et al., 2003; Raatz et al., 2005; Due et al., 2008a; Frisch et al., 2009). No further trials were identified in the update search (Cardio-metabolic review, diabetes chapter).
5.103 Due to variation between the different methodologies used to measure fasting insulin concentration, it was not possible to conduct a meta-analysis. Four trials report no significant effect of diets differing in the proportion of carbohydrate to fat on the insulin response to an oral glucose tolerance test. One trial reports that a higher carbohydrate, lower fat diet lowered the insulin response to an oral glucose tolerance test (Swinburn et al., 2001).
Higher carbohydrate, lower fat diets and insulin response to oral glucose tolerance test
• •
No effect Limited evidence
Insulin resistance/sensitivity
Higher carbohydrate and lower fat diets compared with lower carbohydrate higher fat diets
5.104 Thirteen randomised controlled trials were identified that presented evidence on diets differing in the proportion of carbohydrate to fat on measures of insulin resistance/sensitivity (Helge, 2002; Wolever & Mehling, 2002; Foster et al., 2003; Lofgren et al., 2005; Raatz et al., 2005; Johnston et al., 2006; Maki et al., 2007b; Tinker et al., 2008; Due et al., 2008a; Grau et al., 2009; Kirk et al., 2009; Sacks et al., 2009; de Luis et al., 2009a). Four trials were identified in the update search (Jebb et al., 2010; Goree et al., 2011; Haufe et al., 2011; Shikany et al., 2011) (Cardio-metabolic review, diabetes chapter; Update search). Shikany et al. (2011) reports data from the same trial as Tinker et al. (2008) but over a longer time period.
62
5.105 Due to variation between the different methodologies used to measure insulin resistance/sensitivity, it was not possible to conduct a meta-analysis. Three trials report an effect of varying the proportion of total carbohydrate to fat on measures of insulin resistance/sensitivity. Two of these trials report improvements in both diet groups, but this is greater in the lower total carbohydrate intervention (Due et al., 2008a; Kirk et al., 2009). One trial reports that in subjects with the FTO gene TT genotype only, there is a beneficial effect on insulin release in those who consume a higher carbohydrate, lower fat diet (Grau et al., 2009). Nearly all trials employ energy restricted weight loss diets that varied both carbohydrate (from 5% to 65% energy) and fat (from 20% to 40% energy) between groups. The four trials identified in the update search report no significant effect of diets differing in the proportion of carbohydrate to fat on the insulin resistance/sensitivity.
Higher carbohydrate, lower fat diets and insulin resistance/sensitivity
• No effect • Moderate evidence
Higher carbohydrate, lower fat and average protein diets compared with lower carbohydrate, average or higher fat and higher protein diets
5.106 Fifteen randomised controlled trials were identified that presented evidence on diets differing in the proportion of carbohydrate to fat and protein on measures of insulin resistance/sensitivity (Helge, 2002; Wolever & Mehling, 2002; Johnston et al., 2004; Pereira et al., 2004; Sharman et al., 2004; Ebbeling et al., 2005; O’Brien et al., 2005; Seshadri et al., 2005; McMillan-Price et al., 2006; Mahon et al., 2007; Maki et al., 2007b; Gray et al., 2008; Lasker et al., 2008; Sacks et al., 2009; de Luis et al., 2009a). No further trials were identified in the update search (Cardio-metabolic review, diabetes chapter).
5.107 Due to variation between the different methodologies used to measure insulin resistance/sensitivity, it was not possible to conduct a meta-analysis. Four trials report an effect of diets differing in the proportion of carbohydrate to fat and protein on measures of insulin resistance/sensitivity. Overall, findings from the fifteen trials tend to show improvements in insulin resistance in both dietary groups studied, which is likely to be a reflection of decreasing weights in the majority of the studies. Nearly all trials employ energy restricted weight loss diets that varied carbohydrate (from 12% to 57% energy), fat (from 54% to 20% energy) and protein (from 18% to 37% energy) between groups.
Higher carbohydrate, lower fat, average protein diets and insulin resistance/ sensitivity
• No effect • Moderate evidence
63
64
Higher carbohydrate diets and haemoglobin A1c 5.108 Six randomised controlled trials were identified that presented evidence on diets
differing in the proportion of carbohydrate in relation to glycosylated blood proteins. Five trials were included in the meta-analysis (Wolever & Mehling, 2003; Seshadri et al., 2005; Claessens et al., 2009; Frisch et al., 2009; Sloth et al., 2009). One trial could not be included in an analysis because it did not provide any measures of variation (Dyson et al., 2007). No trials were identified in the update search (Cardio-metabolic review, diabetes chapter).
5.109 No significant effect is demonstrated for diets differing in the proportion of carbohydrate on haemoglobin A1c concentration (-0.01%, 95% CI -0.06, 0.05; p=0.82). The largest trial contributed 87% to the pooled estimate (Frisch et al., 2009).
Higher carbohydrate diets and haemoglobin A1c concentration
• No effect • Adequate evidence
Obesity Higher carbohydrate diets and fat free mass
5.110 Four randomised controlled trials presented evidence on diets differing in the proportion of carbohydrate in relation to change in fat free mass. One trial could not be included in the meta-analysis because the percentage energy difference in carbohydrate between the intervention groups was less than 5% (Dale et al., 2009). Three trials were included in a meta-analysis (Due et al., 2004; Delbridge et al., 2009; Frisch et al., 2009). Two of the trials varied the proportion of carbohydrate to protein (Due et al., 2004; Delbridge et al., 2009) and the other varied the proportion of carbohydrate to fat (Frisch et al., 2009). One trial was identified in the update search (Foster et al., 2010), which varied the proportion of carbohydrate to fat and protein (Cardio-metabolic review, obesity chapter; Update search).
5.111 No significant effect is demonstrated for diets differing in the proportion of carbohydrate to protein or fat on loss of fat mass (0.03kg, 95% CI -0.77, 0.83; p=0.95). The trial identified in the update search reports no significant effect of diets differing in the proportion of carbohydrate to fat and protein on fat free mass.
Higher carbohydrate diets and fat free mass
• No effect • Moderate evidence
Higher carbohydrate diets and waist to hip ratio 5.112 Four randomised controlled trials presented evidence on diets differing in the
proportion of carbohydrate in relation to waist to hip ratio. One could not be included in a meta-analysis because the percentage energy difference from
carbohydrates was less than 5% between the intervention groups (McManus et al., 2001). Three trials were included in the meta-analysis (Due et al., 2004; Howard et al., 2006a; Gardner et al., 2007). One trial varied the proportion of carbohydrate to protein (Due et al., 2004); one varied the proportion of carbohydrate to fat (Howard et al., 2006a); and the other varied the proportion of carbohydrate to fat and protein (Gardner et al., 2007). No further trials were identified in the update search (Cardio-metabolic review, obesity chapter).
5.113 No significant effect is demonstrated for diets differing in the proportion of carbohydrate to protein and/or fat on change in waist to hip ratio (0.00, 95% CI -0.01, 0.01; p=0.87).
Higher carbohydrate diets and waist to hip ratio
• No effect • Limited evidence
65
Total carbohydrate and body weight change 5.114 Twenty randomised controlled trials that presented evidence on diets differing
in the proportion of carbohydrate in relation to body weight were considered for inclusion in a meta-analysis. Six trials could not be included in the meta-analysis (McManus et al., 2001; Ebbeling et al., 2007; Gardner et al., 2007; Clifton et al., 2008; Dale et al., 2009; Sacks et al., 2009) (Cardio-metabolic review, obesity chapter). The trials have been stratified according to whether fat or protein, or both, were adjusted as a result of changes in carbohydrate intake.
Higher carbohydrate and lower fat diets compared with lower carbohydrate higher fat diets
5.115 Eight randomised controlled trials that presented evidence on diets differing in the proportion of carbohydrate to fat in relation to body weight were included in a meta-analysis (Sheppard et al., 1991; Shah et al., 1996; Swinburn et al., 2001; Ebbeling et al., 2005; Bhargava, 2006; Howard et al., 2006a; Frisch et al., 2009; Greenberg et al., 2009). Two follow-up analyses from a trial included in the meta-analysis (Howard et al., 2006a) were identified in the update search (Howard et al., 2010; Shikany et al., 2011) however, these reported on a smaller number of participants and over a shorter time period than the original paper and were not considered further. One additional trial identified in the update search reported no effect of diets differing in the proportion of carbohydrate on body weight (Foster et al., 2010) (Cardio-metabolic review, obesity chapter; Update search).
5.116 No significant effect is demonstrated for higher carbohydrate, lower fat diets on body weight change (-0.93kg, 95% CI -1.87, 0.01; p=0.05). The result is of borderline statistical significance, but is in the opposite direction to the borderline effect for fat mass (see paragraph 5.126).
Higher carbohydrate, lower fat diets and body weight
• No effect • Limited evidence
Higher carbohydrate, average protein diets and higher carbohydrate, lower fat and average protein diets compared with lower carbohydrate higher protein diets and lower carbohydrate, average or higher fat and higher protein diets
5.117 Six randomised controlled trials that presented evidence on diets differing in the proportion of carbohydrate to protein or to fat and protein in relation to body weight were included in a meta-analysis (Foster et al., 2003; Due et al., 2004; Dansinger et al., 2005; Keogh et al., 2007; Delbridge et al., 2009; Layman et al., 2009). Two trials were identified in the update search (Wycherley et al., 2010; Lim et al., 2010) (Cardio-metabolic review, obesity chapter; Update search).
5.118 No significant effect is demonstrated for diets differing in the proportion of carbohydrate to protein or fat and protein on body weight change (0.48kg, 95% CI -0.79, 1.74; p=0.46). The trials identified in the update search report no significant effect of diets differing in the proportion of carbohydrate to protein or fat and protein on body weight.
Higher carbohydrate, average protein diets and higher carbohydrate, lower fat, average protein diets and body weight
• No effect • Adequate evidence
Total dietary carbohydrate and body mass index 5.119 Eight randomised controlled trials that presented evidence on diets differing in
the proportion of carbohydrate in relation to body mass index were considered for inclusion in a meta-analysis. Two trials could not be included in the meta-analysis as they did not report the necessary data (McManus et al., 2001; Dale et al., 2009) (Cardio-metabolic review, obesity chapter). The trials have been stratified according to whether fat or protein, or both were adjusted as a result of changes in carbohydrate intake.
Higher carbohydrate and lower fat diets compared with lower carbohydrate higher fat diets
5.120 Four randomised controlled trials that presented evidence on diets differing in the proportion of carbohydrate to fat in relation to body mass index were included in a meta-analysis (Swinburn et al., 2001; Bhargava, 2006; Howard et al., 2006a; Frisch et al., 2009). No further trials were identified in the update search (Cardio-metabolic review, obesity chapter).
66
5.121 The heterogeneity is above the pre-specified cut-off of 75% (I2=80%) and, therefore, the pooled estimate is not reported. The forest plot does show that all four trials demonstrate a change in the same direction, with a lower BMI at the end of the intervention following a higher carbohydrate, lower fat diet. The magnitude of this change between trials is inconsistent.
Higher carbohydrate, lower fat diets and body mass index
• Effect • Limited evidence • The direction of the effect demonstrates energy restricted, higher carbohydrate, lower fat diets may be beneficial to reducing body mass index • The effect is biologically relevant
Higher carbohydrate, average protein diets and higher carbohydrate, lower fat and average protein diets compared with lower carbohydrate higher protein diets and lower carbohydrate, average or higher fat and higher protein diets
5.122 Four randomised controlled trials that presented evidence on diets differing in the proportion of carbohydrate to protein or to fat and protein in relation to body mass index were included in a meta-analysis (Due et al., 2004; Dansinger et al., 2005; Gardner et al., 2007; Delbridge et al., 2009). One trial was identified in the update search (Wycherley et al., 2010) (Cardio-metabolic review, obesity chapter; Update search).
5.123 No significant effect is demonstrated for diets differing in the proportion of carbohydrate to protein or protein and fat on body mass index change (0.26 kg/ m2, 95% CI -0.46, 0.98; p=0.48). The trial identified in the update search reports no significant effect of diets differing in the proportion of carbohydrate to protein or protein and fat on change in body mass index.
Higher carbohydrate, average protein diets and higher carbohydrate, lower fat, average protein diets and body mass index
• No effect • Limited evidence
Total dietary carbohydrate and total body fat 5.124 Six randomised controlled trials that presented evidence on diets differing in the
proportion of carbohydrate in relation to fat mass were considered for inclusion in the meta-analysis. Three trials could not be included in the meta-analysis because the percentage energy difference in carbohydrate between the intervention groups was less than 5% (McManus et al., 2001; Clifton et al., 2008; Dale et al., 2009). The trials have been stratified according to whether fat or protein or both were adjusted as a result of changes in carbohydrate intake.
67
Higher carbohydrate and lower fat diets compared with lower carbohydrate higher fat diets
5.125 Three randomised controlled trials that presented evidence on diets differing in the proportion of carbohydrate to fat and protein in relation to fat mass were included in a meta-analysis (Ebbeling et al., 2007; Gardner et al., 2007; Frisch et al., 2009). No further trials were identified in the update search (Cardio-metabolic review, obesity chapter).
5.126 No significant effect is demonstrated for higher carbohydrate, lower fat diets on change in fat mass (0.30kg, 95% CI -0.01, 0.62; p=0.06). The result is of borderline statistical significance, but is in the opposite direction to the borderline effect for body weight.
Higher carbohydrate lower fat diets and fat mass
• No effect • Limited evidence
Higher carbohydrate, average protein diets and higher carbohydrate, lower fat and average protein diets compared with lower carbohydrate higher protein diets and lower carbohydrate, average or higher fat and higher protein diets
5.127 Three randomised controlled trials that presented evidence on diets differing in the proportion of carbohydrate to protein or to fat and protein in relation to fat mass were included in a meta-analysis (Due et al., 2004; Delbridge et al., 2009; Layman et al., 2009). One trial was identified in the update search (Foster et al., 2010) (Cardio-metabolic review, obesity chapter; Update search).
5.128 No significant effect is demonstrated for diets differing in the proportion of carbohydrate to protein or fat and protein on change in fat mass (-0.57kg, 95% CI -2.58, 1.44; p=0.58). The trial identified in the update search reports no significant effect on fat mass of a diet differing in the proportion of carbohydrate to protein or fat and protein.
Higher carbohydrate, average protein diets and higher carbohydrate, lower fat, average protein diets and fat mass
• •
No effect Limited evidence
Total dietary carbohydrate and waist circumference 5.129 Nine randomised controlled trials that presented evidence on diets differing in the
proportion of carbohydrate in relation to waist circumference were considered for inclusion in a meta-analysis. Two trials could not be included in the meta-analysis (McManus et al., 2001; Dale et al., 2009). The trials have been stratified according to whether fat or protein or both were adjusted as a result of changes in carbohydrate intake.
68
Higher carbohydrate and lower fat diets compared with lower carbohydrate higher fat diets
5.130 Three randomised controlled trials that presented evidence on diets differing in the proportion of carbohydrate to fat and protein in relation to waist circumference were included in a meta-analysis (Bhargava, 2006; Howard et al., 2006a; Frisch et al., 2009). Two follow-up analyses from a trial included in the meta-analysis (Howard et al., 2006a) were identified in the update search (Howard et al., 2010; Shikany et al., 2011) however, these reported on a smaller number of participants and over a shorter time period than the original paper and were not considered further (Cardio-metabolic review, obesity chapter; Update search).
5.131 No significant effect is demonstrated for diets differing in the proportion of carbohydrate to fat on change in waist circumference (0.04cm, 95% CI -1.26, 1.34; p=0.96).
Higher carbohydrate, lower fat diets and waist circumference
• No effect • Limited evidence
Higher carbohydrate, average protein diets and higher carbohydrate, lower fat and average protein diets compared with lower carbohydrate higher protein diets and lower carbohydrate, average or higher fat and higher protein diets
5.132 Four randomised controlled trials that presented evidence on diets differing in the proportion of carbohydrate to protein or fat and protein in relation to waist circumference were included in a meta-analysis (Due et al., 2004; Dansinger et al., 2005; Keogh et al., 2007; Delbridge et al., 2009). No further trials were identified in the update search (Cardio-metabolic review, obesity chapter).
5.133 The heterogeneity is above the pre-specified cut-off of 75% (I2=86%) and, therefore, the pooled estimate is not reported. The forest plot shows there is no consistent effect overall on change in waist circumference, with only one trial reporting a difference between experimental groups (Due et al., 2004).
Higher carbohydrate, average protein diets and higher carbohydrate, lower fat, average protein diets and waist circumference
• No effect • Limited evidence
Total dietary carbohydrate and energy intake 5.134 Sixty three randomised controlled trials that presented evidence on diets differing
in the proportion of carbohydrate in relation to energy intake were identified. Eighteen trials could not be included in a meta-analysis as they did not report the necessary data (Schlundt et al., 1993; Stubbs et al., 1996; Saltzman et al., 1997; Harvey-Berino, 1998; Johnstone et al., 2000; McManus et al., 2001; Drummond et
69
al., 2003; Brehm et al., 2003; Ebbeling et al., 2005; Mazlan et al., 2006; Rumpler et al., 2006; Keogh et al., 2007; Meckling & Sherfey, 2007; Park et al., 2007; Kirkwood et al., 2007; de Luis et al., 2007; Clifton et al., 2008; Dale et al., 2009). The majority of these studies found no statistical difference in energy intakes with varying carbohydrate consumption. The remaining studies were analysed according to whether the carbohydrate was replaced with fat and/or protein. For details on trial design, see Table 6.3 of the systematic review (Cardio-metabolic review, energy intake and eating motivation chapter). Due to high heterogeneity between trials the meta-analysis pooled estimate is not reported for diets differing in the proportion of carbohydrate to fat and for diets differing in the proportion of carbohydrate to protein in relation to energy intake. This evidence for both these dietary manipulations was considered too inconsistent for a conclusion to be drawn and, therefore, they have been listed in Table 5.4. However, there is no suggestion of an effect between these two dietary modifications and energy intake. Only the analysis for diets differing in the proportion of carbohydrate to fat and protein is given below.
Higher carbohydrate, lower fat and average protein diets compared with lower carbohydrate, average or higher fat and higher protein diets
5.135 Seventeen randomised controlled trials that presented evidence on diets differing in the proportion of carbohydrate to fat and protein in relation to energy intake were included in a meta-analysis (Borkman et al., 1991; Volek et al., 2004; Meckling et al., 2004; Sharman & Volek, 2004; Brehm et al., 2005; Dansinger et al., 2005; Layman et al., 2005; Nickols-Richardson et al., 2005; Seshadri et al., 2005; McMillan-Price et al., 2006; Dyson et al., 2007; Rankin & Turpyn, 2007; Keogh et al., 2008; Lasker et al., 2008; Stoernell et al., 2008; Layman et al., 2009; Morgan et al., 2009). Only two trials include an energy restriction goal (Borkman et al., 1991; Volek et al., 2004) (Cardio-metabolic review, energy intake and eating motivation chapter).
5.136 No significant effect is demonstrated for diets differing in the proportion of carbohydrate to fat and protein on energy intake (20kJ, 95% CI -282, 323; p=0.90) (5kcal, 95 % CI -67, 77).
Higher carbohydrate, lower fat, average protein diets and energy intake
• No effect • Adequate evidence
70
Colo-rectal health 5.137 Six cohort studies were identified that presented evidence on total carbohydrate
intake as g/day and colo-rectal cancer incidence, all of which were included in the meta-analysis (Terry et al., 2003; Higginbotham et al., 2004; Michaud et al., 2005; Larsson et al., 2007; Strayer et al., 2007; Howarth et al., 2008). One cohort study was identified in the update search (Li et al., 2011) (Colo-rectal health review; Update search).
71
5.138 No significant association is indicated between carbohydrate intake as g/day and colo-rectal cancer incidence (RR 1.00, 95% CI 0.87, 1.14 for each 70g/day increase; p=0.99). The cohort study identified in the update search also indicates no significant association between total carbohydrate intake as g/day and colo-rectal cancer incidence.
Total carbohydrate (g/day) and colo-rectal cancer
• No association
• Adequate evidence
5.139 Four cohort studies were identified that presented evidence on total carbohydrate intake as g/day and colon and rectal cancer incidence separately, all of which were included in the meta-analysis (Terry et al., 2003; Michaud et al., 2005; Larsson et al., 2007; Howarth et al., 2008). One cohort study was identified in the update search (Li et al., 2011) (Colo-rectal health review; Update search).
5.140 No significant association is indicated between carbohydrate intake as g/day and colon cancer incidence (RR 0.99, 95% CI 0.89, 1.08 for each 70g/day increase; p=0.75) or rectal cancer incidence (RR 0.99, 95% CI 0.86, 1.14 for each 70g/day increase; p=0.86). The cohort study identified in the update search also indicates no significant association between total carbohydrate intake as g/day and colon or rectal cancer incidence.
Total carbohydrate (g/day) and colon cancer
• No association • Adequate evidence
Total carbohydrate (g/day) and rectal cancer
• No association • Adequate evidence
Children and adolescents
Body mass index and body fatness 5.141 Four cohort studies were identified in children and adolescents aged five years or
more that presented evidence on total carbohydrate intake in relation to change in BMI or body fatness (Twisk et al., 1998; Boreham et al., 1999; Magarey et al., 2001; Johnson et al., 2008).
5.142 Three cohort studies were identified that presented evidence on total carbohydrate intake as % energy in relation to change in BMI (Twisk et al., 1998; Boreham et al., 1999; Magarey et al., 2001). One study could not be included in a meta-analysis as it did not report the necessary data (Boreham et al., 1999), which left an insufficient number of trials to enable a meta-analysis to be performed. No further studies were identified in the update search (Cardio-metabolic review, obesity chapter).
5.143 Overall, there was no evidence of an association between total carbohydrate intake and follow-up BMI in any of these studies of children and adolescents.
5.144 Four cohort studies were identified that presented evidence on total carbohydrate intake as % energy in relation to body fatness and fat distribution (Twisk et al., 1998; Boreham et al., 1999; Magarey et al., 2001; Johnson et al., 2008). The assessments of body fatness were insufficiently comparable to enable a meta-analysis to be performed. No further studies were identified in the update search (Cardio-metabolic review, obesity chapter).
5.145 Three of the studies indicate no association between total carbohydrate intake and body fatness in children and adolescents, but one study indicates a higher total carbohydrate intake is associated with increased triceps skinfold measurement (Magarey et al., 2001).
Total carbohydrate intake (% energy) and body mass index and body fatness
• No association • Limited evidence
Outcomes where there is insufficient or inconsistent evidence8
5.146 The tables below detail the exposures and outcomes where there are two or fewer studies that meet the inclusion criteria for the review (e.g. by study duration, publication date, health of subjects, design of intervention), or where the studies are too inconsistent, to draw a conclusion as per the grading system in Annex 2. A full description of the studies can be found in the relevant systematic reviews.
Table 5.1: Insufficient evidence - cohort studies
Risk factor/health outcome/measure Exposure
Coronary calcification Aortic calcification Blood pressure Fasting blood lipids Fibrinogen Body weight (children) Body mass index and body fatness (children) Weight gain Fat distribution (adults and children) Energy intake (children) Eating motivation Impaired glucose tolerance Insulinaemia HbA1c
Total carbohydrate (g/day or % energy)
Cardiovascular disease events Coronary events Stroke Type 2 diabetes mellitus
Dietary patterns
8 See Annex 2 paragraph A2.21 for criteria. 72
Table 5.2: Insufficient evidence - randomised controlled trials
Risk factor/health outcome Exposure
Cardiovascular disease Pulse wave velocity Augmentation index IL-6 Serum-amyloid A, ICAM-1 VCAM-1 E-selectin P-selectin, tPA, Factor VII Fibrinogen Total body fat (children) Hip circumference Type 2 diabetes mellitus
Higher carbohydrate diets
AUC insulin Higher carbohydrate, lower protein diets
Insulin response to oral glucose tolerance test
Higher carbohydrate, lower fat and protein diets
Table 5.3: Inconsistent evidence - cohort studies
Measure Exposure
Body weight Energy intake (adults)
Total carbohydrate
Table 5.4: Inconsistent evidence - randomised controlled trials
Risk factor/health outcome/measure Exposure
Apolipoproteins A-1, B Higher carbohydrate diets Lipoprotein a PAI-1 Central and peripheral fat Eating motivation
LDL-cholesterol Higher carbohydrate and lower fat diets TAG Energy intake
Waist circumference Higher carbohydrate, lower fat and/or lower protein diets
Energy intake Higher carbohydrate, lower protein diets
73
Summary and conclusions 5.147 This assessment is based on prospective cohort studies and randomised controlled
trials investigating the relationship between total carbohydrate intake and the various health/disease outcomes included in this review. There is a lack of evidence on total carbohydrate intake in relation to oral health. With observational studies there is substantial potential for biases and the possibility of confounding by an extraneous variable that correlates with both the dependent variable and the independent variable (residual confounding); any associations must be interpreted with caution.
5.148 For many outcomes, there is insufficient evidence from cohort studies to permit a conclusion to be drawn in terms of total carbohydrate intake. No association is indicated between total carbohydrate intake and the incidence of cardiovascular disease endpoints, type 2 diabetes mellitus, glycaemia (blood glucose level or area under the curve following a two-hour glucose tolerance test) or colo-rectal cancer; most studies adjust their results for body mass index. In children and adolescents limited evidence indicates that there is no association between total carbohydrate intake and body mass index or body fatness.
5.149 Cohort studies estimate total carbohydrate intake in subjects with unrestricted food choice. Total carbohydrate is the sum of the sugars, starches and dietary fibre in the diet and, therefore, a general term that encompasses several different nutritional components. Any or all of these components may be increased to raise total carbohydrate intake and in some cohort studies it is not reported how carbohydrate intakes were achieved. As the components are linked with differing effects on health outcomes, it may be more difficult to detect an association between total carbohydrate intake and any one health outcome. A further limitation is that variation or changes in carbohydrate intakes may affect micronutrient intakes, which is unlikely to be accounted for in cohort studies.
5.150 Randomised controlled trials assess the effect of varying total carbohydrate intake, by reciprocally varying fat, type and quantity, and/or protein intake. These trials indicate no significant effect of varying total carbohydrate intake on vascular function, inflammatory markers and risk factors for type 2 diabetes mellitus. Higher total carbohydrate intake is shown to have mixed effects on fasting blood lipid concentrations, but it is not possible to exclude confounding by a concomitant reduction in saturated fatty acid intake and total fat and/or differences in weight loss between experimental groups. Higher carbohydrate intake is also shown to affect systolic blood pressure, but it is not possible to exclude confounding by differences in weight loss between experimental groups (see paragraphs 5.6 and 5.7). A higher carbohydrate, average protein diet results in less of a reduction in systolic blood pressure as compared with a lower carbohydrate, higher protein diet, but this appears to be due to greater weight-loss in the higher carbohydrate experimental group rather than to dietary differences. This caveat applies to all cardio-metabolic risk factors investigated in these trials.
74
5.151 The trials do provide evidence that an energy-restricted higher carbohydrate, lower fat diet, as compared with a lower carbohydrate, higher fat diet, may be beneficial as a dietary strategy for reducing body mass index, but there is high heterogeneity between trials and the evidence is limited due to a relatively small number of trials. The hypothesis that diets higher in total carbohydrate cause weight gain is not supported by the evidence from randomised controlled trials considered in this review.
5.152 Overall, prospective cohort studies indicate that total carbohydrate is neither detrimental nor beneficial to cardio-metabolic health and is not associated with risk of colo-rectal cancer. The randomised controlled trials do indicate some effects on cardiovascular risk factors, but it is not possible to exclude confounding by a concomitant reduction in saturated fatty acid intake and total fat and/or differences in weight loss between experimental groups. There is some evidence that an energy restricted, higher carbohydrate, lower fat diet may be an effective strategy for reducing body mass index and body weight.
75
6 Sugars and sugars-sweetened foods and beverages
6.1 This assessment is based on prospective cohort studies and randomised controlled trials investigating the relationship between sugars, individual sugars, sugars-sweetened foods and beverages and cardio-metabolic, colo-rectal and oral health outcomes. Links to the individual systematic reviews and update search are given in Annex 1.
6.2 Evidence on health/disease outcomes has been discussed in detail only where there are sufficient data for a conclusion to be drawn from studies meeting the pre-agreed inclusion criteria. Outcomes where there are too few studies to reach a conclusion, are listed at the end of the chapter (see Tables 6.1 and 6.2).
6.3 For the prospective cohort study meta-analyses, the relative risks for total sugars intake are presented for each 50g/day increase and for individual sugars for each 20g/day increase as this is equivalent to one standard deviation of intake. The increment used for sugars-sweetened beverages was 330ml/day increase in consumption as this is equivalent to a standard can of beverage.
6.4 The term ‘sugars’ is used in this chapter to refer to all dietary sugars in cohort studies. For randomised controlled trials, ‘sugars’ is used where the exposure cannot be clearly be defined as a specific type of sugar(s) (e.g. sucrose, lactose, glucose or fructose).
6.5 There is a lack of evidence to enable conclusions to be drawn on sugars intake and colo-rectal cancer and no studies were identified for any other colo-rectal health outcome.
Adults Sugars Coronary events
6.6 Three cohort studies were identified that presented evidence on sugars intake and incidence of coronary events (Fehily et al., 1993; Liu et al., 2000; Beulens et al., 2007). The exposure measures used in the studies were not sufficiently comparable to enable a meta-analysis to be performed. Two cohort studies were subsequently identified in the update search (Sieri et al., 2010; Burger et al., 2011) (Cardio-metabolic review, cardiovascular disease chapter; Update search).
76
6.7 No significant association is observed between sugars consumption and incidence of coronary events in any of the studies.
Sugars (g/day) and coronary events
• No association • Moderate evidence
Blood pressure 6.8 Five randomised controlled trials were identified that presented evidence on diets
differing in the proportion of sugars in relation to blood pressure (Surwit et al., 1997; Vasilaras et al., 2001; Poppitt et al., 2002; Raben et al., 2002; Black et al., 2006), three of which were included in a meta-analysis (Surwit et al., 1997; Raben et al., 2002; Black et al., 2006). Two very small trials could not be included in a meta-analysis as they did not report the necessary data (Vasilaras et al., 2001; Poppitt et al., 2002). No further trials were identified in the update search (Cardio-metabolic review, incident hypertension and blood pressure chapter).
6.9 No significant effect is demonstrated for diets differing in the proportion of sugars on systolic blood pressure (1.4mmHg, 95% CI -5.4, 8.3; p=0.69) or diastolic blood pressure (3.1mmHg, 95% CI -0.2, 6.3; p=0.06); although the result is of borderline statistical significance. One trial included in the meta-analysis compared the consumption of sucrose-sweetened foods and drinks to non-calorically sweetened foods and beverages (Raben et al., 2002). The other two trials compared higher and lower sucrose diets, one of which was a weight loss trial (Surwit et al., 1997).
Sugars and systolic and diastolic blood pressure
• No effect • Limited evidence
Fasting blood lipids
Fasting total cholesterol concentration 6.10 Six randomised controlled trials were identified that presented evidence on diets
differing in the proportion of sugars in relation to fasting total cholesterol, of which four were included in a meta-analysis (Ryle et al., 1990; Surwit et al., 1997; Saris et al., 2000; Black et al., 2006). Two trials could not be included in a meta-analysis as they did not report the necessary data (Poppitt et al., 2002; Drummond et al., 2003). No further trials were identified in the update search (Cardio-metabolic review, hyperlipidaemias and blood lipids chapter).
6.11 No significant effect is demonstrated for diets differing in the proportion of sugars on fasting total cholesterol concentration (0.14mmol/L, 95% CI -0.11, 0.39; p=0.28). Two of the included trials are weight loss trials (Surwit et al., 1997; Saris et al., 2000).
77
Sugars and fasting total cholesterol concentration
• No effect • Limited evidence
Fasting LDL-cholesterol concentration 6.12 Four randomised controlled trials were identified that presented evidence on
diets differing in the proportion of sugars in relation to fasting LDL-cholesterol, of which three were included in a meta-analysis (Surwit et al., 1997; Saris et al., 2000; Black et al., 2006). One trial could not be included in a meta-analysis as it did not report the necessary data (Poppitt et al., 2002). No further trials were identified in the update search (Cardio-metabolic review, hyperlipidaemias and blood lipids chapter).
6.13 No significant effect is demonstrated for diets differing in the proportion of sugars on fasting LDL-cholesterol concentration (0.10mmol/L, 95% CI -0.18, 0.38; p=0.49). Two of the included trials are weight loss trials (Surwit et al., 1997; Saris et al., 2000).
Sugars and fasting LDL-cholesterol concentration
• No effect • Limited evidence
78
Fasting HDL-cholesterol concentration 6.14 Four randomised controlled trials were identified that presented evidence on
diets differing in the proportion of sugars in relation to fasting HDL-cholesterol, of which three were included in a meta-analysis (Surwit et al., 1997; Saris et al., 2000; Black et al., 2006). One trial could not be included in a meta-analysis as it did not report the necessary data (Poppitt et al., 2002). No further trials were identified in the update search (Cardio-metabolic review, hyperlipidaemias and blood lipids chapter).
6.15 No significant effect is demonstrated for diets differing in the proportion of sugars on fasting HDL-cholesterol concentration (-0.03mmol/L, 95% CI -0.09, 0.02; p=0.21). Two of the trials are weight loss trials (Surwit et al., 1997; Saris et al., 2000).
Sugars and fasting HDL-cholesterol concentration
• No effect • Limited evidence
Fasting triacylglycerol concentration 6.16 Five randomised controlled trials were identified that presented evidence on diets
differing in the proportion of sugars in relation to fasting triacylglycerol (Surwit et al., 1997; Saris et al., 2000; Poppitt et al., 2002; Sorensen et al., 2005; Black et al., 2006). Three trials could not be included in a meta-analysis as they did not report the necessary data (Poppitt et al., 2002; Sorensen et al., 2005; Black et
al., 2006), which left an insufficient number of trials to enable a meta-analysis to be performed. No further trials were identified in the update search (Cardio-metabolic review, hyperlipidaemias and blood lipids chapter).
6.17 Two trials investigated substitution of dietary fat with either ‘simple’ or ‘complex’ carbohydrates; however these terms are not defined (Saris et al., 2000; Poppitt et al., 2002). One reports fasting triacylglycerol concentration to be raised by the lower fat, higher simple carbohydrate diet compared with the lower fat higher complex carbohydrate diet (Poppitt et al., 2002), while the other reports no significant effect (Saris et al., 2000). The three remaining trials investigate the effect of higher and lower sucrose diets and report no significant effect on fasting triacylglycerol concentration.
Sugars and fasting triacylglycerol concentration
• No effect • Limited evidence
79
Energy intake 6.18 Nine randomised controlled trials that presented evidence on diets differing in the
proportion of sugars in relation to energy intake were originally identified in the cardio-metabolic health review (Drummond & Kirk, 1998; Saris et al., 2000; Poppitt et al., 2002; Raben et al., 2002; Brynes et al., 2003; Drummond et al., 2003; Mazlan et al., 2006; Reid et al., 2007; Volp et al., 2008). Two of these trials could not be included in a meta-analysis as they did not report the necessary data (Mazlan et al., 2006; Volp et al., 2008) (Cardio-metabolic review, energy intake and eating motivation chapter). Five further trials were identified following the consultation on the draft report (Reid et al., 2010; Aeberli et al., 2011; Njike et al., 2011; Reid et al., 2014; Sorensen et al., 2014). Four of the trials were included in the updated meta-analysis described in paragraphs 6.19 and 6.20 (Reid et al., 2010; Aeberli et al., 2011; Njike et al., 2011; Reid et al., 2014). Sorensen et al. (2014) reported on the same trial as Raben et al. (2002) with additional analyses from a subset of participants; therefore only results from the earlier publication were used in the updated meta-analysis.
6.19 There is variation in study design with respect to how the sugars intervention is delivered. In five of the trials, the intervention involves substitution of the macronutrient content of the diet (e.g. in the fat to carbohydrate ratio and the carbohydrate constituents) (Drummond & Kirk, 1998; Saris et al., 2000; Poppitt et al., 2002; Brynes et al., 2003; Drummond et al., 2003). In six trials, the intervention predominantly involves the replacement of sugars with non-caloric sweeteners, particularly in drinks (Raben et al., 2002; Reid et al., 2007; Reid et al., 2010; Njike et al., 2011; Aeberli et al., 2011; Reid et al., 2014). None of the included trials has an energy restriction goal and the first follow up at the end of the intervention ranges from 4 weeks to 6 months.
6.20 The data extracted from the trials are summarised in Table A9.1 (Annex 9). In the systematic reviews, meta-analyses of randomised controlled trials use a mixture
of both end of trial and change from baseline outcome measure values depending on what was reported in the study. Using results from the end of the trials affects estimates of effect size, but in this case particularly misrepresents the findings from Drummond et al. (2003). Therefore, in order to better quantify the intervention effects, an updated meta-analysis has been performed using between-treatment change from baseline values. Where studies included more than two intervention arms, the most comparable groups were chosen i.e. those groups that were most similar with respect to the background diet except for the intake of sugars. None of the trials, except for Saris et al. (2000), provided change from baseline variance data or the adjusted difference in means using the ANCOVA method. Therefore a correlation coefficient had to be derived to enable computation of the variance data, as recommended in the Cochrane Handbook. The variance was estimated from a correlation coefficient of energy intakes reported in another study (Howard et al., 2006). As the estimated correlation coefficient defines how strong the correlation is in the data to which it is applied, this approach relies on large assumptions and its use must be treated with caution. It was not possible to obtain change from baseline data for three trials; two did not report baseline data (Njike et al., 2003; Brynes et al., 2003) and one did not provide baseline variance data (Poppitt et al., 2002), meaning that end of trial values had to be used for these studies.
6.21 The updated meta-analysis demonstrated that relative changes (increases or decreases) in the dietary intake of sugars result in corresponding relative differences in energy intake (1.01 MJ/day, 95% CI 0.70, 1.32; p=<0.001) (241 kcal/ day 95% CI 163, 315) (see Figure A9.2 in Annex 9). With the exception of one ‘pilot study’ (Drummond et al., 2003), the same direction of effect was observed in every identified trial (including those that could not be included in the meta-analysis). The findings of these trials suggest that there is inadequate energy compensation (degree of voluntary reduction in intake of other foods or drinks), for energy delivered as sugar. Because energy intake in excess of requirements causes weight gain over time, higher energy consumption is deemed to be detrimental to health. Despite the variation in study design, the outcomes of the included trials are fairly consistent, with no heterogeneity between the studies being identified (I2=0%).
6.22 To explore how analysing these data using a between-treatment change from baseline approach affected the outcome, another meta-analysis was conducted using end of trial data, except in the case of Saris et al., 2000 and Drummond et al., 2003 (see Figure A9.1 in Annex 9). This analysis yielded a similar, but larger, effect size (1.11 MJ/day, 95% CI 0.78, 1.45; p=<0.001) (265 kcal/day, 95% CI 186, 346). Therefore the approach described in the paragraph above provides a more conservative estimate of effect size.
80
Sugars and energy intake
• Effect • Adequate evidence • The direction of the effect demonstrates that greater consumption of sugars is detrimental to health • The effect is biologically relevant at a population level in free living individuals not subject to energy restriction
81
Type 2 diabetes mellitus 6.23 Five cohort studies were identified that presented evidence on diets differing in
the proportion of sugars in relation to incidence of type 2 diabetes mellitus, of which three were included in a meta-analysis (Hodge et al., 2004; Barclay et al., 2007; Montonen et al., 2007). Two studies could not be included in a meta-analysis as they did not report the necessary data (Feskens et al., 1995; Janket et al., 2003). One cohort study was subsequently identified in the update search (Sluijs et al., 2010) (Cardio-metabolic review, diabetes and glycaemia chapter; Update search).
6.24 The heterogeneity was above the pre-specified cut-off of 75% (I2=82%) therefore the pooled estimate has not been reported, but the studies provide no consistent evidence of an association between diets differing in the proportion of sugars in relation to incidence of type 2 diabetes mellitus. The cohort study identified in the update search reports no significant association between sugars intake and the incidence of type 2 diabetes mellitus.
Sugars (g/day) and type 2 diabetes mellitus
• No association • Limited evidence
Blood glucose 6.25 Five randomised controlled trials were identified that presented evidence on diets
differing in the proportion of sugars in relation to fasting blood glucose (Ryle et al., 1990; Surwit et al., 1997; Bantle et al., 2000; Saris et al., 2000; Black et al., 2006). No further trials were identified in the update search (Cardio-metabolic review, diabetes and glycaemia chapter).
6.26 Due to the diverse range of sugars interventions used in these trials, it is not appropriate to combine them in a meta-analysis. One compares a higher glucose diet to a higher fructose diet (Bantle et al., 2000); one compares a higher glucose, lower soluble fibre diet, which includes a guar preparation, to a lower glucose, higher soluble fibre diet (Ryle et al., 1990); one compares a higher sucrose group and a lower sucrose group (Black et al., 2006) and one randomises subjects to three diets: lower fat, higher ‘simple carbohydrates’; lower fat,� higher ‘complex carbohydrates’; and a control group (Saris et al., 2000). Two of the trials are weight loss trials (Bantle et al., 2000; Saris et al., 2000). All the trials report no significant effect of diets differing in the proportion of sugars in relation to fasting blood glucose concentration. One of the trials measured day-long area under the curve
insulin (Bantle et al., 2000), whereas the other trials measured both fasting insulin and area under the curve oral glucose tolerance test insulin.
Sugars and fasting blood glucose concentration
• No effect • Limited evidence
Blood insulin 6.27 Four randomised controlled trials were identified that presented evidence on diets
differing in the proportion of sugars in relation to blood insulin concentration (Ryle et al., 1990; Bantle et al., 2000; Saris et al., 2000; Black et al., 2006). No further trials were identified in the update search (Cardio-metabolic review, diabetes and glycaemia chapter).
6.28 Due to variation between the different methodologies used to measure insulin concentration, it was not possible to conduct a meta-analysis. Three trials that compare diets higher and lower in sugars report no significant effect of diets differing in the proportion of sugars in relation to fasting blood insulin concentration (Ryle et al., 1990; Saris et al., 2000; Black et al., 2006). One trial reports that subjects fed a higher fructose diet have lower day-long area under the curve insulin concentration as compared with a higher glucose diet (Bantle et al., 2000). Two of the trials are weight loss trials (Bantle et al., 2000; Saris et al., 2000).
Sugars and blood insulin concentration
• No effect • Limited evidence
82
Individual sugars Type 2 diabetes mellitus
6.29 Six cohort studies were identified that presented evidence on sucrose intake in relation to incidence of type 2 diabetes mellitus, of which four were included in a meta-analysis (Meyer et al., 2000; Janket et al., 2003; Montonen et al., 2007; Schulze et al., 2008). Two studies could not be included in a meta-analysis as they did not report the necessary data (Colditz et al., 1992; Monterrosa et al., 1995). No further cohort studies were identified in the update search (Cardio-metabolic review, diabetes and glycaemia chapter).
6.30 The meta-analysis found a borderline association between higher sucrose intake and reduced incidence of type 2 diabetes mellitus (RR 0.94, 95% CI 0.89, 1.00 for each 20g/day increase; p=0.05). Of the two studies that could not be included in the meta-analysis, however, one reports mean sucrose intake as % energy to be slightly greater in those with type 2 diabetes mellitus than those without (Monterrosa et al., 1995). The other study, which is much larger than the other studies identified, reports no significant association for those in the highest quintile of sucrose intake as compared with the lowest (Colditz et al., 1992).
Sucrose (g/day) and type 2 diabetes mellitus
• No association • Limited evidence
6.31 Four cohort studies were identified that presented evidence on glucose or fructose intake in relation to incidence of type 2 diabetes mellitus, of which three were included in a meta-analysis (Meyer et al., 2000; Montonen et al., 2007; Schulze et al., 2008). One study could not be included in a meta-analysis as it did not report the necessary data (Janket et al., 2003). No further cohort studies were identified in the update search (Cardio-metabolic review, diabetes and glycaemia chapter).
6.32 The heterogeneity was above the pre-specified cut-off of 75% for studies investigating glucose (I2=80%) or fructose (I2=83%) intakes in relation to incidence of type 2 diabetes mellitus and, therefore, the meta-analysis pooled estimate is not presented. Two studies specify that glucose and fructose are analysed individually rather than as part of sucrose (Meyer et al., 2000; Montonen et al., 2007), but this is not stated in the other two studies (Janket et al., 2003; Schulze et al., 2008). Two of the studies report an association between higher glucose or higher fructose intakes and higher incidence of type 2 diabetes mellitus (Meyer et al., 2000; Montonen et al., 2007), while the other two studies observe no significant association (Janket et al., 2003; Schulze et al., 2008).
6.33 Three of the cohort studies also report data on lactose intake in relation to incidence of type 2 diabetes mellitus (Meyer et al., 2000; Janket et al., 2003; Montonen et al., 2007). As one study did not report the necessary data to be included in a meta-analysis (Janket et al., 2003), an insufficient number of studies was available to enable a meta-analysis to be performed. All of these studies report no significant association between lactose intake and the incidence of type 2 diabetes mellitus.
Glucose, fructose or lactose (g/day) and type 2 diabetes mellitus
• No association • Limited evidence
83
6.34 There is a lack of evidence from trials exploring the effect of individual sugars on cardio-metabolic health outcomes to enable a conclusion to be drawn (see Table 6.2). A commentary on the evidence base for fructose consumption and health outcomes is provided in Annex 3.
Sugars-sweetened beverages Type 2 diabetes mellitus
6.35 Six cohort studies were identified that presented evidence on the relationship between sugars-sweetened beverage consumption and the incidence of type 2 diabetes mellitus (Schulze et al., 2004b; Paynter et al., 2006; Dhingra et al., 2007; Montonen et al., 2007; Palmer et al., 2008; Nettleton et al., 2009). These were not combined into a meta-analysis in the cardio-metabolic health review due to
variation in both serving size and the definition for sugars-sweetened beverage. One cohort study was subsequently identified in the update search (de Koning et al., 2011) (Cardio-metabolic review, diabetes and glycaemia chapter; Update search).
6.36 A further systematic review and meta-analysis were performed by the same research group that conducted the cardio-metabolic health review (Greenwood et al., 2014); this included results from several large cohort studies published after the original review and update search had been carried out. The results from this meta-analysis are reported in paragraph 6.37. Nine cohort studies in eleven publications were identified that presented evidence on the relationship between sugars-sweetened beverages and the incidence of type 2 diabetes mellitus (Schulze et al., 2004b; Paynter et al., 2006; Montonen et al., 2007; Palmer et al., 2008; Nettleton et al., 2009; Odegaard et al., 2010; de Koning et al., 2011; Bhupathiraju et al., 2013; The InterAct Consortium, 2013; Fagherazzi et al., 2013; Eshak et al., 2013). Two publications reported on the EPIC cohort (The InterAct Consortium, 2013; Fagherazzi et al., 2013) so results from the smaller cohort were not included in a meta-analysis (Fagherazzi et al., 2013). Two publications reported on the Health Professionals Follow-up Study (de Koning et al., 2011; Bhupathiraju et al., 2013) so results from the shorter follow-up are not included in a meta-analysis (de Koning et al., 2011). One study could not be included in a meta-analysis as it did not report the necessary data to estimate a dose-response trend (Nettleton et al., 2009). Three cohorts only presented results for all soft drinks combined, and fruit juice or fruit, and so were excluded (Montonen et al., 2007; Odegaard et al., 2010; Eshak et al., 2013). One other study included orange and grapefruit juice in its definition of sugars-sweetened soft drinks and was therefore excluded (Paynter et al., 2006). Five cohort studies, in four publications, that presented evidence on the relationship between sugars-sweetened beverages and the incidence of type 2 diabetes mellitus were included in a meta-analysis (Schulze et al., 2004b; Palmer et al., 2008; Bhupathiraju et al., 2013; The InterAct Consortium, 2013). The studies only included sugars-sweetened carbonated beverages as their exposure measure, except one study that also included diluted syrups (The InterAct Consortium, 2013). One additional cohort study was identified as a consequence of consultation on the draft report (Sakurai et al., 2014).
6.37 An association was found between greater sugars-sweetened beverage consumption and higher incidence of type 2 diabetes mellitus (RR=1.23, 95% CI 1.17, 1.30 for each 330ml/day increase; p<0.001), with a heterogeneity of I2=65%. This evidence is only for soft drinks as there are insufficient analyses that include fruit juices. The study identified as a consequence of the consultation on the draft report indicates no significant association between greater sugars-sweetened beverage consumption and incidence of type 2 diabetes mellitus (RR=1.34, 95% CI 0.72, 2.36 for one serving or more a day as compared to rare or no consumption).
84
Sugars-sweetened beverages (ml/day) and type 2 diabetes mellitus
• Association • Moderate evidence • The direction of the association indicates that greater consumption of sugars-sweetened beverages is detrimental to health • The association is biologically relevant
85
Colon cancer 6.38 A pooled analysis of ten cohort studies was identified that presented evidence on
the relationship between sugars-sweetened carbonated soft drinks and incidence of colon cancer (Zhang et al., 2010). At the time of the review, none of the results from individual studies included in the pooled analysis had been published. No further studies were identified in the update search (Colo-rectal health review).
6.39 No significant association was found between sugars-sweetened carbonated soft drink intake and the incidence of colon cancer (RR 0.94, 95% CI 0.66, 1.32, Ptrend=0.91; comparing consumption greater than 550g/day to no consumption).
Sugars-sweetened beverages (g/day) and colon cancer
• No association • Adequate evidence
Children and adolescents 6.40 Prospective cohort studies and randomised controlled trials were identified
which had been conducted in children and adolescents aged five years or more in relation to cardio-metabolic outcomes. The section below outlines findings from these studies where there is sufficient evidence to draw a conclusion.
Body mass index and body fatness Sugars-sweetened beverages Cohort studies
6.41 Six cohort studies were identified that presented evidence on sugars-sweetened beverage intake and body mass index (BMI) in children or adolescents aged 5 years or more (Phillips et al., 2004; Kvaavik et al., 2005; Striegel-Moore et al., 2006; Libuda et al., 2008; Fiorito et al., 2009; Nissinen et al., 2009). The outcome measures were insufficiently comparable to enable a meta-analysis to be performed. No further studies were identified in the update search (Cardio-metabolic review, obesity chapter).
6.42 Three European cohort studies indicate no significant association between sugars-sweetened beverage consumption and BMI (Kvaavik et al., 2005; Libuda et al., 2008; Nissinen et al., 2009). Three US cohorts indicate consumption of sugars-
sweetened beverages is associated with increasing BMI (Phillips et al., 2004; Striegel-Moore et al., 2006; Fiorito et al., 2009).
6.43 Three studies also assessed BMI in relation to unsweetened fruit juice consumption and found no significant association between baseline consumption and BMI at follow-up (Striegel-Moore et al., 2006; Libuda et al., 2008; Fiorito et al., 2009).
6.44 Collectively, these studies provide conflicting evidence concerning the relationship between sugars-sweetened beverages and BMI, with the US studies tending to find small but positive associations and the European studies tending to report no evidence of a significant association.
Sugars-sweetened beverages (g/day, energy/day or servings/day) and BMI
• No association • Limited evidence
86
6.45 Five cohort studies were identified that presented evidence on sugars-sweetened beverage intake and body fatness and fat distribution (Phillips et al., 2004; Mundt et al., 2006; Johnson et al., 2007; Libuda et al., 2008; Fiorito et al., 2009). Two cohorts did not recruit males (Phillips et al., 2004; Fiorito et al., 2009). The outcome measures were insufficiently comparable to enable a meta-analysis to be performed. No further studies were identified in the update search (Cardio-metabolic review, obesity chapter). Percentage body fat was measured in three of the studies (Phillips et al., 2004; Libuda et al., 2008; Fiorito et al., 2009); total body fat in one study (Johnson et al., 2007), and development of fat mass in another (Mundt et al., 2006). The methods used for measuring body fat included skinfold thickness (Libuda et al., 2008), dual-energy X-ray absorptiometry (Mundt et al., 2006; Johnson et al., 2007; Fiorito et al., 2009) and bioimpedance (Phillips et al., 2004).
6.46 No significant association was found between sugars-sweetened beverage intake and body fatness and fat distribution in four of the five cohort studies. One study indicates sugars-sweetened beverage consumption at age 5 years is a significant predictor of adiposity at ages 5 through 15 years (Fiorito et al., 2009). No significant association between unsweetened fruit juice consumption and body fatness and fat distribution was found by the three studies that determine this exposure (Johnson et al., 2007; Libuda et al., 2008; Fiorito et al., 2009). Overall there is no consistent evidence of a significant change in body fat amount or distribution with sugars-sweetened beverage consumption assessed in childhood or adolescence.
Sugars-sweetened beverages (g/day, energy/day and servings/day) and body fatness
• No association • Limited evidence
Randomised controlled trials 6.47 One randomised controlled trial was identified that presented evidence on the
relationship between reducing carbonated beverage consumption, including
sugars-sweetened and non-calorically sweetened, and change in BMI (James et al., 2004). Two randomised controlled trials investigating an effect of reducing sugars-sweetened beverage consumption in children and adolescents in relation to BMI were subsequently identified after the cut-off for both the cardio-metabolic review and the update search (Ebbeling et al., 2012; de Ruyter et al., 2012). The outcome and exposure measures were insufficiently comparable to enable a meta-analysis to be performed.
6.48 A cluster-randomised controlled trial of primary school children in the UK provided data on carbonated beverage consumption and BMI and BMI z-score9
at baseline and one year after an intervention study (James et al., 2004). A total of 644 children aged 7-11 years were randomly assigned to intervention or control groups. Drinks diaries completed over 3 days revealed that carbonated drinks consumption decreased by 0.6 glasses in the intervention group (half of these were carbonated drinks with sugar) but increased by 0.2 glasses in the control group (mean difference 0.7, 95% CI 0.1, 1.3). A limitation in the interpretation of this trial is that the intervention considered all types of carbonated beverage, whether non-calorically- or sugars-sweetened, which were, therefore, not exclusively sugars-sweetened. The intervention and control group children increased BMI and z-score to a similar degree, with no significant between-group difference in the changes. The percentage of overweight and obese children, however, increased in the control group by 7.5%, compared with a decrease in the intervention group of 0.2% (mean difference 7.7%, 95% CI 2.2, 13.1). A follow-up, two years after the educational programme’s discontinuation, with data from 434 of the original 644 children, reported no differences between the groups in terms of the prevalence of overweight (James et al., 2007).
6.49 A trial in the USA randomly assigned 224 overweight and obese adolescents to either a group who were instructed to consume non-caloric beverages in place of sugars-sweetened drinks for a year or a control group who received no intervention (Ebbeling et al., 2012). The intervention group received home delivery of water or non-calorically sweetened beverages to replace sugars-sweetened beverages for one year. After one year, the intervention group consumed fewer sugars-sweetened beverages (mean ±�SEM 0.2±0.4 servings/day compared with 0.9±1.1 servings/day; a serving is 355ml). At two years, the consumption of sugars-sweetened beverages remained lower (mean ± SEM 0.4±0.5 servings/ day compared with 0.8±0.8 servings/day) and the consumption of unsweetened beverages remained higher in the intervention group. At one year (i.e. at the end of the active intervention period), the intervention group had gained significantly less weight (mean difference ± SEM-1.9±0.9 kg; p=0.04) and had a smaller increase in BMI (mean difference ± SEM -0.57±0.28 kg/m2; p=0.045) compared with the control group. Percentage fat mass change, as determined by electrical impedance measures, also tended to be less (mean difference ±SD -0.7±0.4%; p=0.12) in comparison with the control group. After one year, the intervention group no
9 A BMI z-score or standard deviation score indicates how many units (of the standard deviation) a child’s BMI is above or below the average BMI value for their age group and sex. For instance, a z-score of 1.5 indicates that a child is 1.5 standard deviations above the average value, and a z-score of –1.5 indicates a child is 1.5 standard deviations below the average value. (National Obesity Observatory, 2011).
87
longer received non-caloric drinks and both groups were followed up for a further year without receiving any intervention. At the end of the two year period there was no significant difference in weight (mean difference ± SEM -0.8±1.4 kg, P=0.55) or BMI (mean difference ± SEM -0.30±0.40 kg/m2, P=0.46) between the groups.
6.50 A double-blinded placebo-controlled trial randomised 641 normal-weight Dutch children to receive 250 ml/day of a sugars-free, non-caloric sucralose-sweetened beverage or a similar sucrose-containing beverage that provided 435kJ (104 kcal) per serving (de Ruyter et al., 2012). Compliance was measured by assessing urinary sucralose in a random sample of children. At the end of the 18 month intervention, children receiving the non-calorically sweetened beverage had a lower BMI z-score, skinfold thickness, waist to hip ratio and less fat mass, as determined by electrical impedance measures, in comparison with children receiving the sucrose sweetened beverage. Measurements were also obtained from those children that did not complete the trial, showing the results were similar for drop-outs. This trial had good retention rates, was sufficiently powered and provided a direct test of whether non-caloric beverage intake can have an impact on weight gain.
6.51 One of the trials investigates all carbonated beverages, not just sugars-sweetened ones, in relation to BMI, so this does not represent a direct test of the effect of sugars-sweetened beverages (James et al., 2004). The other two trials do provide direct tests of the effect of sugars-sweetened beverages and both report effects of the consumption of sugars-sweetened beverages on increasing weight gain and BMI (Ebbeling et al., 2012; de Ruyter et al., 2012). For Ebbeling et al. (2012), the one year data were considered as this is the period when the subjects were provided with non-calorically sweetened beverages, after this point subjects received no intervention. One trial, in particular, is of a high standard (de Ruyter et al., 2012), and warrants upgrading the judgement to effect based on limited evidence (see Annex 2). The findings of these trials suggest that there is inadequate energy compensation (degree of voluntary reduction in intake of other foods or drinks), for energy delivered as sugar.
Sugars-sweetened beverages and BMI
• Effect • Limited evidence • The direction of the effect demonstrates that greater consumption of sugars-
sweetened beverages is detrimental to health • The effect is biologically relevant
Oral Health Sugars
6.52 In the studies exploring the relationship between sugars and oral health it was unclear what was precisely meant by the exposure term ‘sugars’ as further details were not reported. Whether the term ‘sugars’ referred to a mixture of mono- and di-saccharides or individual mono- and di-saccharides, e.g. sucrose, was not defined.
88
6.53 No meta-analyses have been conducted for studies on dental caries because the data on measures of dietary exposure, caries incidence/prevalence and risk assessment methods were insufficiently comparable. Therefore, only a narrative synthesis of the evidence has been provided.
6.54 Four cohort studies were identified that presented evidence on the relationship between sugars intake and the incidence of dental caries in the mixed and permanent dentition in children. Three of these adjusted their results for tooth brushing (Rugg-Gunn et al., 1984; Rugg-Gunn et al., 1987; Szpunar et al., 1995; Ruottinen et al., 2004) one of them did not (Campain et al., 2003). Two papers report on the same cohort study (Rugg-Gunn et al., 1984; Rugg-Gunn et al., 1987). No further studies were identified in the update search (Oral health review).
6.55 All three cohort studies that adjusted their results for tooth brushing report an association between higher sugars consumption and greater risk of developing dental caries of some type. One study observes an association with fissure caries only, but not for overall two year caries increment or approximal surface caries (Rugg-Gunn et al., 1984; Rugg-Gunn et al., 1987). The study that did not adjust its results for tooth brushing reports no significant association between higher sugars consumption and the incidence of dental caries (Campain et al., 2003).
Amount of sugars consumed (g/day or % energy) and dental caries in mixed and permanent dentition
• Association • Moderate evidence • The direction of the association indicates that greater consumption of sugars is detrimental to oral health • The association is biologically relevant
89
6.56 Three cohort studies were identified that presented evidence on the relationship between frequency of sugars intake and the incidence of dental caries in the mixed and permanent dentition in children, all of which adjusted their results for tooth brushing (Rugg-Gunn et al., 1984; Rugg-Gunn et al., 1987; Szpunar et al., 1995; Levine et al., 2007). Two papers report on the same cohort study (Rugg-Gunn et al., 1984; Rugg-Gunn et al., 1987). No further studies were identified in the update search (Oral health review).
6.57 All three cohort studies that adjusted their results for tooth brushing, report no significant association between the frequency of sugars consumption and risk of developing dental caries. One study that reports the frequency of bedtime sugars consumption from drinks suggests that greater frequency is associated with greater prevalence of dental caries (Levine et al., 2007).
Frequency of sugars (servings/day) and dental caries in mixed and permanent dentition
• No association • Limited evidence
90
Sugars-containing beverages 6.58 Seven cohort studies in eleven publications were identified that presented
evidence on the relationship between sugars-containing beverage consumption and the incidence of dental caries in deciduous dentition in children; in all studies the results were adjusted for tooth brushing (Grytten et al., 1988; Grindefjord et al., 1995; Grindefjord et al., 1996; Tada et al., 1999; Levy et al., 2003; Mariri et al., 2003; Sakuma et al., 2007; Ismail et al., 2008; Warren et al., 2008; Lim et al., 2008; Ismail et al., 2009). Three cohorts were reported in more than one publication: (Grindefjord et al., 1995; Grindefjord et al., 1996) reported on one cohort; (Ismail et al., 2008; Lim et al., 2008; Ismail et al., 2009) reported on a second cohort; and (Mariri et al., 2003; Levy et al., 2003) reported on a third cohort. No further studies were identified in the update search (Oral health review).
6.59 In these cohort studies, sugars-sweetened beverages included sugars-sweetened carbonated beverages, non-carbonated fruit drinks and fruit juice; however, some studies did not specify what they defined as sugars-sweetened/containing beverages.
6.60 An association was found between greater consumption of sugars-containing beverages and increased dental caries incidence in deciduous dentition in five cohort studies (Grindefjord et al., 1995; Grindefjord et al., 1996; Levy et al., 2003; Mariri et al., 2003; Sakuma et al., 2007; Ismail et al., 2008; Warren et al., 2008; Lim et al., 2008; Ismail et al., 2009). The two other cohort studies report no significant association between sugars-containing beverage consumption and the development of dental caries at 36 months (Grytten et al., 1988) or with sweet drink intake between meals and 18 months dental caries increment in deciduous dentition (Tada et al., 1999).
Amount and frequency of sugars-containing beverages consumption (servings/day or ml/day) and dental caries in deciduous dentition
• Association • Adequate evidence • The direction of the association indicates that greater consumption of sugars-sweetened beverages is detrimental to oral health • The association is biologically relevant
Sugars-containing foods 6.61 Eleven cohort studies were identified that presented evidence on the relationship
between the amount of sugars-containing foods and/or sugars confectionery consumed and the incidence of dental caries in deciduous dentition in children. Sugars-containing foods include sweets/candy, between meal sweet food intake, sugars-containing foods, sugars-containing snacks, sucrose rich foods, sugar-starch
foods. Five of these adjusted their results for tooth brushing (Grytten et al., 1988; Grindefjord et al., 1995; Grindefjord et al., 1996; Tada et al., 1999; Levy et al., 2003; Mariri et al., 2003; Sakuma et al., 2007) and six of them did not (Persson et al., 1985; Wilson & Ashley, 1989; Holbrook, 1993; Holbrook et al., 1995; Pienihakkinen et al., 2004; Law & Seow, 2006). Two cohorts were reported in more than one publication: (Grindefjord et al., 1995; Grindefjord et al., 1996) reported on one cohort and (Mariri et al., 2003; Levy et al., 2003) reported on a second cohort. One study was subsequently identified in the update search (Fontana et al., 2011), which did not adjust for tooth brushing (Oral health review; Update search).
6.62 Two studies that adjust for tooth brushing indicate an association between greater consumption of sugars confectionery and greater risk of dental caries at 18 months and 3.5 years (Grindefjord et al., 1995; Grindefjord et al., 1996; Sakuma et al., 2007). The three other studies that adjust for tooth brushing indicate no significant association between consumption of sugars-sweetened food or sweet confectionery and dental caries (Grytten et al., 1988; Tada et al., 1999; Mariri et al., 2003). All six of the cohort studies that did not adjust their results for tooth brushing indicate an association between higher consumption of sugars-containing foods or confectionery and greater risk of dental caries. The study identified in the update search reports that snacking on candy, cake, cookies, ice cream or dried fruit is not associated with dental caries incidence, but two dietary snacking behaviours (reported as ‘child does not snack on fresh fruit’ and ‘child does snack on popcorn’) are associated with caries.
Amount and frequency of sugars-containing foods and/or sugars confectionery consumption (servings/day or servings/week) and dental caries in deciduous dentition
• Association • Limited evidence • The direction of the association indicates that greater consumption of sugars-containing foods and/or sugars confectionery is detrimental to oral health • The association is biologically relevant
91
6.63 Eight cohort studies in nine publications were identified that presented evidence on the relationship between the frequency of consumption of sugars-containing foods and/or sugars confectionery and the incidence of caries in the mixed/ permanent dentition. Five of these adjusted their results for tooth brushing (Mattila et al., 2001; Leroy et al., 2005; Mattila et al., 2005; Kallestal & Fjelddahl, 2007; Ollila & Larmas, 2007; Tamaki et al., 2009) and three of them did not (Wilson & Ashley, 1989; Petti & Hausen, 2000; Bruno-Ambrosius et al., 2005). Two articles reported on the same cohort (Mattila et al., 2001; Mattila et al., 2005), which followed up a birth cohort until the children were 10 years of age. Two additional studies were identified in the update search, both of which adjusted their results for tooth brushing (Ferreira et al., 2011; Alm et al., 2012) (Oral health review; Update search).
6.64 Three studies report an association between higher frequency of consumption of sugars in confectionery and greater dental caries incidence (Mattila et al., 2001; Mattila et al., 2005; Kallestal & Fjelddahl, 2007; Ollila & Larmas, 2007). Two studies
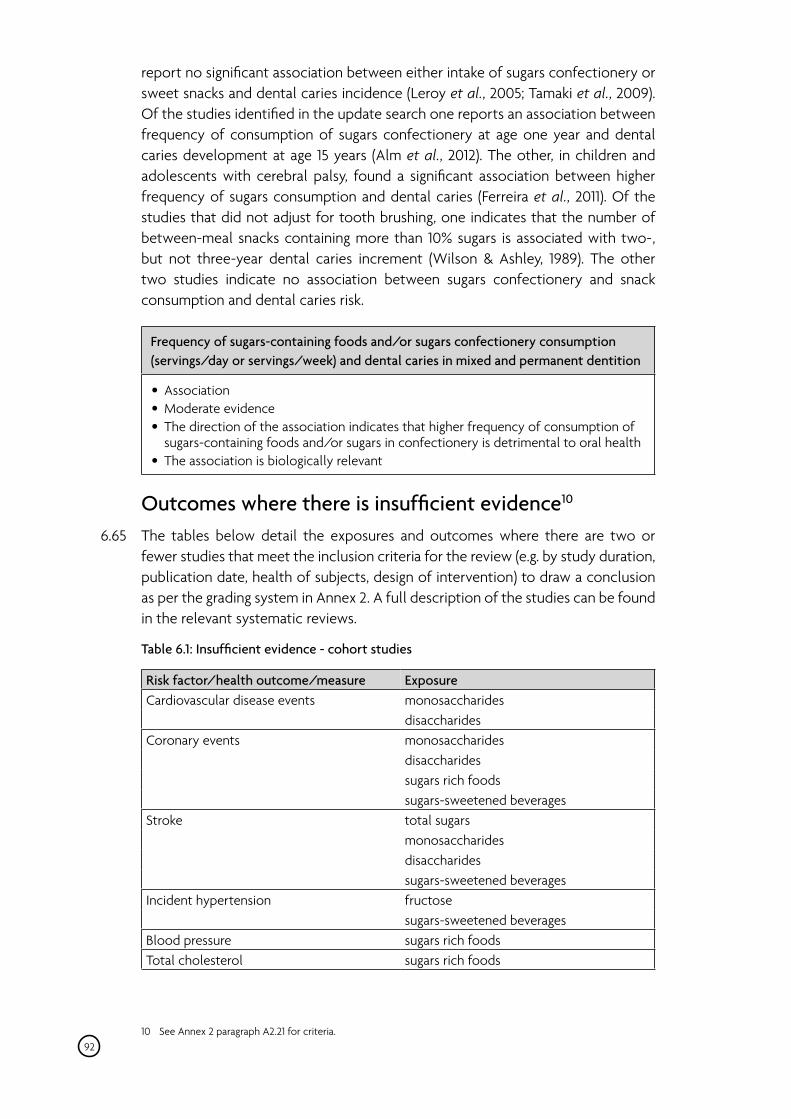
report no significant association between either intake of sugars confectionery or sweet snacks and dental caries incidence (Leroy et al., 2005; Tamaki et al., 2009). Of the studies identified in the update search one reports an association between frequency of consumption of sugars confectionery at age one year and dental caries development at age 15 years (Alm et al., 2012). The other, in children and adolescents with cerebral palsy, found a significant association between higher frequency of sugars consumption and dental caries (Ferreira et al., 2011). Of the studies that did not adjust for tooth brushing, one indicates that the number of between-meal snacks containing more than 10% sugars is associated with two- , but not three-year dental caries increment (Wilson & Ashley, 1989). The other two studies indicate no association between sugars confectionery and snack consumption and dental caries risk.
Frequency of sugars-containing foods and/or sugars confectionery consumption (servings/day or servings/week) and dental caries in mixed and permanent dentition
• Association • Moderate evidence • The direction of the association indicates that higher frequency of consumption of sugars-containing foods and/or sugars in confectionery is detrimental to oral health • The association is biologically relevant
92
Outcomes where there is insufficient evidence10
6.65 The tables below detail the exposures and outcomes where there are two or fewer studies that meet the inclusion criteria for the review (e.g. by study duration, publication date, health of subjects, design of intervention) to draw a conclusion as per the grading system in Annex 2. A full description of the studies can be found in the relevant systematic reviews.
Table 6.1: Insufficient evidence - cohort studies
Risk factor/health outcome/measure Exposure Cardiovascular disease events monosaccharides
disaccharides Coronary events monosaccharides
disaccharides sugars rich foods sugars-sweetened beverages
Stroke total sugars monosaccharides disaccharides sugars-sweetened beverages
Incident hypertension fructose sugars-sweetened beverages
Blood pressure sugars rich foods Total cholesterol sugars rich foods
10 See Annex 2 paragraph A2.21 for criteria.
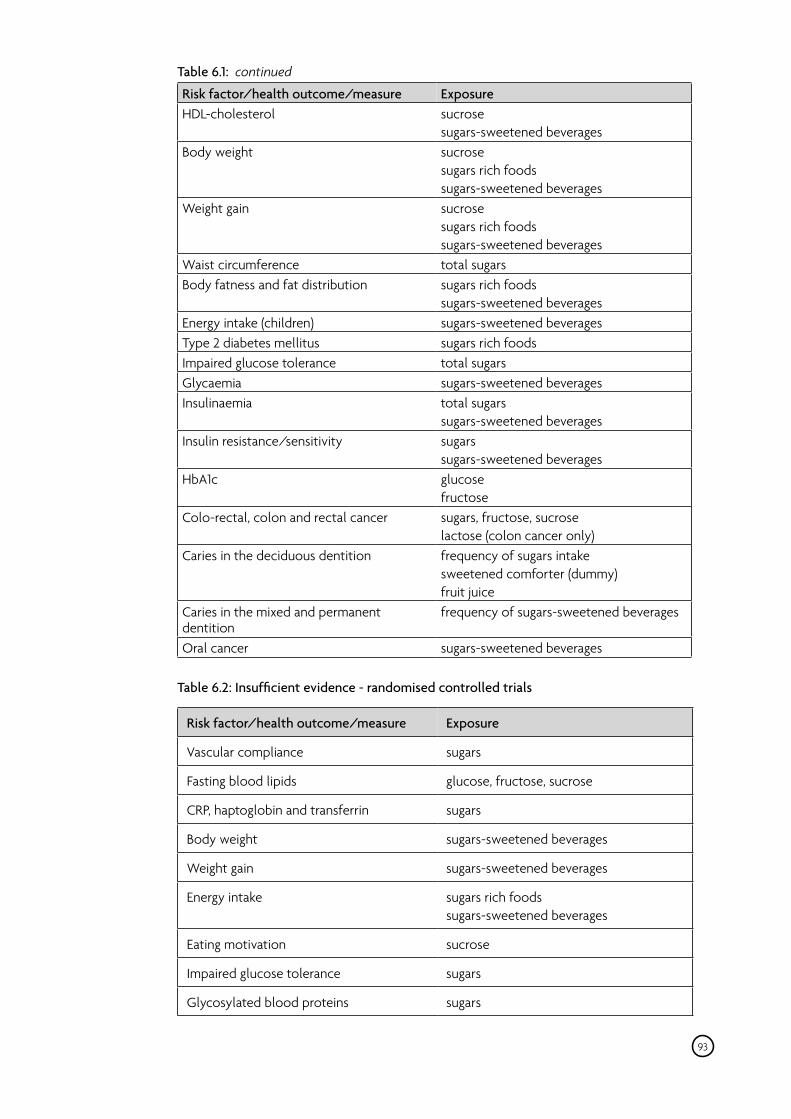
Table 6.1: continued
Risk factor/health outcome/measure Exposure HDL-cholesterol sucrose
sugars-sweetened beverages Body weight sucrose
sugars rich foods sugars-sweetened beverages
Weight gain sucrose sugars rich foods sugars-sweetened beverages
Waist circumference total sugars Body fatness and fat distribution sugars rich foods
sugars-sweetened beverages Energy intake (children) sugars-sweetened beverages Type 2 diabetes mellitus sugars rich foods Impaired glucose tolerance total sugars Glycaemia sugars-sweetened beverages Insulinaemia total sugars
sugars-sweetened beverages Insulin resistance/sensitivity sugars
sugars-sweetened beverages HbA1c glucose
fructose Colo-rectal, colon and rectal cancer sugars, fructose, sucrose
lactose (colon cancer only) Caries in the deciduous dentition frequency of sugars intake
sweetened comforter (dummy) fruit juice
Caries in the mixed and permanent frequency of sugars-sweetened beverages dentition Oral cancer sugars-sweetened beverages
Table 6.2: Insufficient evidence - randomised controlled trials
Risk factor/health outcome/measure Exposure
Vascular compliance sugars
Fasting blood lipids glucose, fructose, sucrose
CRP, haptoglobin and transferrin sugars
Body weight sugars-sweetened beverages
Weight gain sugars-sweetened beverages
Energy intake sugars rich foods sugars-sweetened beverages
Eating motivation sucrose
Impaired glucose tolerance sugars
Glycosylated blood proteins sugars
93
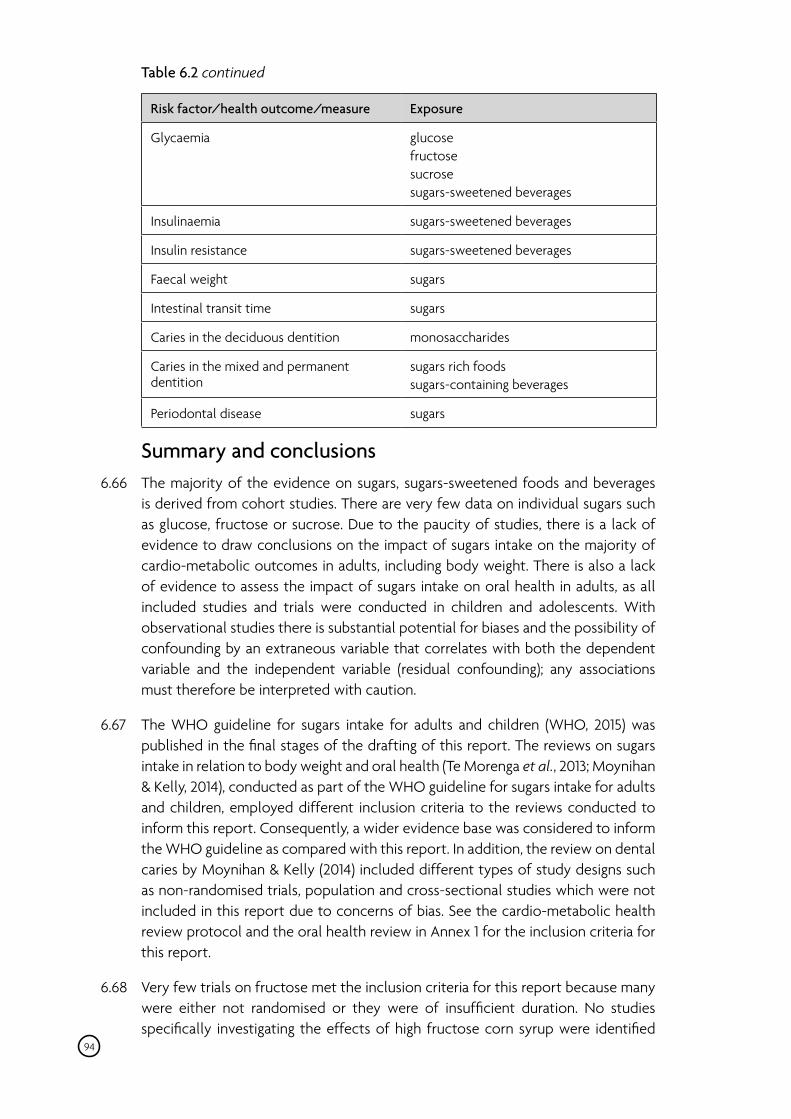
Table 6.2 continued
Risk factor/health outcome/measure Exposure
Glycaemia glucose fructose sucrose sugars-sweetened beverages
Insulinaemia sugars-sweetened beverages
Insulin resistance sugars-sweetened beverages
Faecal weight sugars
Intestinal transit time sugars
Caries in the deciduous dentition monosaccharides
Caries in the mixed and permanent dentition
sugars rich foods sugars-containing beverages
Periodontal disease sugars
Summary and conclusions 6.66 The majority of the evidence on sugars, sugars-sweetened foods and beverages
is derived from cohort studies. There are very few data on individual sugars such as glucose, fructose or sucrose. Due to the paucity of studies, there is a lack of evidence to draw conclusions on the impact of sugars intake on the majority of cardio-metabolic outcomes in adults, including body weight. There is also a lack of evidence to assess the impact of sugars intake on oral health in adults, as all included studies and trials were conducted in children and adolescents. With observational studies there is substantial potential for biases and the possibility of confounding by an extraneous variable that correlates with both the dependent variable and the independent variable (residual confounding); any associations must therefore be interpreted with caution.
6.67 The WHO guideline for sugars intake for adults and children (WHO, 2015) was published in the final stages of the drafting of this report. The reviews on sugars intake in relation to body weight and oral health (Te Morenga et al., 2013; Moynihan & Kelly, 2014), conducted as part of the WHO guideline for sugars intake for adults and children, employed different inclusion criteria to the reviews conducted to inform this report. Consequently, a wider evidence base was considered to inform the WHO guideline as compared with this report. In addition, the review on dental caries by Moynihan & Kelly (2014) included different types of study designs such as non-randomised trials, population and cross-sectional studies which were not included in this report due to concerns of bias. See the cardio-metabolic health review protocol and the oral health review in Annex 1 for the inclusion criteria for this report.
6.68 Very few trials on fructose met the inclusion criteria for this report because many were either not randomised or they were of insufficient duration. No studies specifically investigating the effects of high fructose corn syrup were identified
94
that met the inclusion criteria. As there is concern around fructose consumption and its implications for cardio-metabolic health, evidence from trials that did not meet the inclusion criteria for this report and its implications to public health were considered. Details of this consideration are to be found in Annex 3.
6.69 Randomised controlled trials conducted in adults indicate that increasing or decreasing the percentage of total dietary energy as sugars when consuming an ad libitum diet, either through the substitution of other macronutrient components or by replacing sugars with non-caloric sweeteners, leads to corresponding relative increases or decreases in energy intake. Evidence from trials conducted in children and adolescents indicates that consumption of sugars-sweetened beverages, as compared with non-calorically sweetened beverages, results in greater weight gain and increases in body mass index, however the evidence is limited to a small number of studies. The findings of these trials suggest that there is inadequate energy compensation (degree of voluntary reduction in intake of other foods or drinks), for energy delivered as sugar.
6.70 In cohort studies, intake of sugars or individual sugars is not associated with the incidence of type 2 diabetes mellitus. Findings from randomised controlled trials show no effect of diets differing in sugars content on glycaemia, insulinaemia or insulin resistance, but the evidence is limited. A greater risk of developing type 2 diabetes mellitus is associated with the consumption of sugars-sweetened beverages in cohort studies, but there are too few trials on glycaemia, insulinaemia and insulin resistance to draw firm conclusions with regard to sugars-sweetened beverage intake. There is no association between sugars intake and the risk of coronary events. No evidence was available on sugars consumption in relation to cardiovascular diseases, but one cohort study highlighted after the review cut-off date indicates a detrimental association with higher added sugars intakes (Yang et al., 2014). In trials, varying sugars intake has no effect on blood pressure or fasting cholesterol and triacylglycerol concentrations, but the evidence for this is limited. A recent meta-analysis (Te Morenga et al., 2014), which employed different inclusion criteria to the reviews conducted to inform this report, did report higher sugar intakes, as compared to lower intakes, to raise fasting triacylglycerol and cholesterol concentrations and raise diastolic blood pressure. There was no significant effect on systolic blood pressure overall but when trials that were 8 weeks or more in duration were analysed, higher consumption of sugars led to higher blood pressure.
6.71 The evidence for a relationship between sugars intake and dental caries comes from cohort studies and trials conducted in children and adolescents. There is a paucity of studies and trials in adults, however the mechanism for the development of dental caries is the same for adults as it is for children. Cohort studies that adjusted results for tooth brushing frequency were given more weight during consideration than those that did not. Greater consumption (i.e. the amount) of total sugars and sugars-containing foods and beverages is associated with a greater risk of dental caries in the deciduous and permanent dentitions. Greater frequency of consumption of sugars-containing foods and beverages, but not total sugars, is also associated with greater risk of dental caries in the deciduous
95
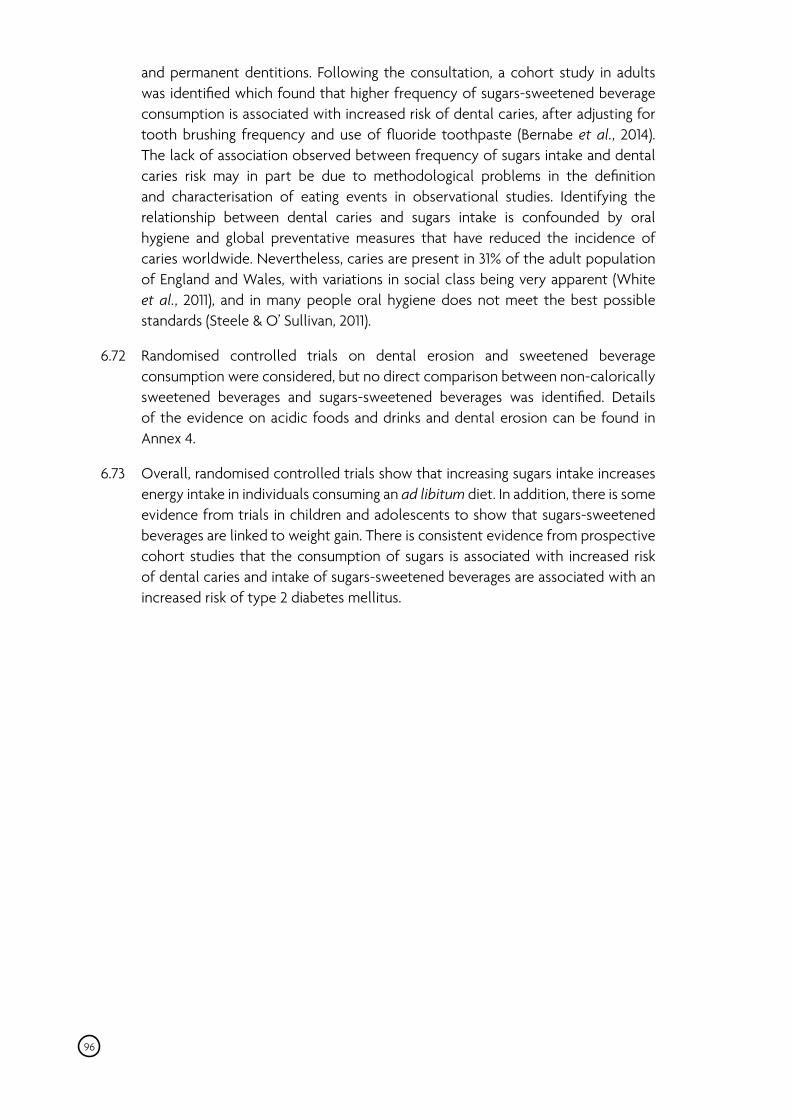
and permanent dentitions. Following the consultation, a cohort study in adults was identified which found that higher frequency of sugars-sweetened beverage consumption is associated with increased risk of dental caries, after adjusting for tooth brushing frequency and use of fluoride toothpaste (Bernabe et al., 2014). The lack of association observed between frequency of sugars intake and dental caries risk may in part be due to methodological problems in the definition and characterisation of eating events in observational studies. Identifying the relationship between dental caries and sugars intake is confounded by oral hygiene and global preventative measures that have reduced the incidence of caries worldwide. Nevertheless, caries are present in 31% of the adult population of England and Wales, with variations in social class being very apparent (White et al., 2011), and in many people oral hygiene does not meet the best possible standards (Steele & O’ Sullivan, 2011).
6.72 Randomised controlled trials on dental erosion and sweetened beverage consumption were considered, but no direct comparison between non-calorically sweetened beverages and sugars-sweetened beverages was identified. Details of the evidence on acidic foods and drinks and dental erosion can be found in Annex 4.
6.73 Overall, randomised controlled trials show that increasing sugars intake increases energy intake in individuals consuming an ad libitum diet. In addition, there is some evidence from trials in children and adolescents to show that sugars-sweetened beverages are linked to weight gain. There is consistent evidence from prospective cohort studies that the consumption of sugars is associated with increased risk of dental caries and intake of sugars-sweetened beverages are associated with an increased risk of type 2 diabetes mellitus.
96
7 Starch and starch-rich foods
7.1 This assessment is based on prospective cohort studies and randomised controlled trials investigating the relationship between intake of starch and starch-rich foods in relation to cardio-metabolic health outcomes. Links to the individual systematic reviews and update search are given in Annex 1.
7.2 Evidence on health/disease outcomes has been discussed in detail only where there are sufficient data for a conclusion to be drawn from studies meeting the pre-agreed inclusion criteria. Outcomes where there are too few studies to reach a conclusion are listed at the end of the chapter (see Tables 7.1 and 7.2). Outcomes where the evidence was considered too inconsistent to make a valid judgement are also listed at the end of the chapter (see Table 7.3).
7.3 For the prospective cohort study meta-analyses, the relative risks for starch intake are presented for each 50g/day increase. For refined grain intake, relative risks are presented for each half serving/day increase as this is equivalent to approximately one standard deviation in adult refined grain intake, as based on UK data from the National Diet and Nutrition Survey (Lang et al., 2003). It is unclear how starch is defined and/or determined in cohort studies, which is a limitation for interpretation.
Adults
Starch Coronary events
7.4 Four cohort studies were identified that presented evidence on total starch intake and incidence of fatal or non-fatal coronary events (Fehily et al., 1993; Pietinen et al., 1996; Liu et al., 2000c; Beulens et al., 2007). Due to variation in the exposures reported and the lack of age-adjustment in one cohort study (Fehily et al., 1993), there were too few studies to undertake a meta-analysis. Three cohort studies were subsequently identified in the update search (Sieri et al., 2010; Burger et al., 2011; Wallstrom et al., 2012) (Cardio-metabolic review, cardiovascular disease chapter; Update search).
7.5 No association between starch intake and incidence of coronary events was observed in any of the cohort studies, except one (Burger et al., 2011), which observed that higher starch intake expressed as g/day is associated with greater incidence of coronary events in men, but not in women.
Starch (g/day) and coronary events
• No association • Moderate evidence
97
Type 2 diabetes mellitus 7.6 Eight cohort studies were identified that presented evidence on total starch intake
and the incidence of type 2 diabetes mellitus, four of which were included in a meta-analysis (Meyer et al., 2000; Hodge et al., 2004; Barclay et al., 2007; Schulze et al., 2008). Four studies could not be included in a meta-analysis as they did not report the necessary data (Feskens et al., 1995; Monterrosa et al., 1995; Leonetti et al., 1996; Janket et al., 2003). One cohort study was subsequently identified in the update search (Sluijs et al., 2010) (Cardio-metabolic review; Update search).
7.7 No association was found between total starch intake and type 2 diabetes mellitus (RR 1.00, 95% CI 0.84, 1.19 for each 50g/day increase; p=0.96). The studies that are not included in the meta-analysis do not observe an association between starch intakes and risk of type 2 diabetes mellitus. The study identified in the update search observed that a higher starch intake is associated with a greater incidence of type 2 diabetes mellitus (Sluijs et al., 2010).
Starch (g/day) and type 2 diabetes mellitus
• No association Moderate evidence •
Starch-rich foods Refined grains
Cardiovascular disease events 7.8 Three cohort studies were identified that presented evidence on the intake of
refined grains and combined incidence of stroke and coronary events, all of which were included in the meta-analysis (Liu et al., 2000b; Steffen et al., 2003; Jacobs, Jr. et al., 2007). No further cohort studies were identified in the update search (Cardio-metabolic review, cardiovascular disease chapter).
7.9 No association was found between refined grains intake and the combined incidence of stroke and coronary events, referred to as cardiovascular events, (RR 1.00, 95% CI 0.98, 1.01 for each half serving/day increase; p=0.5).
Refined grains (serving/day) and cardiovascular disease events
• No association • Moderate evidence
98
Type 2 diabetes mellitus 7.10 Four cohort studies were identified that presented evidence on refined grains
intake and incidence of type 2 diabetes mellitus, all of which were included in a meta-analysis (Meyer et al., 2000; Liu et al., 2000a; Fung et al., 2002; Montonen et al., 2003). One cohort study was identified in the update search (Yu et al., 2011) (Cardio-metabolic review, diabetes chapter; Update search).
7.11 No association was found between refined grains intake and incidence of type 2 diabetes mellitus (RR 1.00, 95% CI 0.98, 1.01, for each half serving/day increase; p=0.7). The cohort study identified in the update search observed no association between refined grain intake and the incidence of type 2 diabetes.
Refined grains (serving/day) and type 2 diabetes mellitus
No association Moderate evidence
99
Rice
Type 2 diabetes mellitus 7.12 Three cohort studies were identified that presented evidence on rice intake and
incidence of type 2 diabetes mellitus (Liu et al., 2000a; Hodge et al., 2004; Villegas et al., 2007). Due to variation in the exposures reported, a meta-analysis could not be conducted. Six cohort studies were identified in the update search (Sun et al., 2010; Nanri et al., 2010; Yu et al., 2011). One publication reported on data from three cohorts in the United States (Sun et al., 2010), including a cohort reported on previously (Liu et al., 2000a), and another publication reported on two cohorts in Japan (Nanri et al., 2010) (Cardio-metabolic review, diabetes chapter; Update search). A meta-analysis has subsequently reported white rice intake in relation to the incidence of type 2 diabetes mellitus (Hu et al., 2012), which includes seven cohorts identified above (Hodge et al., 2004; Villegas et al., 2007; Nanri et al., 2010; Sun et al., 2010). The results from this meta-analysis are presented below and were used to inform this report.
7.13 The pooled estimate found that higher intake of white rice is associated with a greater incidence of type 2 diabetes mellitus (RR 1.11, 95% CI 1.08, 1.14 for each 158g serving/day increase; Ptrend<0.001). When analysed separately, and comparing highest and lowest categories of rice intakes, no association was found for the four cohorts conducted in Western populations (RR 1.12, 95% CI 0.94, 1.33). However, the three studies performed in Asian populations (Chinese and Japanese) found that white rice intakes were associated with a higher risk of type 2 diabetes mellitus (RR 1.55, 95% CI 1.20, 2.01). One smaller cohort study in a Chinese population identified in the update search, but not included in the meta-analysis (Yu et al., 2011), reports no association between rice intake and the incidence of type 2 diabetes mellitus.
7.14 In the UK, the median portion of cooked rice is 180g with a 75th centile of 235g (Henderson et al., 2003). Overall, UK population intakes are low, the mean intake for cooked white rice amongst consumers is 28g/day (Bates et al., 2012). The levels of intake at which a detrimental association is indicated may only be relevant for a small proportion of the UK population which consumes white rice on a daily basis. It is, therefore, unlikely that there would be a large proportion of people in the UK consuming the very high intakes of rice seen in studies conducted in Asian countries.
White rice (serving/day) and type 2 diabetes mellitus
• Association • Moderate evidence • The direction of the association indicates that high consumption of white rice is detrimental to health • The association is biologically relevant; however, the association is largely derived from reported intakes that are substantially greater than in typical UK diets
100
7.15 Three of the cohort studies in the United States, all of which were reported in the same publication, also report on brown rice intake in relation to incidence of type 2 diabetes mellitus (Sun et al., 2010) and observe that higher intakes of brown rice are associated with a lower incidence of type 2 diabetes mellitus (RR 0.89, 95% CI 0.81, 0. 97 for two or more servings a week as compared with one a month).
Brown rice (serving/day) and type 2 diabetes mellitus
• Association • Limited evidence The direction of association indicates higher intake of brown rice is beneficial to health The association is biologically relevant
Potatoes 7.16 Cohort studies investigating potato consumption did not always report on the
cooking methods used (e.g. frying or boiling). Differences in cooking methods could potentially confound any associations observed between potato intake and cardio-metabolic health outcomes.
Cardiovascular disease events 7.17 Three cohort studies were identified that presented evidence on intake of
potatoes and incidence of cardiovascular disease events (Joshipura et al., 2009; Panagiotakos et al., 2009). One publication reported on data from two cohorts (Joshipura et al., 2009). Due to variation in the exposures reported no meta-analysis was conducted. No further cohort studies were identified in the update search (Cardio-metabolic review, cardiovascular disease chapter).
7.18 Two cohort studies reported an association between greater consumption of potatoes and risk of fatal and non-fatal cardiovascular disease events (Joshipura et al., 2009); the strength and statistical significance of these associations varied with total carbohydrate consumption (tending to increase in higher carbohydrate consumers). The other cohort study reports higher potato consumption by people with cardiovascular disease than those without the disease, but this study only provides age-adjusted estimates (Panagiotakos et al., 2009).
7.19 Two cohort studies were identified that presented evidence on intake of potatoes and incidence of fatal coronary events (Knekt et al., 1994; Pietinen et al., 1996). Two cohort studies were identified in one publication that presented evidence on intake of potatoes and incidence of fatal and non-fatal ischaemic stroke (Joshipura et al., 1999). No further cohort studies were identified in the update search (Cardio-metabolic review, cardiovascular disease chapter). The studies
were combined into a meta-analysis together with studies investigating coronary events to provide an estimate of cardiovascular events. Two studies could not be included in a meta-analysis as they did not report the necessary data to estimate a dose-response trend (Knekt et al., 1994; Joshipura et al., 2009), one of which reported no association between potato consumption and fatal coronary events for men or women (Knekt et al., 1994).
7.20 The heterogeneity was above the pre-specified cut-off of 75% (I2=90%) therefore the pooled estimate was not presented; however, the studies provide no consistent evidence of an association between potato consumption and incidence of cardiovascular events.
Potatoes (serving/day) and cardiovascular disease events
No association Limited evidence
101
Type 2 diabetes mellitus 7.21 Four cohort studies were identified that presented evidence on intake of potatoes
and incidence of type 2 diabetes mellitus, three of which were included in a meta-analysis (Hodge et al., 2004; Montonen et al., 2005; Halton et al., 2006). One study could not be included in a meta-analysis as it did not report the necessary data to estimate a dose-response trend (Villegas et al., 2007). No further cohort studies were identified in the update search (Cardio-metabolic review, diabetes chapter).
7.22 The pooled estimate demonstrates an association between higher potato consumption and higher incidence of type 2 diabetes mellitus (RR 1.07, 95% CI 1.00, 1.15 for each half serving/day increase; p=0.04). The cohort study that was not included in the meta-analysis reports that higher potato consumption is associated with a lower incidence of type 2 diabetes mellitus, but this is in a Chinese cohort where potatoes are not a major source of starch and in this study, sweet potatoes (Ipomoea batatas) are also classified with potatoes (Solanum tuberosum).
Potatoes (serving/day) and type 2 diabetes mellitus
• Association • Limited evidence • The direction of the association suggests that greater consumption of potatoes is associated with a higher incidence of type 2 diabetes mellitus, but it is not possible to exclude confounding by other variables, e.g. cooking methods such as frying • The association is biologically relevant
Outcomes where there is insufficient or inconsistent evidence11
7.23 The tables below detail the exposures and outcomes where there are two or fewer studies that meet the inclusion criteria for the review (e.g. by study duration, publication date, health of subjects, design of intervention), or where the studies are too inconsistent to draw a conclusion as per the grading system in Annex 2. A full description of the studies can be found in the relevant systematic reviews.
11 See Annex 2 paragraph A2.21 for criteria.
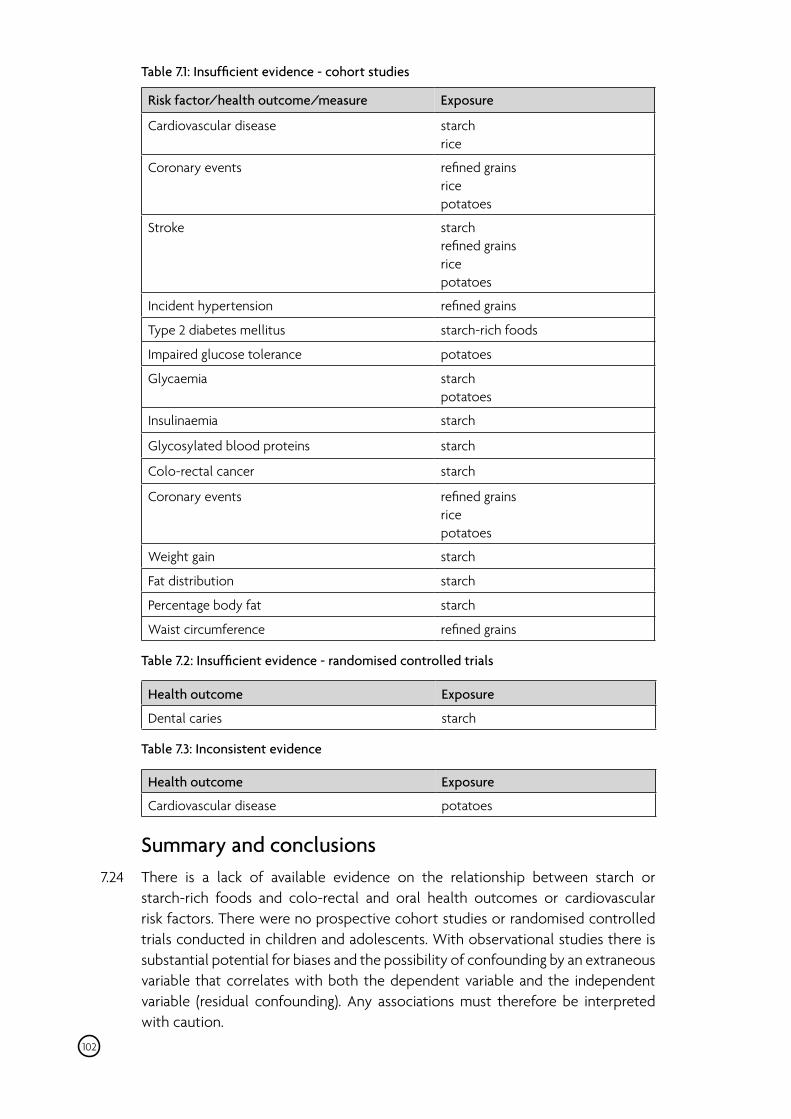
Table 7.1: Insufficient evidence - cohort studies
Risk factor/health outcome/measure Exposure
Cardiovascular disease starch rice
Coronary events refined grains rice potatoes
Stroke starch refined grains rice potatoes
Incident hypertension refined grains
Type 2 diabetes mellitus starch-rich foods
Impaired glucose tolerance potatoes
Glycaemia starch potatoes
Insulinaemia starch
Glycosylated blood proteins starch
Colo-rectal cancer starch
Coronary events refined grains rice potatoes
Weight gain starch
Fat distribution starch
Percentage body fat starch
Waist circumference refined grains
Table 7.2: Insufficient evidence - randomised controlled trials
Health outcome Exposure
Dental caries starch
Table 7.3: Inconsistent evidence
Health outcome Exposure
Cardiovascular disease potatoes
Summary and conclusions 7.24 There is a lack of available evidence on the relationship between starch or
starch-rich foods and colo-rectal and oral health outcomes or cardiovascular risk factors. There were no prospective cohort studies or randomised controlled trials conducted in children and adolescents. With observational studies there is substantial potential for biases and the possibility of confounding by an extraneous variable that correlates with both the dependent variable and the independent variable (residual confounding). Any associations must therefore be interpreted with caution.
102
7.25 Findings from prospective cohort studies suggest there is no association between total starch intake and incidence of coronary events or type 2 diabetes mellitus. Cohort studies also indicate there is no association between the intake of refined grains and risk of type 2 diabetes mellitus. There is insufficient evidence to draw a conclusion on the association between starch intake and weight gain.
7.26 An association between greater consumption of white rice and greater risk of type 2 diabetes mellitus was observed in cohort studies, but this finding is largely based on data from Asian populations (Japanese and Chinese) consuming levels of rice which are not generally observed in the UK. Higher consumption of brown rice is associated with a reduction in the risk for incident type 2 diabetes mellitus, but the evidence is limited due to the small number of studies. A higher consumption of potatoes is associated with a greater risk of type 2 diabetes mellitus, but it is not possible to exclude confounding by other dietary variables and the evidence is limited due to the small number of studies.
103
8 Dietary fibre
8.1 This assessment is based on prospective cohort studies and randomised controlled trials investigating the relationship between dietary fibre and whole grains intake and cardio-metabolic, colo-rectal and oral health outcomes. A full review of all the physiological effects of dietary fibre was not conducted as part of the report. Randomised controlled trials investigating the effects of dietary fibre isolates are considered separately in Annex 5. Links to the individual systematic reviews and update search are given in Annex 1.
8.2 Evidence on health/disease outcomes has been discussed in detail only where there are sufficient data for a conclusion to be drawn from studies meeting the pre-agreed inclusion criteria. Outcomes where there are too few studies to reach a conclusion, are listed at the end of the chapter (see Tables 8.1 and 8.2). Outcomes where the evidence was considered too inconsistent to make a valid judgement are also listed at the end of the chapter (see Table 8.3).
8.3 The evidence relating to dietary fibre is based on studies with diets containing differing amounts of total (mixed) dietary fibre and its specific constituent fibres, and foods containing dietary fibre. Prospective cohort studies do not always report the method used to determine dietary fibre, but among those that do, the AOAC methods 985.29 and 991.43 (Prosky et al., 1988; Lee et al., 1992) are the most frequently used, and only a few studies report using the non-starch polysaccharide method (Englyst et al., 1994).
8.4 For the prospective cohort study meta-analyses the relative risks for dietary fibre, cereal fibre and insoluble fibre intakes are presented for each 7g/day increase in intake. For soluble, insoluble, vegetable and fruit fibre the relative risks are presented for each 4g/day increase and for legume fibre the relative risk is presented for each 1g/day increase. The relative risks for total cereal intake and whole grains intake are presented for each 0.5 serving/day increase and for non-soy legumes for each 0.25 serving/day increase in intake. Each of these values is equivalent to approximately one standard deviation in adult intakes, as based on UK data from the National Diet and Nutrition Survey (Bates et al., 2009).
Adults Dietary fibre Cardiovascular disease
8.5 Four cohort studies were identified that presented evidence on dietary fibre intake and cardiovascular disease incidence. (Liu et al., 2002; Bazzano et al., 2003; Laaksonen et al., 2005; Drogan et al., 2007). Two studies could not be included in a meta-analysis as they did not report the necessary data, leaving an insufficient number of studies to enable a meta-analysis to be performed. Five cohort studies were subsequently identified in the update search (Eshak et al., 2010; Kokubo et al.,
104
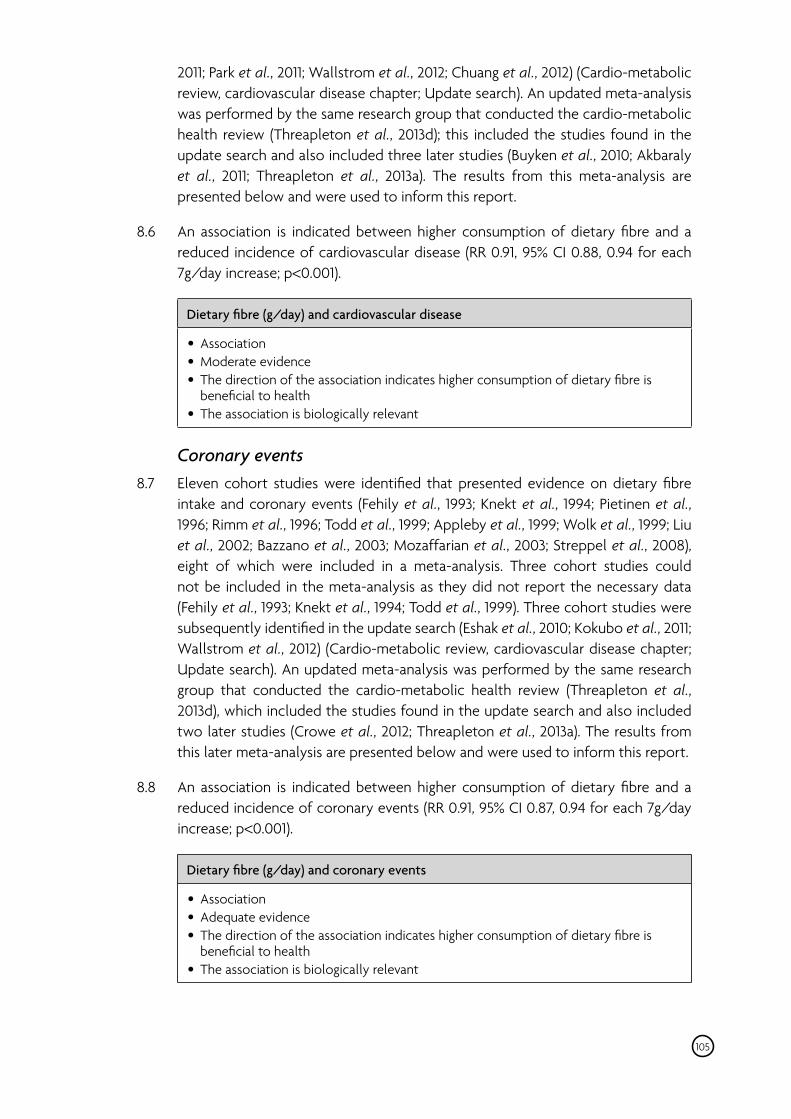
2011; Park et al., 2011; Wallstrom et al., 2012; Chuang et al., 2012) (Cardio-metabolic review, cardiovascular disease chapter; Update search). An updated meta-analysis was performed by the same research group that conducted the cardio-metabolic health review (Threapleton et al., 2013d); this included the studies found in the update search and also included three later studies (Buyken et al., 2010; Akbaraly et al., 2011; Threapleton et al., 2013a). The results from this meta-analysis are presented below and were used to inform this report.
8.6 An association is indicated between higher consumption of dietary fibre and a reduced incidence of cardiovascular disease (RR 0.91, 95% CI 0.88, 0.94 for each 7g/day increase; p<0.001).
Dietary fibre (g/day) and cardiovascular disease
• Association • Moderate evidence • The direction of the association indicates higher consumption of dietary fibre is beneficial to health • The association is biologically relevant
105
Coronary events 8.7 Eleven cohort studies were identified that presented evidence on dietary fibre
intake and coronary events (Fehily et al., 1993; Knekt et al., 1994; Pietinen et al., 1996; Rimm et al., 1996; Todd et al., 1999; Appleby et al., 1999; Wolk et al., 1999; Liu et al., 2002; Bazzano et al., 2003; Mozaffarian et al., 2003; Streppel et al., 2008), eight of which were included in a meta-analysis. Three cohort studies could not be included in the meta-analysis as they did not report the necessary data (Fehily et al., 1993; Knekt et al., 1994; Todd et al., 1999). Three cohort studies were subsequently identified in the update search (Eshak et al., 2010; Kokubo et al., 2011; Wallstrom et al., 2012) (Cardio-metabolic review, cardiovascular disease chapter; Update search). An updated meta-analysis was performed by the same research group that conducted the cardio-metabolic health review (Threapleton et al., 2013d), which included the studies found in the update search and also included two later studies (Crowe et al., 2012; Threapleton et al., 2013a). The results from this later meta-analysis are presented below and were used to inform this report.
8.8 An association is indicated between higher consumption of dietary fibre and a reduced incidence of coronary events (RR 0.91, 95% CI 0.87, 0.94 for each 7g/day increase; p<0.001).
Dietary fibre (g/day) and coronary events
• Association • Adequate evidence • The direction of the association indicates higher consumption of dietary fibre is beneficial to health • The association is biologically relevant
Stroke 8.9 Four cohort studies were identified that presented evidence on dietary fibre intake
and stroke, all of which were included in a meta-analysis (Ascherio et al., 1998; Bazzano et al., 2003; Oh et al., 2005; Larsson et al., 2009). Three cohort studies were subsequently identified in the update search (Eshak et al., 2010; Kokubo et al., 2011; Wallstrom et al., 2012) (Cardio-metabolic review, Cardiovascular disease chapter; Update search). An updated meta-analysis was performed by the same research group that conducted the cardio-metabolic health review (Threapleton et al., 2013c), which included the studies found in the update search. The results from this later meta-analysis are presented below and were used to inform this r eport.
8.10 An association is indicated between higher consumption of dietary fibre and a reduced incidence of haemorrhagic plus ischemic stroke (RR 0.93, 95% CI 0.88, 0.98 for each 7g/day increase; p=0.002).
Dietary fibre (g/day) and stroke
• Association • Adequate evidence • The direction of the association indicates higher consumption of dietary fibre is beneficial to health • The association is biologically relevant
Fasting blood lipids 8.11 Five randomised controlled trials were identified that presented evidence
on consumption of (mixed) dietary fibre in relation to total cholesterol, LDL-cholesterol, HDL-cholesterol and triacylglycerol concentration, all of which were included in a meta-analysis (Kesaniemi et al., 1990; Aller et al., 2004; Thompson et al., 2005; Andersson et al., 2007; Olendzki et al., 2009). No further trials were identified in the update search (Cardio-metabolic review, hyperlipidaemia and blood lipid review chapter).
8.12 No significant effect is demonstrated for the consumption of diets higher in dietary fibre relative to low dietary fibre diets on fasting total cholesterol concentration (-0.08mmol/L, 95% CI -0.27, 0.11; p=0.4), fasting LDL-cholesterol concentration (-0.02mmol/L, 95% CI -0.20, 0.15; p=0.8), fasting HDL-cholesterol concentration (-0.07mmol/L, 95% CI -0.17, 0.04; p=0.2) or fasting triacylglycerol concentration (-0.06mmol/L, 95% CI -0.27, 0.15; p=0.57).
Dietary fibre and fasting total cholesterol, LDL-cholesterol, HDL-cholesterol and triacylglycerol concentration
• No association • Adequate evidence
Body weight change 8.13 Four cohort studies were identified that presented evidence on dietary fibre intake
and body weight change (Colditz et al., 1990; Ludwig et al., 1999; Iqbal et al., 2006;
106
Hays et al., 2006). The data were insufficiently comparable for a meta-analysis to be performed. One cohort study was subsequently identified in the update search (Du et al., 2010) (Cardio-metabolic review, obesity chapter; Update search).
8.14 No significant association between dietary fibre intake, as grams/day, and body weight change is indicated in two studies (Colditz et al., 1990; Iqbal et al., 2006). Two studies assess the fibre density of the diet in relation to body weight change: one indicates higher fibre-density is associated with less body weight gain (Ludwig et al., 1999) and the other indicates higher fibre-density is associated with greater body weight gain (Hays et al., 2006). The study identified in the update search indicates higher intake of dietary fibre is associated with less body weight gain (Du et al., 2010).
8.15 Overall, these cohort studies provide no evidence of a consistent association between dietary fibre intake and body weight change.
Dietary fibre (g/day or fibre density) and body weight change
No association Moderate evidence
Energy intake 8.16 Six randomised controlled trials were identified that presented evidence on the
effects of dietary fibre-rich diets in relation to energy intakes, all of which were included in a meta-analysis (Kesaniemi et al., 1990; Sciarrone et al., 1993; Turpeinen et al., 2000; Thompson et al., 2005; Andersson et al., 2007; Olendzki et al., 2009) (Cardio-metabolic review, energy intake chapter).
8.17 No significant effect of the consumption of a dietary fibre-rich diet on energy intake was found (-445.9kJ/day, 95% CI -957.6, 65.82; p=0.09). The majority of the studies did not make allowance for the metabolisable energy that may become available from fibre due to fermentation and therefore some studies may have over-estimated the decrease in energy intake.
Dietary fibre and energy intake
• No effect • Moderate evidence
Type 2 diabetes mellitus 8.18 Eleven cohort studies were identified that presented evidence on dietary fibre
intake and type 2 diabetes mellitus (Salmeron et al., 1997a; Salmeron et al., 1997b; Meyer et al., 2000; Stevens et al., 2002; Montonen et al., 2003; Hodge et al., 2004; Schulze et al., 2004a; Lindstrom et al., 2006; Barclay et al., 2007; Schulze et al., 2007b; Wannamethee et al., 2009), ten of which were included in a meta-analysis. One cohort study, that could not be included in a meta-analysis as it did not report the necessary data, indicated no statistically significant association between dietary fibre intake and type 2 diabetes mellitus (Lindstrom et al., 2006). Three
107
cohort studies were identified in the update search (Sluijs et al., 2010; Hopping et al., 2010; Sakurai et al., 2012) (Cardio-metabolic review, diabetes and glycaemia chapter; Update search).
8.19 An association is indicated between higher consumption of dietary fibre and a reduced incidence of type 2 diabetes mellitus (RR 0.94, 95% CI 0.90, 0.97 for each 7g/day increase; p=0.001). Two of the studies identified in the update search indicate higher dietary fibre intake is associated with a reduction in the incidence of type 2 diabetes mellitus (Sluijs et al., 2010; Hopping et al., 2010) and the other study indicates no statistically significant association between dietary fibre intake and the incidence of type 2 diabetes (Sakurai et al., 2012).
Dietary fibre (g/day) and type 2 diabetes mellitus
• Association • Adequate evidence • The direction of the association indicates a higher consumption of dietary fibre is beneficial to health • The association is biologically relevant
108
Fasting blood glucose 8.20 Four randomised controlled trials were identified that presented evidence on
dietary fibre in relation to blood glucose, all of which were included in a meta-analysis (Aller et al., 2004; Thompson et al., 2005; Andersson et al., 2007; Olendzki et al., 2009). One trial was subsequently identified in the update search (Venn et al., 2010) (Cardio-metabolic review, diabetes and glycaemia chapter; Update search).
8.21 The heterogeneity is above the pre-specified cut-off of 75% (I2=82%) and, therefore, the pooled estimate has not been reported. No consistent effect is demonstrated for dietary fibre intake on fasting blood glucose concentration in the forest plot. The trial identified in the update search demonstrates no significant effect of dietary fibre intake on fasting blood glucose concentration.
Dietary fibre and fasting blood glucose concentration
• No effect • Limited evidence
Fasting insulin 8.22 Three randomised controlled trials were identified that presented evidence
on dietary fibre in relation to fasting insulin concentration (Aller et al., 2004; Thompson et al., 2005; Andersson et al., 2007). No further trials were identified in the update search (Cardio-metabolic review, diabetes and glycaemia chapter).
8.23 Due to variation between the different methodologies used to measure fasting insulin concentration, it was not possible to conduct a meta-analysis. All trials report no significant effect of dietary fibre on fasting insulin concentration.
Dietary fibre and fasting insulin concentration
• No effect • Moderate evidence
109
Faecal weight and intestinal transit time 8.24 Five randomised controlled trials were identified that presented evidence on
dietary fibre in relation to intestinal transit times and faecal weight (Beyer & Flynn, 1978; Kelsay et al., 1978; Stasse-Wolthuis et al., 1979; Stasse-Wolthuis et al., 1980; Kesaniemi et al., 1990). The data on dietary intakes were insufficiently comparable to enable a meta-analysis to be performed. No further trials were identified in the update search (Colo-rectal health review).
8.25 An effect of higher fibre diets, containing cereals, fruits and vegetables, is demonstrated on increasing faecal wet weights and decreasing intestinal transit times. The increase in faecal weight is approximately a 4g increase in wet weight per 1g dietary fibre.
Dietary fibre and faecal weight and intestinal transit time
• Effect • Adequate evidence • The direction of the effect demonstrates higher consumption of dietary fibre is potentially beneficial to health The effect is potentially biologically relevant
Colo-rectal cancer 8.26 Ten cohort studies were identified that presented evidence on dietary fibre intake
and colo-rectal cancer (Pietinen et al., 1999; Mai et al., 2003; Lin et al., 2005; Michels et al., 2005; Otani et al., 2006; Shin et al., 2006; Nomura et al., 2007; Schatzkin et al., 2007; Wakai et al., 2007; Butler et al., 2008). One cohort study could not be included in a meta-analysis as it did not report the necessary data (Butler et al., 2008). One cohort study was identified in the update search (Murphy et al., 2012) (Colo-rectal health review; Update search). Murphy et al. (2012) provided data from the same cohort as Bingham et al. (2005), but with a longer follow-up period. An updated meta-analysis was performed which included Murphy et al. (2012) in place of Bingham et al. (2005). The pooled estimate provided in paragraph 8.28 is taken from the updated meta-analysis (Annex 1 additional meta-analyses).
8.27 A pooling project (combining individual participant data) reported a meta-analysis of dietary fibre intake, and its constituent fibres, in relation to colo-rectal, colon or rectal cancer incidence (Park et al., 2005). It included the data from 13 cohorts (van den Brandt et al., 1990; Kato et al., 1997; Bandera et al., 1997; Pietinen et al., 1999; Terry et al., 2001; Sieri et al., 2002; Terry et al., 2002; Mai et al., 2003; McCullough et al., 2003; Larsson et al., 2005; Lin et al., 2005; Michels et al., 2005; McCarl et al., 2006) (Colo-rectal health review). The pooling project indicated no significant association between dietary fibre intake, or intake of individual constituent fibres, and colo-rectal, colon or rectal cancer incidence. In the colo-rectal health review,
dietary fibre meta-analyses for colo-rectal, colon or rectal cancer incidence were performed, which included the findings from the pooling project and excluded the cohorts contained within it, but there was little difference in the results when the pooling project was excluded and the individual cohorts were included (Colo-rectal health review).
8.28 The meta-analysis of the eleven cohort studies indicates an association between higher consumption of dietary fibre and a reduced incidence of colo-rectal cancer (RR 0.92, 95% CI 0.87, 0.97 for each 7g/day increase; p=0.002).
Dietary fibre (g/day) and colo-rectal cancer
• Association • Adequate evidence • The direction of the association indicates higher consumption of dietary fibre is beneficial to health • The association is biologically relevant
110
Colon cancer 8.29 Eight cohort studies were identified that presented evidence on dietary fibre intake
and colon cancer, all of which were included in a meta-analysis (McCullough et al., 2003; Michels et al., 2005; Bingham et al., 2005; Otani et al., 2006; Shin et al., 2006; Nomura et al., 2007; Schatzkin et al., 2007; Wakai et al., 2007). Two cohort studies were identified in the update search (Hansen et al., 2012; Murphy et al., 2012). Murphy et al. (2012) provided data from the same cohort as Bingham et al. (2005), but with a longer follow-up period. An updated analysis was performed which included Murphy et al. (2012) in place of Bingham et al. (2005) (Annex 1 additional meta-analyses). The results from this meta-analysis are presented below and were used to inform this report. A cohort study identified in the update search Hansen et al. (2012) was not included in the meta-analysis as it reported data from Scandinavian cohorts within the EPIC study, which were already included (Colo-rectal health review; Update search).
8.30 An association is indicated between higher consumption of dietary fibre and a reduced incidence of colon cancer (RR 0.93, 95% CI 0.89, 0.98 for each 7g/day increase; p=0.007).
Dietary fibre (g/day) and colon cancer
• Association • Adequate evidence • The direction of the association indicates higher consumption of dietary fibre is beneficial to health • The association is biologically relevant
Rectal cancer 8.31 Seven cohort studies were identified, in six publications, that presented evidence
on dietary fibre intake and rectal cancer, all of which were included in a meta-analysis (Michels et al., 2005; Otani et al., 2006; Shin et al., 2006; Nomura et al.,
2007; Schatzkin et al., 2007; Wakai et al., 2007). One cohort study was identified in the update search (Murphy et al., 2012) (Colo-rectal health review; Update search). In the colo-rectal health review, Bingham et al. (2005) was included in the meta-analysis. Murphy et al. (2012) provided data from the same cohort as Bingham et al. (2005), but with a longer follow-up period. Therefore an updated analysis was performed which included Murphy et al. (2012) in place of Bingham et al. (2005). The pooled estimate provided in paragraph 8.32 is taken from the updated meta-analysis (Annex 1 additional meta-analyses).
8.32 A significant association is indicated between higher consumption of dietary fibre and a reduced incidence of rectal cancer (RR 0.91, 95% CI 0.86, 0.97 for each 7g/ day increase; p=0.007).
Dietary fibre (g/day) and rectal cancer
• Association • Limited evidence • The direction of the association indicates higher consumption of dietary fibre is beneficial to health • The association is biologically relevant
111
Insoluble fibre Cardiovascular disease
8.33 One cohort study was initially identified that presented evidence on insoluble fibre intake and coronary events (Liu et al., 2002). A further study was subsequently identified in the update search (Eshak et al., 2010) (Cardio-metabolic review, cardiovascular disease chapter; Update search). Using these and an additional later study (Threapleton et al., 2013a) a meta-analysis was performed by the same research group that conducted the cardio-metabolic health review (Threapleton et al., 2013d). The results from this meta-analysis are presented below and were used to inform this report.
8.34 An association between higher consumption of insoluble fibre and a reduced incidence of cardiovascular disease is indicated (RR 0.82, 95% CI 0.70, 0.96 for each 7g/day increase; p=0.02).
Insoluble fibre (g/day) and cardiovascular disease
• Association • Limited evidence • The direction of the association indicates higher consumption of insoluble fibre is beneficial to health • The association is biologically relevant
Coronary events 8.35 Three cohort studies were identified that presented evidence on insoluble
fibre intake and coronary events, all of which were included in a meta-analysis (Pietinen et al., 1996; Rimm et al., 1996; Liu et al., 2002) . Two cohort studies were
subsequently identified in the update search (Eshak et al., 2010; Kokubo et al., 2011) (Cardio-metabolic review, cardiovascular disease chapter; Update search). An updated meta-analysis was performed by the same research group that conducted the cardio-metabolic health review (Threapleton et al., 2013d), which included one of the studies found in the update search (Eshak et al., 2010) and also included one later study (Threapleton et al., 2013a). One study could not be included in the meta-analysis as it did not report the necessary data (Kokubo et al., 2011). The results from the Threapleton et al. (2013d) meta-analysis, based on five studies, was used to inform this report.
8.36 An association between higher consumption of insoluble fibre and a reduced incidence of coronary events is indicated (RR 0.82, 95% CI 0.68, 0.99 for each 7g/day increase; p=0.03). The study not included in the analysis indicates a non-significant protective association between intake of insoluble fibre and fatal or non-fatal events.
Insoluble fibre (g/day) and coronary events
• Association • Moderate evidence • The direction of the association indicates higher consumption of insoluble fibre is beneficial to health • The association is biologically relevant
Type 2 diabetes mellitus 8.37 Three cohort studies were identified that presented evidence on insoluble fibre
intake and type 2 diabetes mellitus, all of which were included in a meta-analysis (Meyer et al., 2000; Montonen et al., 2003; Schulze et al., 2007b). No further studies were identified in the update search (Cardio-metabolic review, diabetes and glycaemia chapter).
8.38 An association between higher consumption of insoluble fibre and a reduced incidence of type 2 diabetes mellitus is indicated (RR 0.84, 95% CI 0.78, 0.91 for each 7g/day increase; p<0.001).
Insoluble fibre (g/day) and type 2 diabetes mellitus
• Association • Limited evidence • The direction of the association indicates higher consumption of insoluble fibre is beneficial to health • The association is biologically relevant
Soluble fibre Cardiovascular disease
8.39 Two cohort studies were initially identified that presented evidence on soluble fibre intake and coronary events (Liu et al., 2002; Bazzano et al., 2003). A further study was subsequently identified in the update search (Eshak et al., 2010) (Cardio-
112
metabolic review, cardiovascular disease chapter; Update search). Using these and an additional later study (Threapleton et al., 2013a), Threapleton et al. (2013d) performed a meta-analysis on the four studies. The results from this later meta-analysis are presented below and were used to inform this report.
8.40 No significant association is indicated between consumption of soluble fibre and the incidence of cardiovascular disease (RR 0.88, 95% CI 0.75, 1.03 for each 4g/day increase; p=0.10).
Soluble fibre (g/day) and cardiovascular disease
• No association • Limited evidence
113
Coronary events 8.41 Four cohort studies were initially identified that presented evidence on soluble
fibre intake and coronary events, all of which were included in a meta-analysis (Pietinen et al., 1996; Rimm et al., 1996; Liu et al., 2002; Bazzano et al., 2003). Two further studies were subsequently identified in the update search (Eshak et al., 2010; Kokubo et al., 2011) (Cardio-metabolic review, cardiovascular disease chapter; Update search). Threapleton et al. (2013d) performed a meta-analysis which included all but one of these studies (Kokubo et al., 2011), as this did not report the necessary data, and included a later study (Threapleton et al., 2013a). The Threapleton et al. (2013d) meta-analysis based on these six studies was used to inform this report.
8.42 No significant association is indicated between consumption of soluble fibre and the incidence of coronary events (RR 0.89, 95% CI 0.78, 1.02 for each 4g/ day increase; p=0.09). The study not included in the meta-analysis indicates no significant association between intake of soluble fibre and fatal or non-fatal events.
Soluble fibre (g/day) and coronary events
• No association • Limited evidence
Type 2 diabetes mellitus 8.43 Three cohort studies were identified that presented evidence on soluble fibre and
type 2 diabetes mellitus, all of which were included in a meta-analysis (Meyer et al., 2000; Montonen et al., 2003; Schulze et al., 2007b). No further studies were identified in the update search (Cardio-metabolic review, diabetes and glycaemia chapter).
8.44 An association between higher consumption of soluble fibre and a reduced incidence of type 2 diabetes mellitus is indicated (RR 0.86, 95% CI 0.76, 0.97 for each 4g/day increase; p=0.01).
Soluble fibre (g/day) and type 2 diabetes mellitus
• Association • Limited evidence • The direction of the association indicates higher consumption of soluble fibre is beneficial to health • The association is biologically relevant
114
Fruit fibre Cardiovascular disease
8.45 One cohort study was identified that presented evidence on fruit fibre intake and cardiovascular disease (Liu et al., 2002). Two cohort studies were subsequently identified in the update search (Park et al., 2011; Chuang et al., 2012) (Cardio-metabolic review, cardiovascular disease chapter; Update search). A meta-analysis was performed by the same research group that conducted the cardio-metabolic health review (Threapleton et al., 2013d), which included one of the studies found in the update search (Chuang et al., 2012) and also included one later study (Buyken et al., 2010). One study could not be included in the meta-analysis as it did not report the necessary data (Park et al., 2011). The results from this later meta-analysis are presented below and were used to inform this report.
8.46 A non-significant borderline association is indicated between consumption of fruit fibre and the incidence of coronary events (RR 0.96, 95% CI 0.93, 1.00 for each 4g/ day increase; p=0.06).
Fruit fibre (g/day) and cardiovascular disease
• No association • Limited evidence
Coronary events 8.47 Six cohort studies were identified that presented evidence on fruit fibre intake
and coronary events, all of which were included in a meta-analysis (Pietinen et al., 1996; Rimm et al., 1996; Wolk et al., 1999; Liu et al., 2002; Mozaffarian et al., 2003; Streppel et al., 2008). One cohort study was subsequently identified in the update search (Eshak et al., 2010) (Cardio-metabolic review, cardiovascular disease chapter; Update search). An updated meta-analysis was performed by the same research group that conducted the cardio-metabolic health review (Threapleton et al., 2013d), which included the study found in the update search and also included two later studies (Crowe et al., 2012; Threapleton et al., 2013a). The results from this later meta-analysis are presented below and were used to inform this report.
8.48 No significant association is indicated between consumption of fruit fibre and the incidence of coronary events (RR 0.92, 95% CI 0.83, 1.01 for each 4g/day increase; p=0.09).
Fruit fibre (g/day) and coronary events
• No association • Limited evidence
Type 2 diabetes mellitus 8.49 Nine cohort studies were identified that presented evidence on fruit fibre intake
and type 2 diabetes mellitus incidence, all of which were included in a meta-analysis (Salmeron et al., 1997a; Salmeron et al., 1997b; Meyer et al., 2000; Stevens et al., 2002; Montonen et al., 2003; Hodge et al., 2004; Schulze et al., 2004a; Barclay et al., 2007; Schulze et al., 2007b). One cohort study was subsequently identified in the update search (Hopping et al., 2010) (Cardio-metabolic review, diabetes and glycaemia review chapter; Update search).
8.50 No significant association is indicated between consumption of fruit fibre and the incidence of type 2 diabetes mellitus (RR 0.99, 95% CI 0.95, 1.04 for each 4g/day increase; p=0.7). The study identified in the update search indicates no significant association between consumption of fruit fibre and the incidence of type 2 diabetes mellitus.
Fruit fibre (g/day) and type 2 diabetes mellitus
• No association • Adequate evidence
115
Colo-rectal cancer 8.51 Six cohort studies were identified that presented evidence on fruit fibre and
colo-rectal cancer, all of which were included in a meta-analysis (Michels et al., 2005; Lin et al., 2005; Bingham et al., 2005; Wakai et al., 2007; Nomura et al., 2007; Schatzkin et al., 2007). One cohort study that was a later follow-up of the EPIC cohort (Bingham et al., 2005) was subsequently identified in the update search, but it reported fruit and vegetable fibre combined and could not be included in the meta-analysis (Murphy et al., 2012). (Colo-rectal health review; Update search).
8.52 No significant association is indicated between fruit fibre consumption and incidence of colo-rectal cancer (RR 0.96, 95% CI 0.91, 1.02 for each 4g/day increase; p=0.206).
Fruit fibre (g/day) and colo-rectal cancer
• No association • Adequate evidence
Vegetable fibre Cardiovascular disease
8.53 One cohort study was identified that presented evidence on vegetable fibre intake and cardiovascular disease (Liu et al., 2002). Two cohort studies were
subsequently identified in the update search (Park et al., 2011; Chuang et al., 2012) (Cardio-metabolic review, cardiovascular disease chapter; Update search). A meta-analysis was performed by the same research group that conducted the cardio-metabolic health review (Threapleton et al., 2013d), which included one of the studies found in the update search (Chuang et al., 2012) and also included two later studies (Buyken et al., 2010; Threapleton et al., 2013a). One study could not be included in the meta-analysis as it did not report the necessary data (Park et al., 2011). The results from this later meta-analysis are presented below and were used to inform this report.
8.54 An association is indicated between higher consumption of vegetable fibre and a reduced incidence of coronary events (RR 0.92, 95% CI 0.87, 0.96 for each 4g/day increase; p<0.001).
Vegetable fibre (g/day) and cardiovascular disease
• Association • Limited evidence • The direction of the association indicates greater consumption of vegetable fibre is beneficial to health • The association is biologically relevant
116
Coronary events 8.55 Six cohort studies were identified that presented evidence on vegetable fibre
intake and coronary events, all of which were included in a meta-analysis (Pietinen et al., 1996; Rimm et al., 1996; Wolk et al., 1999; Liu et al., 2002; Mozaffarian et al., 2003; Streppel et al., 2008). One cohort study was subsequently identified in the update search (Eshak et al., 2010) (Cardio-metabolic review, cardiovascular disease chapter; Update search). An updated meta-analysis was performed by the same research group that conducted the cardio-metabolic health review (Threapleton et al., 2013d), which included the study found in the update search and also included two later studies (Crowe et al., 2012; Threapleton et al., 2013a). The results from this later meta-analysis are presented below and were used to inform this report.
8.56 An association is indicated between consumption of vegetable fibre and the incidence of coronary events (RR 0.94, 95% CI 0.89, 1.00 for each 4g/day increase; p=0.04).
Vegetable fibre (g/day) and coronary events
• Association • Limited evidence • The direction of the association indicates greater consumption of vegetable fibre is beneficial to health • The association is biologically relevant
Type 2 diabetes mellitus 8.57 Nine cohort studies were identified that presented evidence on vegetable fibre
and type 2 diabetes mellitus, all of which were included in a meta-analysis
(Salmeron et al., 1997a; Salmeron et al., 1997b; Meyer et al., 2000; Montonen et al., 2003; Hodge et al., 2004; Schulze et al., 2004a; Barclay et al., 2007; Schulze et al., 2007b; Wannamethee et al., 2009). One cohort study was subsequently identified in the update search (Hopping et al., 2010) (Cardio-metabolic review, diabetes and glycaemia chapter; Update search).
8.58 No significant association is indicated between consumption of vegetable fibre and the incidence of type 2 diabetes mellitus (RR 0.99, 95% CI 0.94, 1.04 for each 4g/day increase; p=0.7). The study identified in the update search indicates higher consumption of vegetable fibre is associated with reduced incidence of type 2 diabetes mellitus in men, but not women.
Vegetable fibre (g/day) and type 2 diabetes mellitus
• No association • Adequate evidence
117
Colo-rectal cancer 8.59 Seven cohort studies were identified, in six publications, that presented evidence
on vegetable fibre and colo-rectal cancer, all of which were included in a meta-analysis (Michels et al., 2005; Lin et al., 2005; Bingham et al., 2005; Wakai et al., 2007; Nomura et al., 2007; Schatzkin et al., 2007). One cohort study that was a later follow-up of the EPIC cohort (Bingham et al., 2005) was subsequently identified in the update search, but it reported fruit and vegetable fibre combined and could not be included in the meta-analysis (Murphy et al., 2012) (Colo-rectal health review; Update search).
8.60 No significant association is indicated between vegetable fibre consumption and incidence of colo-rectal cancer (RR 0.99, 95% CI 0.96, 1.02 for each 4g/day increase; p=0.59). The study identified in the update search (Murphy et al., 2012) reports follow-up data from the EPIC study included in the meta-analysis (Bingham et al., 2005) and indicates consumption of combined fruit and vegetable fibre is not associated with incidence of colo-rectal cancer.
Vegetable fibre (g/day) and colo-rectal cancer
• No association • Adequate evidence
Fruit and vegetable fibre Faecal weight and intestinal transit time
8.61 Six randomised controlled trials were identified that presented evidence on fruit and vegetable fibre in relation to intestinal transit time and faecal weight (Stasse-Wolthuis et al., 1980; Tinker et al., 1991; Lampe et al., 1992; Wisker et al., 1994a; Wisker et al., 1994b; Cherbut et al., 1997). The data on dietary intakes were insufficiently comparable to allow a meta-analysis. No further trials were identified in the update search (Colo-rectal health review).
8.62 One trial reports carrot consumption increases faecal weight and moisture content (Wisker et al., 1994b). Another that citrus fibre concentrate increases faecal weight and moisture content (Wisker et al., 1994a). Potato12 fibre consumption is reported to increase faecal weight in another trial (Cherbut et al., 1997) and consumption of prunes is reported to increase faecal weight in a third trial (Tinker et al., 1991). Two trials report that a higher mixed fruit and vegetable intake increases faecal weight, but that there is a less consistent increase in faecal moisture content (Stasse-Wolthuis et al., 1980; Lampe et al., 1992). Two trials report on intestinal transit times and generally observe a decrease in response to higher fruit and vegetable fibres intake (Stasse-Wolthuis et al., 1980; Cherbut et al., 1997).
8.63 Conclusions are limited to those foods studied and cannot be broadened to other fruit and vegetable fibres without further studies being conducted.
Fruit and vegetable fibre and faecal weight
• Effect • Limited evidence • The direction of the effect demonstrates higher consumption of fibre from carrots, potato, prunes or citrus fruits is potentially beneficial to health • The effect is potentially biologically relevant
Fruit and vegetable fibre and intestinal transit times
• Effect • Limited evidence • The direction of the effect demonstrates greater consumption of fibre from carrots, potato, prunes or citrus fruits is potentially beneficial to health • The effect is potentially biologically relevant
Legume fibre Type 2 diabetes mellitus
8.64 Three cohort studies were identified that presented evidence on legume fibre intake and incidence of type 2 diabetes mellitus, all of which were included in a meta-analysis (Meyer et al., 2000; Stevens et al., 2002; Hodge et al., 2004). No further studies were identified in the update search (Cardio-metabolic review, diabetes and glycaemia chapter).
8.65 No significant association is indicated between consumption of legume fibre and the incidence of type 2 diabetes mellitus (RR 1.01, 95% CI 0.98, 1.04 for each 1g/day increase; p=0.6).
Legume fibre (g/day) and type 2 diabetes mellitus
• No association • Limited evidence
12 Potatoes are botanically classified as a vegetable, but they are classified nutritionally as a starchy food. 118
Faecal weight and intestinal transit time 8.66 Five randomised controlled trials were identified that presented evidence on
legume fibre in relation to intestinal transit time and faecal weight (Tsai et al., 1983; Effertz et al., 1991; Lampe et al., 1992; Stephen et al., 1995; Johnson et al., 2006). The data on dietary intakes were insufficiently comparable to allow a meta-analysis. No further trials were identified in the update search (Colo-rectal health review).
8.67 An effect of higher legume fibre (pea fibre, lentils or soy polysaccharide) intake on increased faecal weight is demonstrated in all trials. Little or no significant effect of higher legume fibre on intestinal transit time is demonstrated.
Legume fibre and faecal weight
• Effect • Moderate evidence • The direction of the effect demonstrates higher consumption of legume fibres is potentially beneficial to health • The biological relevance is unclear due to the size of supplements, and it is unclear whether this finding is applicable to all legume fibres
Legume fibre and intestinal transit time
• No effect • Limited evidence
Colo-rectal cancer 8.68 Five cohort studies were identified that presented evidence on legume fibre and
colo-rectal cancer, all of which were included in a meta-analysis (Lin et al., 2005; Bingham et al., 2005; Wakai et al., 2007; Nomura et al., 2007; Schatzkin et al., 2007) (Colo-rectal health review).
8.69 No significant association is indicated between legume fibre consumption and incidence of colo-rectal cancer (RR 0.98, 95% CI 0.94, 1.02 for each 1g/day increase; p=0.275)
Legume fibre (g/day) and colo-rectal cancer
• No association • Moderate evidence
Legume intake Cardiovascular disease events
8.70 Five cohort studies were identified in four publications that presented evidence on legume (non-soy) intake and incidence of cardiovascular disease events (Bazzano et al., 2001; Joshipura et al., 2009; Nagura et al., 2009; Panagiotakos et al., 2009) (Cardio metabolic health review, cardiovascular disease chapter). The data were insufficiently comparable for a meta-analysis to be performed.
119
8.71 Two cohort studies indicate higher legume (non-soy) consumption is associated with a reduced incidence of cardiovascular disease events (Bazzano et al., 2001; Nagura et al., 2009). The other three cohort studies indicate no significant association between legume (non-soy) consumption and the incidence of cardiovascular disease.
8.72 Six cohort studies were identified that presented evidence on legume intake (non-soy) and combined incidence of coronary events and stroke, all of which were included in a meta-analysis (Fraser et al., 1992; Joshipura et al., 1999; Bazzano et al., 2001; Joshipura et al., 2009; Nagura et al., 2009; Panagiotakos et al., 2009) (Cardio-metabolic review, cardiovascular disease chapter).
8.73 No significant association is indicated between legume (non-soy) consumption and the incidence of cardiovascular disease (RR 0.96, 95% CI 0.90, 1.03 for each 0.25 serving/day; p=0.2). There is considerable heterogeneity in the data (I2= 73%). One study, which only adjusts results for age, has a strong influence on heterogeneity When this study is excluded from the analysis heterogeneity is reduced (I2=53%) and there is still no significant association between legume (non-soy) consumption and the incidence of cardiovascular disease (RR 0.98, 95% CI 0.93, 1.04 for each 0.25 serving/day).
Legume intake (serving/day) and cardiovascular disease events
• No association • Moderate evidence
Cereal fibre Cardiovascular disease
8.74 One cohort study was identified that presented evidence on cereal fibre intake and cardiovascular disease incidence (Liu et al., 2002). One cohort study was subsequently identified in the update search (Chuang et al., 2012) (Cardio-metabolic review, cardiovascular disease chapter; Update search). A meta-analysis was performed by the same research group that conducted the cardio-metabolic health review (Threapleton et al., 2013d), which included the studies already identified and three other studies (Buyken et al., 2010; Baer et al., 2011; Threapleton et al., 2013a). The results from this later meta-analysis are presented below and were used to inform this report.
8.75 A non-significant borderline association is indicated between consumption of cereal fibre and the incidence of cardiovascular disease (RR 0.92, 95% CI 0.84, 1.00 for each 7g/day increase; p=0.06).
Cereal fibre (g/day) and cardiovascular disease
• No association • Limited evidence
120
Coronary events 8.76 Eight cohort studies were identified that presented evidence on cereal fibre intake
and coronary events (Fehily et al., 1993; Pietinen et al., 1996; Rimm et al., 1996; Wolk et al., 1999; Liu et al., 2002; Mozaffarian et al., 2003; Streppel et al., 2008; Kaushik et al., 2009), six of which were included in a meta-analysis. Two cohort studies could not be included in the meta-analysis as they did not report the necessary data. One indicated no significant association between cereal fibre and coronary events (Kaushik et al., 2009) while the other study did not report a statistical comparison (Fehily et al., 1993). One cohort study was subsequently identified in the update search (Eshak et al., 2010) (Cardio-metabolic review, cardiovascular disease chapter; Update search). An updated meta-analysis was performed by the same research group that conducted the cardio-metabolic health review (Threapleton et al., 2013d), which included the study found in the update search and also included three other studies (Baer et al., 2011; Crowe et al., 2012; Threapleton et al., 2013a). The results from this later meta-analysis are presented below and were used to inform this report.
8.77 An association between higher consumption of cereal fibre and a reduced incidence of coronary events is indicated (RR 0.84, 95% CI 0.76, 0.94 for each 7g/ day increase; p=0.003).
Cereal fibre (g/day) and coronary events
• Association • Adequate evidence • The direction of the association indicates higher consumption of fibre in cereals is beneficial to health • The association is biologically relevant
121
Blood pressure 8.78 Five randomised controlled trials were identified that presented evidence on oat
bran or β-glucans in relation to blood pressure (Swain et al., 1990; Saltzman et al., 2001; Davy et al., 2002b; He et al., 2004; Maki et al., 2007a), four of which were included in a meta-analysis. One trial could not be included in a meta-analysis as it did not report the necessary data (Swain et al., 1990). One trial was subsequently identified in the update search (Charlton et al., 2012) (Cardio-metabolic review, blood pressure and incident hypertension chapter; Update search). All trials compared oat bran and/or oat meal containing diets to a refined wheat control. Two trials also supplemented subject’s diets with refined oat β-glucan (Maki et al., 2007a; Charlton et al., 2012). One of the trials was a weight-loss trial (Saltzman et al., 2001).
8.79 An effect is demonstrated for higher oat bran and β-glucan consumption on reducing systolic blood pressure (-2.86 mmHg, 95% CI -4.87, -0.85; p<0.01).
8.80 An effect is demonstrated for higher oat bran and β-glucan consumption on reducing diastolic blood pressure (-1.45 mmHg, 95% CI -2.68, -0.22; p=0.02).
122
8.81 The trial not included in the meta-analysis reports no significant effect of oat bran on blood pressure (Swain et al., 1990). The trial identified in the update search reports no significant effect of β-glucan-rich oat products on blood pressure.
Oat bran and β-glucans and systolic and diastolic blood pressure
• Effect • Moderate evidence • The direction of the effect demonstrates higher consumption of oat bran and oat β-glucans is beneficial to health • The effect is biologically relevant
Fasting blood lipids 8.82 Seven randomised controlled trials were identified that presented evidence on
oat bran or β-glucan supplementation in relation to fasting total cholesterol, LDL- and HDL- cholesterol concentration all of which were included in a meta-analysis (Swain et al., 1990; Johnston, 1998; Romero et al., 1998; Saltzman et al., 2001; Davy et al., 2002b; Chen et al., 2006; Keenan et al., 2007). All of the trials, except one (Swain et al., 1990), also presented evidence on oat bran or β-glucan supplementation in relation to fasting triacylglycerol concentration and were included in a meta-analysis. One trial was subsequently identified in the update search (Charlton et al., 2012) (Cardio-metabolic review, hyperlipidaemia and blood lipids chapter; Update search). All trials, except one that supplemented subjects’ diets with refined barley β-glucans (Keenan et al., 2007), compared oat bran and/ or oat meal containing diets to a refined wheat control or in one case wheat bran (Romero et al., 1998). One trial also supplemented subjects’ diets with refined oat β-glucan (Charlton et al., 2012). One of the trials was a weight-loss trial (Saltzman et al., 2001).
8.83 An effect is demonstrated for the consumption of oat bran or β-glucan supplements on lowering fasting total cholesterol concentration (-0.27mmol/L, 95% CI -0.43, -0.10; p=0.002). The trial identified in the update search reports no significant effect of β-glucan-rich oat products on fasting total cholesterol concentration.
8.84 An effect is demonstrated for the consumption of oat bran or β-glucan supplements on lowering fasting LDL-cholesterol concentration (-0.22mmol/L, 95% CI -0.34, -0.10; p<0.001). The trial identified in the update search reports no significant effect of β-glucan-rich oat products on fasting total cholesterol concentration.
8.85 No significant effect is demonstrated for the consumption of oat bran or β-glucan supplements on fasting HDL-cholesterol concentration (0.02mmol/L, 95% CI -0.04, 0.08; p=0.55). The trial identified in the update search reports no significant effect of β-glucan-rich oat products on fasting HDL-cholesterol concentration.
8.86 An effect is demonstrated for the consumption of oat bran or β-glucan supplements on lowering fasting triacylglycerol concentration (-0.17mmol/L, 95% CI -0.31, -0.02; p=0.03). The trial identified in the update search reports no significant effect of β-glucan-rich oat products on fasting triacylglycerol concentration.
Oat bran and β-glucans and fasting total cholesterol concentration
• Effect • Moderate evidence • The direction of the effect demonstrates higher consumption of oat bran or β-glucan supplementation is beneficial to health • The effect is biologically relevant
Oat bran and β-glucans and fasting LDL- cholesterol concentration
• Effect • Adequate evidence • The direction of the effect demonstrates higher consumption of oat bran or β-glucan supplementation is beneficial to health • The effect is biologically relevant
Oat bran and β-glucans and fasting HDL-cholesterol concentration
• No effect • Adequate evidence
Oat bran and β-glucans and fasting triacylglycerol concentration
• Effect • Moderate evidence • The direction of the effect demonstrates higher consumption of oat bran or β-glucan supplementation is beneficial to health • The effect is biologically relevant
123
Fasting blood glucose 8.87 Four randomised controlled trials were identified that presented evidence on oat
bran or β-glucan supplements in relation to fasting blood glucose concentration, all of which were included in a meta-analysis (Saltzman et al., 2001; Chen et al., 2006; Maki et al., 2007a; Smith et al., 2008). Two trials were subsequently identified in the update search (Bays et al., 2011; Charlton et al., 2012) (Cardio-metabolic review, diabetes and glycaemia chapter; Update search). Two trials compared oat bran containing diets to a refined wheat control (Saltzman et al., 2001; Chen et al., 2006). Four trials supplemented subjects’ diets with refined β-glucans, either from barley or oats (Maki et al., 2007a; Smith et al., 2008; Bays et al., 2011; Charlton et al., 2012). One of the trials was a weight-loss trial (Saltzman et al., 2001).
8.88 No significant effect is demonstrated for the consumption of oat bran, barley or oat β-glucan supplements on fasting blood glucose concentration (-0.08 mmol/L, 95% CI -0.21, 0.06; p=0.25). The two trials identified in the update search report no significant effect of barley or oat β-glucan supplements on fasting blood glucose concentration.
Oat bran and β-glucans and fasting blood glucose concentration
• No effect • Adequate evidence
Type 2 diabetes mellitus 8.89 Eleven cohort studies were identified that presented evidence on cereal fibre and
incidence of type 2 diabetes mellitus, all of which were included in a meta-analysis (Salmeron et al., 1997a; Salmeron et al., 1997b; Meyer et al., 2000; Stevens et al., 2002; Montonen et al., 2003; Hodge et al., 2004; Schulze et al., 2004a; Barclay et al., 2007; Krishnan et al., 2007; Schulze et al., 2007b; Wannamethee et al., 2009). One cohort study was subsequently identified in the update search (Hopping et al., 2010) (Cardio-metabolic review, diabetes and glycaemia chapter; Update search).
8.90 An association between higher consumption of cereal fibre and a reduced incidence of type 2 diabetes mellitus is indicated (RR 0.79, 95% CI 0.72, 0.87 for each 7g/day increase; p<0.001). The study identified in the update search indicates higher cereal fibre consumption is associated with a reduced incidence of type 2 diabetes mellitus.
Cereal fibre (g/day) and type 2 diabetes mellitus
• Association • Adequate evidence • The direction of the association indicates higher consumption of fibre in cereals is beneficial to health • The association is biologically relevant
124
Fasting insulin 8.91 Four randomised controlled trials were identified that presented evidence on
β-glucan in relation to fasting insulin concentration (Saltzman et al., 2001; Chen et al., 2006; Maki et al., 2007a; Smith et al., 2008). Two trials were subsequently identified in the update search (Bays et al., 2011; Charlton et al., 2012) (Cardio-metabolic review, diabetes and glycaemia chapter; Update search). Two trials compared oat bran containing diets to a refined wheat control (Saltzman et al., 2001; Chen et al., 2006). Four trials supplemented subjects’ diets with refined β-glucans, either from barley or oats (Maki et al., 2007a; Smith et al., 2008; Bays et al., 2011; Charlton et al., 2012). One of the trials was a weight-loss trial (Saltzman et al., 2001).
8.92 Due to variation between the different methodologies used to measure fasting insulin concentration, it was not possible to conduct a meta-analysis. All of the trials identified in the systematic review report no significant effect of oat bran or β-glucan supplements on fasting insulin concentration. Of the trials identified in the update search, one reports no significant effect of β-glucan supplements on fasting insulin concentration (Charlton et al., 2012) and the other reports a significant effect of 6g/day refined β-glucans, but not 3g/day (Bays et al., 2011).
Oat bran and β-glucans and fasting insulin concentration
• No effect • Moderate evidence
Energy intake
Oat fibre, barley fibre and β-glucans 8.93 Fifteen randomised controlled trials in 17 publications were identified that
presented evidence on oat fibre, barley fibre or β-glucan supplements in relation to energy intake (Whyte et al., 1992; Abrahamsson et al., 1994; Johnston, 1998; Reynolds et al., 2000; Davy et al., 2002a; Davy et al., 2002b; Kerckhoffs et al., 2003; He et al., 2004; Robitaille et al., 2005; Chen et al., 2006; Keenan et al., 2007; Theuwissen & Mensink, 2007; Maki et al., 2007a; Maki et al., 2007b; Smith et al., 2008; Sundberg, 2008; Kohl et al., 2009), twelve of which were included in a meta-analysis (Whyte et al., 1992; Abrahamsson et al., 1994; Reynolds et al., 2000; Davy et al., 2002a; Kerckhoffs et al., 2003; Robitaille et al., 2005; Chen et al., 2006; Theuwissen & Mensink, 2007; Maki et al., 2007a; Maki et al., 2007b; Smith et al., 2008; Sundberg, 2008). Two trials reported energy intake data in two publications (Davy et al., 2002a; Davy et al., 2002b) and (He et al., 2004; Chen et al., 2006). Three trials could not be included in the meta-analyses as they did not report the necessary data (Johnston, 1998; Keenan et al., 2007; Kohl et al., 2009) (Cardio-metabolic review, energy intake and eating motivation chapter). The control intervention in most studies was wheat products or wheat fibre.
8.94 No significant effect is demonstrated for the consumption of oat fibre, barley fibre or β-glucan supplements on energy intake (48kJ, 95% CI -265, 362; p=0.66). The trials not included in the meta-analysis report no significant effect of oat bran or purified β-glucan supplements on energy intake (Johnston, 1998; Keenan et al., 2007; Kohl et al., 2009).
Oat fibre, barley fibre and β-glucans and energy intake
• No effect • Adequate evidence
125
Cereal fibre excluding oat fibre 8.95 Four randomised controlled trials were identified that presented evidence on
cereal fibre, as bran (excluding oat fibre), in relation to energy intake, all of which were included in a meta-analysis (Tredger et al., 1991; Sanders & Reddy, 1992; Jenkins et al., 1999; Vuksan et al., 1999) (Annex 1 additional meta-analyses). Three trials investigated wheat bran in comparison to a lower fibre control product and one trial reported data on rice bran. Two trials compared wheat bran to either sugar beet bran (Tredger et al., 1991) or rice bran (Sanders & Reddy, 1992). None of the trials were energy restriction trials.
8.96 No significant effect is demonstrated for cereal fibre (excluding oat fibre) consumption on energy intake (-269kJ, 95% CI -826, 288; p=0.34).
Cereal fibre excluding oat fibre and energy intake
• No effect • Moderate evidence
126
Faecal weight and intestinal transit time
Wheat fibre 8.97 Fourteen randomised controlled trials were identified that presented evidence on
wheat fibre in relation to faecal weight, all of which were included in a meta-analysis (Southgate et al., 1976; Stasse-Wolthuis et al., 1980; Andersson et al., 1983; Spiller et al., 1986; Stevens et al., 1988; Tomlin & Read, 1988; Cummings et al., 1996; Jenkins et al., 1998; Vuksan et al., 1999; Jenkins et al., 1999a; McRorie et al., 2000; McIntosh et al., 2003; Bird et al., 2008; Vuksan et al., 2008). One trial provided two estimates on faecal output (Jenkins et al., 1999a) (Colo-rectal health review). No further trials were identified in the update search.
8.98 Twelve randomised controlled trials were identified that presented evidence on wheat fibre in relation to intestinal transit time (Connell & Smith, 1974; Jenkins et al., 1975; Wyman et al., 1976; Stasse-Wolthuis et al., 1980; Andersson et al., 1983; Spiller et al., 1986; Stevens et al., 1988; Tomlin & Read, 1988; Cummings et al., 1996; Vuksan et al., 1999; Muir et al., 2004; Vuksan et al., 2008) (Colo-rectal health review). No further trials were identified in the update search.
8.99 An effect is demonstrated for wheat fibre (10-25g/day) on increasing faecal weight (mean difference 68g/day, 95% CI 59, 77; p<0.001). A meta-regression demonstrated that a one gram increase in wheat fibre intake (as defined by AOAC methods) results in a 4.8g (95% CI 3.0, 6.6; p<0.001) increase in faecal wet weight (Annex 1 additional meta-analyses). An effect is also demonstrated for wheat fibre on decreasing intestinal transit time on the forest plot, but heterogeneity is high (I2=67). An investigation into the heterogeneity demonstrated that the amount of reduction in transit times in response to wheat fibre is greater when initial intestinal transit times are longer and vice versa. Meta-regression demonstrated a significant relationship (p<0.001) between initial intestinal transit times, as determined from control values, and reduction in intestinal transit time in response to wheat fibre (Annex 1 additional meta-analyses).
Wheat fibre and faecal weight and intestinal transit time
• Effect • Adequate evidence • The direction of the effect demonstrates higher consumption of fibre from wheat is potentially beneficial to health The effect is potentially biologically relevant
Non-wheat cereal fibre 8.100 Five randomised controlled trials were identified that presented evidence on non-
wheat cereal fibres in relation to intestinal transit time or faecal weight (Tomlin & Read, 1988; Cherbut et al., 1997; Grasten et al., 2000; McIntosh et al., 2003; Bird et
al., 2008). The data on dietary intakes were insufficient to allow a meta-analysis to be performed. No further trials were identified in the update search (Colo-rectal health review).
8.101 An effect on increasing faecal weight is reported for a novel barley (containing more resistant starch and non-starch polysaccharide than normal barley) (Bird et al., 2008), a higher rye-fibre diet (McIntosh et al., 2003), whole grain rye bread (Grasten et al., 2000) maize fibre (Cherbut et al., 1997) and rice bran (Tomlin & Read, 1988). Total intestinal transit time reductions are demonstrated in the three trials that measured transit time (Tomlin & Read, 1988; Cherbut et al., 1997; Grasten et al., 2000).
Non-wheat cereal fibre and faecal weight
• Effect • Adequate evidence • The direction of the effect demonstrates higher consumption of mixed non-wheat cereal fibre is potentially beneficial to health • The effect is potentially biologically relevant
Non-wheat cereal fibre and intestinal transit time
• Effect • Limited evidence • The direction of the effect demonstrates higher consumption of mixed non-wheat cereal fibre is potentially beneficial to health The effect is potentially biologically relevant
127
Faecal pH and short chain fatty acid content
Wheat fibre 8.102 Eight randomised controlled trials were identified that presented evidence on
wheat bran in relation to faecal pH and short chain fatty acid content (Jenkins et al., 1975; Lampe et al., 1992; Cummings et al., 1996; Jenkins et al., 1998; Jenkins et al., 1999; McIntosh et al., 2003; Muir et al., 2004; Bird et al., 2008). The data on measures of faecal short chain fatty acid content and pH were insufficiently comparable to allow a meta-analysis to be performed. No further trials were identified in the update search (Colo-rectal health review).
8.103 Wheat bran increases faecal weight, with a concomitant increase in total daily faecal short chain fatty acid excretion, but most trials observe no significant effect on the concentration or relative proportions of faecal short chain fatty acids. One trial observes wheat bran to increase faecal butyrate concentrations compared with a lower fibre bread control (Lampe et al., 1992), and another trial observes finely ground, but not coarse ground, wheat bran to increase faecal butyrate concentration (Jenkins et al., 1999a).
Wheat fibre and faecal pH and short chain fatty acid content
• No effect • Moderate evidence
128
Non-wheat cereal fibre 8.104 Six randomised controlled trials were identified that presented evidence on non-
wheat cereal fibre intake in relation to faecal pH and short chain fatty acid content (Noakes et al., 1996; Grasten et al., 2000; McIntosh et al., 2003; Grasten et al., 2007; Bird et al., 2008; Carvalho-Wells et al., 2010). The data on measures of faecal short chain fatty acid content and pH were insufficiently comparable to allow a meta-analysis to be performed. No further trials were identified in the update search (Colo-rectal health review).
8.105 Three trials investigate the effect of rye bran on faecal pH and short chain fatty acid content. One reports a higher rye-fibre diet reduces faecal pH and increases faecal butyrate concentration (McIntosh et al., 2003), one reports the same, but in male subjects only (Grasten et al., 2000) and the other reports no significant effect (Grasten et al., 2007). An effect on reducing faecal pH and increasing faecal butyrate concentration is reported for a novel barley (containing more resistant starch and non-starch polysaccharide than normal barley) (Bird et al., 2008). No significant effect on faecal pH or short chain fatty acid content is reported for maize bran (Carvalho-Wells et al., 2010) or oat bran (Noakes et al., 1996).
Non-wheat cereal fibre and faecal pH and short chain fatty acid content
• No effect • Limited evidence
Constipation 8.106 Ten randomised controlled trials were identified that presented evidence on
cereal fibre and constipation (Sculati & Giampiccoli, 1984; Anderson & Whichelow, 1985; Finlay, 1988; Brown & Everett, 1990; Mantle, 1992; Badiali et al., 1995; Howard et al., 2000; Rees et al., 2005; Hongisto et al., 2006; Holma et al., 2010) (Colo-rectal health review). The data were insufficiently comparable to allow a meta-analysis to be performed. No further trials were identified in the update search. The trials were conducted in three subject groups; hospitalised or institutionalised patients (Finlay, 1988; Brown & Everett, 1990; Mantle, 1992; Howard et al., 2000), patients with self-reported constipation (Sculati & Giampiccoli, 1984; Badiali et al., 1995; Rees et al., 2005; Hongisto et al., 2006; Holma et al., 2010) and pregnant women (Anderson & Whichelow, 1985). Improvement in constipation was measured as either a decrease in laxative use or a self-reported improvement in symptoms of constipation.
8.107 In the four trials in hospitalised or institutionalised patients, cereal fibre (wheat bran) is reported as effective in reducing laxative use in two trials (Brown & Everett, 1990; Howard et al., 2000) and the other two trials report a tendency for cereal fibre to reduce laxative use (Finlay, 1988; Mantle, 1992). Only one of the four trials,
129
observes an increase in bowel movement frequency in response to cereal fibre (Brown & Everett, 1990). One of the other trials reports a higher proportion of patients with 2-7 bowel motions a week of soft or firm stools in response to wheat bran supplementation (Mantle, 1992).
8.108 In the trials of adults with self-reported constipation, two trials report higher rye bread consumption increases bowel movement frequency, improves stool consistency and results in less strain at defecation relative to lower-fibre bread consumption (Hongisto et al., 2006; Holma et al., 2010). One trial reports a wheat fibre preparation increases bowel movement frequency, improves stool consistency and lessens abdominal pain (Sculati & Giampiccoli, 1984). Two trials in subjects from gastroenterology outpatient clinics report no significant effect of higher wheat bran consumption on bowel movement frequency, strain at defecation or other symptoms (Badiali et al., 1995; Rees et al., 2005).
8.109 One trial, investigating the effect of wheat-bran on constipation in pregnancy, reports wheat bran supplementation increases bowel movement frequency and corn fibre has a non-significant tendency to increase bowel movement frequency (Anderson & Whichelow, 1985). No significant effect of either wheat or corn fibre supplementation on stool consistency or abdominal pain is demonstrated.
Cereal fibre and constipation
• Effect • Moderate evidence • The direction of the effect demonstrates higher consumption of fibre from cereals is beneficial to health • The effect is biologically relevant
Intestinal transit time 8.110 Five randomised controlled trials were identified that presented evidence on cereal
fibre in relation to total intestinal transit time in outpatients with constipation or patients with self-reported constipation (Corinaldesi et al., 1982; Badiali et al., 1995; Rees et al., 2005; Hongisto et al., 2006; Holma et al., 2010). No further trials were identified in the update search (Colo-rectal health review). The intestinal transit time methodologies were insufficiently comparable to allow a meta-analysis to be performed. Three trials supplemented subjects’ diets with wheat bran fibre relative to placebo (Corinaldesi et al., 1982; Badiali et al., 1995; Rees et al. 2005). Two trials assessed the effect of rye bread relative to a lower fibre bread (Hongisto et al., 2006; Holma et al., 2010).
8.111 Two trials report an effect of wheat bran (20g/day) on reducing intestinal transit time (Corinaldesi et al., 1982; Badiali et al., 1995). The other trial supplementing with wheat bran (10-20g/day) reports a non-significant tendency for intestinal transit time to be reduced (Rees et al., 2005). One trial reports that consumption of rye bread decreases intestinal transit time (Holma et al., 2010) and one trial reports a non-significant tendency for a decrease (Hongisto et al., 2006), relative to a lower fibre bread control.
Wheat fibre and intestinal transit time in patients with constipation
• Effect • Limited evidence • The direction of the effect demonstrates higher consumption of wheat bran fibre is potentially beneficial to health • The effect is potentially biologically relevant
Colo-rectal adenoma recurrence 8.112 Three randomised controlled trials were identified that presented evidence on
wheat fibre in relation to colo-rectal adenoma recurrence (MacLennan et al., 1995; Alberts et al., 2000; Ishikawa et al., 2005). A pooled analysis of the Wheat Bran Fiber Trial (Alberts et al., 2000) and the Polyp Prevention Trial (a lower fat, high fibre dietary intervention) (Schatzkin et al., 2000) was also identified (Jacobs et al., 2006). No further trials were identified in the update search (Colo-rectal health review).
8.113 All three trials report no significant effect of wheat fibre supplements on recurrence of colo-rectal adenomas. The pooled analysis reports an adjusted odds ratio for colo-rectal adenoma recurrence in all subjects on both trials and found no significant effect (OR 0.91, 95% CI 0.78, 1.06). A separate analysis for men and women found that the intervention is associated with a reduced odds of colo-rectal recurrence in men (OR 0.81, 95% CI 0.67, 0.98), but not in women.
Wheat fibre and colo-rectal adenomas
• No effect • Moderate evidence
Colo-rectal cancer 8.114 Five cohort studies were identified, in four publications, that presented evidence
on cereal fibre intake and colo-rectal cancer, all of which were included in a meta-analysis (Michels et al., 2005; Lin et al., 2005; Nomura et al., 2007; Schatzkin et al., 2007). One cohort study was identified in the update search (Murphy et al., 2012) (Colo-rectal health review; Update search). In the colo-rectal health review, Bingham et al. (2005) was included in the meta-analysis. Murphy et al. (2012) provided data from the same cohort as Bingham et al. (2005), but with a longer follow-up period. Therefore an updated meta-analysis was performed which included Murphy et al. (2012) in place of Bingham et al. (2005). The pooled estimate provided in paragraph 8.115 is taken from the updated meta-analysis (Annex 1 additional meta-analyses).
8.115 An association is indicated between higher consumption of cereal fibre and a reduced incidence of colo-rectal cancer (RR 0.92, 95% CI 0.89, 0.96, for each 7g/ day increase; p=0.005).
130
Cereal fibre (g/day) and colo-rectal cancer
• Association • Moderate evidence • The direction of the association indicates higher cereal fibre consumption is beneficial to health • The association is biologically relevant
131
Higher dietary fibre breakfast cereals Coronary events
8.116 Four cohort studies were identified that presented evidence on breakfast cereal and coronary events (Key et al., 1996; Jacobs, Jr. et al., 1998; Liu et al., 1999; Liu et al., 2003), three of which were included in a meta-analysis. One cohort study, that could not be included in a meta-analysis as it did not report the necessary data, indicated no significant association between bran cereals and coronary events (Key et al., 1996). No further studies were identified in the update search (Cardio-metabolic review, cardiovascular disease chapter).
8.117 An association is indicated between higher dietary fibre breakfast cereal consumption and reduced incidence of coronary events (RR 0.87, CI 0.80, 0.94 for each 0.5 serving/day increase; p=0.001). The studies define high dietary fibre breakfast cereals as either having 25% or more whole grains or bran content by w eight.
Higher dietary fibre breakfast cereals (serving/day) and coronary events
• Association • Limited evidence • The direction of the association indicates higher consumption of higher fibre breakfast cereals is beneficial to health • The association is biologically relevant
Energy intake 8.118 Six randomised controlled trials were identified that presented evidence on
breakfast cereal in relation to energy intake, all of which were included in a meta-analysis (Kirk et al., 1997; Kleemola et al., 1999; Mattes, 2002; Waller et al., 2004; Rodriguez-Rodriguez et al., 2008; Zaveri & Drummond, 2009) (Cardio-metabolic review, energy intake and eating motivation chapter). The trials assessed the effect of incorporating ready-to-eat breakfast cereals (or cereal bars) into the diet as compared with a ‘no dietary change’ protocol.
8.119 The heterogeneity is above the pre-specified cut-off of 75% (I2=80%) and, therefore, the pooled estimate is not reported. No consistent effect is demonstrated, between breakfast cereal consumption and energy intake, as observed from the forest plot. Only one trial reports a significant effect with the replacement of two meals/ day with higher carbohydrate ready to eat breakfast cereal reducing energy intake (Mattes, 2002), but the results from the other trials show no consistent eff ect.
Higher dietary fibre breakfast cereals and energy intake
• No effect • Moderate evidence
Type 2 diabetes mellitus 8.120 Three cohort studies were identified that presented evidence on higher dietary
fibre breakfast cereals and incidence of type 2 diabetes mellitus, all of which were included in a meta-analysis (Liu et al., 2000a; Hodge et al., 2004; Kochar et al., 2007) (Cardio-metabolic review, diabetes and glycaemia chapter). No further studies were identified in the update search.
8.121 An association is indicated between higher dietary fibre breakfast cereal consumption and reduced incidence of type 2 diabetes mellitus (RR 0.89, CI 0.86, 0.92 for each 0.5 serving/day increase; p<0.001). The studies define high dietary fibre breakfast cereals as either having 25% or more whole grains or bran content by weight.
Higher dietary fibre breakfast cereals (serving/day) and type 2 diabetes mellitus
• Association • Moderate evidence • The direction of the association indicates higher consumption of higher fibre breakfast cereals is beneficial to health The association is biologically relevant
Whole grain Bread Type 2 diabetes mellitus
8.122 Four cohort studies were identified that presented evidence on whole grain bread and incidence of type 2 diabetes mellitus (Liu et al., 2000a; Hodge et al., 2004; Simmons et al., 2007; Schulze et al., 2007a), three of which were included in a meta-analysis (Cardio-metabolic review, diabetes and glycaemia chapter). One study could not be included in a meta-analysis as it did not report the necessary data (Simmons et al., 2007). No further studies were identified in the update search.
8.123 An association is indicated between higher whole grain bread consumption and reduced incidence of type 2 diabetes mellitus (RR 0.93, CI 0.90, 0.96 for each 0.5 serving/day increase; p<0.001). The study not included in the meta-analysis indicates higher whole grain bread consumption is associated with reduced incidence of type 2 diabetes mellitus.
Whole grain bread (serving/day) and type 2 diabetes mellitus
• Association • Moderate evidence • The direction of the association indicates higher consumption of whole grain bread is beneficial to health • The association is biologically relevant
132
Total cereals Cardiovascular disease
8.124 Four cohort studies were identified that presented evidence on total cereals and cardiovascular disease events (Jacobs, Jr. et al., 2001; Liu et al., 2003; Drogan et al., 2007; Panagiotakos et al., 2009). Two studies could not be included in a meta-analysis as they did not report the necessary data, leaving an insufficient number of studies to enable a meta-analysis to be performed. (Cardio-metabolic review, cardiovascular disease chapter). No further studies were identified in the update search.
8.125 One study indicates no significant association between total cereal consumption and cardiovascular disease (Panagiotakos et al., 2009). The other three studies indicate higher consumption of higher fibre and total cereal (Liu et al., 2003), and whole grain bread (Jacobs, Jr. et al., 2001; Drogan et al., 2007) is associated with a reduced incidence of cardiovascular disease. The results are consistent with those relating to whole grains consumption.
Total cereals (serving/day) and cardiovascular disease
• Association • Moderate evidence • The direction of the association indicates higher total cereal consumption is beneficial to health • The association is biologically relevant
133
Whole grains 8.126 The definitions of whole grains vary between studies. The term ‘whole grains’
can have several meanings from ‘whole of the grain’ through to physically intact structures. Whole grains include whole wheat, whole-wheat flour, wheat flakes, bulgar wheat, whole and rolled oats, oatmeal, oat flakes, brown rice, whole rye and rye flour and whole barley. The definition of whole grains is discussed further in Chapter 2, paragraphs 2.39 to 2.41. Any associations indicated for whole grain may be related to its cereal fibre component. In one study cereal fibre intake was shown to be strongly correlated with consumption of whole-grain bread (r = 0.71) (Schulze et al., 2007a).
Cardiovascular disease 8.127 Six cohort studies from nine publications were identified that presented evidence
on whole grains intake and incident cardiovascular disease events (Jacobs, Jr. et al., 1998; Liu et al., 1999; Liu et al., 2000b; Steffen et al., 2003; Jensen et al., 2004; Sahyoun et al., 2006; Drogan et al., 2007; Jacobs, Jr. et al., 2007; Nettleton et al., 2008), five of which were included in a meta-analysis (Liu et al., 2000; Steffen et al., 2003; Jensen et al., 2004; Sahyoun et al., 2006; Jacobs, Jr. et al., 2007). Results from four publications were not included in the meta-analysis. Two publications were an early analysis (Jacobs, Jr. et al., 1998; Liu et al., 1999) of data that are more fully presented in later publications (Liu et al., 2000b; Jacobs, Jr. et al., 2007) . Two
publications presented data on the same study (Steffen et al., 2003; Nettleton et al., 2008) and the data from the former were used in a meta-analysis. One study only presented results for individual sources of whole grains, which were in broad agreement with the results from the meta-analysis (Drogan et al., 2007). One cohort study was subsequently identified in the update search (Nilsson et al., 2012) (Cardio-metabolic review, cardiovascular disease chapter; Update search).
8.128 An association is indicated between higher consumption of whole grains and a reduced incidence of cardiovascular disease (RR 0.95, 95% CI 0.92, 0.97 for each 0.5 serving/day; p<0.001). The study identified in the update search indicates no significant association between whole grains intake and incidence of cardiovascular disease.
Whole grains (serving/day) and cardiovascular disease
• Association • Moderate evidence • The direction of the association indicates higher whole grains consumption is beneficial to health • The association is biologically relevant
134
Stroke 8.129 Three cohort studies were identified that presented evidence on whole grains
intake and stroke, all of which were included in a meta-analysis (Liu et al., 2000b; Steffen et al., 2003; Jacobs, Jr. et al., 2007). No further studies were identified in the update search (Cardio-metabolic review, cardiovascular disease chapter).
8.130 An association is indicated between higher consumption of whole grains and a reduced incidence of stroke (RR 0.96, 95% CI 0.93, 0.99 for each 0.5 serving/day; p=0.02).
Whole grains (serving/day) and stroke
• Association • Limited evidence • The direction of the association indicates higher whole grains consumption is beneficial to health • The association is biologically relevant
Hypertension 8.131 Three cohort studies were identified that presented evidence on whole grains
intake and incident hypertension, all of which were included in a meta-analysis (Steffen et al., 2005; Wang et al., 2007; Flint et al., 2009). No further studies were identified in the update search (Cardio-metabolic review, cardiovascular disease chapter).
8.132 An association is indicated between higher consumption of whole grains and a reduced incidence of hypertension (RR 0.95, 95% CI 0.93, 0.96 for each 0.5 serving/ day; p<0.001).
Whole grains (serving/day) and hypertension
• Association • Limited evidence • The direction of the association indicates higher whole grains consumption is beneficial to health • The association is biologically relevant
Blood pressure 8.133 Three randomised controlled trials were identified that presented evidence on
whole grains intake in relation to blood pressure, all of which were included in the meta-analyses for systolic and diastolic blood pressure (Davy et al., 2002b; Howard et al., 2006b; Andersson et al., 2007; Tinker et al., 2008). Two publications presented data from the same trial (Howard et al., 2006b; Tinker et al., 2008), and the data from Howard et al. (2006b) were used in the meta-analysis. Two trials were subsequently identified in the update search (Brownlee et al., 2010; Tighe et al., 2010) (Cardio-metabolic review, incident hypertension and blood pressure chapter; Update search). All trials compared whole grain diets to refined grain control diets.
8.134 No significant effect is demonstrated for whole grains consumption on systolic blood pressure (0.2 mmHg, 95% CI -1.6, 2.0; p=0.85). Of the trials identified in the update search one reports no significant effect (Brownlee et al., 2010), and the other reports higher whole grains consumption to reduce systolic blood pressure (Tighe et al., 2010).
8.135 No significant effect is demonstrated for whole grains consumption on diastolic blood pressure (-0.3 mmHg, 95% CI -0.9, 0.4; p=0.43). The two trials identified in the update search report no significant effect of whole grains consumption on diastolic blood pressure.
8.136 One trial, contributes 92% to the pooled estimate for systolic blood pressure and 97% for diastolic blood pressure (Howard et al., 2006b). This trial elicited a very small increase in whole grains consumption (less than one serving per day) and also resulted in weight loss differences between experimental groups.
Whole grains and systolic and diastolic blood pressure
• No effect • Moderate evidence
135
Fasting blood lipids 8.137 Five randomised controlled trials were identified that presented evidence on whole
grains intake in relation to total cholesterol, LDL-cholesterol, HDL-cholesterol and triacylglycerol concentration, all of which were included in a meta-analysis (Saltzman et al., 2001; Davy et al., 2002a; Howard et al., 2006b; Andersson et al., 2007; Kim et al., 2008). One study did not report data on LDL-cholesterol (Kim et al., 2008). Two trials were subsequently identified in the update search (Tighe et al., 2010; Brownlee et al., 2010) (Cardio-metabolic review, hyperlipidaemias and
blood lipids chapter; Update search). All trials compared whole grain diets to refined grain control diets. Two of the trials are weight-loss trials (Saltzman et al., 2001; Kim et al., 2008).
8.138 No significant effect is demonstrated for whole grains consumption on fasting total cholesterol concentration (0.04mmol/L, 95% CI -0.12, 0.20; p=0.49). The trials identified in the update search demonstrate inconsistent effects of whole grains consumption on fasting total cholesterol concentration. One trial reports no significant effect (Brownlee et al., 2010), and the other reports a decrease with refined grain consumption (Tighe et al., 2010).
8.139 No significant effect is demonstrated for whole grains consumption on fasting triacylglycerol concentration (-0.02mmol/L, 95% CI -0.06, 0.03; p=0.46). The trials identified in the update search report no significant effect of whole grains consumption on fasting triacylglycerol concentration.
8.140 No consistent effect is demonstrated for whole grains consumption on either fasting HDL- or LDL-cholesterol concentration on the forest plot, and the heterogeneity is above the pre-specified cut-off of 75% (I2=77% and 79%, respectively) and, therefore, the pooled estimate is not reported. The heterogeneity may be due to differences in subjects’ weight change between the trials. One trial reports a higher BMI with higher whole grains consumption, as compared with refined grain consumption (Andersson et al., 2007). The weight loss trials report greater weight loss after higher whole grains consumption, as compared with refined grain consumption (Saltzman et al., 2001; Howard et al., 2006; Kim et al., 2008). The trials identified in the update search report no significant effect on HDL-cholesterol concentration and inconsistent effects on LDL-cholesterol concentration. One trial reports no significant effect (Brownlee et al., 2010), and the other reports a decrease with refined grain consumption (Tighe et al., 2010).
Whole grains and fasting total cholesterol and triacylglycerol concentration
• No effect • Adequate evidence
136
Energy intake 8.141 Three randomised controlled trials were identified that presented evidence on
whole grains intake in relation to energy intake, all of which were included in a meta-analysis (Turpeinen et al., 2000; Howard et al., 2006a; Andersson et al., 2007; Tinker et al., 2008). Two publications reported on the same trial (Howard et al., 2006a; Tinker et al., 2008) and the data from Tinker et al (2008) were used in the meta-analysis (Cardio-metabolic review, energy intake and eating motivation chapter). All trials compared whole grain diets to refined grain control diets.
8.142 An effect is demonstrated for higher whole grains consumption on reducing energy intake (-360 kJ, 95% CI -642, -79; p=0.01). One trial contributes 75% to the pooled estimate (Tinker et al., 2008) and is responsible for the significant effect. The dietary intervention in this study is to promote a decrease in fat intake and
increases in vegetable, fruit, and grain consumption, with the increase in whole grains intake being small (daily whole grains servings increased from 1.1 to 1.4).
Whole grains and energy intake
• Effect • Limited evidence • The direction of the effect demonstrates higher whole grains consumption may be beneficial to health, but it is not possible to exclude confounding by other dietary variables • The effect is biologically relevant
137
Type 2 diabetes mellitus 8.143 Eight cohort studies in seven publications were identified that presented evidence
on whole grains intake and incidence of type 2 diabetes mellitus, all of which were included in a meta-analysis (Meyer et al., 2000; Liu et al., 2000c; Fung et al., 2002; Montonen et al., 2003; van Dam et al., 2006; de Munter et al., 2007; Fisher et al., 2009). De Munter et al. 2007 reported on the Nurse’s Health Study and on the Nurse’s Health Study 2. Two publications reported on the same study (Liu et al., 2000c; de Munter et al., 2007) and the data from the most recent were used in a meta-analysis (de Munter et al., 2007). One publication reporting a longer follow-up period for three cohorts already included, was identified in the update search (Sun et al., 2010) (Cardio-metabolic review, diabetes and glycaemia chapter; Update search). A further meta-analysis was performed (Aune et al., 2013) which included the studies found in the update search and also included three later studies (Ericson et al., 2013; Parker et al., 2013; Wirstrom et al., 2013). The results from the later meta-analysis are presented below and were used to inform this r eport.
8.144 An association is indicated, between higher whole grains consumption and reduced incidence of type 2 diabetes, as indicated from the forest plot, but the heterogeneity is above the pre-specified cut-off of 75% (I2=82%) and, therefore, the pooled estimate is not reported.
Whole grains (serving/day) and type 2 diabetes mellitus
• Association • Moderate evidence • The direction of the association indicates higher whole grains consumption is beneficial to health • It is not possible to quantify the magnitude of the association due to differences in definition and serving size used. It is therefore not possible to determine the biological relevance of this finding
Fasting blood glucose 8.145 Four randomised controlled trials were identified that presented evidence on
whole grains intake in relation to fasting blood glucose, all of which were included in a meta-analysis (Saltzman et al., 2001; Howard et al., 2006b; Andersson et al., 2007; Kim et al., 2008; Tinker et al., 2008). Two publications reported on the same trial (Howard et al., 2006b; Tinker et al., 2008); the results from Howard et al.
(2006b) were used in a meta-analysis. Two trials were subsequently identified in the update search (Tighe et al., 2010; Brownlee et al., 2010) (Cardio-metabolic review, diabetes and glycaemia chapter; Update search). All trials compared whole grain diets to refined grain control diets. Two of the trials were weight-loss trials (Saltzman et al., 2001; Kim et al., 2008).
8.146 No significant effect is demonstrated for whole grains consumption on fasting blood glucose concentration (-0.05mmol/L, 95% CI -0.12, 0.02; p=0.14). The trials identified in the update search report no significant effect of whole grains consumption on fasting blood glucose concentration.
Whole grains and fasting blood glucose concentration
• No effect • Adequate evidence
138
Fasting blood insulin 8.147 Four randomised controlled trials were identified that presented evidence on
whole grains intake in relation to fasting insulin (Saltzman et al., 2001; Howard et al., 2006b; Andersson et al., 2007; Kim et al., 2008; Tinker et al., 2008). Two publications reported on the same trial (Howard et al., 2006b; Tinker et al., 2008); the results from Howard et al. (2006b) were used. Two trials were subsequently identified in the update search (Tighe et al., 2010; Brownlee et al., 2010) (Cardio-metabolic review, diabetes and glycaemia chapter; Update search). All trials compared whole grain diets to refined grain control diets. Two of the trials were weight-loss trials (Saltzman et al., 2001; Kim et al., 2008).
8.148 Due to the different methodologies used to measure fasting insulin concentration, it was not possible to conduct a meta-analysis. All of the trials identified in the systematic review and the update search report no significant effect of whole grains consumption on fasting insulin concentration.
Whole grains and fasting blood insulin concentration
• No effect • Adequate evidence
Insulin sensitivity 8.149 Three randomised controlled trials were identified that presented evidence on
whole grains intake in relation to insulin sensitivity (Saltzman et al., 2001; Howard et al., 2006b; Andersson et al., 2007; Tinker et al., 2008). Two publications reported on the same trial (Howard et al., 2006b; Tinker et al., 2008); the results from Howard et al., 2006b were used. Two trials were subsequently identified in the update search (Tighe et al., 2010; Brownlee et al., 2010) (Cardio-metabolic review, diabetes chapter; Update search). All trials compared whole grain diets to refined grain control diets. One of the trials was a weight-loss study (Saltzman et al., 2001).
8.150 Due to variation between the different methodologies used to measure fasting insulin concentration, it was not possible to conduct a meta-analysis. All of the trials identified in the systematic review and the update search report no significant effect of whole grains consumption on insulin sensitivity.
Whole grains and insulin sensitivity
• No effect • Adequate evidence
Colo-rectal cancer 8.151 Three cohort studies were identified that presented evidence on whole grains
intake and colo-rectal cancer incidence, all of which were included in a meta-analysis (Pietinen et al., 1999; Larsson et al., 2005; Schatzkin et al., 2007). No further studies were identified in the update search (Colo-rectal health review).
8.152 A non-significant borderline association is indicated between higher whole grains consumption and reduced incidence of colo-rectal cancer (RR 0.97, CI 0.94, 1.00 for each 0.5 serving/day increase; p=0.077).
Whole grains (serving/day) and colo-rectal cancer
• No association • Limited evidence
Colon cancer 8.153 Three cohort studies were identified that presented evidence on whole grains
intake and colon cancer incidence, all of which were included in a meta-analysis (McCullough et al., 2003; Larsson et al., 2005; Schatzkin et al., 2007). No further studies were identified in the update search (Colo-rectal health review).
8.154 An association is indicated between higher whole grains consumption and reduced incidence of colon cancer (RR 0.97, CI 0.95, 0.99 for each 0.5 serving/day increase; p=0.015).
Whole grains (serving/day) and colon cancer
• Association • Limited evidence • The direction of the association indicates higher whole grains consumption is beneficial to health • The association is biologically relevant
139
Children and adolescents 8.155 Three cohort studies were conducted in children and adolescents aged five years
or more.
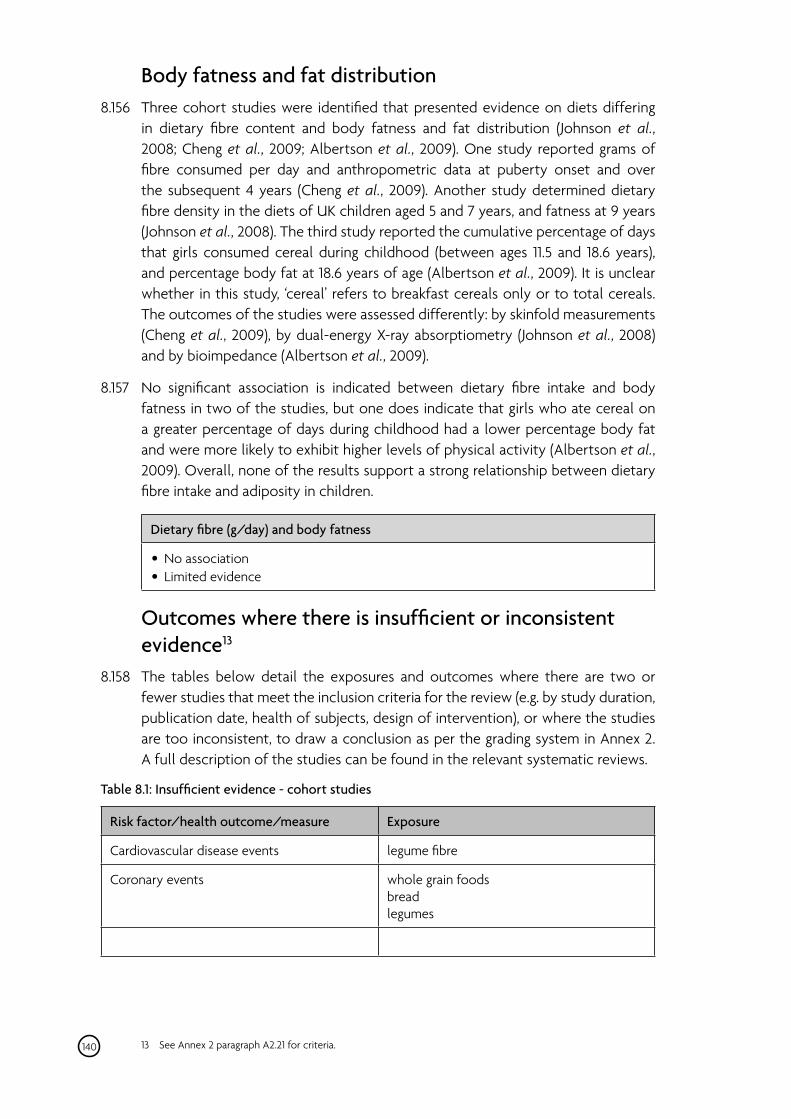
Body fatness and fat distribution 8.156 Three cohort studies were identified that presented evidence on diets differing
in dietary fibre content and body fatness and fat distribution (Johnson et al., 2008; Cheng et al., 2009; Albertson et al., 2009). One study reported grams of fibre consumed per day and anthropometric data at puberty onset and over the subsequent 4 years (Cheng et al., 2009). Another study determined dietary fibre density in the diets of UK children aged 5 and 7 years, and fatness at 9 years (Johnson et al., 2008). The third study reported the cumulative percentage of days that girls consumed cereal during childhood (between ages 11.5 and 18.6 years), and percentage body fat at 18.6 years of age (Albertson et al., 2009). It is unclear whether in this study, ‘cereal’ refers to breakfast cereals only or to total cereals. The outcomes of the studies were assessed differently: by skinfold measurements (Cheng et al., 2009), by dual-energy X-ray absorptiometry (Johnson et al., 2008) and by bioimpedance (Albertson et al., 2009).
8.157 No significant association is indicated between dietary fibre intake and body fatness in two of the studies, but one does indicate that girls who ate cereal on a greater percentage of days during childhood had a lower percentage body fat and were more likely to exhibit higher levels of physical activity (Albertson et al., 2009). Overall, none of the results support a strong relationship between dietary fibre intake and adiposity in children.
Dietary fibre (g/day) and body fatness
• No association • Limited evidence
Outcomes where there is insufficient or inconsistent evidence13
8.158 The tables below detail the exposures and outcomes where there are two or fewer studies that meet the inclusion criteria for the review (e.g. by study duration, publication date, health of subjects, design of intervention), or where the studies are too inconsistent, to draw a conclusion as per the grading system in Annex 2. A full description of the studies can be found in the relevant systematic reviews.
Table 8.1: Insufficient evidence - cohort studies
Risk factor/health outcome/measure Exposure
Cardiovascular disease events legume fibre
Coronary events whole grain foods bread legumes
13 See Annex 2 paragraph A2.21 for criteria. 140
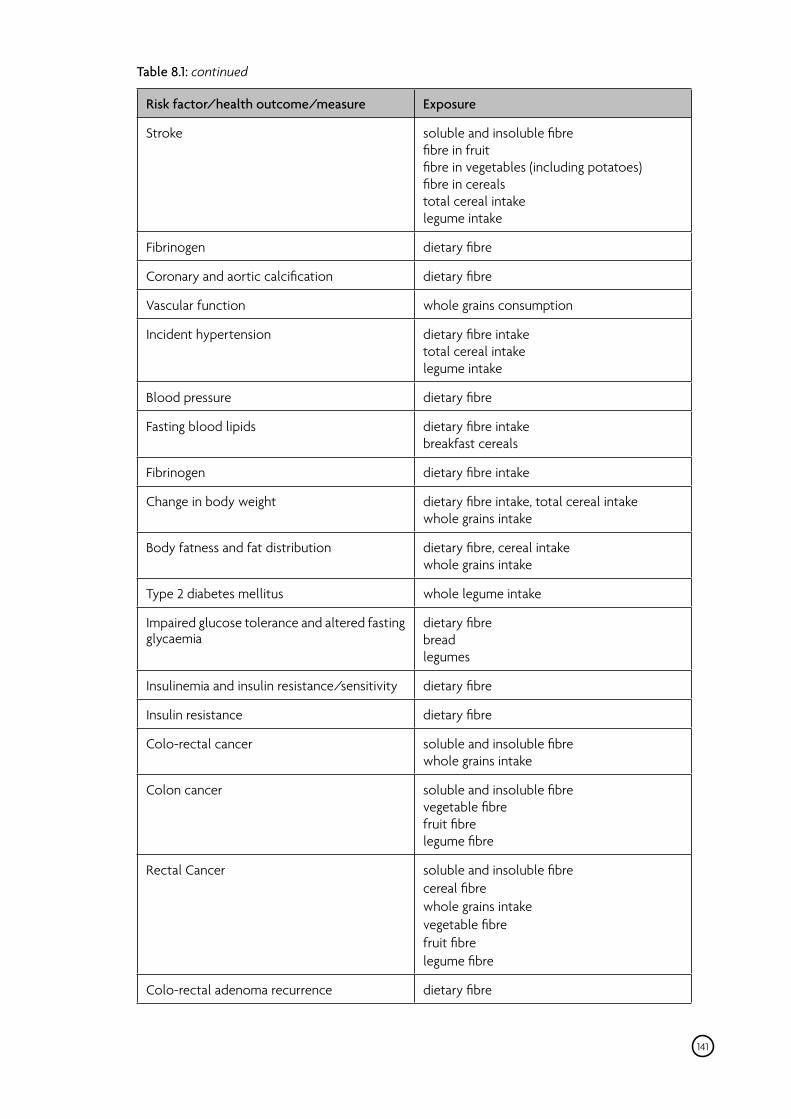
Table 8.1: continued
Risk factor/health outcome/measure Exposure
Stroke soluble and insoluble fibre fibre in fruit fibre in vegetables (including potatoes) fibre in cereals total cereal intake legume intake
Fibrinogen dietary fibre
Coronary and aortic calcification dietary fibre
Vascular function whole grains consumption
Incident hypertension dietary fibre intake total cereal intake legume intake
Blood pressure dietary fibre
Fasting blood lipids dietary fibre intake breakfast cereals
Fibrinogen dietary fibre intake
Change in body weight dietary fibre intake, total cereal intake whole grains intake
Body fatness and fat distribution dietary fibre, cereal intake whole grains intake
Type 2 diabetes mellitus whole legume intake
Impaired glucose tolerance and altered fasting glycaemia
dietary fibre bread legumes
Insulinemia and insulin resistance/sensitivity dietary fibre
Insulin resistance dietary fibre
Colo-rectal cancer soluble and insoluble fibre whole grains intake
Colon cancer soluble and insoluble fibre vegetable fibre fruit fibre legume fibre
Rectal Cancer soluble and insoluble fibre cereal fibre whole grains intake vegetable fibre fruit fibre legume fibre
Colo-rectal adenoma recurrence dietary fibre
141
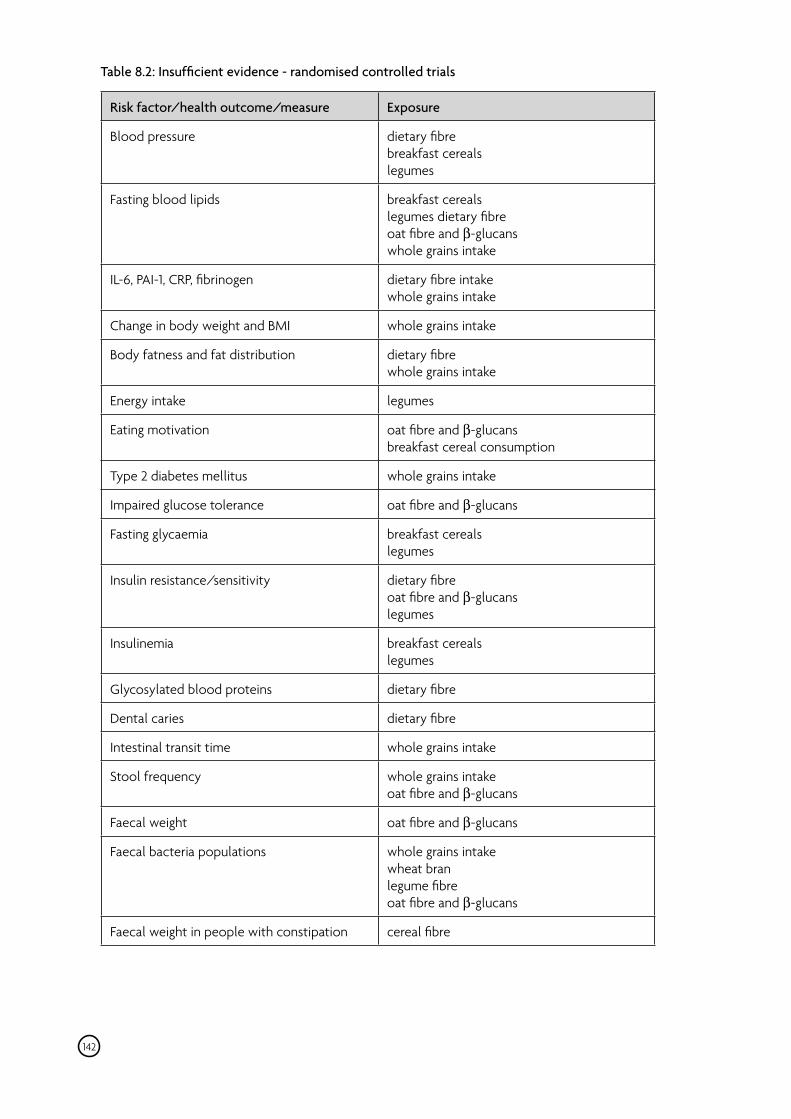
Table 8.2: Insufficient evidence - randomised controlled trials
Risk factor/health outcome/measure Exposure
Blood pressure dietary fibre breakfast cereals legumes
Fasting blood lipids breakfast cereals legumes dietary fibre oat fibre and β-glucans whole grains intake
IL-6, PAI-1, CRP, fibrinogen dietary fibre intake whole grains intake
Change in body weight and BMI whole grains intake
Body fatness and fat distribution dietary fibre whole grains intake
Energy intake legumes
Eating motivation oat fibre and β-glucans breakfast cereal consumption
Type 2 diabetes mellitus whole grains intake
Impaired glucose tolerance oat fibre and β-glucans
Fasting glycaemia breakfast cereals legumes
Insulin resistance/sensitivity dietary fibre oat fibre and β-glucans
legumes
Insulinemia breakfast cereals legumes
Glycosylated blood proteins dietary fibre
Dental caries dietary fibre
Intestinal transit time whole grains intake
Stool frequency whole grains intake oat fibre and β-glucans
Faecal weight oat fibre and β-glucans
Faecal bacteria populations whole grains intake wheat bran legume fibre oat fibre and β-glucans
Faecal weight in people with constipation cereal fibre
142
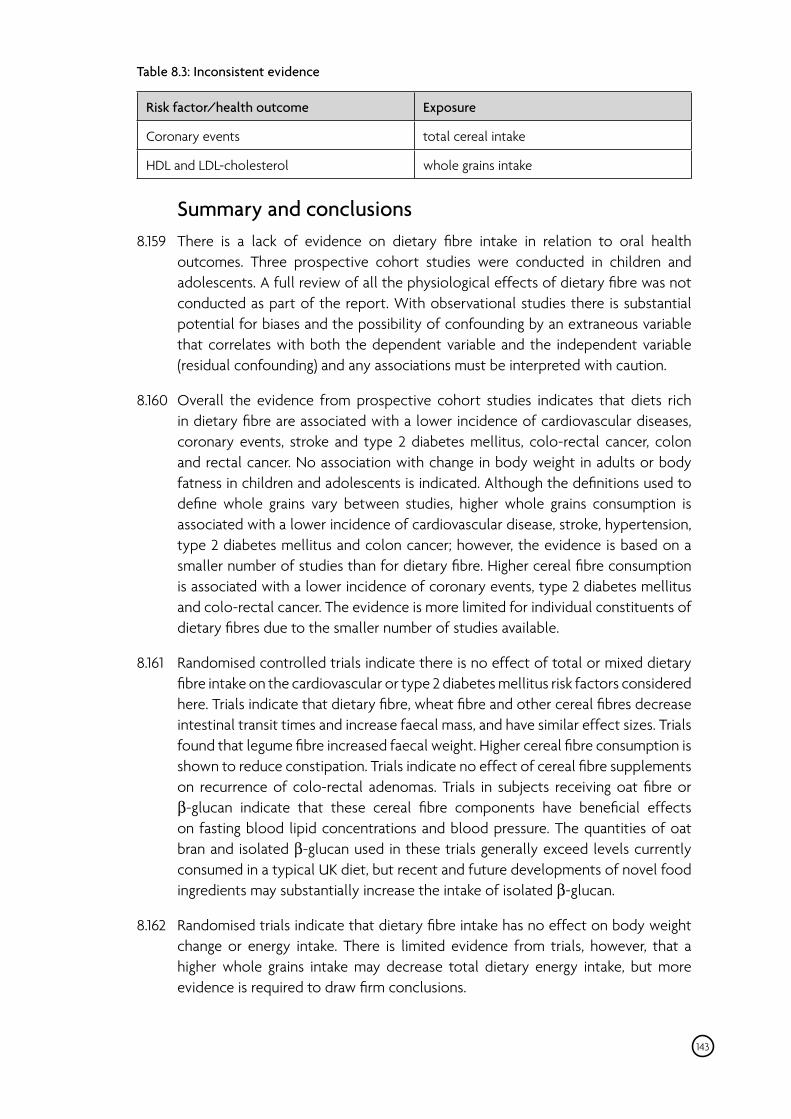
Table 8.3: Inconsistent evidence
Risk factor/health outcome Exposure
Coronary events total cereal intake
HDL and LDL-cholesterol whole grains intake
Summary and conclusions 8.159 There is a lack of evidence on dietary fibre intake in relation to oral health
outcomes. Three prospective cohort studies were conducted in children and adolescents. A full review of all the physiological effects of dietary fibre was not conducted as part of the report. With observational studies there is substantial potential for biases and the possibility of confounding by an extraneous variable that correlates with both the dependent variable and the independent variable (residual confounding) and any associations must be interpreted with caution.
8.160 Overall the evidence from prospective cohort studies indicates that diets rich in dietary fibre are associated with a lower incidence of cardiovascular diseases, coronary events, stroke and type 2 diabetes mellitus, colo-rectal cancer, colon and rectal cancer. No association with change in body weight in adults or body fatness in children and adolescents is indicated. Although the definitions used to define whole grains vary between studies, higher whole grains consumption is associated with a lower incidence of cardiovascular disease, stroke, hypertension, type 2 diabetes mellitus and colon cancer; however, the evidence is based on a smaller number of studies than for dietary fibre. Higher cereal fibre consumption is associated with a lower incidence of coronary events, type 2 diabetes mellitus and colo-rectal cancer. The evidence is more limited for individual constituents of dietary fibres due to the smaller number of studies available.
8.161 Randomised controlled trials indicate there is no effect of total or mixed dietary fibre intake on the cardiovascular or type 2 diabetes mellitus risk factors considered here. Trials indicate that dietary fibre, wheat fibre and other cereal fibres decrease intestinal transit times and increase faecal mass, and have similar effect sizes. Trials found that legume fibre increased faecal weight. Higher cereal fibre consumption is shown to reduce constipation. Trials indicate no effect of cereal fibre supplements on recurrence of colo-rectal adenomas. Trials in subjects receiving oat fibre or β-glucan indicate that these cereal fibre components have beneficial effects on fasting blood lipid concentrations and blood pressure. The quantities of oat bran and isolated β-glucan used in these trials generally exceed levels currently consumed in a typical UK diet, but recent and future developments of novel food ingredients may substantially increase the intake of isolated β-glucan.
8.162 Randomised trials indicate that dietary fibre intake has no effect on body weight change or energy intake. There is limited evidence from trials, however, that a higher whole grains intake may decrease total dietary energy intake, but more evidence is required to draw firm conclusions.
143

8.163 Overall, prospective cohort studies provide mainly adequate evidence that a diet higher in dietary fibre is associated with a lower incidence of cardiovascular diseases, coronary events, type 2 diabetes mellitus, colo-rectal cancer, colon and rectal cancer. Randomised controlled trials indicate no effect of dietary fibre on cardio-metabolic risk factors, except for relatively high doses of β-glucan fibre, but do indicate a beneficial effect of dietary fibre on constipation, on decreasing intestinal transit times and on increasing faecal mass.
144
9 Non-digestible oligosaccharides, resistant starch, polyols and polydextrose
9.1 This assessment is based on randomised controlled trials investigating the relationship between supplements of non-digestible oligosaccharides (incl. inulin), resistant starch, polyols or polydextrose and cardio-metabolic and colo-rectal health. Adverse effects on gastrointestinal symptoms such as bloating, borborygmi or flatulence, have not been considered. There were no prospective cohort studies investigating the relationship between oligosaccharides and the relevant health/disease outcomes. Links to the individual systematic reviews and update search are given in Annex 1.
9.2 Evidence on health/disease outcomes has been discussed in detail only where there are sufficient data for a conclusion to be drawn from studies meeting the pre-agreed inclusion criteria. Outcomes where there are too few studies to reach a conclusion, are listed at the end of the chapter (see Table 9.1). Outcomes where the evidence was considered too inconsistent to make a valid judgement are also listed at the end of the chapter (see Table 9.2).
9.3 Information on resistant starch, non-digestible oligosaccharide or inulin intake in the UK is not available from the National Diet and Nutrition Survey. Based on the analytically determined inulin and fructo-oligosaccharide (fructans) content of specific foods (cereals, fruits and vegetables) and consumption data from the USA and Europe, it has been estimated that the intake of inulin-type fructans ranges between 1 and 4 g/day (van Loo et al., 1995). A study in 66 subjects in the UK (Dunn et al., 2011) estimates mean intakes of inulin and oligofructose to be approximately 4.0g/day and 3.8g/day respectively. Fructans are the storage carbohydrates in artichokes and chicory with small amounts of low molecular weight forms found in wheat, rye, asparagus and members of the onion, leek and garlic family (Cummings & Stephen, 2007). The main source of inulin-type fructans in a typical Western diet are wheat and onions.
9.4 National statistics for consumption of starchy foods have been used to estimate the intake of resistant starch in Europe as 4.1 g/day with variation in mean intakes from 3.2 to 5.7 between different European countries (Asp et al., 1996). The calculations are based on literature data using the Englyst method (Englyst et al., 1992) or separate analyses of foods with the Englyst method or the modified Berry method (Champ et al., 2003). Resistant starch intake in Sweden is estimated to be 3.2g/day (no variance data given) (Liljeberg Elmstahl, 2002), based on consumption data from the 1997-1998 national survey and calculated from the individual foods analysed using a modified Berry method (Akerberg et al., 1998). In the UK, mean resistant starch intake has been estimated at about 2.8g/day. This figure is derived from published food and food ingredient values for resistant
145
starch in conjunction with the average weekly consumption of these foods (and foods prepared from the food ingredients) by the general UK population (Annual Report of the Food Survey Committee, 1985) (Tomlin & Read, 1990).
9.5 Using national food consumption data from surveys conducted during the 1980s and determination of food resistant starch content by a modified Berry method (Berry, 1986; Champ et al., 2003), Italian intakes of resistant starch are estimated at 8.5 g/day (no variance data given), with regional differences (from 7.2 g/day in the north-west to 9.2 g/day in the south) (Brighenti et al., 1998). In Australia, intakes of resistant starch are estimated to be between 3.4 and 9.4g/day using the 1995 National Nutrition Survey and published values of food resistant starch content. The calculations are based on literature data obtained using the Englyst method (Roberts et al., 2004). In the USA, resistant starch mean intake is estimated to be approximately 4.9 g/day (range 2.8 to 7.9 g/day) based on the 1999-2002 National Health and Nutrition Examination Surveys and literature data of food resistant starch concentrations using the modified Berry method (Murphy et al., 2008).
9.6 The mono- and di-saccharide polyols, glycerol (E 422), sorbitol (E 420), mannitol (E 421), isomalt (E 953), maltitol (E 965 ), lactitol (E 966), xylitol (E 967), erythritol (E 968), and polydextrose (E 1200) are additives and it is likely that these substances are present in small amounts in diets in the UK. The National Diet and Nutrition Survey does not provide information on intakes.
Adults Non-digestible oligosaccharides Fasting blood lipid concentrations
9.7 Five randomised controlled trials were identified that presented evidence on fructo-oligosaccharide or inulin supplementation and fasting blood lipids, all of which were included in a meta-analysis (Davidson et al., 1998; Jackson et al., 1999; Letexier et al., 2003; Forcheron & Beylot, 2007; Genta et al., 2009). No further trials were identified in the update search (Cardio-metabolic review, hyperlipidaemias and blood lipids chapter).
9.8 An effect of non-digestible oligosaccharide supplementation on reducing fasting LDL-cholesterol is demonstrated (-0.39mmol/L, 95% CI -0.76, -0.03; p=0.04). The trial that reports the greatest effect of non-digestible oligosaccharide supplementation on fasting LDL-cholesterol concentration, as compared with the unsupplemented controls, also reports greater weight loss in the supplemented group (Genta et al., 2009).
9.9 No significant effect of non-digestible oligosaccharide or inulin supplementation on fasting total cholesterol (-0.13mmol/L, 95% CI -0.55, 0.30; p=0.57) or HDL-cholesterol (0.04mmol/L, 95% CI -0.12, 0.20; p=0.60) is demonstrated. A borderline significant association was reported for triacylglycerol concentration (-0.13mmol/L, 95% CI -0.27, 0.00; p=0.06). Three trials administer 10g/day inulin compared with a maltodextrin control (Jackson et al., 1999; Letexier et al., 2003;
146
Forcheron & Beylot, 2007). One trial administers approximately 12g/day fructo-oligosaccharides (as yacon syrup) compared with a similar dose of placebo syrup (Genta et al., 2009). The other trial administers 18g/day inulin incorporated into chocolate, spreads and sweeteners and compared with un-supplemented products (Davidson et al., 1998).
Non-digestible oligosaccharides (fructo-oligosaccharide or inulin) and fasting LDL-cholesterol concentration
• Effect • Limited evidence • The direction of the effect demonstrates higher consumption of non-digestible
oligosaccharides is potentially beneficial to health. The magnitude of the effect is biologically relevant, but is inconsistent with the effects on other fasting lipid
concentrations. The supplement doses used are above levels currently consumed in typical diets in the UK, but recent and future developments of novel food
ingredients may substantially increase the intake of these oligosaccharides • The effect is biologically relevant
Non-digestible oligosaccharides (fructo-oligosaccharide or inulin) and fasting total cholesterol, HDL-cholesterol and triacylglycerol concentration
• No effect • Limited evidence
Energy intake 9.10 Eleven randomised controlled trials were identified that presented evidence on
non-digestible oligosaccharide or inulin supplementation and energy intake, eight of which were included in a meta-analysis (Luo et al., 1996; Pedersen et al., 1997; Davidson et al., 1998; Cani et al., 2006; Pasman et al., 2006; Forcheron & Beylot, 2007; Cani et al., 2009; Parnell & Reimer, 2009). Three trials could not be included in a meta-analysis as they did not report the necessary data (Letexier et al., 2003; van den Heuvel et al., 2004; Genta et al., 2009) (Cardio-metabolic review, energy intake and eating motivation chapter).
9.11 Most trials administer either fructo-oligosaccharides or inulin, compared with a maltodextrin control; seven trials administer doses between 10 and 18g/day (Pedersen et al., 1997; Davidson et al., 1998; Letexier et al., 2003; Cani et al., 2006; Forcheron & Beylot, 2007; Genta et al., 2009; Cani et al., 2009), two trials administer doses of 20-21g/day (Luo et al., 1996; Parnell & Reimer, 2009). Two trials administer a modified dextrin in a dose-response manner at doses of 30, 40, 60 or 80 g/day (van den Heuvel et al., 2004; Pasman et al., 2006).
9.12 No significant effect of non-digestible oligosaccharide or inulin supplementation on energy intake is demonstrated (-378kJ, 95% CI -791, 36; p=0.07). The result is of borderline statistical significance. When the dose-response effect is explored by plotting the trials by order of difference in oligosaccharide intake between study groups, it appears that only at doses greater than 20g/day is there any suggestion of an effect. The three trials not included in the meta-analysis report no significant effect of non-digestible oligosaccharide supplementation on energy intake.
147
Non-digestible oligosaccharides and energy intake
No effect Moderate evidence
148
Fasting blood glucose 9.13 Five randomised controlled trials were identified that presented evidence on non-
digestible oligosaccharide or inulin supplementation and fasting blood glucose concentration, four of which were included in a meta-analysis (Jackson et al., 1999; Letexier et al., 2003; Forcheron & Beylot, 2007; Genta et al., 2009). One trial could not be included in a meta-analysis as it did not report the necessary data (Parnell & Reimer, 2009). No further trials were identified in the update search (Cardio-metabolic review, diabetes chapter). The meta-analysis did not adjust for baseline variable levels and possible differences in impact.
9.14 Three trials administered 10g/day inulin compared with a maltodextrin control (Jackson et al., 1999; Letexier et al., 2003; Forcheron & Beylot, 2007). One trial administered approximately 12g/day fructo-oligosaccharides (as yacon syrup) compared with a similar dose of placebo syrup (Genta et al., 2009). The other trial administered 21g/day inulin compared with a maltodextrin control (Parnell & Reimer, 2009).
9.15 No significant effect of non-digestible oligosaccharide or inulin supplementation on fasting blood glucose concentration is demonstrated (-0.13mmol/L, 95% CI -0.46, 0.20; p=0.79). The trial not included in the meta-analysis reports fasting glucose concentration to be reduced by non-digestible oligosaccharide supplementation and increased in the control group, which reflects the difference in body weight change between the experimental groups (Parnell & Reimer, 2009). Whether there is an overall effect of non-digestible oligosaccharide supplementation compared with control is unclear.
Non-digestible oligosaccharides and fasting blood glucose concentration
• No effect • Adequate evidence
Fasting blood insulin 9.16 Five randomised controlled trials were identified that presented evidence on non-
digestible oligosaccharide or inulin supplementation and fasting blood insulin concentration (Jackson et al., 1999; Letexier et al., 2003; Forcheron & Beylot, 2007; Genta et al., 2009; Parnell & Reimer, 2009). No further trials were identified in the update search (Cardio-metabolic review, diabetes chapter).
9.17 Three trials administer 10g/day inulin compared with a maltodextrin control (Jackson et al., 1999; Letexier et al., 2003; Forcheron & Beylot, 2007). One trial administers approximately 12g/day fructo-oligosaccharides (as yacon syrup) compared with a similar dose of placebo syrup (Genta et al., 2009). The other
trial administers 21g/day inulin compared with a maltodextrin control (Parnell & Reimer, 2009).
9.18 Due to variation between the different methodologies used to measure fasting insulin concentration, it was not possible to conduct a meta-analysis. No significant effect of non-digestible oligosaccharide supplementation on fasting blood insulin concentration is demonstrated in three of the trials (Jackson et al., 1999; Letexier et al., 2003; Forcheron & Beylot, 2007). One trial reports fasting insulin concentration to be reduced by oligosaccharide supplementation and increased in the control group, which reflects the difference in body weight change between the experimental groups (Parnell & Reimer, 2009). Whether there is an overall effect of non-digestible oligosaccharide supplementation compared with control is unclear. The other trial reports an effect of non-digestible oligosaccharide supplementation on reducing fasting blood insulin concentration, which reflects the difference in body weight change between the experimental groups (Genta et al., 2009).
Non-digestible oligosaccharides and fasting blood insulin concentration
• No effect • Moderate evidence
149
Faecal weight 9.19 Nine randomised controlled trials were identified that presented evidence on
non-digestible oligosaccharide or inulin supplementation in relation to faecal weight, of which eight were included in a meta-analysis (Ito et al., 1990; Bouhnik et al., 1996; Alles et al., 1999; van Dokkum et al., 1999; Causey et al., 2000; Den Hond et al., 2000; Tahiri et al., 2001; Scholtens et al., 2006b). In those trials that employed doses of less than 10/day there was no indication of any effect on faecal wet weight, so only data from doses of 10g/day or more were used. One trial was not included in the meta-analysis as it supplemented subjects’ diets with a 3g/day dose of non-digestible oligosaccharide (Swanson et al., 2002). No further trials were identified in the update search (Colo-rectal health review).
9.20 Three trials supplemented subjects’ diets with galacto-oligosaccharide (doses 10 to 15g/day) (Ito et al., 1990; Alles et al., 1999; van Dokkum et al., 1999); three trials supplemented subjects’ diets with inulin (doses 15 to 20g/day) (van Dokkum et al., 1999; Causey et al., 2000; Den Hond et al., 2000); and four trials supplemented subjects’ diets with fructo-oligosaccharide (doses 10 to 30g/day) (Bouhnik et al., 1996; van Dokkum et al., 1999; Tahiri et al., 2001; Scholtens et al., 2006b). All trials compare supplemented groups to either a sugar or maltodextrin control group.
9.21 An effect of all non-digestible oligosaccharide and inulin supplementation (10 to 30g/day; mean 15.4g/day) on increasing faecal wet weight is demonstrated (20g/ day, 95% CI 6, 35; p=0.006; data from eight trials).
9.22 An effect of fructo-oligosaccharide and inulin supplementation (10 to 30g/day; mean 16.4g/day) on increasing faecal wet weight is demonstrated (23g/day, 95% CI 7, 40; p=0.006; data from six trials).
9.23 No significant effect of galacto-oligosaccharide supplementation (10 to 15g/ day; mean 13g/day) on faecal wet weight is demonstrated (13g/day, 95% CI-11, 37; p=0.292; data from three trials). This is limited by the small number of trials supplementing with galacto-oligosaccharide.
9.24 Overall, there appears to be no difference in the faecal bulking capacity of fructo-oligosaccharide and inulin, which broadly equated to a 1 to 1.5g increase in faecal wet weight per 1g non-digestible oligosaccharide intake. The data are limited in relation to the faecal bulking capacity of galacto-oligosaccharide due to there being only three trials. Meta-regression of all data shows no significant linear dose-response relationship in the data, but interpretation is limited due to the relatively small number of trials; a one gram increase in non-digestible oligosaccharide intake results in a 1.8g (95% CI -0.8, 4.4; p<0.15) increase in faecal wet weight (Annex 1 additional meta-analyses).
Non-digestible oligosaccharides and faecal weight
• Effect • Adequate evidence • The direction of the effect demonstrates higher consumption of non-digestible
oligosaccharides is potentially beneficial to health. The supplement doses used are above levels currently consumed in typical diets in the UK, but recent and future
developments of novel food ingredients may substantially increase the intake of these oligosaccharides
• The effect is potentially biologically relevant
150
Faecal pH and short chain fatty acid content 9.25 Fifteen randomised controlled trials were identified that presented evidence on
non-digestible oligosaccharide or inulin supplementation in relation to faecal pH or short chain fatty acid (SCFA) content (Bouhnik et al., 1996; Bouhnik et al., 1999; Alles et al., 1999; van Dokkum et al., 1999; Causey et al., 2000; Tuohy et al., 2001; Tahiri et al., 2001; Swanson et al., 2002; Bouhnik et al., 2004; Bouhnik et al., 2006; Scholtens et al., 2006; Bouhnik et al., 2007; Kleessen et al., 2007; Ramnani et al., 2010; Walton et al., 2010). No further trials were identified in the update search (Colo-rectal health review). The data on measures of faecal pH and short chain fatty acid content were insufficiently comparable to allow a meta-analysis to be performed. Nine trials supplemented subjects’ diets with fructo-oligosaccharides (doses 2.5-30g/day) (Bouhnik et al., 1996; van Dokkum et al., 1999; Bouhnik et al., 1999; Tahiri et al., 2001; Tuohy et al., 2001; Swanson et al., 2002; Bouhnik et al., 2004; Bouhnik et al., 2006; Scholtens et al., 2006b). Three trials supplemented subjects’ diets with galacto-oligosaccharides (doses 8.5 to 15g/day) (Alles et al., 1999; van Dokkum et al., 1999; Bouhnik et al., 2004), six trials supplemented subjects’ diets with inulin (van Dokkum et al., 1999; Causey et al., 2000; Bouhnik et al., 2004; Bouhnik et al., 2007; Kleessen et al., 2007; Ramnani et al., 2010) and one trial supplemented subjects’ diets with manno-oligosaccharides derived from
coffee (Walton et al., 2010). All trials compared supplemented groups to either a sugar or maltodextrin control group.
9.26 Eight trials determined faecal SCFA content in response to non-digestible oligosaccharide or inulin supplementation and none report an effect on overall SCFA content. Five of these trials report no significant effect of non-digestible oligosaccharide or inulin supplementation (3 to 15g/day) on individual faecal SCFA content (Alles et al., 1999; Swanson et al., 2002; Kleessen et al., 2007; Ramnani et al., 2010; Walton et al., 2010); three report an increase in the concentration or proportion of faecal acetate at higher doses of non-digestible oligosaccharide or inulin (15 to 30g/day) (van Dokkum et al., 1999; Causey et al., 2000; Scholtens et al., 2006b). None of the trials report an effect of non-digestible oligosaccharide or inulin supplementation on faecal pH.
Non-digestible oligosaccharides and faecal short chain fatty acid content and pH
• No effect • Limited evidence
Faecal bacteria
Inulin 9.27 Seven randomised controlled trials were identified that presented evidence
on inulin supplementation (doses 5 to 15g/day) in relation to faecal bacteria content (Bouhnik et al., 2004; Fuller et al., 2007; Kleessen et al., 2007; Bouhnik et al., 2007; Calame et al., 2008; Costabile et al., 2010; Ramnani et al., 2010). The data on measures of faecal bacteria content were insufficiently comparable to allow a meta-analysis to be performed. One trial was identified in the update search (Slavin & Feirtag, 2011) (Colo-rectal health review; Update search). All trials compared supplemented groups to either a sugar or maltodextrin control.
9.28 Four trials report inulin supplementation (5 to 10g/day) to increase faecal Bifidobacterium spp. content (Fuller et al., 2007; Kleessen et al., 2007; Ramnani et al., 2010; Costabile et al., 2010). No significant effect of inulin supplementation (5 to 10g/day) on faecal bacteria content is reported in three trials (Bouhnik et al., 2004; Bouhnik et al., 2007; Calame et al., 2008). The trial identified in the update search reports no significant effect of inulin supplementation (20g/day) on faecal Bifidobacterium spp. content. Overall, the evidence is more inconsistent than for fructo- and galacto-oligosaccharides. It is possible that this inconsistency reflects inconsistencies in the average molecular weight of the inulin supplements used in these studies.
Inulin and faecal bacteria
• No effect • Limited evidence
151
Fructo-oligosaccharides 9.29 Six randomised controlled trials were identified that presented evidence on
fructo-oligosaccharide supplementation (doses 2.5 to 20g/day) in relation to faecal bacteria content (Bouhnik et al., 1996; Bouhnik et al., 1999; Tuohy et al., 2001; Tannock et al., 2004; Bouhnik et al., 2004; Bouhnik et al., 2006). The data on measures of faecal bacteria content were insufficiently comparable to allow a meta-analysis. No further trials were identified in the update search (Colo-rectal health review). All trials compared supplemented groups to either a sugar or a maltodextrin control group.
9.30 An effect of fructo-oligosaccharide supplementation on increasing faecal Bifidobacterium spp. content is generally reported at doses of 10g/day or more, but not at lower doses.
Fructo-oligosaccharides and faecal bacteria
• Effect at doses of 10g/day or more • Adequate evidence • Whether the effect is beneficial and of biological relevance is currently unclear. The supplement doses used are above levels currently consumed in typical diets in the UK, but recent and future developments of novel food ingredients may substantially increase the intake of these oligosaccharides
Galacto-oligosaccharides 9.31 Seven randomised controlled trials were identified that presented evidence on
galacto-oligosaccharide supplementation (doses 2.4 to 14.4g/day) in relation to faecal bacteria content (Ito et al., 1990; Alles et al., 1999; Gopal et al., 2003; Bouhnik et al., 2004; Tannock et al., 2004; Depeint et al., 2008; Vulevic et al., 2008). The data on measures of faecal bacteria content were insufficiently comparable to allow a meta-analysis to be performed. One trial was identified in the update search (Walton et al., 2012) (Colo-rectal health review; Update search). All trials compared supplemented groups to either a sugar or maltodextrin control.
9.32 An effect of galacto-oligosaccharide supplementation (doses 2.4 to 14.4g/day) on increasing faecal Bifidobacterium spp. content is demonstrated in most trials. The trial identified in the update search reports galacto-oligosaccharide supplementation (8g/day) to increase faecal Bifidobacterium spp. content relative to the control group.
Galacto-oligosaccharides and faecal bacteria
• Effect at doses of 2.4 to 14.4g/day, dependent on the specific, defined galacto-oligosaccharides source • Adequate evidence • Whether the effect is beneficial and of biological relevance is currently unclear. The supplement doses used are above levels currently consumed in typical diets in the UK, but recent and future developments of novel food ingredients may substantially increase the intake of these oligosaccharides
152
Arabinoxylan-oligosaccharides 9.33 One randomised controlled trial was identified that presented evidence on
arabinoxylan-oligosaccharide supplementation in relation to faecal bacteria content (Cloetens et al., 2010) (Colo-rectal health review). Two trials were identified in the update search (Walton et al., 2012; Francois et al., 2012). One trial was identified as a consequence of consultation on the draft report (Maki et al., 2012). The data on measures of faecal bacteria content were insufficiently comparable to allow a meta-analysis to be performed.
9.34 Two trials demonstrate an effect of arabinoxylan-oligosaccharide supplementation (4.8 and 10g/day) on increasing faecal Bifidobacterium spp. content (Francois et al., 2012; Maki et al., 2012). Two trials demonstrate no effect of arabinoxylan-oligosaccharide supplementation (2.2 and 10g/day) on the faecal Bifidobacterium spp. content (Cloetens et al., 2010; Walton et al., 2012).
Arabinoxylan-oligosaccharides and faecal bacteria
• No effect • Limited evidence
Calcium absorption 9.35 Most calcium absorption occurs in the small intestine, but about 5% has been
shown to occur in the colon (Barger-Lux et al., 1989). Experimental work shows that short-chain fatty acids may stimulate calcium (Trinidad et al., 1996; Trinidad et al., 1997; Trinidad et al., 1999) and magnesium (Coudray et al., 2003) absorption in the colon, suggesting that increased colonic fermentation of carbohydrates may stimulate mineral absorption. Trials conducted in children and adolescents are considered in the children and adolescents section at the end of the chapter (see paragraph 9.68).
9.36 Four randomised controlled trials were identified that presented evidence on non-digestible oligosaccharide or inulin supplementation in relation to calcium fractional absorption, all of which were included in a meta-analysis (Annex 1, additional meta-analyses). The trials supplemented subjects’ diets with doses of 10 to 20g/day (van den Heuvel et al., 1998; van den Heuvel et al., 2000; Tahiri et al., 2003; Holloway et al., 2007). No further trials were identified in the update search (Colo-rectal health review). All trials compared supplemented groups to either a sugar or a maltodextrin control group.
9.37 No significant effect of non-digestible oligosaccharide or inulin supplementation on fractional calcium absorption is demonstrated (0.47%, 95% CI -3.36, 4.29; p=0.81).
Non-digestible oligosaccharide or inulin and fractional calcium absorption
• No effect • Moderate evidence
153
Resistant starch Energy intake
9.38 Four randomised controlled trials were identified that presented evidence on resistant starch supplementation in relation to measures of energy intake, three of which were included in a meta-analysis (De Roos et al., 1995; Heijnen et al., 1996; Jenkins et al., 1998). One trial was not included in the meta-analysis as it was unclear which type of resistant starch subjects’ diets were supplemented with (Ells et al., 2005) (Cardio-metabolic review, energy intake and eating motivation chapter). The trials compared supplemented groups to either a sugar or non-supplemented test foods control group. The data were analysed separately for raw resistant starch (RS2) and retrograde resistant starch (RS3).
9.39 No significant effect of raw resistant starch (RS2) supplementation on measures of energy intake is demonstrated (18.5 kJ/day, 95% CI -710.0, 747.1; p=0.96).
9.40 No significant effect of retrograde resistant starch (RS3) supplementation on measures of energy intake is demonstrated (-102.8 kJ/day, 95% CI -824.1, 618.6; p=0.78).
Resistant starch (RS and RS ) and energy intake 2 3
• No effect • Limited evidence
154
Faecal weight 9.41 Ten randomised controlled trials were identified that presented evidence on
resistant starch supplementation in relation to faecal weight, of which seven were included in a meta-analysis (Phillips et al., 1995; Cummings et al., 1996; Silvester et al., 1997; Heijnen et al., 1998; Jenkins et al., 1998; Behall et al., 2002; Muir et al., 2004). In those trials where doses of 12g/day or less were employed there was no indication that these doses had any effect on faecal wet weight, so only data from doses greater than 12g/day were used. Two trials supplemented subjects’ diets with resistant starch at doses of 12/day or less and were not included in the meta-analyses (Tomlin & Read, 1990; Stewart et al., 2010). Two trials reported on chemically modified resistant starch (RS4) in relation to faecal wet weight, which was an insufficient number to enable a meta-analysis to be performed. Resistant starch supplementation appeared to have little effect on intestinal transit time (Tomlin & Read, 1990; Cummings et al., 1996; Silvester et al., 1997; Behall et al., 2002; Muir et al., 2004) or faecal moisture content (Cummings et al., 1996; Silvester et al., 1997; Heijnen et al., 1998; Vermorel et al., 2004). No further trials were identified in the update search (Colo-rectal health review). The data were analysed separately for raw resistant starch (RS2) and retrograde resistant starch (RS3). Six trials reported on the effects of RS2 (Cummings et al., 1996; Silvester et al., 1997; Jenkins et al., 1998; Heijnen et al., 1998; Behall et al., 2002; Muir et al., 2004); three trials reported on the effects of RS3 (Cummings et al., 1996; Heijnen et al., 1998; Jenkins et al., 1998) and one trial reported on the effects of RS1, 2 and
3 combined (Phillips et al., 1995).
9.42 An effect of raw resistant starch (RS2) supplementation on increasing faecal weight is demonstrated (38g/d, 95% CI 23, 53; p<0.001; data from six trials). The doses range from 21.5 to 37g/day (mean 28.3g/day).
9.43 An effect of retrograde resistant starch (RS3) supplementation on increasing faecal weight is demonstrated (46g/d, 95% CI 23, 68; p<0.001; data from three trials). The doses range from 17.4 to 32g/day (mean 24.1g/day).
9.44 An effect of resistant starch types 1, 2 and 3 supplementation on increasing faecal weight is demonstrated when analysed together (40g/d, 95% CI 26, 54; p<0.001; data from seven trials). The doses range from 17 to 37g/day (mean 27g/d). Of the trials that investigate chemically modified resistant starch (RS4) in relation to faecal wet weight, one reports that supplementation at 100g/day increases faecal weight (Vermorel et al., 2004), while the other observes no significant effect on faecal weight with supplementation of 12g/day of three different corn and tapioca modified starches (Stewart et al., 2010).
9.45 There appears to be no difference in the faecal bulking capacity of the different types of resistant starch (1, 2 and 3), which broadly equated to a 1-2g increase in faecal wet weight per 1g resistant starch. A meta-regression shows no significant linear dose-response relationship in the data, but interpretation is limited due to the relatively small number of trials (Annex 1 additional meta-analyses). The data are limited with regard to chemically modified resistant starch (RS4) due to there being only two trials.
Resistant starch (RS , RS1 2 and RS ) and faecal weight 3
• Effect • Adequate evidence • The direction of the effect demonstrates higher consumption of resistant starch is potentially beneficial to health. The supplement doses used are above levels currently consumed in typical diets in the UK, but recent and future developments of novel food ingredients may substantially increase the intake of resistant starches • The effect is potentially biologically relevant
155
Faecal pH and short chain fatty acid content 9.46 Ten randomised controlled trials were identified that presented evidence on
resistant starch supplementation in relation to faecal pH or short chain fatty acid content (Phillips et al., 1995; Noakes et al., 1996; Cummings et al., 1996; Silvester et al., 1997; Heijnen et al., 1998; Jenkins et al., 1998; Muir et al., 2004; Pasman et al., 2006; Fastinger et al., 2008; Stewart et al., 2010). No further trials were identified in the update search (Colo-rectal health review). The data on measures of faecal pH and short chain fatty acid content were insufficiently comparable to allow a meta-analysis to be performed.
9.47 An effect of supplementation with retrograded, granular and high amylose resistant starches (RS1, RS2 and RS3) on lowering faecal pH is demonstrated in four trials (Phillips et al., 1995; Noakes et al., 1996; Silvester et al., 1997; Muir et al., 2004), but two trials report no significant effect of 30g/day (Heijnen et al.,
1998) and 12g/day (Stewart et al., 2010). Three trials investigate the effect of chemically modified starches (RS4). One trial reports that tapioca dextrin RS4 supplementation lowers faecal pH, but other sources of RS4 do not (Stewart et al., 2010); the two other trials report no significant effect of RS4 on faecal pH (Pasman et al., 2006; Fastinger et al., 2008).
9.48 An effect of supplementation with retrograded, granular and high amylose resistant starches (RS1, RS2 and RS3) on increasing the faecal concentration or SCFA proportion of butyrate is demonstrated in five trials (Phillips et al., 1995; Noakes et al., 1996; Cummings et al., 1996; Jenkins et al., 1998; Muir et al., 2004), but two trials report no significant effect of 30g/day (Heijnen et al., 1998) and 12g/day (Stewart et al., 2010). Of the three trials investigating chemically modified starches (RS4), one reports all faecal SCFA concentrations, except butyrate, to be lowered by the RS4 intervention (Fastinger et al., 2008), but the other two report no significant effect (Pasman et al., 2006; Stewart et al., 2010).
9.49 Overall, resistant starch (RS1, RS2 and RS3) at doses of 20-40g/day generally lower faecal pH and increase either the concentration or proportion of faecal butyrate. There is little evidence for an effect of chemically modified resistant starch (RS4) on these faecal parameters.
Resistant starch (RS , RS1 2 and RS ) and faecal short chain fatty acid content 3
• Effect • Moderate evidence • Whether the effect is beneficial or of biological relevance is currently unclear. The supplement doses used are above levels currently consumed in typical diets in the UK, but recent and future developments of novel food ingredients may substantially increase the intake of resistant starches
Resistant starch (RS , RS1 2 and RS ) and faecal pH 3
• Effect • Limited evidence • Whether the effect is beneficial or of biological relevance is currently unclear. The supplement doses used are above levels currently consumed in typical diets in the UK, but recent and future developments of novel food ingredients may substantially increase the intake of resistant starches
Faecal bacteria 9.50 Five randomised controlled trials were identified that presented evidence on
resistant starch supplementation in relation to faecal Bifidobacterium spp. content (Jenkins et al., 1999c; Bouhnik et al., 2004; Pasman et al., 2006; Fastinger et al., 2008; Beards et al., 2010). No further trials were identified in the update search (Colo-rectal health review). The data on measures of faecal bacteria content were insufficiently comparable to allow a meta-analysis to be performed. Three trials supplemented subjects’ diets with chemically modified resistant starch (RS4) (Pasman et al., 2006; Fastinger et al., 2008; Beards et al., 2010), the other trial supplemented subjects’ diets with either raw resistant starch (RS2) (Jenkins et al.,
156
1999c) or retrograde resistant starch (RS3) (Jenkins et al., 1999c; Bouhnik et al., 2004).
9.51 No significant effect of supplementation with any of the resistant starches on faecal Bifidobacterium spp. content is demonstrated.
Resistant starch (RS , RS and RS ) and faecal bacteria 2 3 4
• No effect • Adequate evidence
157
Polyols Colo-rectal health
9.52 Three randomised controlled trials were identified that presented evidence on polyol supplementation in relation to faecal weight (van Es et al., 1986; Sinaud et al., 2002; Gostner et al., 2005). The data were insufficiently comparable to enable a meta-analysis to be performed. No further trials were identified in the update search (Colo-rectal health review).
9.53 Two trials report an effect of lactitol at 50g/d or maltitol at 100g/d supplementation on increasing faecal wet weight (van Es et al., 1986; Sinaud et al., 2002). One trial reports no significant effect of the polyol isomalt at 30g/d on faecal weight (Gostner et al., 2005). From these trials, polyol intake is found to have a small faecal bulking effect with the resulting increase in faecal wet weight being 0.5 to 1g per 1g of polyol consumed.
Polyols and faecal weight
• Effect • Limited evidence • The direction of the effect demonstrates higher consumption of polyols is potentially beneficial to health, although any effect is likely to be limited by the low levels of polyols in the diet • The effect is potentially biologically relevant
9.54 Three randomised controlled trials were identified that presented evidence on polyol supplementation in relation to faecal bacteria content (Ballongue et al., 1997; Gostner et al., 2005; Finney et al., 2007). The data were insufficiently comparable to enable a meta-analysis to be performed. No further trials were identified in the update search (Colo-rectal health review).
9.55 Two trials report lactitol at 20g/d and the polyol isomalt at 30g/day to increase faecal Bifidobacterium content (Ballongue et al., 1997; Gostner et al., 2005). In the other trial supplementation of lactitol at 5 or 10g/day has no significant effect on faecal bacterial content (Finney et al., 2007).
Polyols and faecal bacteria content
• Effect • Limited evidence • Whether the effect is beneficial or of biological relevance is currently unclear
9.56 Three randomised controlled trials were identified that presented evidence on polyol supplementation in relation to faecal pH (Ballongue et al., 1997; Gostner et al., 2006; Finney et al., 2007). The data were insufficiently comparable to enable a meta-analysis to be performed. No further trials were identified in the update search (Colo-rectal health review).
9.57 Two trials report an effect of lactitol supplementation on decreasing faecal pH at doses of 10g/day or more. The other trial reports no significant effect of the polyol isomalt on faecal pH (Gostner et al., 2006).
Polyols and faecal pH
• No effect • Limited evidence
9.58 Three randomised controlled trials were identified that presented evidence on polyol supplementation in relation to faecal short chain fatty acid content (Ballongue et al., 1997; Gostner et al., 2006; Finney et al., 2007). The data were insufficiently comparable to enable a meta-analysis to be performed. No further trials were identified in the update search (Colo-rectal health review).
9.59 One trial reports an effect of lactitol supplementation on increasing faecal acetate and lowering faecal propionate content (Ballongue et al., 1997). One trial reports no significant effect of supplementation with the polyol isomalt on faecal short chain fatty acid content (Gostner et al., 2006). It is not possible to determine the effect of the other trial as it did not report the necessary data (Finney et al., 2007).
Polyols and faecal short chain fatty acid content
• No effect • Limited evidence
Polydextrose Colo-rectal health
9.60 One randomised controlled trial was identified that presented evidence on polydextrose supplementation in relation to faecal weight (Zhong et al., 2000). One trial was identified in the update search (Vester Boler et al., 2011) (Colo-rectal health review; Update search). One trial was identified as a consequence of consultation on the draft report (Timm et al., 2013). It was not possible to perform a meta-analysis as one trial did not provide the necessary variance data (Vester Boler et al., 2011).
158
9.61 All three trials demonstrate an effect of polydextrose supplementation (8 to 21g/day) on increasing faecal wet weight. The faecal bulking effect in these trials ranges between 1 and 3g faecal wet weight per 1g of polydextrose consumed.
Polydextrose and faecal weight
• Effect • Limited evidence • The direction of the effect demonstrates higher consumption of polydextrose is potentially beneficial to health, although any effect would be limited by the low levels of polydextrose in the diet • The effect is potentially biologically relevant
9.62 Two randomised controlled trials were identified that presented evidence on polydextrose supplementation in relation to faecal Bifidobacterium spp. content (Zhong et al., 2000; Hengst et al., 2008). Two trials were identified in the update search (Vester Boler et al., 2011; Costabile et al., 2012). The data were insufficiently comparable to enable a meta-analysis to be performed (Colo-rectal health review; Update search).
9.63 One trial demonstrates a dose-response effect of polydextrose supplementation (4-12g/day) on increasing faecal Bifidobacterium content and reducing the number of Bacteriodes (Zhong et al., 2000). Another trial also demonstrates an effect of polydextrose supplementation (21g/day) on increasing faecal Bifidobacterium content (Vester Boler et al., 2011). Two trials demonstrate no significant effect of 8g/day polydextrose supplementation (Hengst et al., 2008; Costabile et al., 2012) on faecal Bifidobacterium content.
Polydextrose and faecal bacteria content
• No effect • Limited evidence
9.64 Two randomised controlled trials were identified that presented evidence on polydextrose supplementation in relation to faecal short chain fatty acid content (Zhong et al., 2000; Hengst et al., 2008). Two trials were identified in the update search (Vester Boler et al., 2011; Costabile et al., 2012) (Colo-rectal health review; Update search). One trial was identified as a consequence of consultation on the draft report (Timm et al., 2013). The data were insufficiently comparable to enable a meta-analysis to be performed.
9.65 One trial demonstrates a dose-response effect of polydextrose supplementation (4-12g/day) on incr easing f aecal but yrate, isobut yrate, and acetate content (Zhong et al., 2000). Two trials demonstrate an effect of polydextrose supplementation (20-21g/day) on decreasing total faecal acetate, propionate and butyrate and total short chain fatty acid content (Vester Boler et al., 2011; Timm et al., 2013). Two trials demonstrate no effect of 8g/day polydextrose (Hengst et al., 2008; Costabile et al., 2012) on faecal short chain fatty acid c ontent.
159
Polydextrose and faecal short chain fatty acid content
• No effect • Limited evidence
9.66 Two randomised controlled trials were identified that presented evidence on polydextrose supplementation in relation to faecal pH (Zhong et al., 2000; Hengst et al., 2008). One trial was subsequently identified in the update search (Vester Boler et al., 2011) (Colo-rectal health review; Update search). One trial was identified as a consequence of consultation on the draft report (Timm et al., 2013). A meta-analysis was performed, but the heterogeneity was above the pre-specified cut-off of 75% (I2=96%) and, therefore, the pooled estimate has not been reported. One trial could not be included as it did not provide the necessary variance data (Vester Boler et al., 2011).
9.67 One trial demonstrates a dose-response effect of polydextrose supplementation (4-12g/day) on decreasing faecal pH (Zhong et al., 2000). One trial demonstrates an effect of polydextrose supplementation (20g/day) on decreasing faecal pH (Timm et al., 2013). The two other trials demonstrate no significant effect of polydextrose supplementation (8 or 21g/day) on faecal pH (Hengst et al., 2008; Vester Boler et al., 2011).
Polydextrose and faecal pH
• No effect • Limited evidence
160
Infants, children and adolescents
Non-digestible oligosaccharides Calcium absorption
9.68 Five randomised controlled trials were identified that presented evidence on non-digestible oligosaccharide or inulin supplementation in relation to calcium fractional absorption in children and adolescents, all of which were included in a meta-analysis (van den Heuvel et al., 1999; Griffin et al., 2002; Griffin et al., 2003; Abrams et al., 2005; van den Heuvel et al., 2009) (Annex 1, additional meta-analyses). The trials supplemented subjects’ diets with doses of 5 to 15g/day (Colo-rectal health review). All trials compared supplemented groups to either a sugar or a maltodextrin control group.
9.69 A significant effect is demonstrated for non-digestible oligosaccharide or inulin supplementation on increasing fractional calcium absorption (4.95%, 95% CI 1.62, 8.27; p=0.003).
Non-digestible oligosaccharide (fructo-oligosaccharides) either alone or in combination with inulin and fractional calcium absorption
• Effect • Moderate evidence • Whether the effect is beneficial and of biological relevance is currently unclear. The supplement doses used are above levels currently consumed in typical diets in the UK, but recent and future developments of novel food ingredients may substantially increase the intake of these oligosaccharides.
161
Faecal bacteria
Infants up to three months of age 9.70 Fourteen randomised controlled trials in fifteen publications were identified
that presented evidence on supplementation of infant formula (2 to 8g/L) with non-digestible oligosaccharide (mainly galacto-oligosaccharide, but also some fructo-oligosaccharide) or inulin on faecal bacterial concentration or proportion in infants up to three months of age (Moro et al., 2002; Ben et al., 2004; Bakker-Zierikzee et al., 2005; Knol et al., 2005; Fanaro et al., 2005; Brunser et al., 2006; Scholtens et al., 2006a; Waligora-Dupriet et al., 2007; Kim et al., 2007; Scholtens et al., 2008; Ben et al., 2008; Costalos et al., 2008; Magne et al., 2008; Fanaro et al., 2009; Nakamura et al., 2009). Ben et al. (2004) and Ben et al. (2008) report the same study. One trial supplemented infant formula with inulin (average intake 1.5g/day) (Kim et al., 2007). The data on measures of faecal bacterial concentration or proportion were insufficiently comparable to allow a meta-analysis to be performed. Two trials were identified in the update search (Veereman-Wauters et al., 2011; Salvini et al., 2011) (Colo-rectal health review; Update search).
9.71 Six trials report no significant effect on the faecal concentration or proportion of Bifidobacterium spp. (Bakker-Zierikzee et al., 2005; Brunser et al., 2006; Scholtens et al., 2006a; Waligora-Dupriet et al., 2007; Costalos et al., 2008; Nakamura et al., 2009), while eight report that non-digestible oligosaccharide supplementation of infant formula increases the faecal concentration or proportion of Bifidobacterium spp. (Moro et al., 2002; Ben et al., 2004; Fanaro et al., 2005; Knol et al., 2005; Kim et al., 2007; Scholtens et al., 2008; Ben et al., 2008; Magne et al., 2008; Fanaro et al., 2009).
9.72 Both the trials identified in the update search report supplementation of infant formula with non-digestible oligosaccharide (mainly galacto-oligosaccharide, but also some fructo-oligosaccharide; 8g/L) increases the faecal concentration or proportion of Bifidobacterium spp (Veereman-Wauters et al., 2011; Salvini et al., 2011).
Non-digestible oligosaccharides (mainly galacto-oligosaccharide, but also some fructo-oligosaccharide) and faecal bacteria in infants up to three months of age
• Effect • Moderate evidence • Supplementation of infant formula with non-digestible oligosaccharides increases faecal Bifidobacterium spp. concentration or proportion. Whether this effect is beneficial or of biological relevance is currently unclear
Infants more than three months of age 9.73 Four randomised controlled trials were identified that examined the effect of
non-digestible oligosaccharide (mainly galacto-oligosaccharide, but also some fructo-oligosaccharide) supplementation of either infant formula (2-8g/L), follow-on formula (5g/L) or weaning foods (2.5 to 4g/day) on faecal bacterial concentration or proportion (Brunser et al., 2006; Scholtens et al., 2006a; Waligora-Dupriet et al., 2007; Fanaro et al., 2009). The data on measures of faecal bacterial concentration or proportion were insufficiently comparable to allow a meta-analysis to be performed. No further trials were identified in the update search (Colo-rectal health review).
9.74 Three trials report no significant effect of supplementation of infant formula, follow-on formula or weaning foods with non-digestible oligosaccharides on the faecal concentration or proportion of Bifidobacterium spp. (Brunser et al., 2006; Scholtens et al., 2006a; Waligora-Dupriet et al., 2007) while one trial reports supplementation of weaning foods increases in the faecal concentration of Bifidobacterium spp. (Fanaro et al., 2009).
Non-digestible oligosaccharides(mainly galacto-oligosaccharide, but also some fructo-oligosaccharide) and faecal bacteria in infants more than 3 months of age
• No effect • Limited evidence
Faecal pH and short chain fatty acid content 9.75 Nine randomised controlled trials examined the effect of non-digestible
oligosaccharides (mainly galacto-oligosaccharide, but also some fructo-oligosaccharide) or inulin supplementation of infant formula (2-8g/L) or weaning foods (2.5-4g/day) on faecal pH or short chain fatty acid content in infants (Moro et al., 2002; Ben et al., 2004; Bakker-Zierikzee et al., 2005; Fanaro et al., 2005; Knol et al., 2005; Scholtens et al., 2006a; Kim et al., 2007; Ben et al., 2008; Scholtens et al., 2008). Only one trial supplemented infant formula with inulin (average intake 1.5g/day)(Kim et al., 2007). All trials were conducted in infants aged less than three months, except one which was conducted in infants aged four to six months and supplemented weaning foods (Scholtens et al., 2006a). The data on measures of faecal pH and short chain fatty acid content were insufficiently comparable to allow a meta-analysis to be performed. No further studies were identified in the update search (Colo-rectal health review).
162
9.76 Of the five trials that investigated faecal short chain fatty acid content, four trials report supplementation of infant formula with non-digestible oligosaccharides (mainly galacto-oligosaccharide, but also some fructo-oligosaccharide) or inulin, as compared with increases the faecal concentration or proportion of faecal acetate (Ben et al., 2004; Bakker-Zierikzee et al., 2005; Knol et al., 2005; Ben et al., 2008), one trial, in older infants (aged four to six months), reports no significant effect (Scholtens et al., 2006a). All trials report supplementation of infant formula with non-digestible oligosaccharides or inulin, as compared with lowers faecal pH, but one trial in older infants reports supplementation of weaning foods with non-digestible oligosaccharides has no effect on faecal pH (Scholtens et al., 2006a).
Non-digestible oligosaccharides (mainly galacto-oligosaccharide, but also some fructo-oligosaccharide) or inulin and faecal pH and short chain fatty acid content in infants up to three months of age
• Effect • Adequate evidence • Supplementation of infant formula with either non-digestible oligosaccharides or inulin increases faecal acetate content and lowers pH. Whether this effect is beneficial or of biological relevance is currently unclear
Polyols Oral health
9.77 Six randomised controlled trials were identified that presented evidence on polyol containing gum and dental caries incidence in both the mixed and permanent dentition in children and adolescents (Finn et al., 1978; Glass, 1983; Beiswanger et al., 1998; Alanen et al., 2000; Machiulskiene et al., 2001; Szoke et al., 2001). The data on measures of dietary exposure, caries incidence/prevalence and risk assessment methods were insufficiently comparable to enable a meta-analysis to be performed. No further trials were identified in the update search (Oral heath review).
9.78 Four trials report an effect of sugar-free chewing gum containing sorbitol, mannitol or xylitol in reducing caries incidence in comparison with not using a chewing gum (Beiswanger et al., 1998; Alanen et al., 2000; Machiulskiene et al., 2001; Szoke et al., 2001). Two trials report no significant effect of sugar-free chewing gum containing sorbitol and/or mannitol in reducing caries incidence in comparison to a no gum control group (Finn et al., 1978; Glass, 1983). In the trials that employ a ‘no gum’ control group, it is unclear whether it is specifically the polyol or the act of chewing and the concomitant increase in salivary flow that contribute to the effect.
163
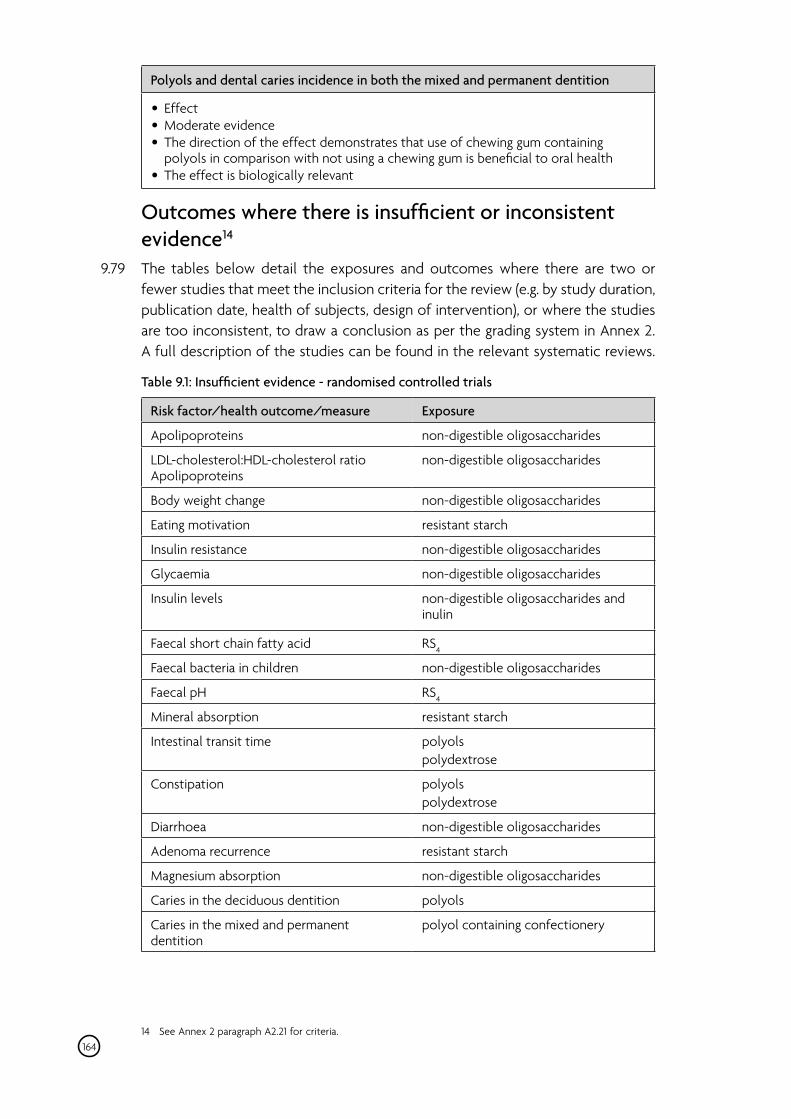
Polyols and dental caries incidence in both the mixed and permanent dentition
• Effect • Moderate evidence • The direction of the effect demonstrates that use of chewing gum containing polyols in comparison with not using a chewing gum is beneficial to oral health The effect is biologically relevant
Outcomes where there is insufficient or inconsistent evidence14
9.79 The tables below detail the exposures and outcomes where there are two or fewer studies that meet the inclusion criteria for the review (e.g. by study duration, publication date, health of subjects, design of intervention), or where the studies are too inconsistent, to draw a conclusion as per the grading system in Annex 2. A full description of the studies can be found in the relevant systematic reviews.
Table 9.1: Insufficient evidence - randomised controlled trials
Risk factor/health outcome/measure Exposure
Apolipoproteins non-digestible oligosaccharides
LDL-cholesterol:HDL-cholesterol ratio non-digestible oligosaccharides Apolipoproteins
Body weight change non-digestible oligosaccharides
Eating motivation resistant starch
Insulin resistance non-digestible oligosaccharides
Glycaemia non-digestible oligosaccharides
Insulin levels non-digestible oligosaccharides and inulin
Faecal short chain fatty acid RS4
Faecal bacteria in children non-digestible oligosaccharides
Faecal pH RS4
Mineral absorption resistant starch
Intestinal transit time polyols polydextrose
Constipation polyols polydextrose
Diarrhoea non-digestible oligosaccharides
Adenoma recurrence resistant starch
Magnesium absorption non-digestible oligosaccharides
Caries in the deciduous dentition polyols
Caries in the mixed and permanent polyol containing confectionery dentition
14 See Annex 2 paragraph A2.21 for criteria. 164
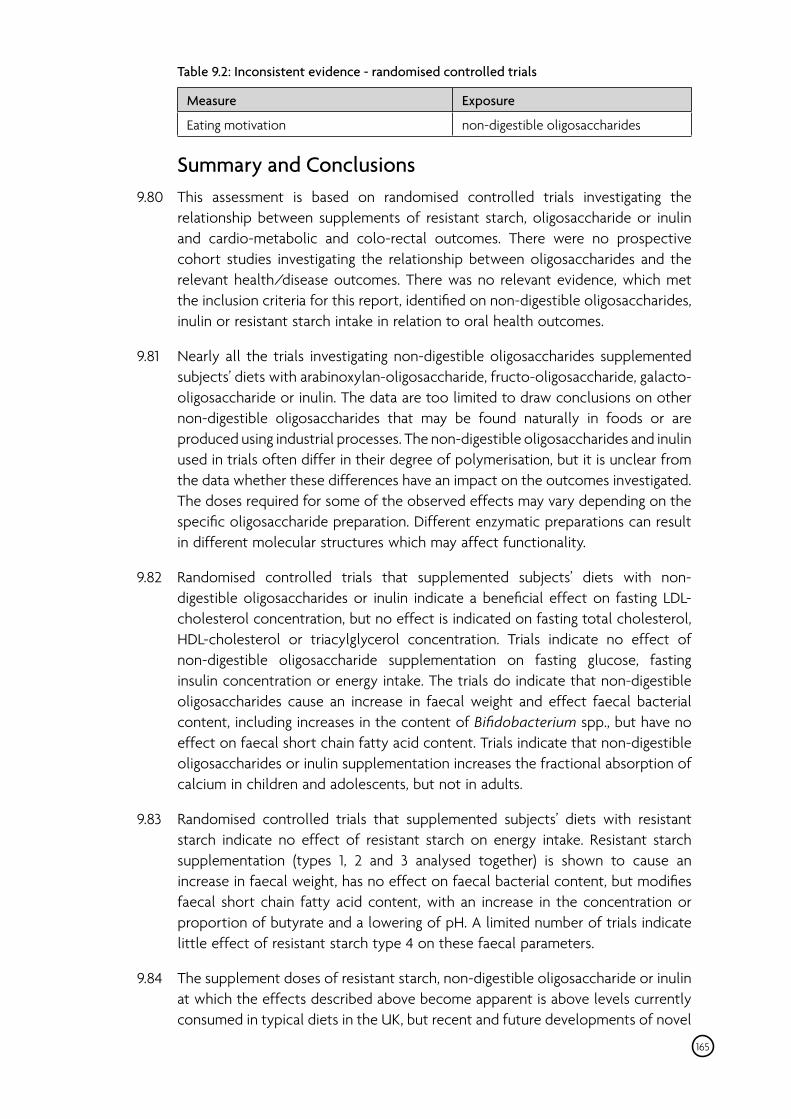
165
Table 9.2: Inconsistent evidence - randomised controlled trials
Measure Exposure
Eating motivation non-digestible oligosaccharides
Summary and Conclusions 9.80 This assessment is based on randomised controlled trials investigating the
relationship between supplements of resistant starch, oligosaccharide or inulin and cardio-metabolic and colo-rectal outcomes. There were no prospective cohort studies investigating the relationship between oligosaccharides and the relevant health/disease outcomes. There was no relevant evidence, which met the inclusion criteria for this report, identified on non-digestible oligosaccharides, inulin or resistant starch intake in relation to oral health outcomes.
9.81 Nearly all the trials investigating non-digestible oligosaccharides supplemented subjects’ diets with arabinoxylan-oligosaccharide, fructo-oligosaccharide, galacto-oligosaccharide or inulin. The data are too limited to draw conclusions on other non-digestible oligosaccharides that may be found naturally in foods or are produced using industrial processes. The non-digestible oligosaccharides and inulin used in trials often differ in their degree of polymerisation, but it is unclear from the data whether these differences have an impact on the outcomes investigated. The doses required for some of the observed effects may vary depending on the specific oligosaccharide preparation. Different enzymatic preparations can result in different molecular structures which may affect functionality.
9.82 Randomised controlled trials that supplemented subjects’ diets with non-digestible oligosaccharides or inulin indicate a beneficial effect on fasting LDL-cholesterol concentration, but no effect is indicated on fasting total cholesterol, HDL-cholesterol or triacylglycerol concentration. Trials indicate no effect of non-digestible oligosaccharide supplementation on fasting glucose, fasting insulin concentration or energy intake. The trials do indicate that non-digestible oligosaccharides cause an increase in faecal weight and effect faecal bacterial content, including increases in the content of Bifidobacterium spp., but have no effect on faecal short chain fatty acid content. Trials indicate that non-digestible oligosaccharides or inulin supplementation increases the fractional absorption of calcium in children and adolescents, but not in adults.
9.83 Randomised controlled trials that supplemented subjects’ diets with resistant starch indicate no effect of resistant starch on energy intake. Resistant starch supplementation (types 1, 2 and 3 analysed together) is shown to cause an increase in faecal weight, has no effect on faecal bacterial content, but modifies faecal short chain fatty acid content, with an increase in the concentration or proportion of butyrate and a lowering of pH. A limited number of trials indicate little effect of resistant starch type 4 on these faecal parameters.
9.84 The supplement doses of resistant starch, non-digestible oligosaccharide or inulin at which the effects described above become apparent is above levels currently consumed in typical diets in the UK, but recent and future developments of novel
food ingredients may substantially increase the intake of these carbohydrates. The actual intake and extent of use of these novel food ingredients is, as yet, unknown. The doses required for these effects may, depending on the specific preparation, cause adverse gastrointestinal impacts such as bloating, borborygmi and flatulence in the majority of the population (Coussement, 1999; Bishop et al., 2009; Bonnema et al., 2010). Whether these carbohydrates have an effect on health outcomes is unclear; equally the biological relevance of the effect of non-digestible oligosaccharide and inulin supplementation on calcium fractional absorption in children is unclear.
9.85 Trials provide limited evidence that intake of some polyols increases faecal weight and affects faecal bacterial content, e.g. Bifidobacteria spp.. The health impact of an effect on faecal bacteria is currently uncertain, thus, whether this observation is beneficial or biologically relevant cannot be determined. Trials also provide limited evidence that polydextrose increases faecal weight. These effects of some polyols and polydextrose are limited by the low levels of these compounds in the diet.
9.86 Randomised controlled trials conducted in infants aged less than three months tend to report that supplementation of infant formula with non-digestible oligosaccharides (mainly galacto-oligosaccharide, but also fructo-oligosaccharide) increases the faecal content of Bifidobacterium spp., lowers faecal pH and increases faecal acetate concentration, as compared with unsupplemented infant formula. These effects are less consistent in trials conducted in infants aged more than three months. It is, however, unclear what the relationship is between these faecal parameters and relevant outcomes on health.
9.87 Randomised controlled trials indicate that the use of chewing gum containing polyols reduces risk of dental caries, as compared with not using a chewing gum, but it is unclear whether it is specifically the polyols or the act of chewing and the concomitant increase in salivary flow that contributed to the effect.
166
10 Glycaemic index and glycaemic load
10.1 This assessment is based on prospective cohort studies and randomised controlled trials investigating the relationship between the glycaemic characteristics of carbohydrate intake and cardio-metabolic and colo-rectal health outcomes. Links to the individual systematic reviews and update search are given in Annex 1.
10.2 Evidence on health/disease outcomes have been discussed in detail only where there are sufficient data for a conclusion to be drawn from studies meeting the pre-agreed inclusion criteria. Outcomes where there are too few studies to reach a conclusion, are listed at the end of the chapter (see Tables 10.1 and 10.2). Outcomes where the evidence was considered too inconsistent to make a valid judgement are also listed at the end of the chapter (see Table 10.3).
10.3 Glycaemic index (GI) and glycaemic load (GL) are used as measures of the glycaemic characteristics of foods and used to estimate the glycaemic characteristics of diets, respectively (see paragraph 2.20 for a discussion of the limitations of these terms). GI is a relative measure of the capillary blood glucose response induced by a specific ingredient, food or meal, as compared with the response induced by the same amount (usually 50g) of available carbohydrate from a reference source, such as pure glucose or an alternative source (such as white bread) against which it has been calibrated (Brouns et al., 2005). The GL is the product of a specific food’s GI and its carbohydrate content (Brouns et al., 2005), therefore taking into account both the quality of the carbohydrate food/meal/ingredient and the quantity of carbohydrate in the food/meal/ingredient consumed.
10.4 For meta-analyses of prospective cohort studies the relative risks are presented for every two GI unit increment and for every 20 GL unit increase. This is equivalent to approximately one standard deviation GI and GL of the population’s intake.
10.5 In the cardio-metabolic health review, trials investigating GI and GL were combined into a single meta-analysis. Subsequently these trials have been separated into GI and GL studies and further meta-analyses have been performed. These additional analyses are included in Annex 1. The pooled estimates for the trial data in this chapter are, therefore, taken from the additional meta-analyses document rather than the cardio-metabolic health review. The difference between the studies is that the GI trials do not vary carbohydrate quantity, but change the quality of carbohydrate or other aspects of the foods to modify the GI. Trials may or may not balance diets for other aspects of composition (e.g. dietary fibre type and quantity, energy density). Foods of differing GI and carbohydrate content together are used to modify GL. Lower GL diets can be achieved by changing the carbohydrate content and type but can also be achieved by increasing the fat and/or protein content. Nearly all of the trials resulted in weight loss and consideration is given to whether an effect demonstrated could be due to greater weight loss in one of the experimental groups.
167
Glycaemic index Cardiovascular disease events
10.6 One cohort study was identified that presented evidence on GI and the incidence of cardiovascular disease (Levitan et al., 2007), which found that GI was not associated with the incidence of cardiovascular disease mortality. Five cohort studies were identified that presented evidence on GI and coronary and stroke events combined, all of which were included in a meta-analysis (van Dam et al., 2000; Oh et al., 2005; Beulens et al., 2007; Levitan et al., 2007; Kaushik et al., 2009). One cohort study was subsequently identified in the update search, which pooled four Danish cohort studies together (Grau et al., 2011) (Cardio-metabolic review, cardiovascular disease chapter; Update search).
10.7 No significant association was found between GI and incidence of cardiovascular disease events (RR=1.02, 95% CI 0.99, 1.06, for each two GI unit increase), although the result is of borderline statistical significance (p=0.07). The pooled analysis paper (Grau et al., 2011) indicates a protective association for a higher GI intake in men for both cardiovascular mortality and morbidity, but no significant association is indicated in women.
Glycaemic index (unit/day) and cardiovascular disease events
No association Limited evidence
Coronary events 10.8 Four cohort studies were identified that presented evidence on GI and coronary
event incidence, all of which were included in a meta-analysis (van Dam et al., 2000; Beulens et al., 2007; Levitan et al., 2007; Kaushik et al., 2009). Five cohort studies were subsequently identified in the update search (Levitan et al., 2010; Sieri et al., 2010; Hardy et al., 2010; Grau et al., 2011; Burger et al., 2011), one of which was a pooled analysis of four Danish cohort studies (Grau et al., 2011) (Cardio-metabolic review, cardiovascular disease chapter; Update search).
10.9 No significant association was found between GI and incidence of coronary events (RR=1.02, 95% CI 0.96, 1.08, for each two GI unit increase/day); however, one study (Levitan et al., 2007), had a strong influence on the outcome, but only presented results for myocardial infarction. Of the five studies identified in the update search, three indicate no significant association (Levitan et al., 2010; Sieri et al., 2010; Burger et al., 2011). The pooled analysis of four cohort studies indicates a protective association for a higher GI intake in men, but not women (Grau et al., 2011). The other study (Hardy et al., 2010) indicates a greater risk of coronary events in African American women with a higher GI diet.
Glycaemic index (unit/day) and coronary events
• No association • Moderate evidence
168
Stroke 10.10 Three cohort studies were identified that presented evidence on GI and fatal
and non-fatal stroke incidence, all of which were included in a meta-analysis (Oh et al., 2005; Levitan et al., 2007; Kaushik et al., 2009). Two cohort studies were subsequently identified in the update search (Oba et al., 2010; Burger et al., 2011) (Cardio-metabolic review, cardiovascular disease chapter; Update search).
10.11 No significant association was found between GI and incidence of stroke events (RR=1.01, 95% CI 0.98, 1.05, for each two GI unit increase). Of the two cohort studies identified in the update search, one indicates no significant association (Burger et al., 2011), whereas the other (Oba et al., 2010) indicates a higher GI intake is associated with a higher incidence of mortality from all stroke events in women, but not men.
Glycaemic index (unit/day) and stroke
No association Limited evidence
Blood pressure 10.12 Four randomised controlled trials were identified that presented evidence on
GI in relation to systolic blood pressure (SBP) and diastolic blood pressure (DBP), all of which were included in a meta-analysis (Bellisle et al., 2007; Abete et al., 2008; Jensen et al., 2008; Philippou et al., 2009b). Two trials were subsequently identified in the update search (Jebb et al., 2010; Gogebakan et al., 2011) (Cardio-metabolic review, incident hypertension and blood pressure chapter; Update search; Additional meta-analyses)
10.13 The meta-analysis of four trials demonstrates no significant effect of GI on SBP (-0.54 mmHg, 95% CI -4.08, 2.99; p=0.76) or DBP (0.60 mmHg, 95% CI -2.06, 3.25; p=0.66). The two trials identified in the update search (Jebb et al., 2010; Gogebakan et al., 2011) report no statistically significant effect of GI on SBP or DBP.
Glycaemic index and systolic and diastolic blood pressure
No effect Moderate evidence
169
Fasting blood lipids
Fasting total-, LDL-, HDL-cholesterol and triacylglycerol 10.14 Ten randomised controlled trials were identified that presented evidence on GI in
relation to fasting blood lipid concentration, all of which were included in a meta-analysis (Wolever & Mehling, 2003; Raatz et al., 2005; McMillan-Price et al., 2006; Bellisle et al., 2007; Sichieri et al., 2007; Abete et al., 2008; Jensen et al., 2008; Philippou et al., 2008; Philippou et al., 2009a; Philippou et al., 2009b). Two trials were subsequently identified in the update search (Jebb et al., 2010; Gogebakan et al., 2011). The majority of these studies were weight loss trials (Cardio-metabolic
review, hyperlipidaemias and blood lipids chapter; Update search; Additional meta-analyses).
10.15 An effect of a higher GI diet is demonstrated resulting in less of a reduction in fasting total cholesterol concentration (0.20mmol/L, 95% CI 0.08, 0.33; p=0.002) and fasting LDL-cholesterol concentration (0.21mmol/L, 95% CI 0.10, 0.32; p<0.001) as compared with a lower GI diet. No significant effect of GI is demonstrated on fasting HDL-cholesterol concentration (0.01mmol/L, 95% CI -0.05, 0.06; p=0.81) or fasting triacylglycerol concentration (-0.04mmol/L, 95% CI -0.17, 0.10; p=0.59). The trials identified in the update search report no statistically significant effect of GI on fasting blood lipid concentrations.
10.16 Body weight may confound the effect of GI on blood lipids as weight loss was generally less in the higher GI diet experimental groups (the result of the meta-analysis above is almost significant, p=0.069; Annex 1 additional meta-analyses) compared to the lower GI diet groups. Fasting blood lipid concentrations are modified by body weight change (Poobalan et al., 2004; Te Morenga et al., 2010; Dow et al., 2013) therefore any differences may not be attributable to the carbohydrate component of the dietary intervention.
Glycaemic index and fasting total cholesterol concentration
• Effect • Moderate evidence • A higher GI diet may result in less of a reduction in fasting total cholesterol concentration as compared with a lower GI diet, but it is not possible to exclude confounding by other variables • The effect is biologically relevant
Glycaemic index and fasting LDL-cholesterol concentration
• Effect • Moderate evidence • A higher GI diet may result in less of a reduction in fasting LDL-cholesterol concentration as compared with a lower GI diet, but it is not possible to exclude confounding by other variables The effect is biologically relevant
Glycaemic index (unit/day) and fasting HDL-cholesterol and triacylglycerol concentration
No effect Moderate evidence
170
Fasting total cholesterol:HDL-cholesterol ratio 10.17 Four randomised controlled trials were identified that presented evidence on
GI in relation to the fasting total cholesterol:HDL-cholesterol ratio, all of which were included in a meta-analysis (McMillan-Price et al., 2006; Bellisle et al., 2007; Philippou et al., 2008; Philippou et al., 2009b) (Cardio-metabolic review, hyperlipidaemias and blood lipids review; Additional meta-analyses).
10.18 No significant effect of GI is demonstrated on fasting total cholesterol:HDL-cholesterol ratio (0.01, 95% CI -0.20, 0.21; p=0.95).
Glycaemic index and fasting total cholesterol:HDL-cholesterol ratio
• No effect • Moderate evidence
Fasting non-esterified fatty acids 10.19 Three randomised controlled trials were identified that presented evidence on
GI in relation to fasting non-esterified fatty acid concentration, all of which were included in a meta-analysis (Wolever & Mehling, 2002; McMillan-Price et al., 2006; Jensen et al., 2008) (Cardio-metabolic review, hyperlipidaemias and blood lipids chapter; Additional meta-analyses).
10.20 No significant effect of GI is demonstrated on fasting non-esterified fatty acid concentration (0.01 mmol/L, 95% CI -0.05, 0.08; p=0.74).
Glycaemic index and fasting non-esterified fatty acid concentration
No effect Limited evidence
Markers of inflammation (C-reactive protein) 10.21 One randomised controlled trial was identified that presented evidence on GI
in relation to C-reactive protein concentration (McMillan-Price et al., 2006). Two trials were subsequently identified in the update search (Jebb et al., 2010; Gogebakan et al., 2011) (Cardio-metabolic review, markers of inflammation chapter; Update search).
10.22 None of the trials report a significant effect of GI on C-reactive protein concentration.
Glycaemic index and C-reactive protein concentration
No effect Limited evidence
171
Eating motivation 10.23 Seven randomised controlled trials were identified that presented evidence on GI
in relation to subjective reports of appetite in adults (Herrmann et al., 2001; Sloth et al., 2004; Alfenas & Mattes, 2005; Bellisle et al., 2007; de Rougemont et al., 2007; Sichieri et al., 2007; Philippou et al., 2009b) (Cardio-metabolic review, energy intake and eating motivation chapter).
10.24 Due to variation between trials in design, the method of assessing eating motivation and the nature of each intervention, it was not possible to combine these trials in a meta-analysis. One trial reports higher intensity of hunger and desire to eat in the higher GI diet group (Bellisle et al., 2007), but all other trials report no significant effect of dietary GI on subjective ratings of appetite.
Glycaemic index and eating motivation
• No effect • Moderate evidence
172
Type 2 diabetes mellitus 10.25 Twelve cohort studies were identified that presented evidence on GI and type
2 diabetes mellitus incidence (Salmeron et al., 1997a; Salmeron et al., 1997b; Meyer et al., 2000; Stevens et al., 2002; Hodge et al., 2004; Schulze et al., 2004a; Schulz et al., 2006; Villegas et al., 2007; Krishnan et al., 2007; Barclay et al., 2007; Mosdol et al., 2007; Sahyoun et al., 2008). Four cohort studies were subsequently identified in the update search (Sluijs et al., 2010; Mekary et al., 2011; Simila et al., 2011; Sakurai et al., 2012), one of which (Mekary et al., 2011) was a later follow-up of the Nurses’ Health Study cohort identified in the initial search (Salmeron et al., 1997b) (Cardio-metabolic review, diabetes chapter; Update search). An updated meta-analysis was performed by the same research group that conducted the cardio-metabolic health review (Greenwood et al., 2013), which included all identified studies and one additional study (van Woudenbergh et al., 2011) and excluded the earlier follow-up of the Nurses’ Health Study cohort (Salmeron et al., 1997b). The results of this further analysis are given below.
10.26 An association was found between a higher GI and a higher incidence of type 2 diabetes mellitus incidence (RR 1.03, 95% CI 1.01, 1.06 for each two GI unit increase/ day; p=0.01).
Glycaemic index (unit/day) and type 2 diabetes mellitus
• Association • Adequate evidence • The direction of the association indicates consumption of a higher GI diet is detrimental to health The association is biologically relevant
Fasting blood glucose 10.27 Ten randomised controlled trials were identified that presented evidence on GI
in relation to fasting blood glucose concentration, all of which were included in a meta-analysis (Wolever & Mehling, 2003; Raatz et al., 2005; McMillan-Price et al., 2006; Bellisle et al., 2007; Sichieri et al., 2007; Jensen et al., 2008; Philippou et al., 2008; Abete et al., 2008; Philippou et al., 2009a; Philippou et al., 2009b). Two trials were subsequently identified in the update search (Gogebakan et al., 2011; Krog-Mikkelsen et al., 2011) (Cardio-metabolic review, diabetes and glycaemia chapter; Update search; additional meta-analyses).
10.28 No significant effect of GI is demonstrated on fasting blood glucose concentration (-0.01 mmol/L, 95% CI -0.09, 0.07; p=0.85). Of the trials identified in the update search, one reports no significant effect of GI on fasting blood glucose concentration (Gogebakan et al., 2011), while the other (Krog-Mikkelsen et al., 2011) reports fasting blood glucose concentration to be lower in the higher GI diet group.
Glycaemic index (unit/day) and fasting blood glucose concentration
• No effect • Moderate evidence
Fasting insulin 10.29 Nine randomised controlled trials were identified that presented evidence on GI
in relation to fasting insulin concentration (Wolever & Mehling, 2003; Raatz et al., 2005; McMillan-Price et al., 2006; Bellisle et al., 2007; Sichieri et al., 2007; Abete et al., 2008; Jensen et al., 2008; Philippou et al., 2009a; Philippou et al., 2009b). Two trials were subsequently identified in the update search (Gogebakan et al., 2011; Krog-Mikkelsen et al., 2011) (Cardio-metabolic review, diabetes chapter; Update search).
10.30 Due to variation between trials in the method used to measure fasting insulin concentration, it is not possible to combine these trials using meta-analysis. The trials provide no consistent evidence of an effect of GI on fasting insulin concentration. Both trials identified in the update search report no significant effect of GI on fasting insulin concentration.
Glycaemic index and fasting insulin concentration
• No effect • Moderate evidence
173
Insulin sensitivity/resistance 10.31 Seven randomised controlled trials were identified that presented evidence
on GI in relation to insulin sensitivity/resistance (Sloth et al., 2004; Raatz et al., 2005; McMillan-Price et al., 2006; Bellisle et al., 2007; Sichieri et al., 2007; Abete et al., 2008; Philippou et al., 2009b). Two trials were subsequently identified in the update search (Jebb et al., 2010; Krog-Mikkelsen et al., 2011) (Cardio-metabolic review, diabetes chapter; Update search).
10.32 Due to variation between trials in the method used to measure insulin sensitivity/ resistance, it is not possible to combine these trials using meta-analysis. All the trials provide no evidence of an effect of GI on insulin sensitivity/resistance. Both trials identified in the update search report no significant effect of GI on insulin sensitivity/resistance.
Glycaemic index and insulin sensitivity/resistance
• No effect • Moderate evidence
Colo-rectal cancer 10.33 Seven cohort studies were identified that presented evidence on GI and colo-rectal
cancer incidence, all of which were included in the meta-analysis (Higginbotham et al., 2004; Michaud et al., 2005; McCarl et al., 2006; Larsson et al., 2007; Strayer et al., 2007; Weijenberg et al., 2008; George et al., 2009). One cohort study was
identified in the update search (Li et al., 2011) (Colo-rectal health review; Update search).
10.34 No significant association was found between GI and incidence of colo-rectal cancer (RR 1.01, 95% CI 0.99, 1.03, for each two GI unit increase). The study identified in the update search (Li et al., 2011) observed no significant association between GI and risk of colo-rectal cancer in women.
Glycaemic index (unit/day) and colo-rectal cancer
No association Adequate evidence
Glycaemic load Cardiovascular disease events
10.35 One cohort study was identified that presented evidence on GL and the incidence of cardiovascular disease (Levitan et al., 2007), which found GL was not associated with the incidence of all cardiovascular disease mortality. Three cohort studies were identified that presented evidence on GL and the incidence of coronary and stroke events combined, all of which were included in a meta-analysis (Oh et al., 2005; Levitan et al., 2007; Beulens et al., 2007). One cohort study was subsequently identified in the update search, which pooled four Danish cohort studies (Grau et al., 2011) (Cardio-metabolic review, cardiovascular disease chapter; Update search).
10.36 An association was found between a higher GL and a higher incidence of coronary events and strokes combined (RR 1.06, 95% CI 1.01, 1.12, for each 20 GL unit increase; p=0.03). The pooled analysis study identified in the update search found no significant association between GL and cardiovascular disease in men, but found an association with higher incidence of cardiovascular disease morbidity, but not mortality, in women (Grau et al., 2011).
Glycaemic load (unit/day) and cardiovascular disease events
Association Limited evidence The direction of the association indicates consumption of a higher GL diet is detrimental to health The association is biologically relevant
174
Blood pressure 10.37 Three randomised controlled trials were identified that presented evidence on
GL in relation to systolic blood pressure and diastolic blood pressure, all of which were included in a meta-analysis (Pereira et al., 2004; Ebbeling et al., 2005; Maki et al., 2007). All trials were weight loss trials. No trials were identified in the update search (Cardio-metabolic review, incident hypertension and blood pressure chapter; Additional meta-analyses).
10.38 No significant effect is demonstrated for GL on systolic blood pressure (1.92 mmHg, 95% CI -0.76, 4.60; p=0.16), but an effect is demonstrated for a higher GL diet resulting in less of a reduction in diastolic blood pressure as compared with a lower GL diet (3.10 mmHg, 95% CI 0.25, 5.95; p=0.03).
Glycaemic load (unit/day) and systolic blood pressure
• No effect • Limited evidence
Glycaemic load (unit/day) and diastolic blood pressure
• Effect • Limited evidence • A higher GL diet may result in less of a reduction in diastolic blood pressure as compared with a lower GL diet, but it is not possible to exclude confounding by other dietary variables The effect is biologically relevant
Fasting blood lipids
Fasting total-, LDL-, HDL-cholesterol and triacylglycerol 10.39 Five randomised controlled trials were identified that presented evidence on GL in
relation to fasting blood lipid concentration and were included in a meta-analysis (Pereira et al., 2004; Ebbeling et al., 2005; Das et al., 2007; Ebbeling et al., 2007; Maki et al., 2007). All five trials presented evidence on GL in relation to fasting LDL-cholesterol and triacylglycerol concentration, while three trials (Ebbeling et al., 2005; Das et al., 2007; Maki et al., 2007) presented evidence on GL in relation to fasting total cholesterol concentration. No further trials were identified in the update search (Cardio-metabolic review, hyperlipidaemias and blood lipids chapter, p448-476; Additional meta-analyses).
10.40 No significant effect of GL is demonstrated on fasting total cholesterol concentration (-0.01 mmol/L, 95% CI -0.14, 0.13; p=0.94) and fasting LDL-cholesterol concentration (0.07 mmol/L, 95% CI -0.05, 0.19; p=0.29). The heterogeneity was above the pre-specified cut-off of 75% and, therefore, the pooled estimate has not been reported but the trials present no evidence for an effect on HDL-cholesterol. An effect of a higher GL diet is demonstrated resulting in less of a reduction in fasting triacylglycerol concentration (0.13 mmol/L, 95% CI 0.03, 0.24; p=0.012) as compared with the lower GL diet.
Glycaemic load and fasting total cholesterol, LDL-cholesterol and HDL-cholesterol concentration
• No effect • Limited evidence
175
Glycaemic load and fasting triacylglycerol concentration
• Effect • Limited evidence • A higher GL diet may result in less of a reduction in fasting triacylglycerol concentration than a lower GL diet, but it is not possible to exclude confounding by other dietary variables The effect is borderline biologically relevant
Markers of inflammation (C-reactive protein) 10.41 Two randomised controlled trials were identified that presented evidence on GL in
relation to C-reactive protein concentration (Pereira et al., 2004; Pittas et al., 2006). No further trials were identified in the update search (Cardio-metabolic review, markers of inflammation chapter; Update search).
10.42 One trial reports higher C-reactive protein concentration in the higher GL diet group (Pittas et al., 2006), but the other trial reports no significant effect (Pereira et al., 2004).
Glycaemic load and C-reactive protein concentration
• No effect • Limited evidence
Body weight change 10.43 Three randomised controlled trials were identified that presented evidence on GL
in relation to body weight change (Ebbeling et al., 2005; Das et al., 2007; Ebbeling et al., 2007). One trial could not be included in a meta-analysis as it did not report the necessary data, leaving an insufficient number of trials to enable a meta-analysis to be performed (Cardio-metabolic review, obesity chapter).
10.44 None of the trials report an effect of GL on body weight change.
Glycaemic load and body weight change
No effect Limited evidence
Type 2 diabetes mellitus 10.45 Eleven cohort studies were identified that presented evidence on GL and type
2 diabetes mellitus incidence, all of which were included in the meta-analysis (Salmeron et al., 1997a; Salmeron et al., 1997b; Meyer et al., 2000; Stevens et al., 2002; Hodge et al., 2004; Schulze et al., 2004a; Schulz et al., 2006; Villegas et al., 2007; Krishnan et al., 2007; Mosdol et al., 2007; Sahyoun et al., 2008). Six cohort studies were subsequently identified in the update search (Hopping et al., 2010; Sluijs et al., 2010; Mekary et al., 2011; Yu et al., 2011; Simila et al., 2011; Sakurai et al., 2012), one of which (Mekary et al., 2011) was a later follow-up of the Nurses’ Health Study cohort identified in the initial search (Salmeron et al., 1997b) (Cardio-metabolic review, diabetes chapter; Update search). An updated meta-analysis was performed by the same research group that conducted the cardio-metabolic
176
health review (Greenwood et al., 2013), which included the studies found in the update search as well as a later study (van Woudenbergh et al., 2011) and excluded the earlier follow-up of the Nurses’ Health Study cohort (Salmeron et al., 1997b). The results from the later meta-analysis are presented below and were used to inform this report.
10.46 An association was found between a higher GL and a higher incidence of type 2 diabetes mellitus (RR 1.03, 95% CI 1.00, 1.05, for each 20 GL unit increase; p=0.02). Another meta-analysis also indicates a diet higher in glycaemic load is associated with a greater risk of type 2 diabetes mellitus (Livesey et al., 2013).
Glycaemic load (units/day) and type 2 diabetes mellitus
• Association • Adequate evidence • The direction of the association indicates higher GL is detrimental to health, but it is not possible to exclude confounding by other variables The association is biologically relevant
Fasting blood glucose 10.47 Three randomised controlled trials were identified that presented evidence on GL
in relation to fasting blood glucose concentration, all of which were included in a meta-analysis (Maki et al., 2007; Ebbeling et al., 2007; Das et al., 2007). No further trials were identified in the update search (Cardio-metabolic review, diabetes chapter; Update search; Additional meta-analyses).
10.48 No significant effect of GL is demonstrated on fasting blood glucose concentration (-0.13 mmol/L, 95% CI -0.40, 0.13; p=0.33).
Glycaemic load (units/day) and fasting blood glucose concentration
• No effect • Limited evidence
Fasting insulin 10.49 Three randomised controlled trials were identified that presented evidence on GL
in relation to fasting insulin concentration (Maki et al., 2007; Ebbeling et al., 2007; Das et al., 2007). No further trials were identified in the update search (Cardio-metabolic review, diabetes chapter).
10.50 Due to variation between trials in the method used to measure fasting insulin concentration, it is not possible to combine these trials using meta-analysis. The trials provide no evidence of an effect of GL on fasting insulin concentration.
Glycaemic load and fasting insulin concentration
• No effect • Limited evidence
177
Insulin sensitivity/resistance 10.51 Four randomised controlled trials were identified that presented evidence on GL
in relation to insulin sensitivity/resistance (Pereira et al., 2004; Ebbeling et al., 2005; Pittas et al., 2006; Maki et al., 2007). No further trials were identified in the update search (Cardio-metabolic review, diabetes chapter).
10.52 Due to variation between trials in the method used to measure insulin sensitivity/ resistance, it is not possible to combine these trials using meta-analysis. One trial reports an effect of GL on insulin sensitivity/resistance (Pereira et al., 2004), but the other trials provide no evidence of an effect of GL on insulin sensitivity/resistance.
Glycaemic load and insulin sensitivity/ resistance
• No effect • Limited evidence
Colo-rectal cancer 10.53 Nine cohort studies investigating GL were identified which provided data on
diets with a higher or lower GL and their relationship to the incidence of colo-rectal cancer, all of which were included in the meta-analysis (Terry et al., 2003; Higginbotham et al., 2004; Michaud et al., 2005; McCarl et al., 2006; Larsson et al., 2007; Strayer et al., 2007; Howarth et al., 2008; Weijenberg et al., 2008; George et al., 2009). One cohort study was identified in the update search (Li et al., 2011) (Colo-rectal health review; Update search).
10.54 No significant association was found between GL and incidence of colo-rectal cancer (RR 1.00, 95% CI 0.97, 1.03, for each 20 GL unit increase).
Glycaemic load (unit/day) and colo-rectal cancer
No association Adequate evidence
178
Outcomes where there is insufficient or inconsistent evidence15
10.55 The tables below detail the exposures and outcomes where there are two or fewer studies that meet the inclusion criteria for the review (e.g. by study duration, publication date, health of subjects, design of intervention), or where the studies are too inconsistent, to draw a conclusion as per the grading system in Annex 2. A full description of the studies can be found in the relevant systematic reviews.
15 See Annex 2 paragraph A2.21 for criteria.
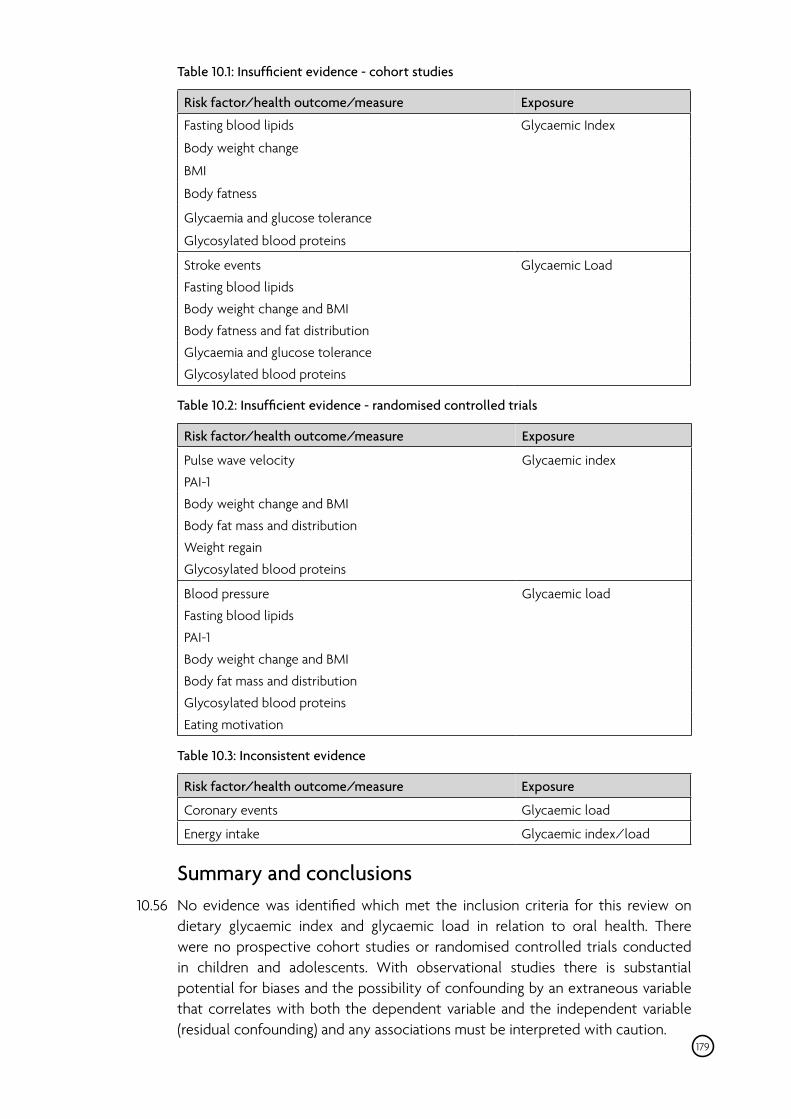
Table 10.1: Insufficient evidence - cohort studies
Risk factor/health outcome/measure Exposure
Fasting blood lipids Glycaemic Index
Body weight change
BMI
Body fatness
Glycaemia and glucose tolerance
Glycosylated blood proteins
Stroke events Glycaemic Load
Fasting blood lipids
Body weight change and BMI
Body fatness and fat distribution
Glycaemia and glucose tolerance
Glycosylated blood proteins
Table 10.2: Insufficient evidence - randomised controlled trials
Risk factor/health outcome/measure Exposure
Pulse wave velocity Glycaemic index
PAI-1
Body weight change and BMI
Body fat mass and distribution
Weight regain
Glycosylated blood proteins
Blood pressure Glycaemic load
Fasting blood lipids
PAI-1
Body weight change and BMI
Body fat mass and distribution
Glycosylated blood proteins
Eating motivation
Table 10.3: Inconsistent evidence
Risk factor/health outcome/measure Exposure
Coronary events Glycaemic load
Energy intake Glycaemic index/load
Summary and conclusions 10.56 No evidence was identified which met the inclusion criteria for this review on
dietary glycaemic index and glycaemic load in relation to oral health. There were no prospective cohort studies or randomised controlled trials conducted in children and adolescents. With observational studies there is substantial potential for biases and the possibility of confounding by an extraneous variable that correlates with both the dependent variable and the independent variable (residual confounding) and any associations must be interpreted with caution.
179
10.57 Glycaemic index is a measure of the blood glucose response to a portion of a food containing a fixed quantity of available carbohydrates; whereas the GL takes into account both the GI and the amount of carbohydrate in a given food. There are, however, many influences on glycaemic index and glycaemic load over and above the content and quality of carbohydrates in a food, both physiological and dietary, not all of which are understood. Higher and lower GI/GL diets will, in most cases, differ in many ways other than the carbohydrate fraction therefore the majority of the literature on GI and GL does not allow for certainty that the carbohydrate content of an exposure is the sole influence on the GI or GL of a diet. Consequently, the effects and associations on health described in the meta-analyses cannot be specifically attributed to the GI or GL and may be a result of other associated factors such as dietary fibre, protein or fat content, as well as cooking methods, food processing, and storage (Brouns et al., 2005; Venn & Green, 2007).
10.58 The evidence provided by prospective cohort studies indicates that a diet higher in glycaemic index or load is associated with a greater risk of type 2 diabetes mellitus. There is no evidence from prospective cohort studies to suggest an association between glycaemic index and cardiovascular disease or coronary heart disease. Higher glycaemic load is associated with a greater risk of cardiovascular diseases, but the evidence is limited due to the small number of studies. There is no evidence for an association between glycaemic index or load and colo-rectal cancer incidence.
10.59 The evidence provided by randomised controlled trials is limited due to the design of the trials mainly being weight loss trials. Collectively these trials found that a higher glycaemic index diet results in less of a reduction in fasting blood total cholesterol and LDL-cholesterol concentrations as compared with a lower glycaemic index diet. However, this finding could also be due to less weight loss occurring in the higher glycaemic index diet group as compared with the lower glycaemic index diet group. No effect of GL was observed on body weight change as an outcome but this could be due to the small number of studies identified that met the 12 month inclusion criterion. A higher glycaemic load diet results in less reduction in diastolic blood pressure and fasting triacylglycerol concentration as compared with a lower glycaemic load diet, but this is based only on three trials and it is not possible to exclude confounding by other dietary variables, although difference in weight loss between experimental groups appears not to be a factor in these trials. The interventions in trials investigating glycaemic index and glycaemic load in relation to cardio-metabolic risk factors include other factors (see paragraph 2.20) meaning that a cause and effect relationship cannot be established.
180
11 Dietary recommendations
11.1 The proposed carbohydrate dietary recommendations are for adults and children aged 2 years or more and have been made in the context of an energy intake that is appropriate to maintain a healthy weight (SACN, 2011).
11.2 It was agreed that the dietary recommendations for total carbohydrate and sugars should be expressed in relation to total dietary energy.
Total carbohydrate 11.3 The carbohydrate dietary reference value was previously set on the basis that
total fat should contribute about 35% of total dietary energy with protein intake comprising 15% (COMA, 1994). At that time it was recommended that ‘complex carbohydrates’ and sugars in fruits and vegetables should replace some dietary fat, to achieve approximately 50% the proportion of total dietary energy derived from total carbohydrates (COMA, 1994).
11.4 Concern has been raised that high intakes of total carbohydrate may be deleterious to health, but this report concludes that total carbohydrate intakes, at levels generally recommended in the UK diet, are not associated with the health outcomes examined. Specifically, total carbohydrate intake shows no association with the incidence of cardiovascular disease endpoints, type 2 diabetes mellitus, glycaemia or colo-rectal cancer. In children and adolescents, limited evidence indicates that there is no association between total carbohydrate intake and body mass index or body fatness. Overall, there is no evidence to warrant a change to the total carbohydrate dietary reference value previously set by COMA of approximately 50% total dietary energy.16
11.5 It is recommended that:
• The dietary reference value for total carbohydrate should be maintained at a population average of approximately 50% of total dietary energy.17
Sugars 11.6 The previous dietary reference value referred to non-milk extrinsic sugars, and
recommended that the population average should be no more than 10% of total dietary energy (COMA, 1991). This dietary reference value was based on the observation that dental caries was rare in populations whose intakes were estimated to be approximately 10% of total dietary energy (based on national sugar supply data from food balance sheets and household consumption data). It was also advised that intakes that exceed 30% of total dietary energy should
16 The previous recommendation for total carbohydrate was 47% of daily total dietary energy intake or 50% of food energy (excluding alcohol) (COMA, 1991).
17 It is recognised that many individuals will derive some energy from alcohol. 181
be avoided as they may lead to an increase in plasma concentrations of glucose, insulin and lipids.
11.7 There are several definitions of sugars in current use internationally. The present UK term of ‘non-milk extrinsic sugars’, which is used in national surveys, encompasses sugars in unsweetened fruit juice and honey, as well as sugars that are added to food and drink. It also includes 50% of the weight of sugars found in dried, stewed or canned fruit. The 50% figure is arbitrary and is used to account for the partial breakdown of the cellular structure during processing (Buss et al., 1994; Bates et al., 2012), but proves problematic when trying to estimate the sugars composition of certain foods. The term ‘added sugars’ as used by the European Food Safety Authority and US Institute of Medicine includes sugars that are added to foods either during manufacture or by the consumer, but does not capture the sugars present in unsweetened fruit juice or honey. The definition of ‘free sugars’, as used by the World Health Organization, captures all sugars added to foods and those present in fruit juice and honey but does not apply the figure of 50% of sugars in dried and cooked fruit. Therefore, the definition of free sugars is similar to non-milk extrinsic sugars but overcomes the problem of trying to account for the additional sugars from processed fruit. In addition, the term non-milk extrinsic sugars is used exclusively by the UK and does not lend itself to being easily understood compared to the term free sugars or added sugars.
11.8 In light of the issues above, it is proposed that the UK adopts the definition of ‘free sugars’ in place of ‘non-milk extrinsic sugars’. Free sugars are defined as all monosaccharides and disaccharides added to foods by the manufacturer, cook or consumer, plus sugars naturally present in honey, syrups and unsweetened fruit juices. Under this definition, lactose naturally present in milk and milk products and sugars contained within the cellular structure of foods would be excluded. In this report the term “sugars” is used because this enables other sugars (e.g. glucose, fructose, lactose) to be included in addition to sucrose. This is important because it will ensure that any replacement of sucrose by high fructose corn syrups (an example of a number of different predominantly ‘free’ fructose and glucose mixes with variable but most often 40-60% fructose content) in the production of food and drinks is captured.
11.9 Since the dietary reference values were last considered, the level of evidence indicating that a high intake of free sugars is detrimental to several health outcomes has strengthened. Higher consumption of sugars, and sugars-containing foods and beverages, is associated with greater risk of dental caries. Randomised controlled trials conducted in adults indicate that increasing or decreasing the percentage of total dietary energy as sugars when consuming an ad libitum diet, either through the substitution of other macronutrient components or by replacing sugars with non-caloric sweeteners, leads to a corresponding increase or decrease in energy intake. Consumption of sugars-sweetened beverages is associated with a greater risk of type 2 diabetes mellitus. Randomised controlled trials conducted in children and adolescents indicate that consumption of sugars-sweetened beverages, as compared with non-calorically sweetened beverages, results in greater weight gain and increases in body mass index; this finding suggests that there is inadequate
182
energy compensation (degree of voluntary reduction in intake of other foods or drinks), for energy delivered as sugar.
11.10 The intakes of sugars at the end of the intervention period in trials investigating energy intakes ranged from 4-32% of energy (see paragraphs 6.18 to 6.22). To investigate the relationship between sugar and energy intake further, a meta-regression was conducted, but this found no statistically significant linear dose response relationship between sugars consumption and energy intake (60kJ, 95% CI -0.005 125kJ, change in total dietary energy intake per one percentage change in energy from sugars; p=0.066) (see Figure A9.3 Annex 9). Therefore the precise nature of this relationship remains unknown.
11.11 To quantify the dietary recommendation for sugars, advice from the Calorie Reduction Expert Group was considered. It was estimated that a 418 kJ/person/ day (100kcal/person/day) reduction in energy intake of the population would address energy imbalance and lead to a moderate degree of weight loss in the majority of individuals (Calorie Reduction Expert Group, 2011). The pooled estimate effect size of 1.01 MJ/day, taken from the updated meta-analysis of trials on sugars and energy intake (see Figure A9.2, Annex 9), was divided by the median between treatment difference in sugars intake of 12.9% (of energy), which results in a 0.078 MJ (78 kJ)/day change in energy intake for each 1 unit change in percentage energy from sugars. To achieve an average reduction in energy intakes of 418 kJ (100kcal/person/day) using this estimated effect size, intake of free sugars would need to be reduced by approximately 5% of total dietary energy (418kJ/78kJ= 5.4). The findings of the trials discussed in paragraphs 6.18-6.21 suggest that there is inadequate energy compensation (degree of voluntary reduction in intake of other foods or drinks), for energy delivered as sugar. The actual, sustained effect size in populations may differ from that observed in these trials, and, therefore, the estimated figure of 5% should be treated with some caution. Nonetheless these calculations provide a useful guide on which to make an informed judgement on the evidence. A 5 percentage point reduction in energy from the current dietary recommendation for sugars would mean that the population average of free sugars should not exceed 5% of total dietary energy.
11.12 Although the dietary recommendation for free sugars has been derived from calculations assuming that the whole calorie reduction would come from the effects of reduced sugars intakes, it is acknowledged that in reality this would not be the case. High intakes of other macronutrients should probably also be lowered in order for the population’s total dietary energy intake to be reduced. However, lowering sugar intakes provides one approach to lowering the average total dietary energy intake of the population.
11.13 Given the high rates of obesity in the UK, reducing the population’s energy intakes is likely to be beneficial to health. Obesity occurs when energy intake from food and drink consumption is greater than energy expended over a prolonged period. In the UK, the prevalence of obesity increased sharply during the 1990s and early 2000s. For example in England, the proportion of adults who were categorised as obese (BMI 30kg/m2 or over) increased from 13.2% of men in 1993 to 24.4% in
183
2012 and from 16.4% of women in 1993 to 25.1% in 2012 (Health and Social Care Information Centre, 2013a). In addition in England, 9.7% of boys and 8.8% of girls (all children 9.3%) aged 4.0-5.0 years and 20.4% of boys and 17.4% of girls (all children 18.9%) aged 10.0-11.0 years were also classified as obese, according to the British 1990 population monitoring definition of obesity (≥95th centile) (Health and Social Care Information Centre, 2013b). Higher rates of obesity were observed in children living in more deprived areas compared to those living in the least deprived. Obesity is associated with greater risks of type 2 diabetes mellitus, hypertension, coronary artery disease and hyperlipidaemia as well as some types of cancer and other diseases (Foresight, 2007). Since free sugars intake is a dietary factor shown to increase energy intake, decreasing the population intake of free sugars is one step that could be taken to help reduce the current UK overconsumption of energy.
11.14 Reducing consumption of free sugars would also help to lower the risk of dental caries which continues to be a widespread problem in the UK. From the Adult Dental Health Survey, it was found that 31% of adults in England, Wales and Northern Ireland experienced dental caries in either the crown or root of the tooth (Steele & O’Sullivan, 2011). In 2012 almost a third (27.9%) of 5 year olds in England had tooth decay (Public Health England, 2013). There are also stark inequalities across the regions for example, 21.2% of five-year olds had tooth decay in South East England compared to 34.8% in the North West of England with even greater inequalities within local authority areas. In the Children’s Dental Health Survey, 57% of eight year olds had some kind of dental caries in their primary dentition. In terms of permanent dentition, 14%, 34% and 49% of 8, 12 and 15 year olds had obvious dental caries (Lader et al., 2003).
11.15 In 2013, the prevalence of diabetes mellitus was 6% of the adult population. It is estimated that 90% of these cases are type 2 diabetes mellitus (Diabetes UK, 2014). Given that the evidence in this report found that sugars-sweetened beverages are associated with a higher risk of type 2 diabetes mellitus and that obesity is also linked with this outcome, lowering sugars intake may confer additional health benefits.
11.16 It is recommended that:
• The definition for ‘free sugars’ be adopted in the UK and that this comprises all monosaccharides and disaccharides added to foods by the manufacturer, cook or consumer, plus sugars naturally present in honey, syrups and unsweetened fruit juices. Under this definition, lactose naturally present in milk and milk products and sugars contained within the cellular structure of foods would be excluded.
• The population average intake of free sugars should not exceed 5% of total dietary energy for age groups from 2 years upwards.
• The consumption of sugars-sweetened beverages should be minimised, in both children and adults.
184
Dietary fibre 11.17 In 1991 COMA set a dietary reference value for fibre, defined as non-starch
polysaccharides, that recommended the population average intake should be 18g/day, with a minimum of 12 g/day and a maximum of 24 g/day for individuals (COMA, 1991). Non-starch polysaccharides are determined using the Englyst method of analysis (Englyst et al., 1994). Guidance on high intakes of non-starch polysaccharides stated that there was a lack of evidence of benefit associated with intakes in excess of 32g/day. It was noted that such intakes were not seen in self-selected diets and potentially undesirable effects could not be excluded. The dietary reference value was based on the effect of non-starch polysaccharide on increasing faecal weight and the observation that a lower incidence of bowel disease was observed in populations with higher faecal weights.
11.18 For this report, it was agreed that components would be considered in the context of SACN’s position statement on dietary fibre. This states that for extracted natural carbohydrate components or synthetic carbohydrate products to be defined as dietary fibre, beneficial physiological effects, similar to those demonstrated for the naturally integrated dietary fibre component of foods, must be demonstrated by accepted scientific evidence. Such effects include increasing stool bulk, decreasing intestinal transit time and constipation or the lowering of total cholesterol and LDL-cholesterol concentration (SACN, 2008). However, evidence limited only to effects on gut fermentation or the nature of the microbiota is not sufficient to satisfy this definition. In this report, there is evidence to show that non-digestible oligosaccharides, resistant starch and polydextrose increase faecal mass. On this basis, SACN consider that these three components can be considered as dietary fibre. With the inclusion of non-digestible oligosaccharides, resistant starch and polydextrose this broadens the definition of fibre beyond non-starch polysaccharides. Therefore it is recommended that dietary fibre should be defined as all carbohydrates that are neither digested nor absorbed in the small intestine and have a degree of polymerisation of three or more monomeric units, plus lignin.
11.19 The majority of the evidence on fibre and health considered in this report uses the AOAC definition of fibre therefore broadening the definition allows the UK to be aligned with the research base and permits intakes to be directly compared with different countries.
11.20 The broader definition of fibre is measured by AOAC methods and is colloquially known as AOAC fibre. There are different AOAC methods available; the older methods (AOAC 985.29 and 991.43) capture non-starch polysaccharides, some resistant starches, lignin and some inulin, but they do not measure most non-digestible oligosaccharides (Prosky et al., 1988; Lee et al., 1992). It is these methods which have been used in the studies included in this report. A newer method of analysis is now available (AOAC 2009.01) which is able to determine all the components included in the proposed definition of fibre above (McCleary et al., 2010; McCleary et al., 2012).
185
11.21 Since the dietary reference values were last considered, the quality of the evidence indicating that a diet rich in dietary fibre (mostly defined as AOAC fibre) reduces the risk of type 2 diabetes mellitus, cardiovascular disease and colo-rectal cancer has strengthened considerably. Despite inconsistency between studies in the definitions of whole grains, greater consumption of whole grains is associated with a lower incidence of cardiovascular disease, hypertension, type 2 diabetes mellitus and colon cancer.
11.22 Cardiovascular disease, type 2 diabetes mellitus and colo-rectal cancer are of great public health significance in the UK. It is estimated that in 2010, 10.1% of women and 11.7% of men were suffering from cardiovascular disease (coronary heart disease and stroke combined) (British Heart Foundation, 2012) . The prevalence of type 2 diabetes is given in paragraph 11.15. There were approximately 41,600 new cases of colo-rectal cancer diagnosed in the UK in 2011 and it is the third most common cancer in both men and women (Cancer Research UK, 2014a). For deriving the dietary reference value for dietary fibre, non-linear dose-response plots included in meta-analyses of prospective cohort studies investigating cardiovascular disease, coronary heart disease, stroke, type 2 diabetes mellitus and colo-rectal cancer were considered (Figures 11.1-11.5) (Aune et al., 2011; Threapleton et al., 2013b; Threapleton et al., 2013c; Threapleton et al., 2013d). The plots indicate that a non-linear dose-response relationship exists such that as dietary fibre intake increases, the risk of developing these diseases decreases. From these data, it is apparent that intakes of 30g/day and above (as defined using the AOAC methods 985.29 and 991.43) are associated with the greatest health benefits in reducing the incidence of cardiovascular diseases, type 2 diabetes mellitus and colo-rectal cancer. The confidence intervals widen at intakes of 30g/day or more and the health risks are lower at 30g/day than at lower levels of intake. Therefore, it is agreed that the dietary reference value for fibre is set at 30g per day as this is the amount which was shown in the evidence reviewed to be associated most consistently with reduced risk of disease compared to lower intakes. This value was also agreed because the confidence intervals at intakes above 30g/day become much wider and, therefore, there was less certainty about the accuracy of precise values beyond this point.
11.23 The dietary reference value is based on evidence in which the consumption of a variety of foods rich in dietary fibre as a naturally integrated component is associated with beneficial health outcomes. A diet rich in these foods will also usually be rich in micronutrients and phytochemicals that may have additional health benefits.
11.24 There is a paucity of evidence in relation to the effects of dietary fibre intake in infants and children upon which to base a dietary reference value, e.g. there are no laxation trials and little information is available with regard to possible adverse effects of high intakes of dietary fibre on growth. The National Diet and Nutrition Survey (NDNS) indicates that the upper 2.5 percentile of non-starch polysaccharide intakes in infants (10-13g/day; 13-17g/day AOAC methods 985.29 and 991.43) and children aged 4-10 (19g/day; 25g/day AOAC methods 985.29 and 991.43) and 11-18 years (23g/day; 30g/day AOAC methods 985.29 and 991.43) are not associated
186
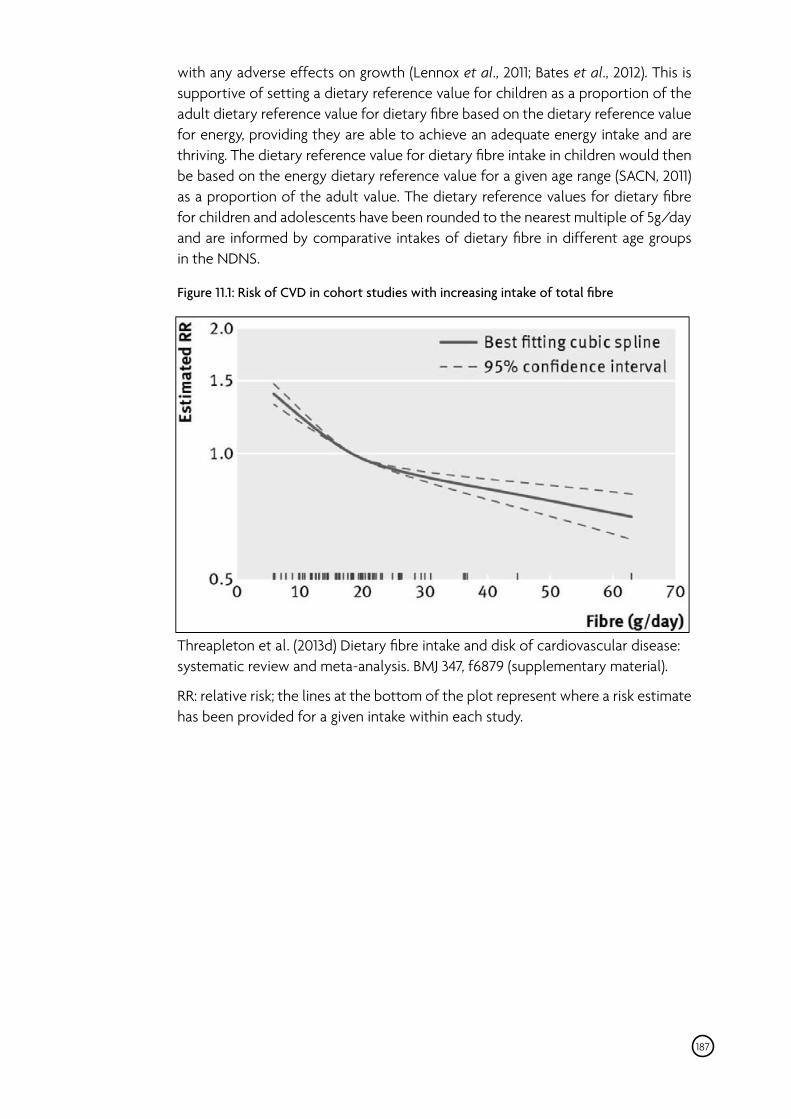
��
� �
with any adverse effects on growth (Lennox et al., 2011; Bates et al., 2012). This is supportive of setting a dietary reference value for children as a proportion of the adult dietary reference value for dietary fibre based on the dietary reference value for energy, providing they are able to achieve an adequate energy intake and are thriving. The dietary reference value for dietary fibre intake in children would then be based on the energy dietary reference value for a given age range (SACN, 2011) as a proportion of the adult value. The dietary reference values for dietary fibre for children and adolescents have been rounded to the nearest multiple of 5g/day and are informed by comparative intakes of dietary fibre in different age groups in the NDNS.
Figure 11.1: Risk of CVD in cohort studies with increasing intake of total fibre
Threapleton et al. (2013d) Dietary fibre intake and disk of cardiovascular disease: systematic review and meta-analysis. BMJ 347, f6879 (supplementary material).
RR: relative risk; the lines at the bottom of the plot represent where a risk estimate has been provided for a given intake within each study.
187
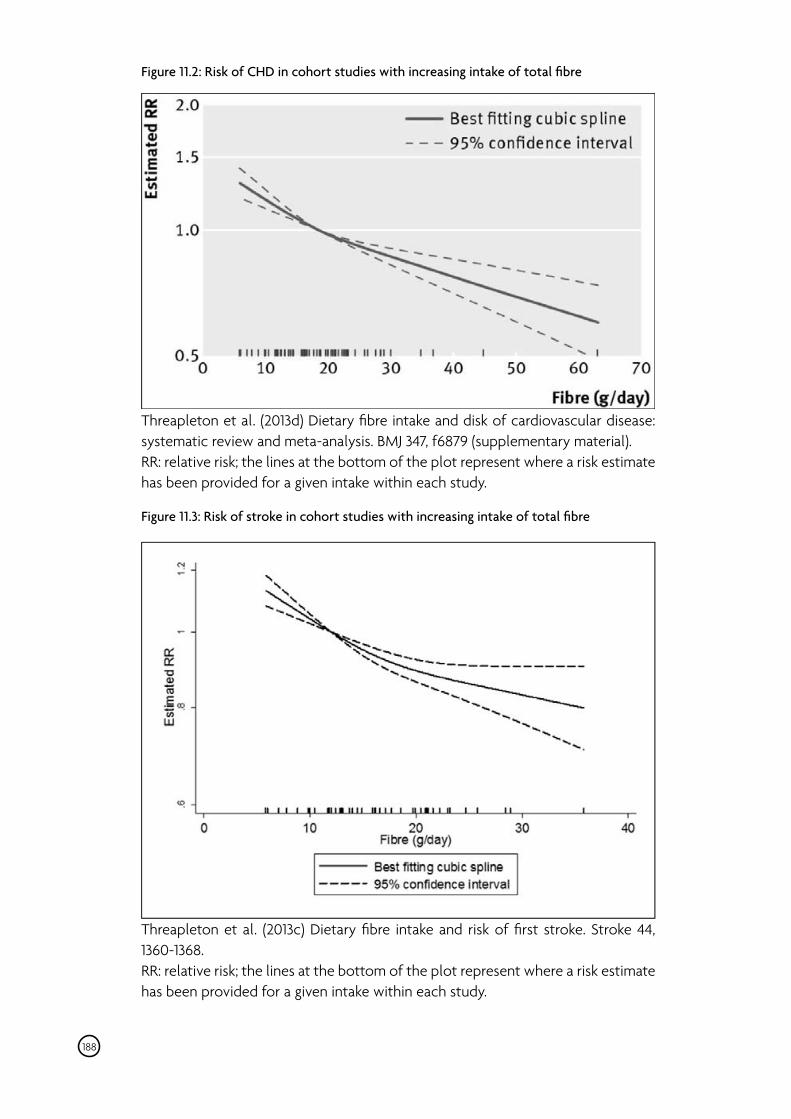
Figure 11.2: Risk of CHD in cohort studies with increasing intake of total fibre
Threapleton et al. (2013d) Dietary fibre intake and disk of cardiovascular disease: systematic review and meta-analysis. BMJ 347, f6879 (supplementary material). RR: relative risk; the lines at the bottom of the plot represent where a risk estimate has been provided for a given intake within each study.
Figure 11.3: Risk of stroke in cohort studies with increasing intake of total fibre � � � � � � � � � � � � � ��
Threapleton et al. (2013c) Dietary fibre intake and risk of first stroke. Stroke 44, 1360-1368. RR: relative risk; the lines at the bottom of the plot represent where a risk estimate has been provided for a given intake within each study.
188
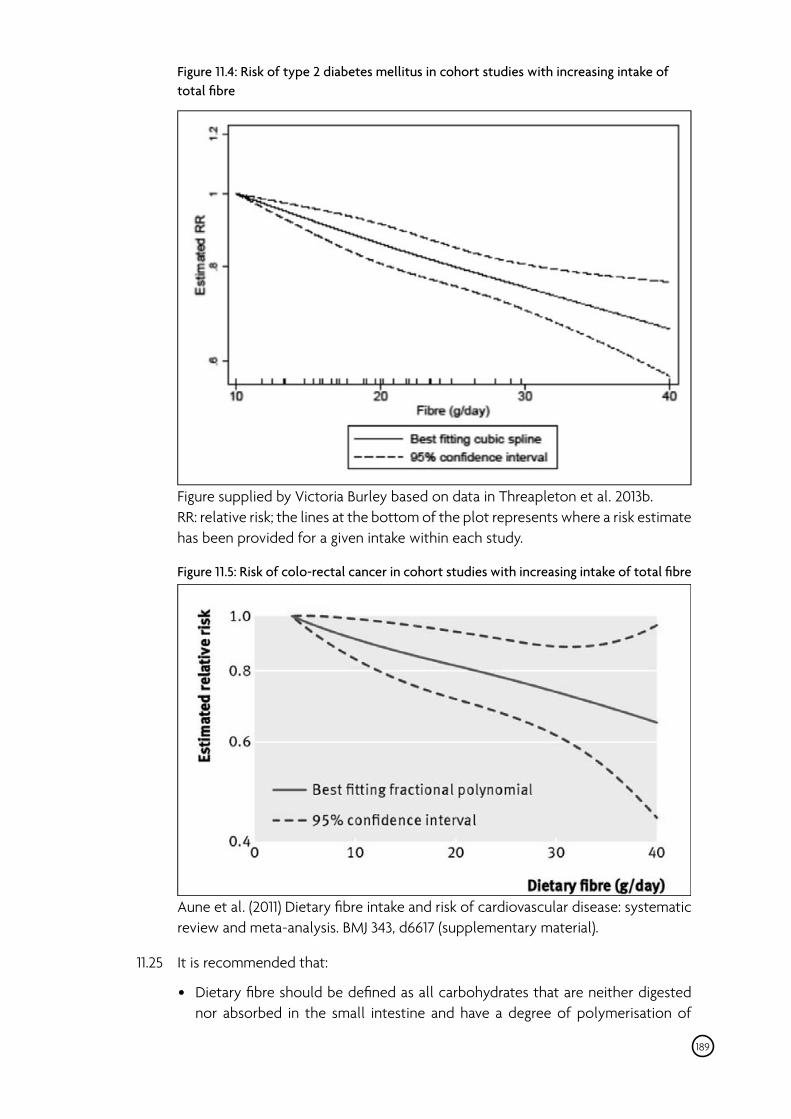
Figure 11.4: Risk of type 2 diabetes mellitus in cohort studies with increasing intake of total fibre
Figure supplied by Victoria Burley based on data in Threapleton et al. 2013b. RR: relative risk; the lines at the bottom of the plot represents where a risk estimate has been provided for a given intake within each study.
Figure 11.5: Risk of colo-rectal cancer in cohort studies with increasing intake of total fibre
Aune et al. (2011) Dietary fibre intake and risk of cardiovascular disease: systematic review and meta-analysis. BMJ 343, d6617 (supplementary material).
11.25 It is recommended that:
• Dietary fibre should be defined as all carbohydrates that are neither digested nor absorbed in the small intestine and have a degree of polymerisation of
189
three or more monomeric units, plus lignin. For extracted natural carbohydrate components or synthetic carbohydrate products to be defined as dietary fibre, beneficial physiological effects, similar to those demonstrated for the naturally integrated dietary fibre component of foods, must be demonstrated by accepted scientific evidence. Dietary fibre is to be chemically determined using the prevailing AOAC methods agreed by regulatory authorities.
• It is recommended that the dietary reference value for the average population intake of dietary fibre for adults should be 30g/day, as defined in the paragraph above and measured using the AOAC methods agreed by regulatory authorities. The previous dietary reference value of 18g/day of non-starch polysaccharides, defined by the Englyst method, equates to about 23-24 g/day of dietary fibre if analysed using these AOAC methods, thus the new recommendation represents an increase from this current value.
• It is recommended that the average population intake of dietary fibre for children aged 2 to 5 years should approximate 15g/day, for children aged 5 to 11 years 20g/day, for children aged 11 to 16 years 25 g/day and for adolescents aged 16 to 18 years about 30g/day. These values have been rounded to the nearest multiple of 5g/day and are informed by comparative intakes of dietary fibre in different aged groups in the NDNS. Due to the absence of information, no quantitative recommendations are made for children aged under 2 years, but from about six months of age gradual diversification of the diet to provide increasing amounts of whole grains, pulses, fruits and vegetables is encouraged.
• Most of the evidence for the wide range of health benefits of fibre comes from studies where the exposure reflects dietary fibre intakes achieved through a variety of foods where it is present as a naturally integrated component. There is evidence to show that particular extracted and isolated fibres have positive effects on blood lipids and colorectal function but due to the smaller evidence base, it is not known whether these components confer the full range of health benefits associated with the consumption of a mix of dietary fibre rich foods. Therefore, it is recommended that fibre intakes should be achieved through a variety of food sources.
190
12 Overall summary and conclusions
12.1 This report considered the evidence for a role of dietary carbohydrate in cardio-metabolic, colo-rectal and oral health. Systematic reviews on cardio-metabolic, colo-rectal and oral health were commissioned to inform the evaluation on carbohydrates and health. Evidence from both prospective cohort studies and randomised controlled trials was included in the reviews.
Approach taken in the consideration of the evidence 12.2 The evidence was assessed using the SACN Framework for the Evaluation of
Evidence (SACN, 2012) and graded according to the system described in Annex 2. This system was devised specifically to consider the evidence included in the Carbohydrates and Health report. In accord with the SACN Framework for Evaluation of Evidence, strict inclusion and exclusion criteria were applied in the systematic reviews to ensure the evidence considered was of sufficient quality to be able to draw sound conclusions. This restricted the evidence considered to prospective cohort studies and randomised controlled trials. For the individual systematic reviews and update search see Annex 1.
12.3 There is potential for biases with observational studies and the possibility of confounding by extraneous variables that correlate with both the dependent variable and the independent variable (residual confounding); hence, any associations must be interpreted with caution. The definitions used in cohort studies to characterise and quantify a specific dietary exposure, e.g. ‘whole grains’, have been used as described even though they may vary between studies. The same cohort studies were often used to assess different dietary components and so confounding cannot be excluded.
12.4 Randomised controlled trials can provide strong evidence for a causal relationship between diet and disease risk, yet a limitation is that they generally investigate markers and risk factors, but not disease outcomes. Trials are only typically carried out for short periods whilst chronic diet over many years is more relevant to health. Consideration of disease outcomes in relation to carbohydrate intake is, therefore, often dependent on prospective cohort studies. Many of the randomised controlled trials involve mixed interventions that modify other dietary components, e.g. the proportion and type of fat or micronutrient content. They also often involve energy restriction with the aim of producing weight loss. Both of these factors could potentially affect the outcomes considered. This limits the conclusions that can be drawn; in particular this applies to the effect of variations in total carbohydrate intake and glycaemic index and glycaemic load on cardio-metabolic risk factors. A further limitation is that the dietary interventions vary greatly between trials examining a specific outcome and it is often not possible to consider dose-response effects; this is especially so for trials varying total carbohydrate intake.
191
12.5 For many of the outcomes considered in this report, there was insufficient evidence of the required quality. However, where possible, the dose-response relationships between carbohydrate intakes and health outcomes have been considered and used to inform the dietary recommendations.
Total dietary carbohydrate 12.6 Prospective cohort studies indicate no association between total carbohydrate
intake and the incidence of cardiovascular disease endpoints, type 2 diabetes mellitus, glycaemia or colo-rectal cancer; in most studies, the results were adjusted for body mass index. Cohort studies and trials conducted in children and adolescents indicate no association between total carbohydrate intake and body mass index or body fatness. There is a lack of evidence available for oral health outcomes in relation to total carbohydrate intake.
12.7 Randomised controlled trials assess the effect of varying total carbohydrate intake and reciprocal variation of fat type and quantity and/or protein intake. No effect of varying total carbohydrate intake on vascular function, inflammatory markers and risk factors for type 2 diabetes mellitus has been demonstrated. Fasting blood lipid concentrations and blood pressure are affected, but it is not possible to exclude confounding by a concomitant reduction in fat intake and/or differences in weight loss between experimental groups. This caveat applies to all the cardio-metabolic risk factors investigated. The trials provide evidence that an energy-restricted higher carbohydrate, lower fat diet, as compared with a lower carbohydrate average fat diet, may be effective in reducing body mass index, but the evidence is based on only four trials and there is high heterogeneity between them. The hypothesis that diets higher in total carbohydrate cause weight gain is not supported by the evidence from randomised controlled trials considered in this report.
12.8 Overall, the evidence from both prospective cohort studies and randomised controlled trials indicates that total carbohydrate intake appears to be neither detrimental nor beneficial to cardio-metabolic health and colo-rectal health. However, this report also highlights that there are specific components or sources of carbohydrates which are associated with more beneficial or detrimental health effects.
Sugars and sugars-sweetened foods and beverages 12.9 Prospective cohort studies indicate that sugars or sugars-sweetened beverage
intake is not associated with the incidence of colo-rectal cancer. There is no association between the incidence of type 2 diabetes mellitus and total or individual sugars intake, but a greater risk is associated with a higher intake of sugars-sweetened beverages. There is insufficient evidence to enable conclusions to be drawn in relation to cardiovascular disease endpoints. Prospective cohort studies, conducted in children and adolescents, indicate that higher consumption (i.e. the amount) of sugars, sugars-containing foods and sugars-sweetened beverages is associated with a greater risk of dental caries in the deciduous and
192
permanent dentitions. There is a lack of evidence to assess the impact of sugars intake on oral health in adults, however the mechanism for the development of dental caries is the same for adults as it is for children. A higher frequency of consumption of sugars-containing foods and beverages, but not total sugars, is also associated with greater risk of dental caries in the deciduous and permanent dentitions. The lack of association observed between frequency of sugars intake and dental caries risk may in part be due to methodological problems in the definition and characterisation of eating events in observational studies. Identifying the relationship between dental caries and sugars intake is confounded by oral hygiene and global preventative measures that have reduced the incidence of caries worldwide.
12.10 Randomised controlled trials conducted in adults indicate that increasing or decreasing the percentage of total dietary energy as sugars when consuming an ad libitum diet, either through the substitution of other macronutrient components or by replacing sugars with non-caloric sweeteners, leads to a corresponding increase or decrease in energy intake. Consistent with these findings, randomised controlled trials conducted in children and adolescents indicate that consumption of sugars-sweetened beverages, as compared with non-calorically sweetened beverages, results in greater weight gain and increases in body mass index. The findings of these trials suggest that there is inadequate energy compensation (degree of voluntary reduction in intake of other foods or drinks), for energy delivered as sugar. Trials examining cardiovascular risk factors, inflammatory markers and risk factors for type 2 diabetes mellitus demonstrate no effects of increasing sugars intake. There is also insufficient evidence to assess the link between individual sugars and sugars-sweetened foods and beverages and cardio-metabolic outcomes.
12.11 The WHO guideline for sugars intake for adults and children (WHO, 2015) was published in the final stages of the drafting of this report. The reviews on sugars intake in relation to body weight and oral health (Te Morenga et al., 2013; Moynihan & Kelly, 2014) employed different inclusion criteria from the reviews conducted to inform this report. The WHO guideline included studies of shorter duration, non-randomised trials, and population and cross-sectional studies unlike this report (see Chapter 1 and Annex 2 for the inclusion criteria used in the reviews informing this report). The WHO made a strong recommendation that in adults and children the intake of free sugars should be reduced to less than 10% of total energy intake and a conditional recommendation for a further reduction in free sugar intake to below 5% of total energy intake.
12.12 Overall, there were very few studies on individual sugars, such as glucose, fructose or sucrose, which met the inclusion criteria for this report. Prospective cohort studies indicate that higher consumption of sugars and sugars-containing foods and beverages is associated with a greater risk of dental caries. Prospective cohort studies indicate that greater consumption of sugars-sweetened beverages is associated with risk of type 2 diabetes mellitus. Randomised controlled trials conducted in adults indicate that increasing or decreasing the percentage of total dietary energy as sugars when consuming an ad libitum diet leads to a
193
corresponding increase or decrease in energy intake. Reduction in the percentage of dietary energy as sugars was achieved in these trials either through the substitution of other macronutrient components or by replacing sugars with non-caloric sweeteners. Randomised controlled trials conducted in children and adolescents indicate that consumption of sugars-sweetened beverages, as compared with non-calorically sweetened beverages, results in greater weight gain and increases in body mass index.
Starch and starch-rich foods 12.13 Prospective cohort studies indicate no association between starch and refined
grain intake and cardiovascular disease endpoints and type 2 diabetes mellitus. There is a lack of evidence relating colo-rectal cancer and oral health to starch and starch-rich foods intake. There is insufficient evidence to draw a conclusion on the association between starch intake and weight gain.
12.14 Cohort studies indicate an association between greater consumption of white rice and risk of type 2 diabetes mellitus in Asian populations (in Japan and China) consuming amounts of white rice which are not generally achieved in the UK. It is therefore uncertain whether the detrimental association is relevant to the whole UK population. Consumption of brown rice is associated with a reduction in the risk of type 2 diabetes mellitus, but the evidence is limited to a small number of studies. A higher consumption of potatoes is associated with risk of type 2 diabetes mellitus, but it is not possible to exclude confounding by other dietary variables, e.g. cooking methods such as frying. Moreover, the evidence is limited to a small number of studies.
Dietary fibre 12.15 Prospective cohort studies indicate that a diet rich in dietary fibre is associated
with a lower incidence of cardiovascular diseases, coronary events, type 2 diabetes mellitus and colo-rectal cancer. Over the ranges of intakes studied, it was found that as more dietary fibre was consumed a greater reduction in risk was observed (see Figures 11.1-11.5 Chapter 11). No association was found between dietary fibre intake and body weight. There is a lack of evidence for oral health in relation to dietary fibre intake. Although the definitions used to define whole grains vary between studies, higher whole grains consumption is associated with a lower incidence of cardiovascular disease, hypertension, type 2 diabetes mellitus and colon cancer. Higher cereal fibre consumption is associated with a lower incidence of coronary events, type 2 diabetes mellitus, colo-rectal and colon cancer, although the evidence is more limited for individual types of dietary fibre due to the smaller number of studies.
12.16 Randomised controlled trials indicate no effect of (total, mixed) dietary fibre intake on cardiovascular or type 2 diabetes mellitus risk factors considered in this report. Trials indicate that dietary fibre, wheat fibre and other cereal fibres decrease intestinal transit times and increase faecal mass. Higher cereal fibre consumption is shown to reduce constipation. Trials demonstrate no effect of cereal fibre
194
supplements on recurrence of colo-rectal adenomas. Trials in subjects receiving oat bran and isolated β-glucan demonstrate beneficial effects on fasting blood lipid concentrations and blood pressure. The doses of oat fibre and β-glucan used in these trials generally exceed levels currently consumed in a typical UK diet, but recent and future developments of food ingredients may substantially increase the intake of isolated β-glucan.
12.17 There is strong evidence from prospective cohort studies that increased intakes of total dietary fibre, and particularly cereal fibre and wholegrain, as they are classified in this report, are associated with a lower risk of cardio-metabolic disease and colo-rectal cancer. Randomised controlled trials indicate that total dietary fibre, wheat fibre and other cereal fibres, as they are classified in this report, increase faecal mass and decrease intestinal transit times. Randomised controlled trials also indicate that higher intake of oat bran and isolated β-glucans leads to lower total cholesterol, LDL cholesterol and triacylglycerol concentrations and lower blood pressure.
12.18 No prospective cohort studies have examined the relationship between non-digestible oligosaccharides or resistant starch and the health/disease outcomes considered in this report. Randomised controlled trials in which diets were supplemented with non-digestible oligosaccharides demonstrated a beneficial effect on fasting blood lipid concentrations, but no effect on fasting glucose and insulin concentration or energy intake. Trials demonstrated that non-digestible oligosaccharides cause an increase in faecal mass and an effect on faecal bacterial content, but no effect on faecal short chain fatty acid levels. Non-digestible oligosaccharides or inulin supplementation increases fractional absorption of calcium in children, but not in adults. Resistant starch supplementation has no effect on energy intake or faecal bacterial content, but increases faecal mass and modifies faecal short chain fatty acid levels. Trials also provide limited evidence that polydextrose and polyol supplementation increase faecal mass.
12.19 Overall, randomised controlled trials in adults indicate that supplementation with non-digestible oligosaccharides improved blood lipid concentrations, increased faecal mass and bacterial content. Resistant starch supplementation increased faecal mass and short chain fatty acid content. Polydextrose and polyol supplementation increased faecal mass. The health significance of the effects on faecal parameters and net calcium absorption in children is unclear. While some effects are demonstrated for both non-digestible oligosaccharides and resistant starch, the supplement doses in trials currently exceed estimated dietary intakes in the UK, but a large number of foods containing these compounds have already been authorised in Europe and the potential or actual impact of these on overall intakes is unclear.
Glycaemic index and glycaemic load 12.20 Prospective cohort studies indicate that a diet higher in glycaemic index or load is
associated with a greater risk of type 2 diabetes mellitus. There is no evidence from prospective cohort studies to suggest an association between glycaemic index
195
and cardiovascular disease or coronary heart disease. Glycaemic load is associated with a greater risk of cardiovascular disease, but the evidence is limited due to the small number of studies. The available evidence does not suggest an association between glycaemic index or load and colo-rectal cancer incidence. There is a lack of evidence for effects on oral health in relation to glycaemic index or load.
12.21 Randomised controlled trials have assessed the effect of varying glycaemic index primarily by changing the quality of the dietary carbohydrate sources. Trials assessing the effect of varying glycaemic load have reduced carbohydrate intake, reciprocally varied fat, type and quantity, and/or protein intake, as well as changing the quality of dietary carbohydrate. These trials indicate no effect of varying glycaemic index or load on vascular function, inflammatory markers, risk factors for type 2 diabetes mellitus and obesity. The trials indicate a higher glycaemic index diet may affect fasting blood lipid concentrations, but it is not possible to exclude confounding due to differential weight changes between the groups. A higher glycaemic load diet has been shown to reduce diastolic blood pressure and fasting blood triacylglycerol concentration to a lesser degree than a lower glycaemic load diet, but it is not possible to exclude confounding by other dietary variables and the evidence is limited due to the small number of trials.
12.22 Higher and lower glycaemic index or load diets will, in most cases, differ in many ways other than just the carbohydrate fraction. It is not possible, therefore, to assign cause-effect relationships for outcomes based on variation in diet glycaemic index or load, as the nature of the intervention includes a number of factors.
Dietary carbohydrate recommendations Carbohydrate dietary reference values for ages 2 years and above
12.23 The dietary recommendations for total carbohydrate, free sugars, starch and sugars contained within the cellular structure of food, and milk sugars have been proposed in the context of an energy intake which is appropriate to maintain a healthy weight (SACN, 2011).
12.24 It is recommended that:
• The dietary reference value for total carbohydrate should be maintained at an average population intake of approximately 50% of total dietary energy.18
12.25 It is recommended that:
• The definition for ‘free sugars’ be adopted in the UK. This comprises all monosaccharides and disaccharides added to foods by the manufacturer, cook or consumer, plus sugars naturally present in honey, syrups and unsweetened fruit juices. Under this definition lactose when naturally present in milk and milk products is excluded.
• The average population intake of free sugars should not exceed 5% of total dietary energy for age groups from 2 years upwards.
18 The previous recommendation for total carbohydrate was 47% of daily total dietary energy intake or 50% of food energy (excluding alcohol) (COMA, 1991).
196
• With the proposed reduction in the population intake of free sugars, their contribution toward recommended total carbohydrate intake should be replaced by starches, sugars contained within the cellular structure of foods and, for those who consume dairy products, by lactose naturally present in milk and milk products. The complete replacement of energy derived from free sugars by these carbohydrate sources would only apply to those people who are a healthy BMI and in energy balance. In those who are overweight, the reduction of free sugars would be part of a strategy to decrease energy intake.
• The consumption of sugars-sweetened beverages should be minimised in children and adults.
12.26 It is recommended that:
• Dietary fibre should be defined as all carbohydrates that are neither digested nor absorbed in the small intestine and have a degree of polymerisation of three or more monomeric units, plus lignin. For extracted natural carbohydrate components or synthetic carbohydrate products to be defined as dietary fibre, beneficial physiological effects, similar to those demonstrated for the naturally integrated dietary fibre component of foods, must be demonstrated by accepted scientific evidence. Dietary fibre is to be chemically determined using the prevailing AOAC methods agreed by regulatory authorities.
• The dietary reference value for the average population intake of dietary fibre for adults should be 30g/day, as defined in the paragraph above and measured using the AOAC methods agreed by regulatory authorities. The previous dietary reference value of 18g/day of non-starch polysaccharides, defined by the Englyst method, equates to about 23-24 g/day of dietary fibre if analysed using these AOAC methods, thus the new recommendation represents an increase from this current value.
• The average population intake of dietary fibre for children aged 2 to 5 years should approximate 15g/day, for children aged 5 to 11 years 20g/day, for children aged 11 to 16 years 25 g/day and for adolescents aged 16 to 18 years about 30g/ day.
• Most of the evidence for the wide range of health benefits of fibre comes from studies where the exposure reflects dietary fibre intakes achieved through a variety of foods where it is present as a naturally integrated component. There is evidence to show that particular extracted and isolated fibres have positive effects on blood lipids and colorectal function but due to the smaller evidence base, it is not known whether these components confer the full range of health benefits associated with the consumption of a mix of dietary fibre rich foods. Therefore, it is recommended that fibre intakes should be achieved through a variety of food sources.
• No quantitative recommendations are made for children aged under 2 years, due to the absence of information, but from about six months of age gradual diversification of the diet to provide increasing amounts of whole grains, pulses, fruits and vegetables is encouraged.
197
UK carbohydrate intakes 12.27 The UK National Diet and Nutrition Survey (NDNS) provides robust data at national
population level on intakes of carbohydrates, sugar and fibre. Latest available data covering 2008/09 – 2011/12 were compared with the dietary reference values set by COMA in 1991. Mean intakes of total carbohydrate met or were close to meeting the dietary reference value. Mean intakes of non-milk extrinsic sugars exceeded the current dietary reference value (10% of total dietary energy intake) in all age groups and were highest in children aged 4-10 years and children aged 11-18 years (14.7% and 15.4% of total dietary energy intake respectively). Sugars-sweetened beverages (including fizzy drinks, energy drinks and squashes and cordials) provided 30% of non-milk extrinsic sugars intake in the 11-18 year age group and 16% of intake in younger children and adults. Fruit juice provided 10% of non-milk extrinsic sugars intake in the 11-18 year age group and 13% in younger children. Other sources of non-milk extrinsic sugars were table sugar, preserves and confectionery and biscuits, cakes, buns, pastries and breakfast cereals.
12.28 Mean intakes of dietary fibre (defined as non-starch polysaccharides) in all age groups were below the current dietary reference value of 18g/day set for adults. Mean intakes were less than 14g/day in adults and 11-12g/day in children. Cereals and cereal products were the main sources of fibre intake in all age groups, followed by vegetables and potatoes. There is evidence from NDNS and other surveys of a socio-economic gradient in intakes of both sugars and fibre, with higher intakes of non-milk extrinsic sugars as a percentage of energy for adults and lower intakes of non-starch polysaccharides for both adults and children in the lower income groups.
12.29 Changing the definition of sugars from non-milk extrinsic sugars to free sugars would slightly reduce mean intakes as a percentage of total dietary energy intake, but recommending that the average population intake of free sugars should not exceed 5% of total dietary energy means that current mean intakes in all age groups would be at least twice that recommended and three times that value in the 11-18 year age group.
12.30 Changing the definition of fibre from non-starch polysaccharides to AOAC would increase mean intakes by 3-5g in each age group. Setting the dietary reference value for AOAC fibre at 30g/day for adults means that current mean intakes would be 10-11g below the dietary reference value for men and 13g below for women. For children, setting the dietary reference value for AOAC fibre to 15g for the 2-5 year age group and 20g for the 5-11 year age group means that current mean intakes would be 4-6g below the dietary reference value. For older children aged 11-16 years, setting the dietary reference value at 25g means that current mean intake would be 9g below the dietary reference value.
Recommended dietary pattern in relation to carbohydrate 12.31 The evidence considered in this report endorses a dietary pattern concerning
carbohydrates that is based on a variety of food sources but limiting the amounts consumed of table sugar and rich sources of free sugars, such as preserves and
198
sweet spreads, fruit juice, confectionery, biscuits, buns and cakes. The report also provides evidence that sugars-sweetened beverages should be consumed in minimal (i.e. infrequently and in small) amounts.
12.32 The National Diet and Nutrition Survey shows that, as a whole, the population consumes more than the recommended amount of sugars and the intakes of fibre are below current advice. With the proposed increase of the dietary reference value for fibre and the reduction of the dietary reference value for free sugars, the difference between recommendations and the population’s intake would become even greater for both. In order to address this imbalance, there needs to be a change in the population’s diet so that people derive a greater proportion of total dietary energy from foods that are lower in free sugars and higher in dietary fibre whilst continuing to derive approximately 50% of total dietary energy from carbohydrates.
Research recommendations 12.33 The mechanism underlying the observed effect of sugars consumption on total
energy intakes in human populations could be better characterised, and the relationship requires more precise quantification. These issues would be best addressed through well designed human intervention trials at a range of exposure levels relevant to current population intake levels.
12.34 Type 2 diabetes mellitus is a significant public health problem in the UK. SACN would welcome research to clarify the relative contribution of sustained exposures to total and specific carbohydrates and related dietary sources/patterns to measures of fasting and post-prandial glycaemia and insulinaemia.
12.35 SACN would welcome research to address the lack of evidence available for oral health outcomes in relation to total carbohydrate intake.
12.36 SACN would welcome research to improve the functional categorization of specific dietary fibres and relevant extracts: building structure-function understanding to link and predict from defined, measurable physical and chemical properties to specific physiological effects. This should include defining physiologically meaningful effect ranges for colonic and faecal pH, short chain fatty acids, and bacterial populations.
12.37 SACN is recommending a change to the definition of fibre used in the UK, and that fibre should be chemically defined using AOAC methods. We note that AOAC fibre is routinely included in PHE’s nutrient analysis work, but to ensure that food composition tables reflect this recommendation, forward plans for new analyses of foods should ensure that data are available for key food groups contributing to fibre intakes as soon as is practical.
12.38 A standardized definition of ‘wholegrain’ and wholegrain foods should be developed, both to facilitate recommended portion sizes for wholegrain foods and to complement public health messages about the importance of dietary fibre.
199
12.39 Continuous improvements in the design, quality and consistency of reporting in nutrition research is required, to facilitate data capture (for meta-analysis) and interpretation. This includes: continued development and validation of markers of dietary exposures which can be used at population level; sufficient duration of exposures in randomised controlled trials, to ensure sustained effects; reporting according to e.g. CONSORT guidelines: baseline data; intervention data; change data with appropriate measures of variance; and definition and specification of exposures, for example with regard to dietary fibres and wholegrains.
200
ANNEX 1
Cardio-metabolic, colo-rectal and oral heath systematic reviews, additional meta-analyses and update search
The documents listed below can be accessed at https://www.gov.uk/government/publications/sacn-carbohydrates-and-health-report
Cardio-metabolic health systematic review protocol
Cardio-metabolic health systematic review introduction
Chapter 1. cardiovascular disease and dietary carbohydrate
Chapter 2. markers of cardiovascular disease - hyperlipidaemias and blood lipids
Chapter 2. markers of cardiovascular disease - incident hypertension and blood pressure
Chapter 2. markers of cardiovascular disease - vascular function
Chapter 3. dietary carbohydrate and markers of inflammation
Chapter 4. diabetes and glycaemia
Chapter 5. obesity
Chapter 6. energy intake and eating motivation
Carbohydrates and colo-rectal health systematic review
Carbohydrates and oral health systematic review
Update search for the cardio-metabolic health, colo-rectal health and oral health systematic reviews
Additional meta-analyses
201
ANNEX 2
Summary of review methodology
A2.1 For the cardio-metabolic health review, literature searches were performed to identify evidence on carbohydrates and cardiovascular disease, type 2 diabetes mellitus and obesity, and their associated risk markers. Prospective cohort studies and randomised controlled trials were included and the literature searches which were performed from 1990 up to November and December 2009. A start date of 1990 was chosen, as the evidence prior to that was considered by the Committee on Medical Aspects of Food Policy (COMA). To be included in the review, cohort studies investigating cardiovascular disease had to be adjusted for age and smoking as important confounders and studies investigating type 2 diabetes mellitus had to be adjusted for age and body mass index as important confounders. For more details on how the review was conducted, refer to the introductory section and the protocol of the cardio-metabolic health review (see Annex 1).
A2.2 Studies conducted in pregnant women were excluded from the cardio-metabolic health review because pregnancy represents a unique physiological and metabolic state and any changes observed could not be extrapolated to the general population. Studies conducted in children aged less than 5 years of age were also excluded from the cardio-metabolic health review. A separate assessment considered carbohydrate intake in pregnancy in relation to birth weight and cardio-metabolic health outcomes based on the databases containing all the citations identified in the cardio-metabolic health review literature search and the update search (see Annex 7).
A2.3 For the colo-rectal health review, literature searches were performed for trials on normal colo-rectal function (bowel habit/function, faecal microflora, fermentation products and calcium and magnesium absorption) and impaired colo-rectal function (constipation, prevention of diarrhoea, diverticular disease and irritable bowel syndrome). In terms of colo-rectal cancer risk, prospective studies on colo-rectal cancer and trials investigating the recurrence of colo-rectal adenomas were included. The literature searches were performed from the inception of the relevant database, regardless of the start date, up to November 2010. To be included in the review, cohort studies investigating colo-rectal cancer had to be adjusted for alcohol intake, smoking, physical activity, age and overweight/obesity as important confounders. For more detail on the review methodology, refer to the colo-rectal health review (see Annex 1).
A2.4 For the oral health review, literature searches were performed for cohort studies and randomised controlled trials on dental caries, periodontal disease, tooth wear (including dental erosion) and oral mucosal lesions (including oral cancer). To be included in the review, cohort studies investigating dental caries, erosion or periodontal disease had to be adjusted for smoking status (in adults), brushing
202
frequency and age. For oral cancer, cohort studies were included only if they adjusted for smoking status, alcohol intake and age as important confounders. Searches were conducted from the inception of the relevant databases up to January 2011 regardless of start date. Fruit juice search terms were part of the search strategy for oral health, but not for colo-rectal or cardio-metabolic health. For more details on the review methodology refer to the oral health review (see Annex 1).
A2.5 Outcomes included in the update search were prioritised as follows:
• cardiovascular disease,
• coronary events,
• stroke,
• total cholesterol,
• LDL-cholesterol,
• HDL-cholesterol,
• triacylglycerol,
• type 2 diabetes mellitus,
• glycaemia, impaired glucose tolerance,
• HbA1c, insulinaemia,
• insulin resistance,
• C-reactive protein,
• vascular function,
• dental caries,
• periodontal disease,
• faecal output (intestinal transit time, faecal weight),
• faecal bacteria, faecal pH and short chain fatty acid content,
• constipation and colo-rectal cancer.
A2.6 The data from the included studies were extracted into tables using the same format as in the respective systematic reviews. These can be found in Annex 1 of this report. In the update search, studies investigating the effect of different polymorphisms were not included.
Data analysis A2.7 Where three or more studies which were sufficiently similar in design were
included in the systematic reviews, a meta-analysis was conducted using a random effects model. For meta-analyses of cohort studies, a dose response approach was used to quantify the relationship between dietary intakes and particular health outcomes. In the colo-rectal health review this was referred to as the ‘per unit analysis’. Meta-analyses using the highest versus lowest quantile approach were also presented in the colo-rectal health review, however only the results
203
from the dose response meta-analyses have been used in this report since they are more informative.
A2.8 Where studies only reported results by population subgroup within the same study (e.g. men and women, colon and rectal cancer), a fixed effect model was used to combine the results in order to obtain a single estimate. The single estimate was subsequently included in the random effects model.
A2.9 The I2 statistic was used to denote heterogeneity. This provides an estimate of the percentage of variation across the studies which is due to systematic differences between studies. In general, an I2 statistic of 0-25% reflects low heterogeneity, 26-75% indicates medium heterogeneity and >75% indicates high heterogeneity. A high I2 statistic reflects uncertainty regarding the value of the pooled estimate, but not necessarily the direction of effect (which may be consistent across studies). It was agreed that if the result produced an I2 of more than 75%, the pooled estimate would not be presented because there was excessive heterogeneity and the result would have little meaning. In this case, the studies were presented in a forest plot only.
A2.10 In the systematic reviews, where meta-analyses were available they have been used to inform conclusions but were not used as the sole basis on which to judge the evidence. Those studies which provided insufficient information to be incorporated into a meta-analysis were considered in support of this evidence.
A2.11 In the cardio-metabolic health review, studies investigating dietary fibre intake in relation to health outcomes, non-starch polysaccharide values, were where reported, multiplied by 1.33 to estimate AOAC values (Bates et al., 2009). This enabled comparison with studies in which fibre was defined using AOAC methods, before being included in a meta-analysis. For the colo-rectal health review studies measuring both non-starch polysaccharide and AOAC were included in a meta-analysis without adjusting the non-starch polysaccharide values, but this was shown to have negligible impact on the overall pooled risk ratio estimates (see Annex 1 additional analyses).
A2.12 For more details on the statistical approaches used, refer to the original cardio-metabolic health and colo-rectal health systematic reviews (see Annex 1). Meta-analyses were not conducted in the oral health review, and for some outcomes in the colo-rectal health review, because the studies were not sufficiently comparable, therefore data were extracted into tables and are discussed in the narrative.
Grading system for judging the evidence A2.13 It was considered important to grade the evidence included in this report in order
to convey the strength and quality of evidence identified. Established grading systems from the World Cancer Research Fund, The Working Group on Grading of Recommendations, Assessment, Development and Evaluation (GRADE) and the German Nutrition Society were evaluated, however they were considered not to offer the flexibility required for a risk assessment of this nature. Using the SACN
204
framework for the evaluation of evidence as a basis, a grading system specifically for use in this report was devised. Details of this system are provided in the following paragraphs.
A2.14 The scientific evidence included in the commissioned systematic reviews and the update search was used to draw conclusions on the relationship between carbohydrates and different health outcomes/intermediate markers. An approach to judge, assess and categorise the evidence, based on the nature of the relationship observed and the amount of available evidence, was agreed.
A2.15 In keeping with the Framework for the Evaluation of Evidence, the word ‘association’ was used to describe the evidence from cohort studies and the word ‘effect’ was used when referring to evidence from randomised controlled trials. An association/effect was determined if statistical significance was demonstrated using the p <0.05 criterion.
A2.16 Expert judgement was used to determine the exact grading. This included taking account of study quality, study size and methodological considerations, and has resulted in the upgrading or downgrading of evidence, in some instances. For example, expert judgement was applied to upgrade the conclusions from randomised controlled trials presenting evidence on sugars-sweetened beverage intake in relation to body mass index in children and adolescents. Expert judgment was also used in the decision to include studies that did not adjust for tooth brushing in the evidence base on sugars intake and risk of dental caries. The report notes where expert judgment was used to alter conclusions reached through the grading system.
Cohort studies A2.17 Generally, evidence from three or more cohort studies was used to judge if
there was an association particularly where a meta-analysis had been performed. However, expert judgement was also applied to determine whether the quality of the evidence permitted a conclusion to be drawn. Where an association appeared to be present, the evidence was graded as adequate, moderate or limited. The number of studies acted as an approximate guide only, since issues surrounding study design, study size, methodology and definition of exposures were also considered in determining the final grading of the evidence.
A2.18 Evidence was graded as follows:
• Adequate – a meta-analysis was performed on five or more cohort studies. Alternatively, a total of five or more studies were identified in the systematic review and/or the update search; these consistently showed the same outcome although a meta-analysis was not performed.
• Moderate – a meta-analysis was performed on three or four cohort studies. Alternatively, a total of five studies were identified in the systematic review and/or update search, but a meta-analysis was not performed.
205
• Limited – three to four cohort studies were identified and there was some indication that the results were in the same direction but no meta-analysis was performed. However, the evidence may also have been considered limited if there were a number of studies, but the biological plausibility was unclear or the methodology was not precise or the exposures were heterogeneous.
Randomised controlled trials A2.19 Generally, there needed to be three or more randomised controlled trials to
determine if there was evidence of an effect or not. Expert judgement was used to determine if the quality of these data permitted a conclusion to be drawn. Where an effect appeared to be present, the evidence was graded as adequate, moderate or limited. The number of studies was used as an approximate guide only, since issues surrounding study design, study size, methodology and definition of exposures affected the final grading of the evidence.
A2.20 Evidence was graded as follows:
• Adequate – a meta-analysis was performed on three or more randomised controlled trials. Alternatively, a total of four or more studies were identified in the systematic review and/or the update search; these consistently showed the same outcome although a meta-analysis was not performed.
• Moderate – a meta-analysis was performed on three or more randomised controlled trials. Alternatively, three or more randomised controlled trials were identified in the systematic review and/or the update search, which consistently showed the same outcome although a meta-analysis was not performed.
• Limited – three to four randomised controlled trials were identified and there was some indication that the results were in the same direction, but no meta-analysis was performed. However, the evidence may also have been considered limited if there were a number of studies, but the biological plausibility was unclear, the methodology was not precise or the exposures were heterogeneous.
A2.21 The evidence was normally considered as insufficient where there were fewer than three studies of the same type. Alternatively, if there were more studies but they were of poor quality, the evidence may have also been considered as insufficient.
A2.22 Evidence was deemed inconsistent according to statistical considerations i.e. in a meta-analysis, when I2 >75%, the confidence intervals did not overlap or if the results of individual studies were not in the same direction. When the I2 was greater than 75%, but the forest plot suggested there was evidence of a direction for an outcome, expert judgement was used to upgrade the conclusion, where appropriate.
A2.23 In addition to the evidence grading, if an effect or association was shown, statements have been provided on the following:
• Whether the effect or association indicated beneficial or adverse effects with higher intakes of carbohydrate or carbohydrate components.
206
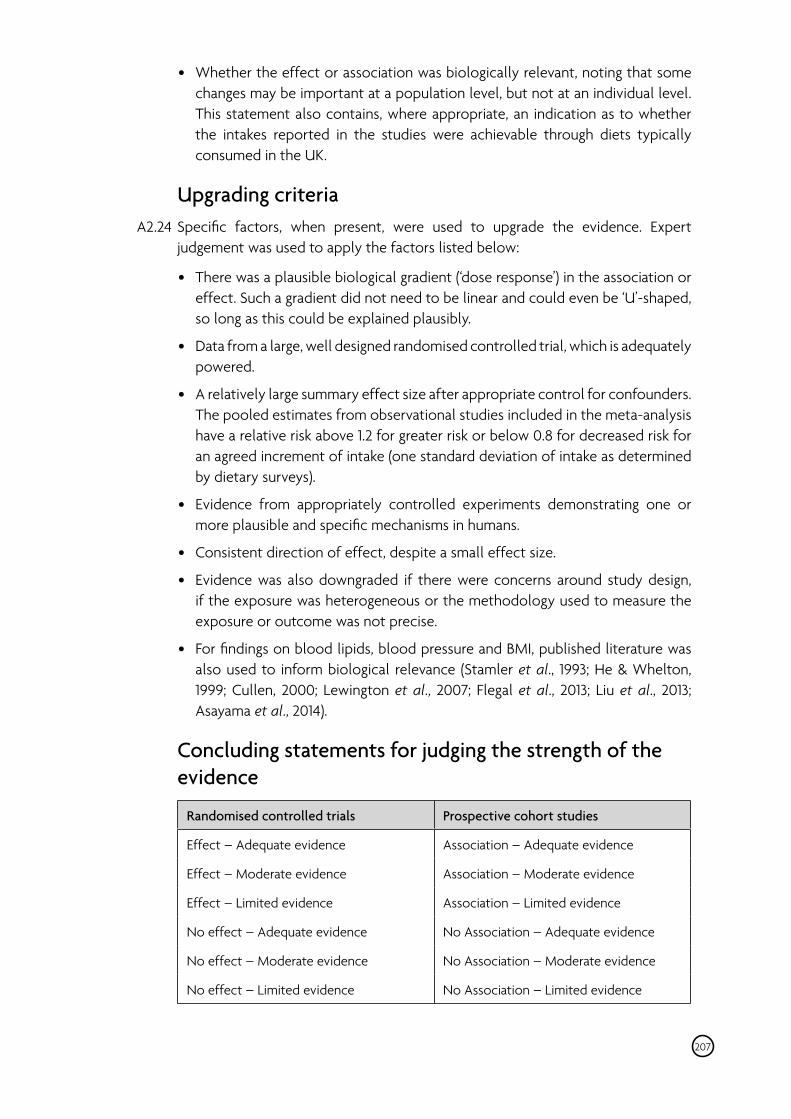
207
• Whether the effect or association was biologically relevant, noting that some changes may be important at a population level, but not at an individual level. This statement also contains, where appropriate, an indication as to whether the intakes reported in the studies were achievable through diets typically consumed in the UK.
Upgrading criteria A2.24 Specific factors, when present, were used to upgrade the evidence. Expert
judgement was used to apply the factors listed below:
• There was a plausible biological gradient (‘dose response’) in the association or effect. Such a gradient did not need to be linear and could even be ‘U’-shaped, so long as this could be explained plausibly.
• Data from a large, well designed randomised controlled trial, which is adequately powered.
• A relatively large summary effect size after appropriate control for confounders. The pooled estimates from observational studies included in the meta-analysis have a relative risk above 1.2 for greater risk or below 0.8 for decreased risk for an agreed increment of intake (one standard deviation of intake as determined by dietary surveys).
• Evidence from appropriately controlled experiments demonstrating one or more plausible and specific mechanisms in humans.
• Consistent direction of effect, despite a small effect size.
• Evidence was also downgraded if there were concerns around study design, if the exposure was heterogeneous or the methodology used to measure the exposure or outcome was not precise.
• For findings on blood lipids, blood pressure and BMI, published literature was also used to inform biological relevance (Stamler et al., 1993; He & Whelton, 1999; Cullen, 2000; Lewington et al., 2007; Flegal et al., 2013; Liu et al., 2013; Asayama et al., 2014).
Concluding statements for judging the strength of the evidence
Randomised controlled trials Prospective cohort studies
Effect – Adequate evidence Association – Adequate evidence
Effect – Moderate evidence Association – Moderate evidence
Effect – Limited evidence Association – Limited evidence
No effect – Adequate evidence No Association – Adequate evidence
No effect – Moderate evidence No Association – Moderate evidence
No effect – Limited evidence No Association – Limited evidence

A2.25 Note – the following concluding statements were applied to both randomised controlled trials and prospective cohort studies:
• No conclusion – insufficient evidence.
• No conclusion – inconsistent evidence.
208
ANNEX 3
Commentary on the evidence on fructose and health
A3.1 Fructose intakes, through the use of high fructose corn syrup (HFCS, an example of a number of different glucose/fructose mixes with about 40-60% fructose content) have increased in parallel with obesity rates. Current intakes of fructose (as separate from sucrose) in the UK are estimated to provide 3.4% of total dietary energy (3.5% of food energy) in adults, but the National Diet and Nutrition Survey (NDNS) does not capture intakes of HFCS; therefore there are no reliable national data on current intakes of this sweetener in the UK. HFCS is more commonly used to sweeten foods and beverages in the US than in Europe. Products sweetened with HFCS are not necessarily significantly higher in fructose than foods sweetened with sucrose as HFCS has a similar composition to sucrose, which is 50% glucose and 50% fructose.
A3.2 Fructose is metabolised differently compared with other monosaccharides and, for this reason, some authors have argued that it promotes lipid production and insulin resistance. A few trials have demonstrated that diets supplemented with high levels of pure fructose (without similar amounts of glucose) lead to increased fasting blood lipid concentrations, particularly of triacylglycerol (TAG), fat deposition, and lower insulin sensitivity compared with diets supplemented with comparable levels of glucose (Teff et al., 2004; Swarbrick et al., 2008; Stanhope et al., 2009; Teff et al., 2009; Stanhope et al., 2011a; Stanhope et al., 2011b). None of these trials met the inclusion criteria for the reviews conducted to inform this report because they were either not randomised trials (Swarbrick et al., 2008; Stanhope et al., 2009; Stanhope et al., 2011a; Stanhope et al., 2011b) or they were of insufficient duration, i.e. less than six weeks (Teff et al., 2004; Teff et al., 2009).
A3.3 A randomised controlled trial performed in overweight men found that there was no difference in body weight or levels of hepatic TAG if subjects consumed pure fructose or glucose as part of an isocaloric diet (Johnston et al., 2013). However, when subjects consumed glucose or fructose in addition to an ad libitum diet, hepatic, calf muscle and serum levels of TAG all increased along with body weight, but these outcomes did not differ significantly between the fructose or glucose interventions. These results imply that the changes demonstrated were as a result of the additional energy consumed. A systematic review found that overall there was no significant effect on body weight when the intervention involved substituting fructose for another carbohydrate using an isocaloric diet (Sievenpiper et al., 2012). However when fructose was provided in addition to the normal diet, weight significantly increased. The authors noted that a number of the trials they reviewed were not randomised, provided large doses of fructose and were of short duration, with only one of the trials being longer than four weeks.
209
A3.4 A systematic review and meta-analysis of randomised and non-randomised trials found that there was no statistically significant effect on the concentrations of total, LDL- or HDL-cholesterol, when feeding subjects pure fructose compared with isoenergetic amounts of other carbohydrate (Zhang et al., 2013). However when the analysis was stratified by dose, it was found that very high doses of 100g or more of fructose significantly increased the concentrations of total and LDL-cholesterol. Of the twenty four trials included, only eleven were randomised, nine studies were conducted in diabetics and only nine studies had a duration of six weeks or longer (Zhang et al., 2013).
A3.5 It is important to note that in these trials participants consumed sugars-sweetened beverages containing high doses of either pure fructose or pure glucose (25-30% of their daily energy intake). However, with the exception of certain fruit juices which contain high doses of pure glucose or fructose, glucose and fructose are not commonly consumed in large amounts independent of each other within the normal diet. Instead they are primarily consumed as components of sucrose or high fructose corn syrups (or honey or other commercial glucose/fructose mixes). Sucrose consists of 50% glucose and 50% fructose and honey and most HFCS and other commercial syrups contain glucose and fructose in ratios broadly similar to sucrose. The body absorbs free fructose and glucose, or the same sugars derived from sucrose and HFCS, in exactly the same way. Therefore it appears unlikely that fructose, as consumed as a component of most HFCS or other glucose-fructose syrups, causes metabolic abnormalities or promotes weight gain more than other sugars consumed in an isocaloric diet (Klurfeld et al., 2013).
A3.6 There was only one trial that was eligible to be included in the cardio-metabolic health review in which diets were supplemented with either glucose or fructose for six weeks (Bantle et al., 2000). The sugars provided 17% of daily energy, 14% of which were added to foods and drinks as glucose or fructose, and the remaining 3% being derived from foods that naturally contained fructose or glucose. At the end of the intervention TAG concentrations were significantly higher in men following fructose supplementation. However there were no significant differences between the fructose and glucose interventions for any of the other fasting blood lipid concentrations measured.
A3.7 A meta-analysis of trials in which diets were supplemented with either crystalline or pure fructose (excluding HFCS) concluded that fructose intakes up to 90g/day reduced concentrations of glycosylated hemoglobin (HbA1c) (Livesey & Taylor, 2008). Significant effects on postprandial triacylglycerols were not evident unless more than 50g fructose/day was consumed, and no significant effects were reported on fasting triacylglycerol concentration or body weight with intakes of 100 g or less fructose/day in adults.
A3.8 A meta-analysis of six trials concluded that supplementation of diets with fructose doses of 36 g/day or less in isoenergetic exchange for other carbohydrates resulted in reduced concentrations of glycosylated hemoglobin (HbA1c) and fasting glucose (Sievenpiper et al., 2012). The small number of trials and their relatively short duration, however, limit the strength of the conclusions.
210
A3.9 There are few data from trials investigating fructose intake as it would be consumed in the typical diet or as HFCS. One trial investigated the effect of consuming different amounts of sucrose- and HFCS-sweetened, low-fat milk as part of an energy restricted diet, on weight loss and fasting blood lipids in overweight and obese subjects (Lowndes et al., 2012). There were no differences in the extent of weight loss and measures of adiposity or fasting blood lipid concentrations between the sucrose- and HFCS-containing diet groups. Another trial by the same authors demonstrated that consuming sucrose or HFCS-sweetened low-fat milk as part of an ad libitum diet had no effect on the amount of fat in the liver or in skeletal muscle or on most fasting blood lipid concentrations. TAG concentrations increased, as did body mass, but this did not differ between the dietary groups (Bravo et al., 2013).
A3.10 Therefore on balance, it is considered that there is insufficient evidence to demonstrate that fructose intake, at levels consumed in the normal UK diet, leads to adverse health outcomes independent of any effects related to its presence as a component of total and free sugars.
211
ANNEX 4
Dietary acids and tooth wear (including dental erosion)
Introduction A4.1 Teeth wear in function, as a consequence there would be an expected increase
in wear with increasing age of the individual. There are also some intrinsic and extrinsic variables, however, that increase the rate of tooth wear. These can act as individual factors but most likely act in combination during any wear process.
A4.2 There are three types of wear described in the dental literature.
A4.3 Abrasion, in which tooth substance is removed by the abrasive action of an external substance or device, for example a ‘smoker’s toothpaste’ or incorrect use of interdental cleaning aids.
A4.4 Attrition in which tooth substance is removed as a consequence of teeth rubbing together in contact, effectively polishing each other, but when combined with a clenching or tooth grinding habit this can result in rapid destruction of teeth.
A4.5 Erosion in which tooth substance is removed as a consequence of its dissolution by acids from either foods or regurgitated gastric content. This type of wear is different to caries because the acids are not generated in the mouth and it occurs at lower pH than the caries process (typically pH of less than 3 compared with 5.5 or 6 for enamel and dentine respectively for caries). As a consequence of the more aggressive acid attack, the sub-surface demineralisation that characterises dental caries does not occur, rather the tooth surface simply dissolves. The dissolution of mineral from either enamel or dentine results in a residual softened surface that can then be worn away much more rapidly by attrition from tooth-to-tooth contact or by contact with the lips, cheeks and tongue or by tooth brushing, or by hard fibrous foods during chewing. In terms of the study of wear this process would more accurately be described as corrosion, but is universally described as erosion in the dental literature.
A4.6 Dental erosion is a multi-factorial condition in which an interplay between chemical (e.g. food acidity and its calcium, phosphorus and fluoride content), biological (e.g. salivary flow, buffering capacity and acquired pellicle) and behavioural factors (e.g. oral hygiene and eating and drinking habits) underlies large inter-individual variation (Lussi & Jaeggi, 2008).
A4.7 The patterns of wear produced by these three different mechanisms have some characteristic features, so for example when wear occurs on a surface of a tooth that cannot be in contact with another, it cannot be produced by attrition. So some attribution of wear mechanisms can be made based on appearance of the teeth. These will tend to be more accurate in younger people where a ‘pure’
212
mechanism may have been acting for a short period of time. In adults this linkage is much more difficult to make as a single observation will show the outcomes of a lifetime’s function and wear.
A4.8 The Children’s Dental Health series of national surveys of oral health reported the prevalence of tooth wear (including dental erosion) in 1993 and 2003. A comparison between the two Children’s Dental Health surveys of 1993 and 2003 observed that there had been little change in the proportion of five-year-olds with tooth wear: 52% in 1993 and 53% in 2003. There was, however, an increase in the prevalence of tooth wear on permanent teeth, which was statistically significant at age 15 where 27% of upper incisors had tooth wear palatally in 1993 compared with 33% in 2003 (Chadwick et al., 2006).
A4.9 The national surveys of Adult Dental Health reported the prevalence of tooth wear (including dental erosion) in 1998 and 2009 (Steele & O’ Sullivan, 2011); the 2009 survey included data from England, Wales and Northern Ireland, but not Scotland. The prevalence of tooth wear in England has increased since the 1998 survey, when two thirds (66%) of the dentate population showed signs of wear compared with over three quarters (76%) in the 2009 survey. There have also been small increases in the proportion of adults with moderate wear, 11% in 1998 compared with 15% in 2009. The greatest increase was in the youngest three age groups; 15 percentage points, 10 percentage points and 13 percentage points for those aged 16 to 24, 25 to 34 and 35 to 44 years, respectively. For adults under the age of 65 moderate and severe tooth wear has increased since 1998, but for those aged 65 and over, there has been a small decrease. While the increase in moderate tooth wear was small, moderate tooth wear in 16 to 34 year olds was suggestive of rapid tooth wear.
A4.10 The study designs for all prospective cohort studies have been considered in the next section, while the study designs for all randomised controlled trials have been considered in the following section. The results from both prospective cohort studies and randomised controlled trials have been considered together for each dietary exposure.
Prospective cohort studies A4.11 The initial search identified three articles, which were assessed as full-text articles.
All three were eligible for inclusion (Lussi & Schaffner, 2000; Dugmore & Rock, 2004; El Aidi et al., 2011).
A4.12 The study design details have been summarised in Table A4.1. All studies investigated tooth wear in mixed and permanent dentition. In one study (Lussi & Schaffner, 2000) the tooth wear indices (facial, oral and occlusal surfaces) were based upon diagnostic criteria used in a previous study (Lussi et al., 1991). Another study assessed tooth wear using the criteria used in the 1993 survey of Children’s Dental Health (Dugmore & Rock, 2004): a Tooth Wear Index that recorded all three main types of tooth wear irrespective of aetiology (Smith & Knight, 1984). For the third study (El Aidi et al., 2011) the criteria for the clinical assessment of tooth wear were a modification (van Rijkom et al., 2002) of diagnostic criteria developed previously (Lussi, 1996).
213

A4.13 Cohort sizes ranged from 55 to 1149 and the follow-up period ranged from two to six years. Dietary assessment was by a simple questionnaire in two studies and by food frequency questionnaire in the other (El Aidi et al., 2011). All studies investigated consumption of acidic foods and drinks in relation to tooth wear. Multivariate logistic regression analysis was used in all studies to explore associations. The confounders considered by the studies investigating carbohydrate and dental caries risk have been summarised in Table A4.2. Only one study reported its funding sources which were mainly commercial (El Aidi et al., 2011); 67% of studies did not report funding sources.
214
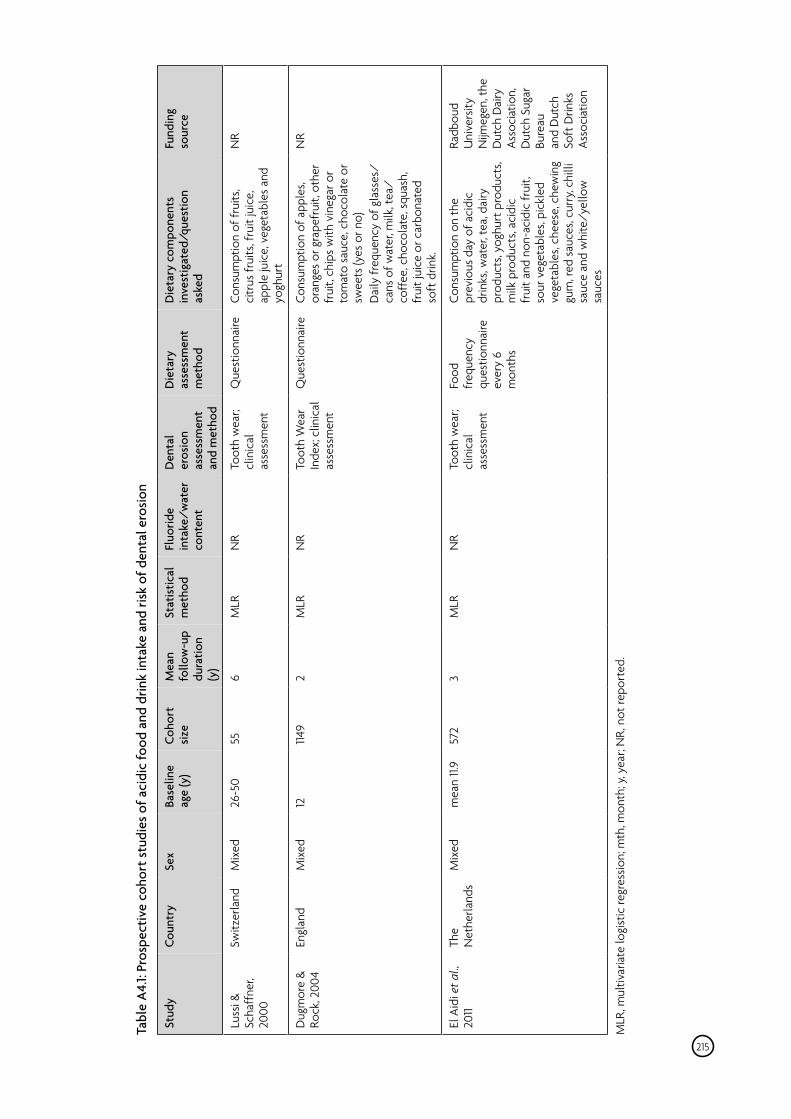
Tabl
e A
4.1:
Pros
pect
ive
coho
rt st
udie
s of a
cidi
c fo
od a
nd d
rink
inta
ke a
nd ri
sk o
f den
tal e
rosio
n
Stud
y Co
untr
y Se
x Ba
selin
eag
e (y
) Co
hort
siz
e M
ean
follo
w-u
pdu
ratio
n (y
)
Stat
istic
al
met
hod
Fluo
ride
inta
ke/w
ater
cont
ent
Den
tal
eros
ion
asse
ssm
ent
and
met
hod
Die
tary
asse
ssm
ent
met
hod
Die
tary
com
pone
nts
inve
stig
ated
/que
stio
n as
ked
Fund
ing
sour
ce
Luss
i &Sc
haff
ner,
2000
Switz
erla
nd
Mix
ed
26-5
0 55
6
MLR
N
R To
oth
wea
r; cl
inic
alas
sess
men
t
Que
stio
nnai
re
yogh
urt
NR
Cons
umpt
ion
of fr
uits
, ci
trus
frui
ts, f
ruit
juic
e,
appl
e ju
ice,
veg
etab
les
and
Dug
mor
e &
Rock
, 200
4 En
glan
d M
ixed
12
114
9 2
MLR
N
R To
oth
Wea
r In
dex;
clin
ical
as
sess
men
t
Cons
umpt
ion
of a
pple
s, or
ange
s or
gra
pefr
uit,
othe
r fr
uit,
chip
s w
ith v
ineg
ar o
r to
mat
o sa
uce,
cho
cola
te o
r
Dai
ly fr
eque
ncy
of g
lass
es/
cans
of w
ater
, milk
, tea
/co
ffee
, cho
cola
te, s
quas
h,
frui
t jui
ce o
r car
bona
ted
NR
Que
stio
nnai
re
swee
ts (y
es o
r no)
soft
drin
k.
El A
idi e
t al.,
20
11 Th
eN
ethe
rland
s M
ixed
m
ean
11.9
572
3 M
LR
Food
fr
eque
ncy
ques
tionn
aire
ev
ery
6 m
onth
s
Cons
umpt
ion
on th
e pr
evio
us d
ay o
f aci
dic
drin
ks, w
ater
, tea
, dai
ry
prod
ucts
, yog
hurt
pro
duct
s, m
ilk p
rodu
cts,
acid
ic
frui
t and
non
-aci
dic
frui
t,so
ur v
eget
able
s, pi
ckle
d ve
geta
bles
, che
ese,
che
win
g gu
m, r
ed s
auce
s, cu
rry,
chill
i sa
uce
and
whi
te/y
ello
w
sauc
es
Radb
oud
Uni
vers
ity
Nijm
egen
, the
D
utch
Dai
ry
Asso
ciat
ion,
D
utch
Sug
ar
Bure
au
and
Dut
ch
Soft
Drin
ks
Asso
ciat
ion
NR
Toot
h w
ear;
clin
ical
asse
ssm
ent
MLR
, mul
tivar
iate
logi
stic
regr
essio
n; m
th, m
onth
; y, y
ear;
NR,
not
repo
rted
.
215
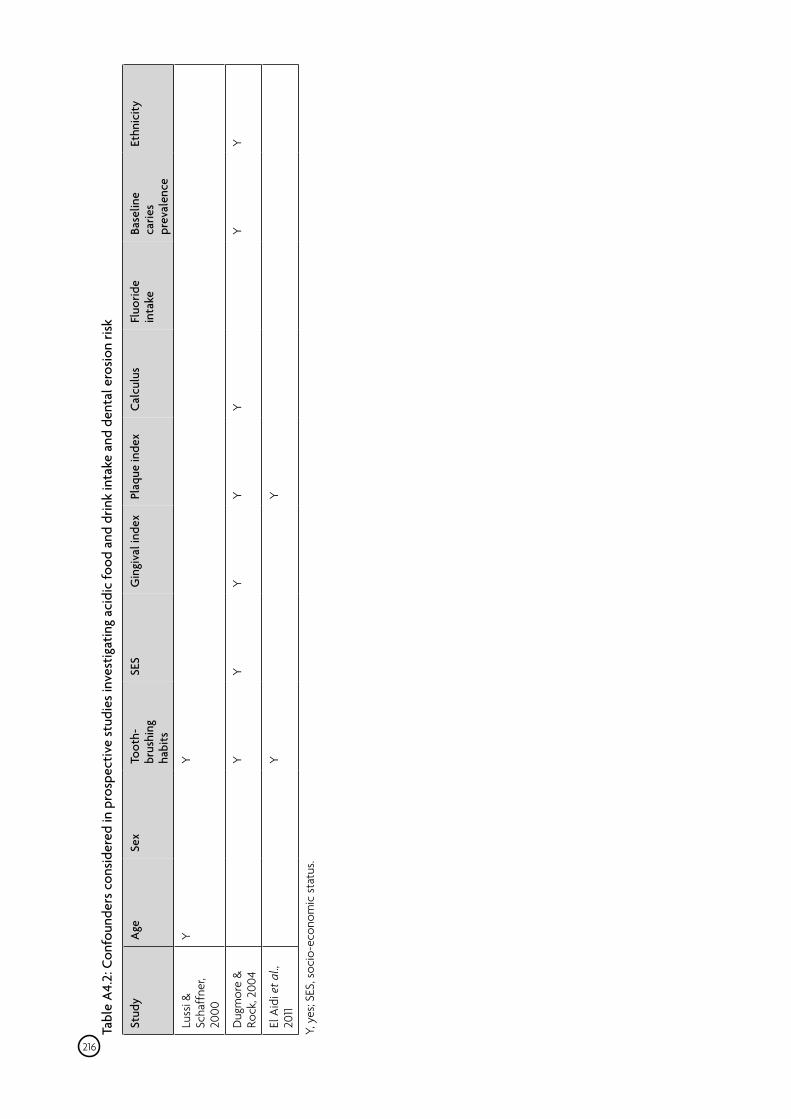
Tabl
e A
4.2:
Con
foun
ders
con
sider
ed in
pro
spec
tive
stud
ies i
nves
tigat
ing
acid
ic fo
od a
nd d
rink
inta
ke a
nd d
enta
l ero
sion
risk
Stud
y A
ge
Sex
Toot
h-br
ushi
ngha
bits
SES
Gin
giva
l ind
ex
Plaq
ue in
dex
Calc
ulus
Fl
uorid
e in
take
Ba
selin
e
carie
spr
eval
ence
Ethn
icity
Luss
i &Sc
haff
ner,
2000
Y Y
Dug
mor
e &
Rock
, 200
4 Y
Y Y
Y Y
Y Y
El A
idi e
t al.,
20
11 Y
Y
Y, y
es; S
ES, s
ocio
-eco
nom
ic s
tatu
s.
216
Randomised controlled trials A4.14 Thirteen studies were identified as eligible (Rugg-Gunn et al., 1998; West et al.,
1998; West et al., 1999; Hughes et al., 1999a; Hughes et al., 1999b; Hughes et al., 2002; West et al., 2003; West et al., 2004; Hooper et al., 2004; Hooper et al., 2005; Venables et al., 2005; Hooper et al., 2007; Caglar et al., 2008).
A4.15 A summary of the trial designs has been given for those trials investigating tooth wear in relation to soft drinks and fruit juices (see Table A4.3). All trials had an in situ design whereby assessment of enamel or dentine blocks contained within intra-oral appliance was investigated. The wear was determined by surface profilometry.
A4.16 The enamel or dentine blocks were exposed to dietary factors by either applying solutions ex vivo, once the intra-oral appliances were removed and then replacing them afterwards, or by exposing dental blocks to dietary factors in vivo, e.g. by eating food or consuming drinks while the intra-oral appliance was being worn. In the trial where solutions were dipped onto the dental blocks, subjects were instructed to remove the intra-oral palatal appliances during meals.
A4.17 All trials were cross-over in design with either no washout period or a washout period ranging from two days to one week. The experimental period ranged from seven to twenty one days. The funding sources were mainly commercial, reflecting product modifications to reduce the erosive potential of soft drinks.
A4.18 One of the trials used a split-mouth intra-oral palatal appliance where the blocks on each side of the mouth were exposed to different test solutions (Rugg-Gunn et al., 1998).
A4.19 In a series of trials by the same authors investigating the effect of fruit juices and soft drinks on dental erosion (see Table A4.3), intra-oral appliances were worn between 9am and 5pm and removed for one hour over lunch (West et al., 1998; Hughes et al., 1999b; Hughes et al., 1999a; West et al., 1999; Hughes et al., 2002; West et al., 2003; Hooper et al., 2004; West et al., 2004; Hooper et al., 2005; Hooper et al., 2007). In another trial, investigating the effect of a malt-based drink on dental erosion, intra-oral appliances were worn between 9am and 4pm and removed for one hour over lunch (Caglar et al., 2008). In one trial investigating the effect of sport drink consumption on enamel loss when subjects participated in planned exercise, the intra-oral appliances were worn during the exercise period between 7:00am and 9:10am (Venables et al., 2005).
A4.20 Most of the trials investigated the effect of modifying soft drinks, by the addition of calcium compounds, to reduce their erosive potential, but this aspect has not been included in the review (Rugg-Gunn et al., 1998; Hughes et al., 1999b; Hughes et al., 1999a; West et al., 1999; Hughes et al., 2002; Hunter et al., 2003; West et al., 2003; Hooper et al., 2004; West et al., 2004; Hooper et al., 2005; Venables et al., 2005; Hooper et al., 2007). Several trials investigated the effect of juice drinks non-calorically sweetened with aspartame, acesulfame K and saccharin.
217
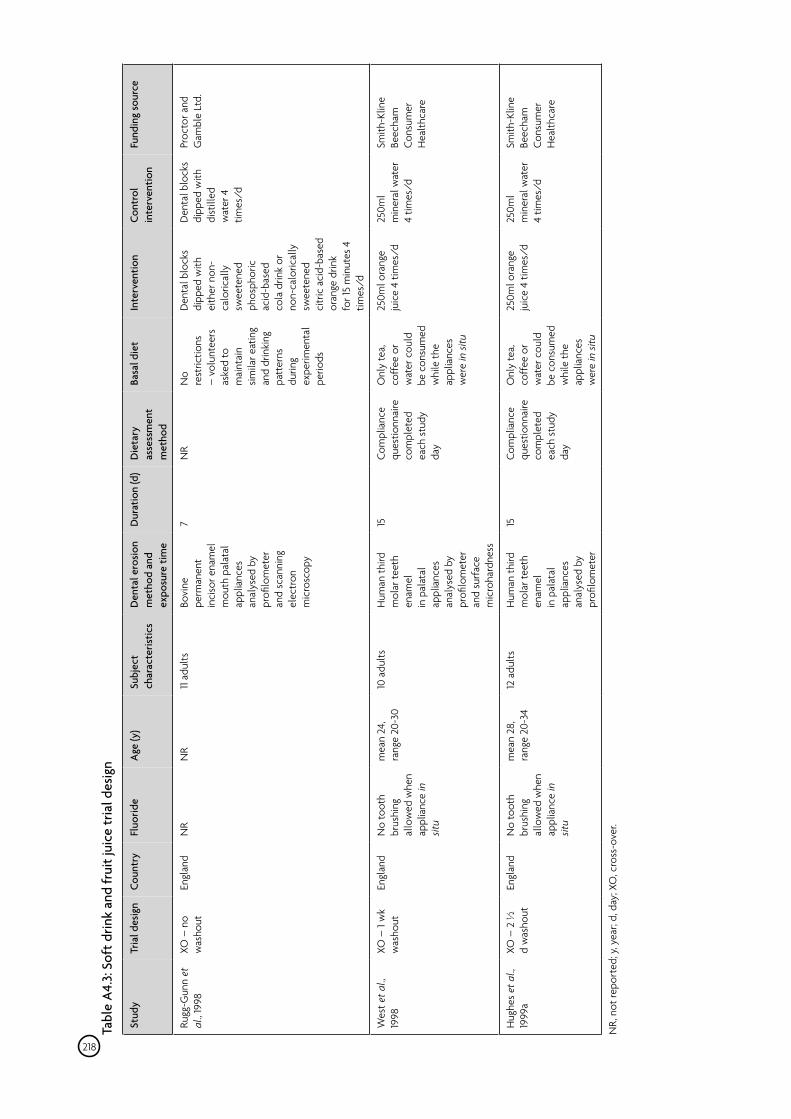
Tabl
e A
4.3:
Sof
t drin
k an
d fr
uit j
uice
tria
l des
ign
Stud
y Tr
ial d
esig
n Co
untr
y Fl
uorid
e A
ge (y
) Su
bjec
tch
arac
teris
tics
Den
tal e
rosio
n m
etho
d an
dex
posu
re ti
me
Dur
atio
n (d
) D
ieta
ryas
sess
men
tm
etho
d
Basa
l die
t In
terv
entio
n Co
ntro
l in
terv
entio
n Fu
ndin
g so
urce
Rugg
-Gun
n et
al
., 19
98
XO –
no
was
hout
En
glan
d N
R N
R 11
adul
ts
Bovi
ne
perm
anen
tin
ciso
r ena
mel
mou
th p
alat
al
appl
ianc
es
anal
ysed
by
profi
lom
eter
an
d sc
anni
ngel
ectr
on
mic
rosc
opy
7 N
R N
ore
stric
tions
–
volu
ntee
rs
aske
d to
m
aint
ain
simila
r eat
ing
and
drin
king
patt
erns
du
ring
expe
rimen
tal
perio
ds
Den
tal b
lock
s di
pped
with
eith
er n
on-
calo
rical
ly
swee
tene
d ph
osph
oric
acid
-bas
edco
la d
rink
or
non-
calo
rical
ly
swee
tene
d ci
tric
aci
d-ba
sed
oran
ge d
rink
for 1
5 m
inut
es 4
tim
es/d
Den
tal b
lock
s di
pped
with
dist
illed
w
ater
4
times
/d
Proc
tor a
nd
Gam
ble
Ltd.
Wes
t et a
l.,
1998
XO
– 1
wk
was
hout
En
glan
d N
o to
oth
brus
hing
allo
wed
whe
n ap
plia
nce
in
situ
mea
n 24
,ra
nge
20-3
0 10
adu
lts
Hum
an th
ird
mol
ar te
eth
enam
elin
pal
atal
ap
plia
nces
an
alys
ed b
y pr
ofilo
met
er
and
surf
ace
mic
roha
rdne
ss
15
Com
plia
nce
ques
tionn
aire
co
mpl
eted
ea
ch s
tudy
day
Onl
y te
a,
coff
ee o
r w
ater
cou
ld
be c
onsu
med
w
hile
the
appl
ianc
es
wer
e in
situ
250m
l ora
nge
juic
e 4
times
/d
250m
lm
iner
al w
ater
4
times
/d
Smith
-Klin
eBe
echa
mCo
nsum
er
Hea
lthca
re
Hug
hes
et a
l.,
1999
a XO
– 2
½
d w
asho
ut
Engl
and
No
toot
h br
ushi
ngal
low
ed w
hen
appl
ianc
e in
sit
u
mea
n 28
,ra
nge
20-3
4 12
adu
lts
Hum
an th
ird
mol
ar te
eth
enam
elin
pal
atal
ap
plia
nces
an
alys
ed b
y pr
ofilo
met
er
15
Com
plia
nce
ques
tionn
aire
co
mpl
eted
ea
ch s
tudy
day
Onl
y te
a,
coff
ee o
r w
ater
cou
ld
be c
onsu
med
w
hile
the
appl
ianc
es
wer
e in
situ
250m
l ora
nge
juic
e 4
times
/d
250m
lm
iner
al w
ater
4
times
/d
Smith
-Klin
eBe
echa
mCo
nsum
er
Hea
lthca
re
NR,
not
repo
rted
; y, y
ear;
d, d
ay; X
O, c
ross
-ove
r.
218
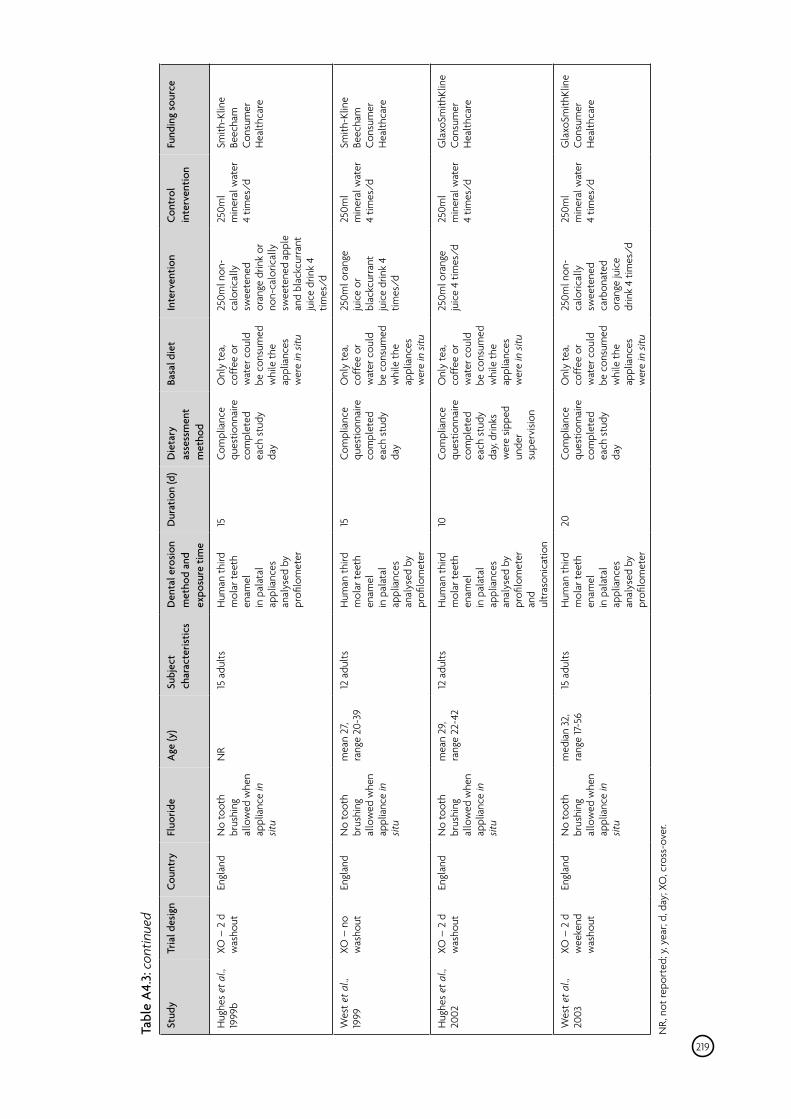
Tabl
e A
4.3:
con
tinue
d
Stud
y Tr
ial d
esig
n Co
untr
y Fl
uorid
e A
ge (y
) Su
bjec
tch
arac
teris
tics
Den
tal e
rosio
n m
etho
d an
dex
posu
re ti
me
Dur
atio
n (d
) D
ieta
ryas
sess
men
tm
etho
d
Basa
l die
t In
terv
entio
n Co
ntro
l in
terv
entio
n Fu
ndin
g so
urce
Hug
hes
et a
l.,
1999
b XO
– 2
d
was
hout
En
glan
d N
o to
oth
brus
hing
allo
wed
whe
n ap
plia
nce
in
situ
NR
15 a
dults
H
uman
third
m
olar
teet
h en
amel
in p
alat
al
appl
ianc
es
anal
ysed
by
profi
lom
eter
15
Com
plia
nce
ques
tionn
aire
co
mpl
eted
ea
ch s
tudy
day
Onl
y te
a,
coff
ee o
r w
ater
cou
ld
be c
onsu
med
w
hile
the
appl
ianc
es
wer
e in
situ
250m
l non
-ca
loric
ally
sw
eete
ned
oran
ge d
rink
or
non-
calo
rical
ly
swee
tene
d ap
ple
and
blac
kcur
rant
ju
ice
drin
k 4
times
/d
250m
lm
iner
al w
ater
4
times
/d
Smith
-Klin
eBe
echa
mCo
nsum
er
Hea
lthca
re
Wes
t et a
l.,
1999
XO
– n
o w
asho
ut
Engl
and
No
toot
h br
ushi
ngal
low
ed w
hen
appl
ianc
e in
sit
u
mea
n 27
, ra
nge
20-3
9 12
adu
lts
Hum
an th
ird
mol
ar te
eth
enam
elin
pal
atal
ap
plia
nces
an
alys
ed b
y pr
ofilo
met
er
15
Com
plia
nce
ques
tionn
aire
co
mpl
eted
ea
ch s
tudy
day
Onl
y te
a,
coff
ee o
r w
ater
cou
ld
be c
onsu
med
w
hile
the
appl
ianc
es
wer
e in
situ
250m
l ora
nge
juic
e or
bl
ackc
urra
nt
juic
e dr
ink
4 tim
es/d
250m
lm
iner
al w
ater
4
times
/d
Smith
-Klin
eBe
echa
mCo
nsum
er
Hea
lthca
re
Hug
hes
et a
l.,
2002
XO
– 2
d
was
hout
En
glan
d N
o to
oth
brus
hing
allo
wed
whe
n ap
plia
nce
in
situ
mea
n 29
, ra
nge
22-4
2 12
adu
lts
Hum
an th
ird
mol
ar te
eth
enam
elin
pal
atal
ap
plia
nces
an
alys
ed b
y pr
ofilo
met
er
and
ultr
ason
icat
ion
10
Com
plia
nce
ques
tionn
aire
co
mpl
eted
ea
ch s
tudy
day,
drin
ks
wer
e sip
ped
unde
rsu
perv
ision
Onl
y te
a,
coff
ee o
r w
ater
cou
ld
be c
onsu
med
w
hile
the
appl
ianc
es
wer
e in
situ
250m
l ora
nge
juic
e 4
times
/d
250m
lm
iner
al w
ater
4
times
/d
Gla
xoSm
ithKl
ine
Cons
umer
H
ealth
care
Wes
t et a
l.,
2003
XO
– 2
d
wee
kend
w
asho
ut
Engl
and
No
toot
h br
ushi
ngal
low
ed w
hen
appl
ianc
e in
sit
u
med
ian
32,
rang
e 17
-56
15 a
dults
H
uman
third
m
olar
teet
h en
amel
in p
alat
al
appl
ianc
es
anal
ysed
by
profi
lom
eter
20
Com
plia
nce
ques
tionn
aire
co
mpl
eted
ea
ch s
tudy
day
Onl
y te
a,
coff
ee o
r w
ater
cou
ld
be c
onsu
med
w
hile
the
appl
ianc
es
wer
e in
situ
250m
l non
-ca
loric
ally
sw
eete
ned
carb
onat
ed
oran
ge ju
ice
drin
k 4
times
/d
250m
lm
iner
al w
ater
4
times
/d
Gla
xoSm
ithKl
ine
Cons
umer
H
ealth
care
NR,
not
repo
rted
; y, y
ear;
d, d
ay; X
O, c
ross
-ove
r.
219
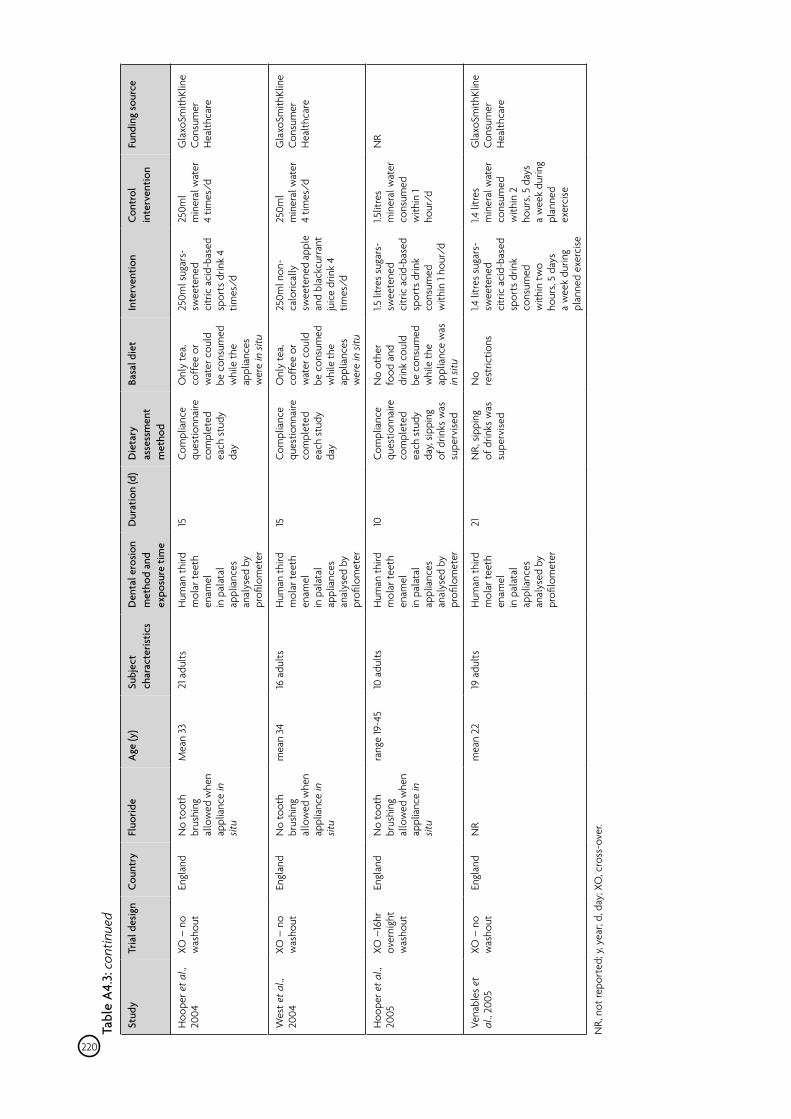
Tabl
e A
4.3:
con
tinue
d
Stud
y Tr
ial d
esig
n Co
untr
y Fl
uorid
e A
ge (y
) Su
bjec
tch
arac
teris
tics
Den
tal e
rosio
n m
etho
d an
dex
posu
re ti
me
Dur
atio
n (d
) D
ieta
ryas
sess
men
tm
etho
d
Basa
l die
t In
terv
entio
n Co
ntro
l in
terv
entio
n Fu
ndin
g so
urce
Hoo
per e
t al.,
20
04
XO –
no
was
hout
En
glan
d N
o to
oth
brus
hing
allo
wed
whe
n ap
plia
nce
in
situ
Mea
n 33
21
adu
lts
Hum
an th
ird
mol
ar te
eth
enam
elin
pal
atal
ap
plia
nces
an
alys
ed b
y pr
ofilo
met
er
15
Com
plia
nce
ques
tionn
aire
co
mpl
eted
ea
ch s
tudy
day
Onl
y te
a,
coff
ee o
r w
ater
cou
ld
be c
onsu
med
w
hile
the
appl
ianc
es
wer
e in
situ
250m
l sug
ars-
swee
tene
d ci
tric
aci
d-ba
sed
spor
ts d
rink
4 tim
es/d
250m
lm
iner
al w
ater
4
times
/d
Gla
xoSm
ithKl
ine
Cons
umer
H
ealth
care
Wes
t et a
l.,
2004
XO
– n
o w
asho
ut
Engl
and
No
toot
h br
ushi
ngal
low
ed w
hen
appl
ianc
e in
sit
u
mea
n 34
16
adu
lts
Hum
an th
ird
mol
ar te
eth
enam
elin
pal
atal
ap
plia
nces
an
alys
ed b
y pr
ofilo
met
er
15
Com
plia
nce
ques
tionn
aire
co
mpl
eted
ea
ch s
tudy
day
Onl
y te
a,
coff
ee o
r w
ater
cou
ld
be c
onsu
med
w
hile
the
appl
ianc
es
wer
e in
situ
250m
l non
-ca
loric
ally
sw
eete
ned
appl
e an
d bl
ackc
urra
nt
juic
e dr
ink
4 tim
es/d
250m
lm
iner
al w
ater
4
times
/d
Gla
xoSm
ithKl
ine
Cons
umer
H
ealth
care
Hoo
per e
t al.,
20
05
XO –
16hr
ov
erni
ght
was
hout
Engl
and
No
toot
h br
ushi
ngal
low
ed w
hen
appl
ianc
e in
sit
u
rang
e 19
-45
10 a
dults
H
uman
third
m
olar
teet
h en
amel
in p
alat
al
appl
ianc
es
anal
ysed
by
profi
lom
eter
10
Com
plia
nce
ques
tionn
aire
co
mpl
eted
ea
ch s
tudy
day,
sippi
ng
of d
rinks
was
su
perv
ised
No
othe
r fo
od a
nd
drin
k co
uld
be c
onsu
med
w
hile
the
appl
ianc
e w
as
in si
tu
1.5 li
tres
sug
ars-
swee
tene
d ci
tric
aci
d-ba
sed
spor
ts d
rink
cons
umed
w
ithin
1 ho
ur/d
1.5lit
res
min
eral
wat
er
cons
umed
w
ithin
1ho
ur/d
NR
Vena
bles
et
al.,
2005
XO
– n
o w
asho
ut
Engl
and
NR
mea
n 22
19
adu
lts
Hum
an th
ird
mol
ar te
eth
enam
elin
pal
atal
ap
plia
nces
an
alys
ed b
y pr
ofilo
met
er
21
NR,
sip
ping
of
drin
ks w
as
supe
rvise
d
No
rest
rictio
ns
1.4 li
tres
sug
ars-
swee
tene
d ci
tric
aci
d-ba
sed
spor
ts d
rink
cons
umed
w
ithin
two
hour
s, 5
days
a
wee
k du
ring
plan
ned
exer
cise
1.4 li
tres
m
iner
al w
ater
co
nsum
ed
with
in 2
hour
s, 5
days
a
wee
k du
ring
plan
ned
exer
cise
Gla
xoSm
ithKl
ine
Cons
umer
H
ealth
care
NR,
not
repo
rted
; y, y
ear;
d, d
ay; X
O, c
ross
-ove
r.
220
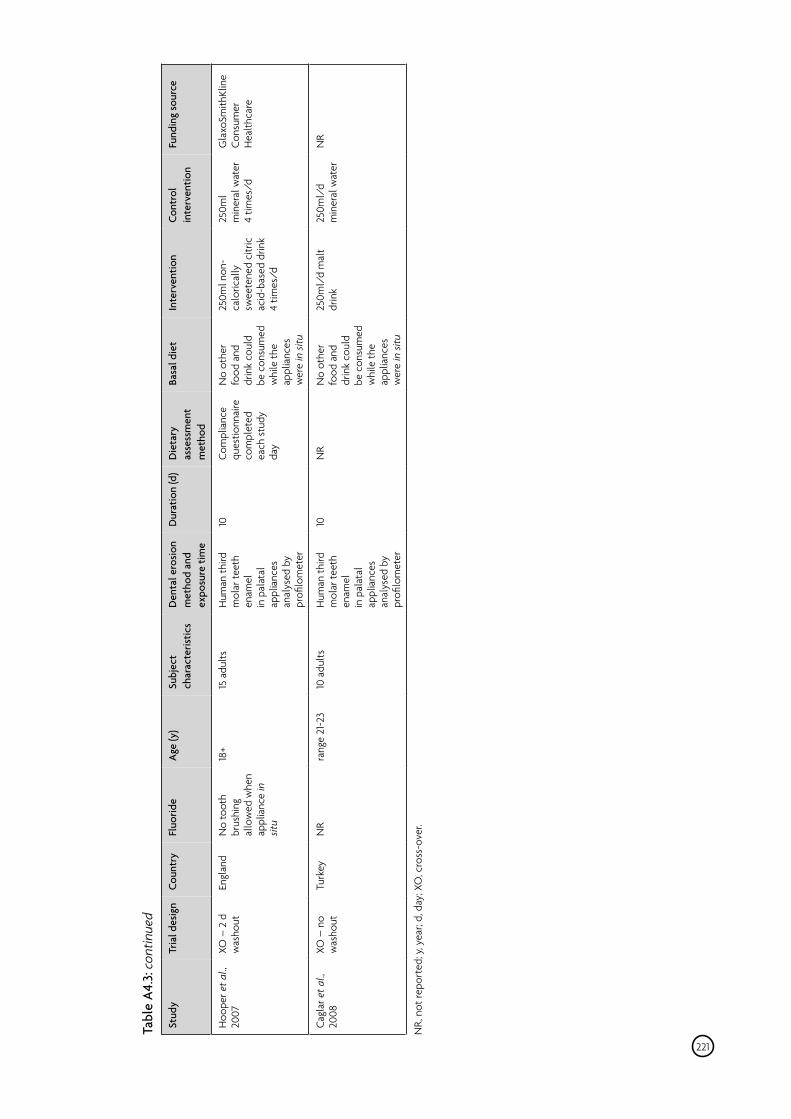
Tabl
e A
4.3:
con
tinue
d
Stud
y Tr
ial d
esig
n Co
untr
y Fl
uorid
e A
ge (y
) Su
bjec
tch
arac
teris
tics
Den
tal e
rosio
n m
etho
d an
dex
posu
re ti
me
Dur
atio
n (d
) D
ieta
ryas
sess
men
tm
etho
d
Basa
l die
t In
terv
entio
n Co
ntro
l in
terv
entio
n Fu
ndin
g so
urce
Hoo
per e
t al.,
XO
– 2
d
Engl
and
N
o to
oth
18+
15 a
dults
H
uman
third
10
Co
mpl
ianc
e N
o ot
her
250m
l non
-25
0ml
Gla
xoSm
ithKl
ine
2007
w
asho
ut
brus
hing
m
olar
teet
h qu
estio
nnai
re
food
and
ca
loric
ally
m
iner
al w
ater
Co
nsum
er
allo
wed
whe
n en
amel
co
mpl
eted
dr
ink
coul
d sw
eete
ned
citr
ic
4 tim
es/d
H
ealth
care
ap
plia
nce
in
in p
alat
al
each
stu
dy
be c
onsu
med
ac
id-b
ased
drin
ksit
u ap
plia
nces
da
y w
hile
the
4 tim
es/d
an
alys
ed b
y ap
plia
nces
pr
ofilo
met
er
w
ere
in si
tu
Cagl
ar e
t al.,
XO
– n
o Tu
rkey
N
R ra
nge
21-2
3 10
adu
lts
Hum
an th
ird
10
NR
No
othe
r 25
0ml/
d m
alt
250m
l/d
NR
2008
w
asho
ut
mol
ar te
eth
food
and
dr
ink
min
eral
wat
er
enam
el
drin
k co
uld
in p
alat
al
be c
onsu
med
ap
plia
nces
w
hile
the
anal
ysed
by
appl
ianc
es
profi
lom
eter
wer
e in
situ
. er
oss-
ov, c
rO
y; X
, yea
r; d,
da
ted;
yep
ort r
, no
NR
221

Risk of bias assessment A4.21 A summary of the risk of bias assessment has been given in Table A4.4.
A4.22 All trials explicitly reported being randomised. Allocation concealment was not reported in any of the trials. One trial reported the method random sequence generation. Only two trials reported having any drop-outs, which ranged from 11-14%. The missing outcome data in these trials were balanced in numbers across intervention groups, with similar reasons for missing data across groups.
A4.23 Due to the nature of the interventions all trials were open to participants since the volunteers were either able to identify the treatments by the flavour and consistency of the solutions or the intervention involved consumption of specific foods. All of the trials reported that the trials were blind with respect to the assessors.
222
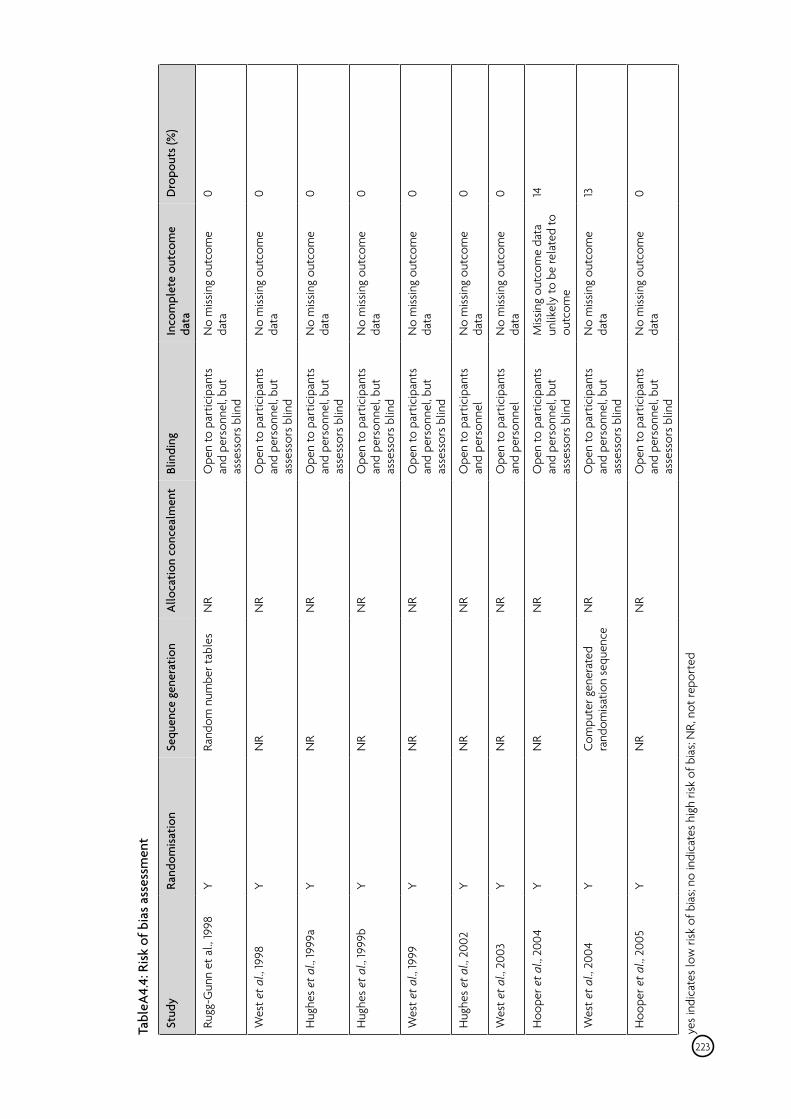
Tabl
eA4.
4: R
isk o
f bia
s ass
essm
ent
Stud
y Ra
ndom
isatio
n Se
quen
ce g
ener
atio
n A
lloca
tion
conc
ealm
ent
Blin
ding
In
com
plet
e ou
tcom
e da
ta
Dro
pout
s (%
)
Rugg
-Gun
n et
al.,
1998
Y
Rand
om n
umbe
r tab
les
NR
Ope
n to
par
ticip
ants
an
d pe
rson
nel,
but
asse
ssor
s bl
ind
No
miss
ing
outc
ome
data
0
Wes
t et a
l., 19
98
Y N
R N
R O
pen
to p
artic
ipan
ts
and
pers
onne
l, bu
tas
sess
ors
blin
d
No
miss
ing
outc
ome
data
0
Hug
hes
et a
l., 19
99a
Y N
R N
R O
pen
to p
artic
ipan
ts
and
pers
onne
l, bu
tas
sess
ors
blin
d da
ta
0N
o m
issin
g ou
tcom
e
Hug
hes
et a
l., 19
99b
Y N
R N
R O
pen
to p
artic
ipan
ts
and
pers
onne
l, bu
tas
sess
ors
blin
d
No
miss
ing
outc
ome
0 da
ta
Wes
t et a
l., 19
99
Y N
R N
R O
pen
to p
artic
ipan
ts
and
pers
onne
l, bu
tas
sess
ors
blin
d
No
miss
ing
outc
ome
data
0
Hug
hes
et a
l., 2
002
Y N
R N
R N
o m
issin
g ou
tcom
e da
ta
0O
pen
to p
artic
ipan
ts
and
pers
onne
l
Wes
t et a
l., 2
003
Y N
R N
R O
pen
to p
artic
ipan
ts
and
pers
onne
l N
o m
issin
g ou
tcom
e da
ta
0
Hoo
per e
t al.,
200
4 Y
NR
NR
Ope
n to
par
ticip
ants
an
d pe
rson
nel,
but
asse
ssor
s bl
ind
Miss
ing
outc
ome
data
un
likel
y to
be
rela
ted
to
outc
ome
14
Wes
t et a
l., 2
004
Y Co
mpu
ter g
ener
ated
ra
ndom
isatio
n se
quen
ce
NR
Ope
n to
par
ticip
ants
an
d pe
rson
nel,
but
asse
ssor
s bl
ind
No
miss
ing
outc
ome
data
13
Hoo
per e
t al.,
200
5 Y
NR
Ope
n to
par
ticip
ants
an
d pe
rson
nel,
but
asse
ssor
s bl
ind
No
miss
ing
outc
ome
data
0
NR
yes
indi
cate
s lo
w ri
sk o
f bia
s; no
indi
cate
s hi
gh ri
sk o
f bia
s; N
R, n
ot re
port
ed
223
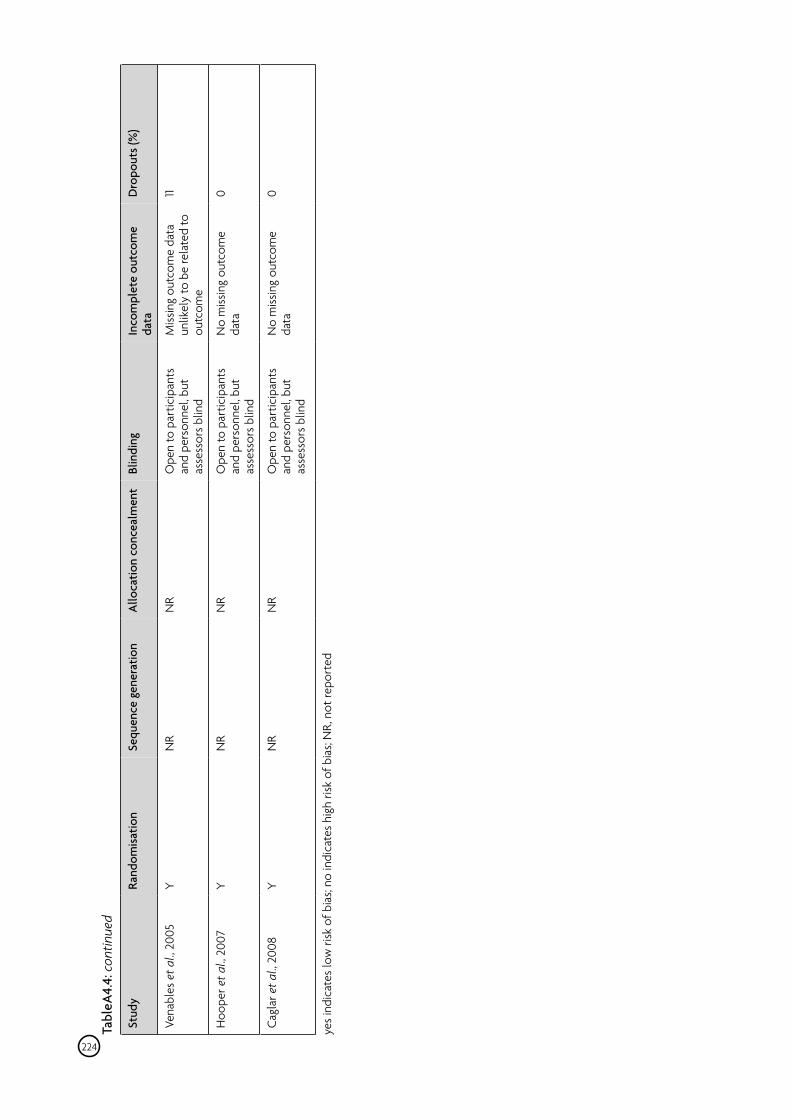
Tabl
eA4.
4: c
ontin
ued
Stud
y Ra
ndom
isatio
n Se
quen
ce g
ener
atio
n A
lloca
tion
conc
ealm
ent
Blin
ding
In
com
plet
e ou
tcom
e da
ta
Dro
pout
s (%
)
Vena
bles
et a
l., 2
005
Y N
R N
R O
pen
to p
artic
ipan
ts
and
pers
onne
l, bu
tas
sess
ors
blin
d
Miss
ing
outc
ome
data
un
likel
y to
be
rela
ted
to
outc
ome
11
Hoo
per e
t al.,
200
7 Y
NR
NR
Ope
n to
par
ticip
ants
an
d pe
rson
nel,
but
asse
ssor
s bl
ind
No
miss
ing
outc
ome
data
0
Cagl
ar e
t al.,
200
8 Y
NR
NR
Ope
n to
par
ticip
ants
an
d pe
rson
nel,
but
asse
ssor
s bl
ind
No
miss
ing
outc
ome
data
0
yes
indi
cate
s lo
w ri
sk o
f bia
s; no
indi
cate
s hi
gh ri
sk o
f bia
s; N
R, n
ot re
port
ed
224
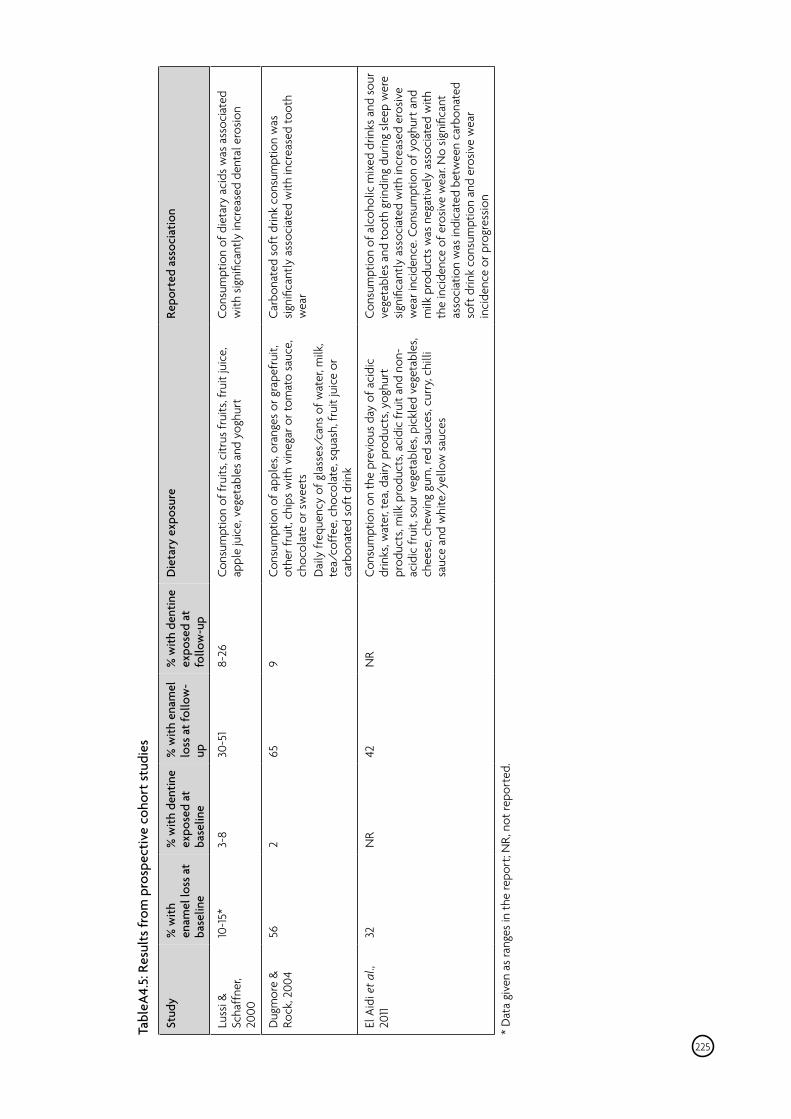
Tabl
eA4.
5: R
esul
ts fr
om p
rosp
ectiv
e co
hort
stud
ies
Stud
y %
with
enam
el lo
ss a
t ba
selin
e
% w
ith d
entin
e ex
pose
d at
ba
selin
e
% w
ith e
nam
ello
ss a
t fol
low
-up
% w
ith d
entin
e ex
pose
d at
fo
llow
-up
Die
tary
exp
osur
e Re
port
ed a
ssoc
iatio
n
Luss
i &Sc
haff
ner,
2000
10-1
5*
3-8
30-5
1 8-
26
Cons
umpt
ion
of fr
uits
, citr
us fr
uits
, fru
it ju
ice,
ap
ple
juic
e, v
eget
able
s an
d yo
ghur
t Co
nsum
ptio
n of
die
tary
aci
ds w
as a
ssoc
iate
d w
ith s
igni
fican
tly in
crea
sed
dent
al e
rosio
n
Dug
mor
e &
Rock
, 200
4 56
2
65
9 Co
nsum
ptio
n of
app
les,
oran
ges
or g
rape
frui
t, ot
her f
ruit,
chi
ps w
ith v
ineg
ar o
r tom
ato
sauc
e,
choc
olat
e or
sw
eets
Dai
ly fr
eque
ncy
of g
lass
es/c
ans
of w
ater
, milk
, te
a/co
ffee
, cho
cola
te, s
quas
h, fr
uit j
uice
or
carb
onat
ed s
oft d
rink
Carb
onat
ed s
oft d
rink
cons
umpt
ion
was
sig
nific
antly
ass
ocia
ted
with
incr
ease
d to
oth
wea
r
El A
idi e
t al.,
20
11 32
N
R 42
N
R Co
nsum
ptio
n on
the
prev
ious
day
of a
cidi
c dr
inks
, wat
er, t
ea, d
airy
pro
duct
s, yo
ghur
t pr
oduc
ts, m
ilk p
rodu
cts,
acid
ic fr
uit a
nd n
on-
chee
se, c
hew
ing
gum
, red
sau
ces,
curr
y, ch
illi
sauc
e an
d w
hite
/yel
low
sau
ces
Cons
umpt
ion
of a
lcoh
olic
mix
ed d
rinks
and
sou
r ve
geta
bles
and
toot
h gr
indi
ng d
urin
g sl
eep
wer
e sig
nific
antly
ass
ocia
ted
with
incr
ease
d er
osiv
e w
ear i
ncid
ence
. Con
sum
ptio
n of
yog
hurt
and
m
ilk p
rodu
cts
was
neg
ativ
ely
asso
ciat
ed w
ith
the
inci
denc
e of
ero
sive
wea
r. N
o sig
nific
ant
asso
ciat
ion
was
indi
cate
d be
twee
n ca
rbon
ated
so
ft d
rink
cons
umpt
ion
and
eros
ive
wea
r in
cide
nce
or p
rogr
essio
n
acid
ic fr
uit,
sour
veg
etab
les,
pick
led
vege
tabl
es,
Dat
a gi
ven
as ra
nges
in th
e re
port
; NR,
not
repo
rted
. *
225
Results A4.24 Data on measures of dietary exposure or interventions used and risk assessment
methods were insufficiently comparable to allow quantitative synthesis.
A4.25 For the following dietary exposures no relevant articles were identified: glycaemic index and glycaemic load, dietary fibre, non-digestible oligosaccharides, polyols, sugar, starch, infant feeding, carbohydrate rich foods and total carbohydrate.
Prospective cohort studies A4.26 The findings from all prospective cohort studies of acidic food and drink
consumption and risk of tooth wear have been summarised in Table A4.5.
A4.27 A small study in adults investigated the association between the consumption of erosive foodstuffs and tooth wear after six years follow-up (Lussi & Schaffner, 2000). An assessment of fruits, citrus fruits, fruit juice, apple juice, vegetables and yoghurt consumption was used to assess dietary acid ingestion. Multiple linear regression analysis revealed age and dietary acid consumption to explain 28% of the variability in the progression of tooth wear between baseline and follow-up. A subgroup analysis of subjects who accounted for most of the total tooth wear progression observed (about a third of cohort subjects) indicated that, compared with the rest of the cohort, their intake of dietary acids and the hardness of their tooth brush bristles were significantly higher and the buffering capacity of their saliva significantly lower.
A4.28 A study of 12 year old children followed-up at 14 years of age reported no significant associations with tooth wear regarding dental cleanliness, gingival health, eating apples, chips with tomato sauce or vinegar, citrus fruit, sweets or chocolate; or drinking coffee, chocolate or squash (Dugmore & Rock, 2004). Experience of caries and carbonated soft drink consumption were observed to increase the chances of tooth wear by around 50%, whilst an orthodontic anomaly, the presence of calculus or consumption of fruits other than apples or citrus types (OR 0.61; 95% CI 0.4, 0.84) appeared to confer a protective effect. High consumption of carbonated drinks increased the odds of erosion being present at 12 years of age by 252% and was a strong predictor of the amount of erosion found at age 14. All odds ratios were adjusted for all variables, both significant and non-significant.
A4.29 The relationship between a broad collection of food items and the incidence and progression of erosive tooth wear among adolescents was investigated in one study (El Aidi et al., 2011). Incidence was defined as the percentage of subjects without tooth wear at baseline developing tooth wear over the course of the study. Progression was defined as the percentage of subjects with tooth wear at baseline showing an increase in severity score at the final examination. In multivariate analyses significant associations were indicated between the incidence of erosive tooth wear and alcoholic mixed drinks (odds ratio, OR 1.82; 95% CI 1.03, 3.23), sour vegetables (OR 1.16; 95% CI 1.02, 1.32) and tooth grinding during sleep (OR 4.03; 95% CI 1.09, 13.67). The intake of yoghurt products was negatively associated with the incidence of erosive wear (OR 0.79; 95% CI 0.66, 0.94). Erosive wear was less
226
likely to progress in subjects who consumed milk and yoghurt products (OR 0.89; 95% CI 0.82, 0.97 and 0.76; 95% CI 0.60, 0.98, respectively). Yoghurt, despite a low pH, has hardly any erosive effect in vitro due to its high calcium and phosphate content (Lussi et al., 2004). Carbonated soft drink consumption was not associated with either the incidence (OR 1.03; 95% CI .0.99, 1.08) or progression (OR 0.97; 95% CI 0.91, 1.02) of erosive tooth wear and nor were any of the other acidic drinks investigated.
A4.30 To test whether interaction between factors gave an added or reduced risk, both the incidence and progression model were extended with interactions between the combined acidic products (carbonated soft drink, fruit lemonade, lemonade squash, energy/sports drink, alcoholic mixed drink and sour vegetables) and biological factors. The interaction of acidic products and tooth grinding resulted in a significant extra risk (OR 1.20; 95% CI 1.01, 1.42). Overall this study indicates that factors such as tooth grinding during sleep play a large role in tooth wear in the cohort studied. The consumption of carbonated soft drinks in this cohort (mean intake of 8.8 glasses/week) was lower than that indicated in the Dugmore & Rock study where a positive association between carbonated soft drink and tooth wear was found: 40.9% of the 12-year-olds drank three or more glasses per day; by the age of 14 this increased to 45% (Dugmore & Rock, 2004). The prevalence of dental erosion in the cohort studied by Dugmore and Rock was also higher than that indicated in the cohort studied by El Aidi et al.
Randomised controlled trials A4.31 The findings from all trials investigating the effect of acidic food and drink on
tooth wear have been summarised in Table A4.6. As many of the trials provide no variance data only the means for enamel erosion have been tabulated.
A4.32 One trial investigated the effect on bovine enamel dental block demineralisation in response to either water, a non-calorically sweetened phosphoric acid-based cola drink (pH 3.1) or a non-calorically sweetened citric acid-based orange drink (pH 3.6) for 15 minutes four times a day for one week (Rugg-Gunn et al., 1998). The exposure of enamel slabs to the phosphoric acid-based cola drink resulted in a deeper depth of enamel loss, as determined by profiling casts of the enamel slabs and scanning electron microscopy, compared with the distilled water control. There was no difference in depth of enamel loss between distilled water and the citric acid-based orange drink treatments. The finding that non-calorically sweetened phosphoric acid-based cola drink was more erosive to enamel than the non-calorically sweetened citric acid-based orange drink suggested that the pH of the drink may have been a factor.
227

ear
ooth
woo
d an
d dr
ink
on t
ect o
f aci
dic
ftin
g th
e ef
fve
stig
aTa
ble
A4.
6: R
esul
ts o
f tria
ls in
Stud
y In
terv
entio
n Co
ntro
l ena
mel
lesio
n de
pth
Inte
rven
tion
enam
el le
sion
dept
h Re
sult
s
Rugg
-Gun
n et
al.,
1998
non-
calo
rical
ly s
wee
tene
d ph
osph
oric
dept
h of
loss
of e
nam
el
dept
h of
loss
of e
nam
el 12
.8µm
Th
e in
terv
entio
n sig
nific
antly
incr
ease
d ac
id-b
ased
col
a dr
ink
3.8µ
m
enam
el s
urfa
ce lo
ss
non-
calo
rical
ly s
wee
tene
d ci
tric
aci
d-ba
sed
dept
h of
loss
of e
nam
el 5
.9µm
N
o ef
fect
or
ange
drin
k
Wes
t et a
l., 19
98
oran
ge ju
ice
de
pth
of g
ain
of e
nam
el
dept
h of
loss
of e
nam
el 2
.77µ
m
The
inte
rven
tion
signi
fican
tly in
crea
sed
0.05
µm
enam
el s
urfa
ce lo
ss
Hug
hes
et a
l., 19
99a
oran
ge ju
ice
de
pth
of lo
ss o
f ena
mel
de
pth
of lo
ss o
f ena
mel
2.5
4µm
Th
e in
terv
entio
n sig
nific
antly
incr
ease
d 0.
19µm
en
amel
sur
face
loss
Hug
hes
et a
l., 19
99b
non-
calo
rical
ly s
wee
tene
d or
ange
drin
k
dept
h of
loss
of e
nam
el
dept
h of
loss
of e
nam
el 8
.29µ
m
The
inte
rven
tion
signi
fican
tly in
crea
sed
0.08
µm
enam
el s
urfa
ce lo
ss
non-
calo
rical
ly s
wee
tene
d ap
ple
and
dept
h of
loss
of e
nam
el 2
.04µ
m
The
inte
rven
tion
signi
fican
tly in
crea
sed
blac
kcur
rant
juic
e dr
ink
enam
el s
urfa
ce lo
ss
Wes
t et a
l., 19
99
oran
ge ju
ice
de
pth
of lo
ss o
f ena
mel
de
pth
of lo
ss o
f ena
mel
1.70
µm
The
inte
rven
tion
signi
fican
tly in
crea
sed
0.05
µm
enam
el s
urfa
ce lo
ss
suga
rs-s
wee
tene
d bl
ackc
urra
nt ju
ice
drin
k de
pth
of lo
ss o
f ena
mel
2.7
5µm
Th
e in
terv
entio
n sig
nific
antly
incr
ease
d en
amel
sur
face
loss
Hug
hes
et a
l., 2
002
oran
ge ju
ice
de
pth
of lo
ss o
f ena
mel
de
pth
of lo
ss o
f ena
mel
2.0
3µm
Th
e in
terv
entio
n sig
nific
antly
incr
ease
d 0.
18µm
en
amel
sur
face
loss
Wes
t et a
l., 2
003
non-
calo
rical
ly s
wee
tene
d ca
rbon
ated
ora
nge
dept
h of
loss
of e
nam
el
dept
h of
loss
of e
nam
el 4
.92µ
m
The
inte
rven
tion
signi
fican
tly in
crea
sed
drin
k 0.
11µm
en
amel
sur
face
loss
Hoo
per e
t al.,
200
4
suga
rs-s
wee
tene
d ci
tric
aci
d-ba
sed
spor
ts
dept
h of
loss
of e
nam
el
dept
h of
loss
of e
nam
el 3
.91µ
m
The
inte
rven
tion
signi
fican
tly in
crea
sed
drin
k 0.
01µm
en
amel
sur
face
loss
Wes
t et a
l., 2
004
no
n-ca
loric
ally
sw
eete
ned
appl
e an
d N
R de
pth
of lo
ss o
f ena
mel
4.6
7µm
Th
e in
terv
entio
n sig
nific
antly
incr
ease
d bl
ackc
urra
nt ju
ice
drin
k en
amel
sur
face
loss
ted.
ep
ort r
, no
NR
228

cont
inue
d Ta
ble
A4.
6:
Stud
y In
terv
entio
n Co
ntro
l ena
mel
lesio
n In
terv
entio
n en
amel
lesio
n de
pth
Resu
lts
dept
h
Hoo
per e
t al.,
200
5 su
gars
-sw
eete
ned
citr
ic a
cid-
base
d sp
orts
de
pth
of lo
ss o
f ena
mel
de
pth
of lo
ss o
f ena
mel
4.0
8µm
Th
e in
terv
entio
n sig
nific
antly
incr
ease
d dr
ink
0.04
µm
enam
el s
urfa
ce lo
ss
Vena
bles
et a
l., 2
005
suga
rs-s
wee
tene
d ci
tric
aci
d-ba
sed
spor
ts
dept
h of
loss
of e
nam
el
dept
h of
loss
of e
nam
el 4
.24µ
m
The
inte
rven
tion
signi
fican
tly in
crea
sed
drin
k 0.
14µm
en
amel
sur
face
loss
Hoo
per e
t al.,
200
7 no
n-ca
loric
ally
sw
eete
ned
citr
ic a
cid-
base
d de
pth
of lo
ss o
f ena
mel
de
pth
of lo
ss o
f ena
mel
6.0
4µm
Th
e in
terv
entio
n sig
nific
antly
incr
ease
d dr
ink
0.00
µm
enam
el s
urfa
ce lo
ss
Cagl
ar e
t al.,
200
8 m
alt-
base
d dr
ink
dept
h of
loss
of e
nam
el
dept
h of
loss
of e
nam
el 0
.59µ
m
The
inte
rven
tion
signi
fican
tly in
crea
sed
0.26
µm
enam
el s
urfa
ce lo
ss
ted.
ep
ort r
, no
NR
229
A4.33 Three trials investigated the effect of one litre a day of orange juice (pH 3.7-3.9) consumed over fifteen days on dental erosion in relation to a water control (West et al., 1998; Hughes et al., 1999a; West et al., 1999). All demonstrated a progressive loss of enamel with time during the orange juice consumption period, but not the water consumption period, as determined by profiling the enamel slabs during the intervention period. After fifteen days the mean enamel loss ranged from 1.70 – 2.77µm following orange juice consumption, while water consumption had little effect on enamel loss, 0.05 – 0.19µm. One trial also performed a surface microhardness analysis of enamel that had either been exposed or not exposed to the oral environment (PVC tape was used to cover part of the enamel to prevent exposure during the experimental periods) (West et al., 1998). There was no difference in demineralisation between the exposed and unexposed areas after the water consumption period, but following the orange juice consumption period the exposed enamel was significantly different from the unexposed enamel. The exposed-unexposed difference was greater for orange juice than for water (p=0.049).
A4.34 One trial investigated the effect of one litre a day of orange juice (pH 3.3) consumed over ten days on dental erosion in relation to a water control (Hughes et al., 2002). There was a progressive loss of enamel with time during the orange juice consumption period, but not the water consumption period, as determined by profiling the enamel slabs during the intervention period. After fifteen days the mean enamel loss was 2.03µm following orange juice consumption, while water consumption had little effect on enamel loss, 0.18µm. The mean softening depth of the enamel was determined using ultrasonication. Orange juice consumption resulted in a deeper softening depth of the enamel than water consumption.
A4.35 The effect of one litre a day of non-calorically sweetened orange drink (pH 3.0) and a non-calorically sweetened apple and blackcurrant juice drink (pH 3.4) over fifteen days on dental erosion was investigated in relation to a water control (Hughes et al., 1999b). A progressive loss of enamel with time was demonstrated during the orange drink and apple and blackcurrant drink consumption periods, but not the water consumption period, as determined by profiling the enamel slabs during the intervention period. After fifteen days the mean enamel loss was 8.29µm following non-calorically sweetened orange drink and was 2.04µm following non-calorically sweetened apple and blackcurrant juice drink, while water consumption had little effect on enamel loss, 0.08µm.
A4.36 Another trial also investigated the effect of a non-calorically sweetened blackcurrant juice drink (pH 3.6) over fifteen days on dental erosion in relation to a water control (West et al., 2004). A progressive loss of enamel with time was demonstrated during the apple and blackcurrant drink consumption periods, but not the water consumption period, as determined by profiling the enamel slabs during the intervention period. After fifteen days the mean difference in enamel loss between the non-calorically sweetened apple and blackcurrant juice drink and water consumption was 4.67µm (p<0.001).
230
A4.37 The effect of one litre a day of sugars-sweetened blackcurrant juice drink (pH 2.9) over fifteen days on dental erosion was investigated in relation to orange juice and a water control (West et al., 1999). A progressive loss of enamel with time was demonstrated during the blackcurrant juice drink consumption period, but not the water consumption period, as determined by profiling the enamel slabs during the intervention period. After fifteen days the mean enamel loss was 2.75µm following sugars-sweetened blackcurrant juice drink consumption, while water consumption had little effect on enamel loss, 0.05µm.
A4.38 Carbonated drinks are potentially more erosive than non-carbonated drinks due to the additional carbonic acid present. The effect of one litre a day of non-calorically sweetened carbonated orange juice drink (pH 3.1) over twenty days on dental erosion was investigated in relation to a water control (West et al., 2003). A progressive loss of enamel with time was demonstrated during the non-calorically sweetened carbonated orange juice drink consumption period, but not the water consumption period, as determined by profiling the enamel slabs during the intervention period. After fifteen days the mean enamel loss was 3.19µm and after twenty days this was 4.92µm following non-calorically sweetened carbonated orange juice drink consumption, while water consumption had little effect on enamel loss, 0.11µm after twenty days.
A4.39 The effect of one litre a day of sugars-sweetened citric acid-based sports drink (pH 3.2) over fifteen days on dental erosion was investigated in relation to a water control (Hooper et al., 2004). A progressive loss of enamel with time was demonstrated during the sugars-sweetened citric acid-based sports drink consumption period, but not the water consumption period, as determined by profiling the enamel slabs during the intervention period. After fifteen days the mean enamel loss was 3.91µm following sugars-sweetened citric acid-based sports drink consumption, while water consumption had little effect on enamel loss, mean erosion 0.01µm.
A4.40 The effect of one and a half litres a day of sugars-sweetened citric acid-based sports drink (pH 3.2), consumed within one hour, over ten days on dental erosion was investigated in relation to a water control (Hooper et al., 2005). A progressive loss of enamel at five and ten days duration was demonstrated during the sugars-sweetened citric acid-based sports drink consumption period, but not the water consumption period, as determined by profiling the enamel slabs during the intervention period. After ten days the mean enamel loss was 4.08µm following sugars-sweetened citric acid-based sports drink consumption, while water consumption had little effect on enamel loss, mean erosion 0.04µm.
A4.41 The effect of 1.4 litres sugars-sweetened citric acid-based sports drink (pH 3.2) consumed within two hours, five days a week during planned exercise on dental erosion was investigated in relation to a water control over twenty one days (Venables et al., 2005). After twenty one days, of exposure, the mean enamel loss, as determined by profiling the enamel slabs, was 4.24µm following sugars-sweetened citric acid-based sports drink consumption, while water consumption had little effect on enamel loss, mean erosion 0.14µm.
231
A4.42 The effect of one litre a day of non-calorically sweetened citric acid-based drink (pH 3.4) over ten days on dental erosion was investigated in relation to a water control (Hooper et al., 2007). A progressive loss of enamel with time was demonstrated during the non-calorically sweetened citric acid-based drink consumption period, but not the water consumption period, as determined by profiling the enamel slabs during the intervention period. After fifteen days the mean enamel loss was 6.04µm following non-calorically sweetened citric acid-based drink consumption, while water consumption had no effect on enamel loss, mean erosion 0.00µm.
A4.43 The effect of 250ml a day of a malt-based drink (pH 4.3) over ten days on dental erosion was investigated in relation to a water control (Caglar et al., 2008). After ten days the mean enamel loss was higher (0.59µm) following non-calorically sweetened citric acid-based drink consumption, while water consumption had less effect on enamel loss, mean erosion 0.26µm.
A4.44 In all trials a large degree of variation in enamel loss was demonstrated, with some subjects showing negligible erosion and others showing large degrees of erosion, e.g. the range of responses in one trial in response to acidic soft drink consumption was 0.07µm to 22.06µm enamel erosion (Hooper et al., 2007).
Summary and conclusions A4.45 Prospective cohort studies of acidic food and drink consumption and risk of tooth
wear provided some evidence that a higher consumption of dietary acids may result in more tooth wear. In situ trials demonstrated that consumption of fruit juices (e.g. orange juice and apple and blackcurrant juice) and acidic soft drinks and sports drinks (whether non-calorically sweetened or sugars-sweetened) resulted in a progressive loss of enamel and dentine from dental blocks. No direct comparison between non-calorically sweetened soft drinks and sugars-sweetened soft drinks on dental erosion was conducted in the trials included. Individuals showed a large degree of variation in response to the erosive challenge ranging from almost negligible erosion to large degrees of erosion, reflecting the multi-factorial nature of dental erosion.
232
ANNEX 5
Fibre isolates
A5.1 Prospective cohort studies and randomised controlled trials investigating the relationship between dietary fibre and whole grains intake and cardio-metabolic, colo-rectal and oral health outcomes are discussed in chapter 8. Randomised controlled trials investigating the relationship between dietary fibre isolates and cardio-metabolic health and colo-rectal health outcomes are considered separately in this annex. No randomised trials were conducted in children and adolescents.
A5.2 Evidence on health/disease outcomes has been discussed in detail only where there are sufficient data for a conclusion to be drawn, from studies meeting the pre-agreed inclusion criteria. Outcomes where there are too few such studies to reach a conclusion, are listed at the end of the chapter (see Table A5.1).
Psyllium A5.3 Psyllium husk is a source of soluble fibre found in dietary supplements.
Fasting blood lipids A5.4 Two randomised controlled trials were identified that presented evidence
on psyllium supplements in relation to fasting blood lipids (total cholesterol; HDL- and LDL- cholesterol and triacylglycerol concentration) (Bell et al., 1990; Romero et al., 1998). One trial was subsequently identified in the update search (Pal et al., 2011) (Cardio-metabolic review, hyperlipidaemias and blood lipid chapter; Update search). Body weights were unchanged in all trials.
A5.5 An effect of psyllium supplements on lowering fasting total cholesterol and LDL-cholesterol concentration is reported in all three trials.
A5.6 No significant effect of psyllium supplementation on either fasting HDL-cholesterol or triacylglycerol concentration is reported in any of the trials.
Psyllium and fasting total cholesterol concentration
• Effect • Limited evidence • The direction of the effect demonstrates consumption of psyllium supplements is
beneficial to health • The effect is biologically relevant, but only achieved through psyllium
supplementation
233
Psyllium and fasting LDL-cholesterol concentration
• Effect • Limited evidence • The direction of the effect demonstrates consumption of psyllium supplements is beneficial to health • The effect is biologically relevant, but only achieved through psyllium supplementation
Fasting HDL-cholesterol or triacylglycerol concentration
• No effect • Limited evidence
Faecal weight and intestinal transit time A5.7 Four randomised controlled trials were identified that presented evidence on
psyllium supplements in relation to faecal weight and intestinal transit time (Spiller et al., 1979; Stevens et al., 1988; Marteau et al., 1994; Vuksan et al., 2008). The transit time methodologies were insufficiently comparable to allow a meta-analysis to be performed. No further trials were identified in the update search (Colo-rectal health review).
A5.8 An effect of psyllium supplements (10-19g/d dietary fibre) on increasing faecal weight is demonstrated in all trials. Two trials compare the effects of wheat bran and psyllium on increasing faecal weight: one reports a greater effect using a mixture of psyllium and wheat bran compared with wheat bran alone (Vuksan et al., 2008); the other reports wheat bran and psyllium have similar effects on increasing faecal weight (Stevens et al., 1988). One trial compares psyllium to a cellulose/pectin mixture and reports both equally increase faecal wet weight, but only cellulose/pectin mixture significantly decreases intestinal transit time (Spiller et al., 1979). None of the trials report a significant effect of psyllium supplements on reducing intestinal transit time.
Psyllium and faecal weight
• Effect • Limited evidence • The direction of the effect demonstrates consumption of psyllium supplements is potentially beneficial to health • The effect is potentially biologically relevant, but only achieved through psyllium supplementation
Psyllium and intestinal transit time
• No effect • Limited evidence
234
Constipation A5.9 Four randomised controlled trials were identified that presented evidence on
psyllium supplements in relation to constipation symptoms in outpatients with constipation or patients with self-reported constipation (Fenn et al., 1986; Ashraf et al., 1995; Cheskin et al., 1995; Ashraf et al., 1997). The data were insufficiently comparable to enable a meta-analysis to be performed. No further trials were identified in the update search (Colo-rectal health review).
A5.10 An effect of psyllium supplements on increasing bowel motion frequency is demonstrated in three trials. The other trial reports a non-significant tendency for psyllium supplements to increase bowel motion frequency (Cheskin et al., 1995). An effect of psyllium supplements on improving faecal consistency and abdominal pain is reported in the two larger trials (Fenn et al., 1986; Ashraf et al., 1995), but the other two trials report no effect.
Psyllium and frequency of bowel movements
• Effect • Moderate evidence • The direction of the effect demonstrates consumption of psyllium supplements is beneficial to health • The effect is biologically relevant, but only achieved through psyllium supplementation
Psyllium and faecal consistency and abdominal pain
• Effect • Limited evidence • The direction of the effect demonstrates consumption of psyllium supplements is beneficial to health • The effect is biologically relevant, but only achieved through psyllium supplementation
Pectin Faecal weight and intestinal transit time
A5.11 Three randomised controlled trials were identified that presented evidence on purified pectin in relation to relation to faecal weight and intestinal transit times (Spiller et al., 1980; Stasse-Wolthuis et al., 1980; Hillman et al., 1983). The transit time methodologies were insufficiently comparable to allow a meta-analysis to be performed. No further trials were identified in the update search (Colo-rectal health review).
A5.12 No significant effect is demonstrated for purified pectin (5-15g/day) on faecal weight or intestinal transit time.
Pectin and faecal weight and intestinal transit time
• No effect • Limited evidence
235
Cellulose Faecal weight and intestinal transit time
A5.13 Three randomised controlled trials were identified that presented evidence on cellulose in relation to faecal weight and intestinal transit times (Spiller et al., 1980; Hillman et al., 1983; Behall et al., 1987). The transit time methodologies were insufficiently comparable to allow a meta-analysis to be performed. No further trials were identified in the update search (Colo-rectal health review).
A5.14 An effect of cellulose (14-23g/day) is demonstrated on increasing faecal weight in all trials. Two trials report an effect of cellulose on reducing intestinal transit time, but one trial reports no significant effect in subjects with a relatively fast initial intestinal transit time (Behall et al., 1987). The effect sizes are comparable to wheat fibre.
Cellulose and faecal weight and intestinal transit time
• Effect • Moderate evidence • The direction of the effect demonstrates consumption of cellulose is potentially beneficial to health • The effect is potentially biologically relevant, but demonstrated at concentration of intake achieved through supplementation
236
Mixed isolated fibres Isolated gums and gelling agents
Blood Pressure A5.15 Seven randomised controlled trials were identified that presented evidence on
isolated gums and gelling agents in relation to blood pressure (Bell et al., 1990; Landin et al., 1992; Pasman et al., 1997a; Marett & Slavin, 2004; Lehtimaki et al., 2005; Schwab et al., 2006; Wood et al., 2007). Two trials could not be included in a meta-analysis as they did not report the necessary data (Pasman et al., 1997a; Marett & Slavin, 2004) (Cardio-metabolic review, incident hypertension and blood pressure chapter). The trials included in the analysis supplemented subjects’ diets with either pectin, guar gum, chitosan, or konjac mannan.
A5.16 No significant effect is demonstrated for various isolated gums and gelling agent supplements on systolic blood pressure (-0.82mmHg, 95% CI -5.2, 3.6; p=0.72).
A5.17 No consistent effect is demonstrated for various isolated gums and gelling agent supplements on diastolic blood pressure on the forest plot. Furthermore the heterogeneity was above the pre-specified cut-off of 75% (I2=81%) therefore, the pooled estimate has not been reported.
A5.18 The two trials that are not included in the meta-analysis report no significant effect of either guar gum or arabino-galactans on blood pressure (Pasman et al., 1997a; Marett & Slavin, 2004).
Isolated gums and gelling agent supplements and systolic or diastolic blood pressure
• No effect • Moderate evidence
Fasting blood lipids A5.19 Thirteen randomised controlled trials were identified that presented evidence on
isolated gums and gelling agents in relation to fasting blood lipids (Bell et al., 1990; Ryle et al., 1990; Landin et al., 1992; Vido et al., 1993; Mee & Gee, 1997; Pasman et al., 1997b; Panlasigui et al., 2003; Marett & Slavin, 2004; Lehtimaki et al., 2005; Schwab et al., 2006; Garcia et al., 2006; Wood et al., 2007; Reppas et al., 2009) Two trials could not be included in a meta-analysis (Vido et al., 1993; Pasman et al., 1997b), but demonstrated no significant effect of fibre isolates and gum supplements on fasting blood lipids. One trial only provided data for fasting triacylglycerol concentration (Landin et al., 1992). No further trials were identified in the update search (Cardio-metabolic review, hyperlipidaemia and blood lipids chapter). Three of the trials demonstrated differential weight loss between experimental groups (Vido et al., 1993; Schwab et al., 2006; Wood et al., 2007). The trials compared guar gum, pectin, gum arabic, carrageenan, arabinogalactan, chitosan, arabinoxylan, konjac mannan or methylcellulose supplements with a control or placebo.
A5.20 No significant effect is demonstrated for various isolated gums and gelling agent supplements on fasting total cholesterol concentration (-0.15mmol/L, 95% CI -0. 32, 0.01; p=0.07). A borderline non-significant effect is demonstrated.
A5.21 No significant effect is demonstrated for various isolated gums and gelling agent supplements on fasting LDL-cholesterol concentration (-0.09mmol/L, 95% CI -0.25, 0.07; p=0.29).
A5.22 No significant effect is demonstrated for various isolated gums and gelling agent supplements on fasting HDL-cholesterol concentration (0.0mmol/L, 95% CI -0.04, 0.05; p=0.89).
A5.23 No significant effect is demonstrated for various isolated gums and gelling agent supplements on fasting triacylglycerol concentration (-0.01mmol/L, 95% CI -0.09, 0.07; p=0.84).
Isolated gums and gelling agent supplements and fasting total cholesterol concentration
• No effect • Limited evidence
Isolated gums and gelling agent supplements and fasting HDL-cholesterol concentration
• No effect • Moderate evidence
237
Isolated gums and gelling agent supplements and fasting LDL-cholesterol concentration
• No effect • Limited evidence
Isolated gums and gelling agent supplements and fasting triacylglycerol concentration
No effect Adequate evidence
Energy intake A5.24 Eleven randomised controlled trials were identified that presented evidence on
isolated gums and gelling agents in relation to energy intake (Tredger et al., 1991; Haskell et al., 1992; Pasman et al., 1997b; Panlasigui et al., 2003; Marett & Slavin, 2004; Schwab et al., 2006; Garcia et al., 2007; Mattes, 2007; Pelkman et al., 2007; Wood et al., 2007; Paxman et al., 2008), seven of which were included in a meta-analysis (Tredger et al., 1991; Pasman et al., 1997b; Schwab et al., 2006; Garcia et al., 2007; Pelkman et al., 2007; Wood et al., 2007; Paxman et al., 2008). Four trials could not be included in a meta-analysis but demonstrated no statistically significant effect of soluble fibre isolates on energy intake (Haskell et al., 1992; Panlasigui et al., 2003; Marett & Slavin, 2004; Mattes, 2007). No further trials were identified in the update search (Cardio-metabolic review, energy intake and eating motivation chapter). The trials compared guar gum, pectin, gum arabic, carrageenan, algal polysaccharides, arabinogalactan, chitosan or arabinoxylan supplements with a placebo.
A5.25 An effect is demonstrated for various isolated gums and gelling agent supplements on reducing energy intake (-567 kJ, 95% CI -931, -202 kJ; p<0.01) (-135 kcal, 95% CI -223, - 48 kcal).
Isolated gums and gelling agent supplements and energy intake
• Effect • Adequate evidence • The direction of the effect demonstrates higher consumption of fibre isolates and gum supplements is beneficial to health • The effect is biologically relevant, but demonstrated at intakes achieved through supplementation
Eating motivation A5.26 Five randomised controlled trials were identified that presented evidence on
isolated gums and gelling agents in relation to eating motivation (Pasman et al., 1997b; Heini et al., 1998; Schwab et al., 2006; Mattes, 2007; Pelkman et al., 2007). (Cardio-metabolic review, Energy intake and eating motivation chapter). The trials compared either guar gum, pectin or glucomannan with a placebo.
A5.27 Due to variation in study designs, the method of assessing eating motivation and the nature of each intervention, it was not possible to combine these studies in
238
a meta-analysis. Overall, the trials provide inconsistent evidence of the effects of various isolated gums and gelling agent supplements on subjective ratings of eating motivation
Isolated gums and gelling agent supplements and eating motivation
• No effect • Limited evidence
Fasting blood glucose A5.28 Nine randomised controlled trials were identified that presented evidence on
isolated gums and gelling agents in relation to fasting blood glucose (Bell et al., 1990; Ryle et al., 1990; Landin et al., 1992; Pasman et al., 1997a; Marett & Slavin, 2004; Lehtimaki et al., 2005; Schwab et al., 2006; Wood et al., 2007; Garcia et al., 2007), eight of which were included in a meta-analysis (Bell et al., 1990; Ryle et al., 1990; Landin et al., 1992; Marett & Slavin, 2004; Lehtimaki et al., 2005; Schwab et al., 2006; Wood et al., 2007; Garcia et al., 2007). One trial could not be included in a meta-analysis as it did not report the necessary data, but demonstrated no significant effect of soluble fibre isolates in relation to fasting blood glucose (Pasman et al., 1997a). No further trials were identified in the update search (Cardio-metabolic review, diabetes chapter). The trials compared either guar gum, pectin, arabinogalactan, chitosan, arabinoxylan or konjac mannan supplements with a placebo.
A5.29 No significant effect is demonstrated for isolated gums and gelling agent supplements on fasting blood glucose concentration (-0.11mmol/L, 95% CI -0.26, 0.05; p=0.18).
Isolated gums and gelling agent supplements and fasting blood glucose concentration
• No effect • Moderate evidence
239
Fasting blood insulin A5.30 Eight publications relating to seven randomised controlled trials were identified
that presented evidence on isolated gums and gelling agents in relation to fasting insulin (Ryle et al., 1990; Landin et al., 1992; Pasman et al., 1997a; Marett & Slavin, 2004; Schwab et al., 2006; Garcia et al., 2006; Wood et al., 2007; Garcia et al., 2007). Two papers presented evidence from one trial (Garcia et al., 2006; Garcia et al., 2007). No further trials were identified in the update search (Cardio-metabolic review, diabetes chapter). The trials compared either guar gum, pectin, arabinogalactan, chitosan, arabinoxylan or konjac mannan supplements with a placebo.
A5.31 Due to variation in the methodologies used to measure insulin concentration, it is not possible to combine these studies using meta-analysis. Overall these trials do not provide evidence of an effect of various isolated gums and gelling agent supplements on fasting blood insulin concentration.
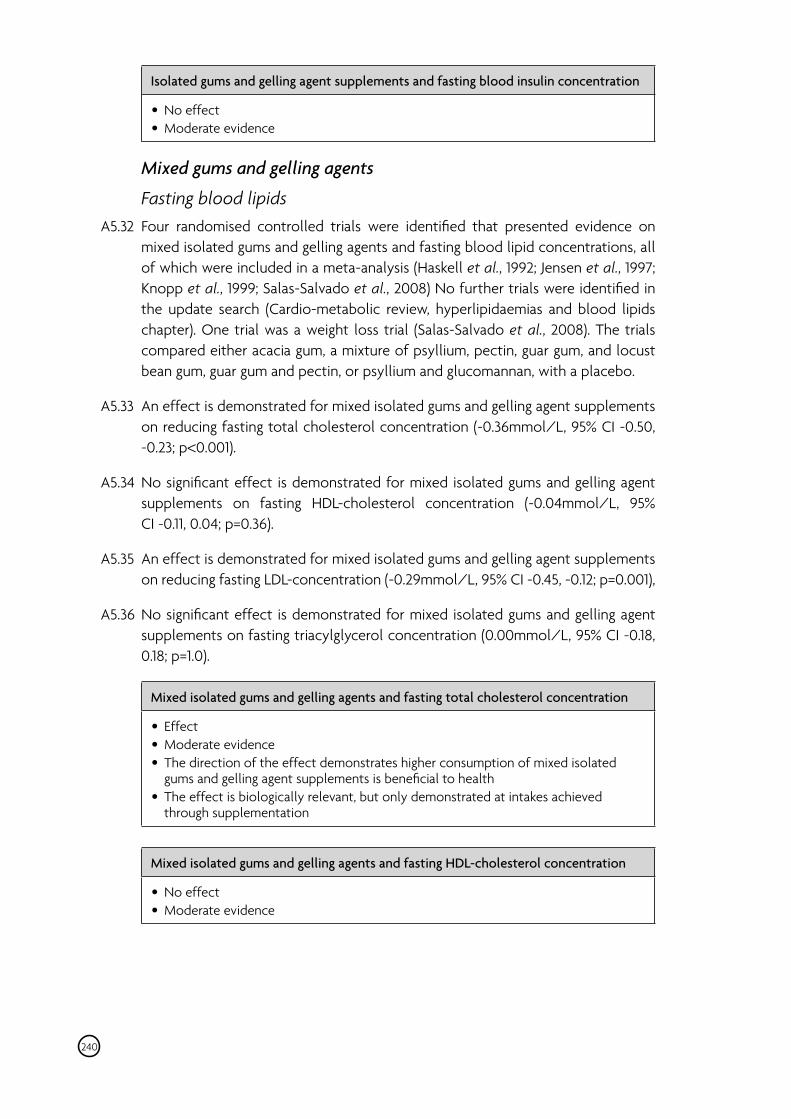
Isolated gums and gelling agent supplements and fasting blood insulin concentration
• No effect • Moderate evidence
Mixed gums and gelling agents
Fasting blood lipids A5.32 Four randomised controlled trials were identified that presented evidence on
mixed isolated gums and gelling agents and fasting blood lipid concentrations, all of which were included in a meta-analysis (Haskell et al., 1992; Jensen et al., 1997; Knopp et al., 1999; Salas-Salvado et al., 2008) No further trials were identified in the update search (Cardio-metabolic review, hyperlipidaemias and blood lipids chapter). One trial was a weight loss trial (Salas-Salvado et al., 2008). The trials compared either acacia gum, a mixture of psyllium, pectin, guar gum, and locust bean gum, guar gum and pectin, or psyllium and glucomannan, with a placebo.
A5.33 An effect is demonstrated for mixed isolated gums and gelling agent supplements on reducing fasting total cholesterol concentration (-0.36mmol/L, 95% CI -0.50, -0.23; p<0.001).
A5.34 No significant effect is demonstrated for mixed isolated gums and gelling agent supplements on fasting HDL-cholesterol concentration (-0.04mmol/L, 95% CI -0. 11, 0.04; p=0.36).
A5.35 An effect is demonstrated for mixed isolated gums and gelling agent supplements on reducing fasting LDL-concentration (-0.29mmol/L, 95% CI -0.45, -0.12; p=0.001),
A5.36 No significant effect is demonstrated for mixed isolated gums and gelling agent supplements on fasting triacylglycerol concentration (0.00mmol/L, 95% CI -0.18, 0.18; p=1.0).
Mixed isolated gums and gelling agents and fasting total cholesterol concentration
• Effect • Moderate evidence • The direction of the effect demonstrates higher consumption of mixed isolated gums and gelling agent supplements is beneficial to health • The effect is biologically relevant, but only demonstrated at intakes achieved through supplementation
Mixed isolated gums and gelling agents and fasting HDL-cholesterol concentration
• No effect • Moderate evidence
240
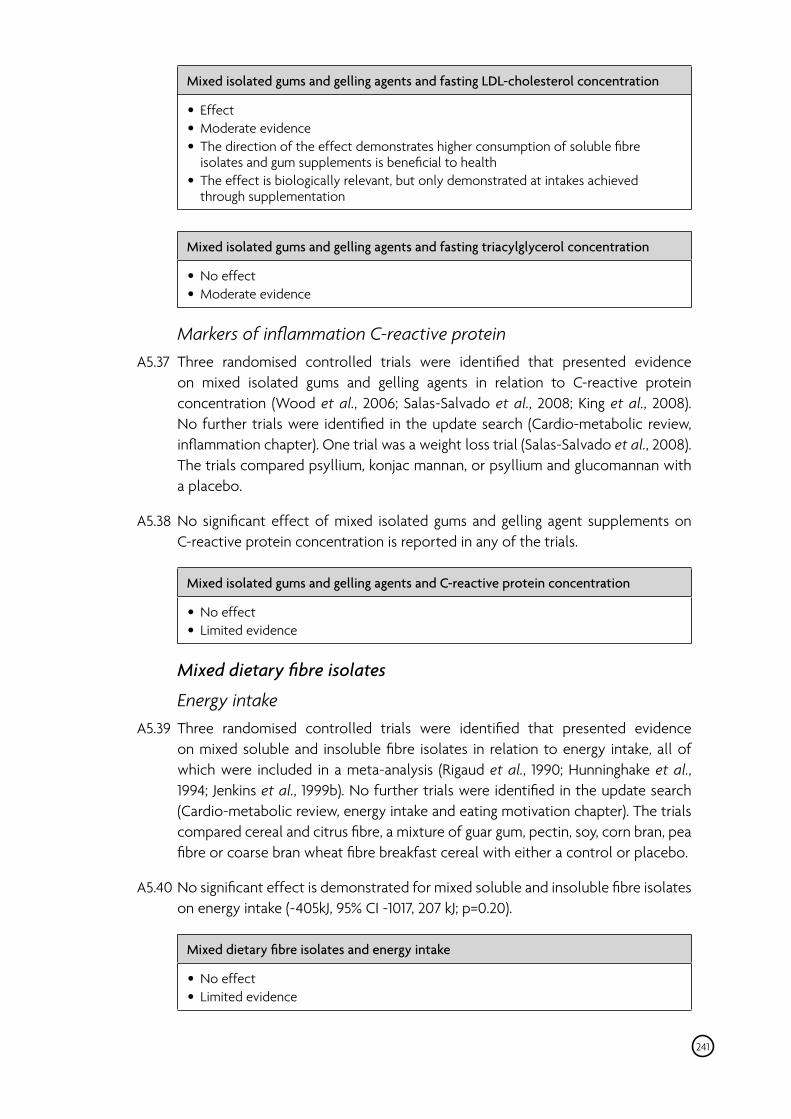
Mixed isolated gums and gelling agents and fasting LDL-cholesterol concentration
• Effect • Moderate evidence • The direction of the effect demonstrates higher consumption of soluble fibre isolates and gum supplements is beneficial to health • The effect is biologically relevant, but only demonstrated at intakes achieved through supplementation
Mixed isolated gums and gelling agents and fasting triacylglycerol concentration
• No effect • Moderate evidence
Markers of inflammation C-reactive protein A5.37 Three randomised controlled trials were identified that presented evidence
on mixed isolated gums and gelling agents in relation to C-reactive protein concentration (Wood et al., 2006; Salas-Salvado et al., 2008; King et al., 2008). No further trials were identified in the update search (Cardio-metabolic review, inflammation chapter). One trial was a weight loss trial (Salas-Salvado et al., 2008). The trials compared psyllium, konjac mannan, or psyllium and glucomannan with a placebo.
A5.38 No significant effect of mixed isolated gums and gelling agent supplements on C-reactive protein concentration is reported in any of the trials.
Mixed isolated gums and gelling agents and C-reactive protein concentration
• No effect • Limited evidence
Mixed dietary fibre isolates
Energy intake A5.39 Three randomised controlled trials were identified that presented evidence
on mixed soluble and insoluble fibre isolates in relation to energy intake, all of which were included in a meta-analysis (Rigaud et al., 1990; Hunninghake et al., 1994; Jenkins et al., 1999b). No further trials were identified in the update search (Cardio-metabolic review, energy intake and eating motivation chapter). The trials compared cereal and citrus fibre, a mixture of guar gum, pectin, soy, corn bran, pea fibre or coarse bran wheat fibre breakfast cereal with either a control or placebo.
A5.40 No significant effect is demonstrated for mixed soluble and insoluble fibre isolates on energy intake (-405kJ, 95% CI -1017, 207 kJ; p=0.20).
Mixed dietary fibre isolates and energy intake
• No effect • Limited evidence
241
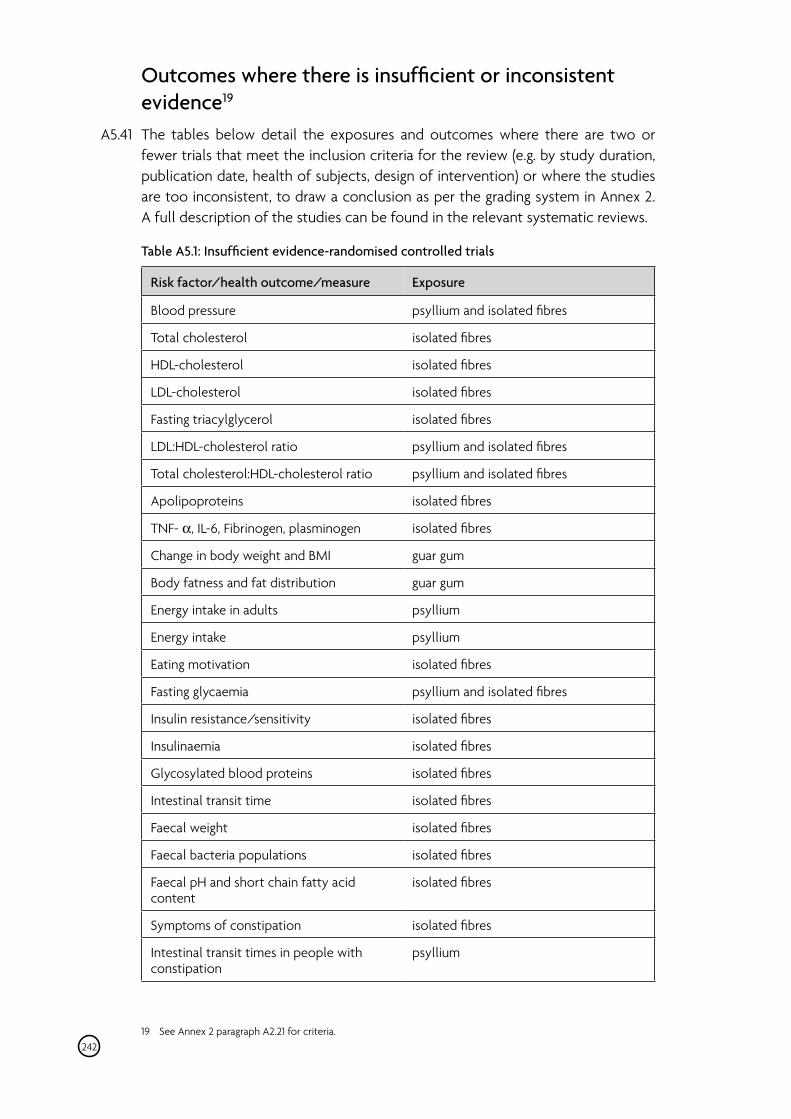
Outcomes where there is insufficient or inconsistent evidence19
A5.41 The tables below detail the exposures and outcomes where there are two or fewer trials that meet the inclusion criteria for the review (e.g. by study duration, publication date, health of subjects, design of intervention) or where the studies are too inconsistent, to draw a conclusion as per the grading system in Annex 2. A full description of the studies can be found in the relevant systematic reviews.
Table A5.1: Insufficient evidence-randomised controlled trials
Risk factor/health outcome/measure Exposure
Blood pressure psyllium and isolated fibres
Total cholesterol isolated fibres
HDL-cholesterol isolated fibres
LDL-cholesterol isolated fibres
Fasting triacylglycerol isolated fibres
LDL:HDL-cholesterol ratio psyllium and isolated fibres
Total cholesterol:HDL-cholesterol ratio psyllium and isolated fibres
Apolipoproteins isolated fibres
TNF- α, IL-6, Fibrinogen, plasminogen isolated fibres
Change in body weight and BMI guar gum
Body fatness and fat distribution guar gum
Energy intake in adults psyllium
Energy intake psyllium
Eating motivation isolated fibres
Fasting glycaemia psyllium and isolated fibres
Insulin resistance/sensitivity isolated fibres
Insulinaemia isolated fibres
Glycosylated blood proteins isolated fibres
Intestinal transit time isolated fibres
Faecal weight isolated fibres
Faecal bacteria populations isolated fibres
Faecal pH and short chain fatty acid content
isolated fibres
Symptoms of constipation isolated fibres
Intestinal transit times in people with constipation
psyllium
19 See Annex 2 paragraph A2.21 for criteria. 242
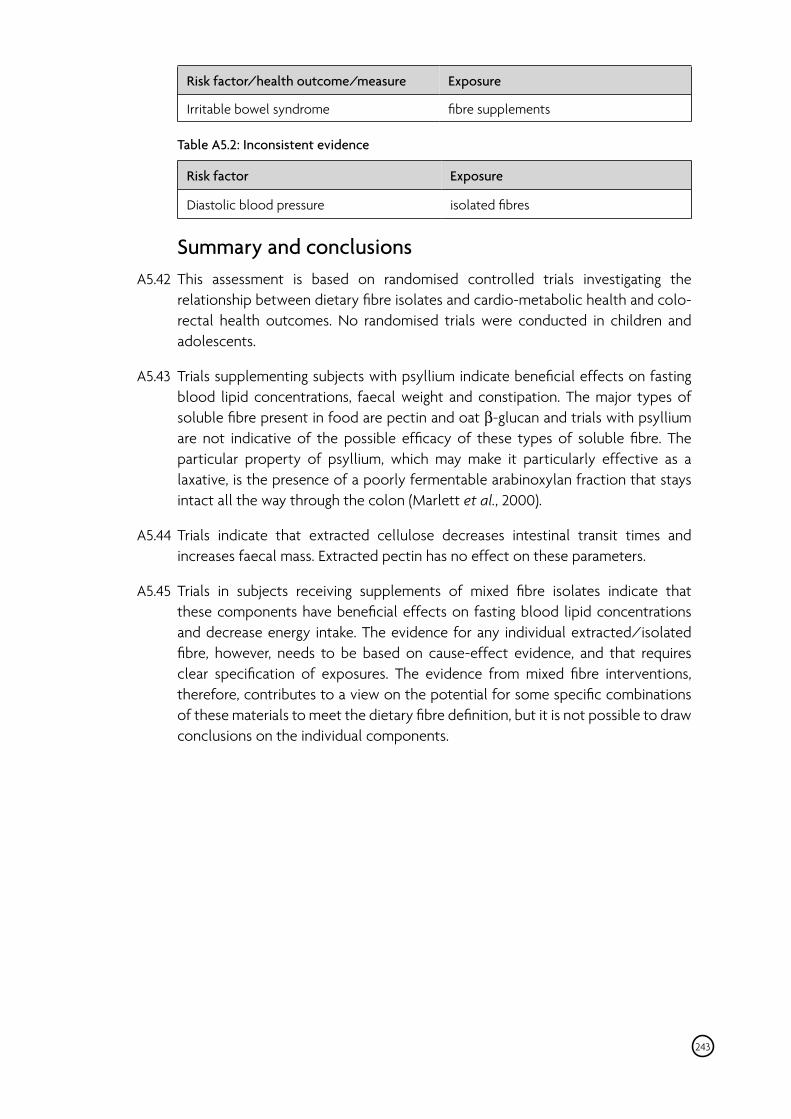
243
Risk factor/health outcome/measure Exposure
Irritable bowel syndrome fibre supplements
Table A5.2: Inconsistent evidence
Risk factor Exposure
Diastolic blood pressure isolated fibres
Summary and conclusions A5.42 This assessment is based on randomised controlled trials investigating the
relationship between dietary fibre isolates and cardio-metabolic health and colo-rectal health outcomes. No randomised trials were conducted in children and adolescents.
A5.43 Trials supplementing subjects with psyllium indicate beneficial effects on fasting blood lipid concentrations, faecal weight and constipation. The major types of soluble fibre present in food are pectin and oat β-glucan and trials with psyllium are not indicative of the possible efficacy of these types of soluble fibre. The particular property of psyllium, which may make it particularly effective as a laxative, is the presence of a poorly fermentable arabinoxylan fraction that stays intact all the way through the colon (Marlett et al., 2000).
A5.44 Trials indicate that extracted cellulose decreases intestinal transit times and increases faecal mass. Extracted pectin has no effect on these parameters.
A5.45 Trials in subjects receiving supplements of mixed fibre isolates indicate that these components have beneficial effects on fasting blood lipid concentrations and decrease energy intake. The evidence for any individual extracted/isolated fibre, however, needs to be based on cause-effect evidence, and that requires clear specification of exposures. The evidence from mixed fibre interventions, therefore, contributes to a view on the potential for some specific combinations of these materials to meet the dietary fibre definition, but it is not possible to draw conclusions on the individual components.

ANNEX 6
Abbreviations
ANCOVA Analysis of covariance
ATP Adenosine triphosphate
AUC insulin Area under the curve insulin
BMI Body Mass Index
CHD Coronary heart disease
CI Confidence interval
COMA Committee on Medical Aspects of Food Policy
CRP C-reactive protein
CVD Cardiovascular disease
DBP Diastolic blood pressure
DP Degree of polymerisation
DRV Dietary Reference Value
EAR Estimated Average Requirement
EFSA European Food Safety Authority
EI Energy intake
EPIC European Prospective Investigation into Cancer and Nutrition
E-selectin Endothelial selectin
FAO/WHO Food and Agriculture Organization/World Health Organization
FTO gene Fat mass and obesity associated gene
g Gram
GI Glycaemic Index
GL Glycaemic Load
GLUT Glucose transporters
HbA1c Glycated haemoglobin
HDL High-density lipoprotein
HFCS High fructose corn syrup
ICAM-1 Intercellular Adhesion Molecule 1
244

IL-6 Interleukin 6
J Joule
kcal Kilocalorie
kg Kilogram
kJ Kilojoule
L Litres
LDL Low-density lipoprotein
mg Milligram
MJ Megajoule
mmHg Millimetre of mercury
mmol Millimole
NDNS National Diet and Nutrition Survey
NMES Non-milk extrinsic sugars
NSP Non-starch polysaccharide
PAI-1 Plasminogen activator inhibitor-1
P-selectin Platelet-selectin
RR Relative risk
RS1 Physically inaccessible resistant starch
RS2 Resistant starch granules
RS3 Retrograde amylose resistant starch
RS4 Chemically modified resistant starch
SACN Scientific Advisory Committee on Nutrition
SBP Systolic blood pressure
SCFA Short chain fatty acids
SEM Standard error of the mean
SGLT1 Sodium glucose linked transporter
TAG Triacylglycerol
TEE Total Energy Expenditure
TNF Tumour necrosis factor
tPA Tissue plasminogen activator
VCAM-1 Vascular cell adhesion molecule 1
245
ANNEX 7
Carbohydrate intake in pregnancy in relation to birth weight and cardio-metabolic health outcomes
Introduction A7.1 This assessment is based on prospective cohort studies investigating the
relationship between carbohydrate intake and birth weight and cardio-metabolic health outcomes. Randomised controlled trials were also considered, but there were an insufficient number of trials to enable any conclusions to be drawn (see table A7.2). Studies involving pregnant women were identified from the databases containing all the citations identified in the original literature search for the cardio-metabolic health review and the update search. Links to the cardio-metabolic health reviews and update search are given in Annex 1. A limitation to examining the role of carbohydrate intake during pregnancy in cardio-metabolic health outcomes is that the terms used to search the literature did not include measures of birth size other than weight. Outcomes such as duration of gestation, head circumference, crown-heel length or ponderal index were not, therefore, considered.
A7.2 Evidence on health/disease outcomes has been discussed in detail only where there were sufficient data for a conclusion to be drawn from studies meeting the pre-agreed inclusion criteria. Outcomes where there were too few studies to reach a conclusion, are listed at the end of the chapter (see tables A7.1 and A7.2). For all outcome measures, the data (exposure and outcome) were insufficiently comparable to allow quantitative synthesis.
Birth weight A7.3 Birth weight is a widely cited indicator of neonatal and perinatal risk. It has
been commonly adduced as a summary index of fetal nutritional exposure in epidemiological studies, but is not a sensitive or specific measure of fetal nutrient supply, nor the only measure indicative of fetal nutritional exposure. Although birth weight provides some information about the end point of fetal growth, it neither describes the fetal growth trajectory nor reflects body composition. The pattern of fetal growth may affect the development of organs and physiologic systems in ways that are not explained by birth weight and body proportions (Prentice & Goldberg, 2000). Birth weight has thus been regarded as an ‘outcome of convenience’ for perinatal health policy (Wilcox, 2001) rather than a complete descriptor of nutritional phenotype. Birth weight is also subject to other influences, including environmental contaminants such as smoking (Lumley et al., 2009). Importantly it is also influenced by the duration of gestation and the mother’s physique and parity.
246
A7.4 Higher birth weight is associated in later life with a higher body mass index and an increased risk of certain cancers, notably breast cancer (particularly in premenopausal women) and child leukaemia (SACN, 2011). Lower birth weight is associated with increased risk of coronary heart disease and a J- or U-shaped relationship has been described between infant birth weight and blood pressure (Curhan et al., 1996; Davies et al., 2006; Gamborg et al., 2007) and type 2 diabetes mellitus risk (Harder et al., 2007) in later life.
A7.5 Ten cohort studies were identified that presented evidence on dietary carbohydrate intake during pregnancy and infant birth weight (Haste et al., 1991; Lenders et al., 1994; Godfrey et al., 1996; Lenders et al., 1997; Mathews et al., 1999; Langley-Evans & Langley-Evans, 2003; Moore et al., 2004; Lagiou et al., 2004; Scholl et al., 2004; Watson & McDonald, 2010).
A7.6 Three studies were conducted in England only (Haste et al., 1991; Mathews et al., 1999; Langley-Evans & Langley-Evans, 2003), one study in the UK (Godfrey et al., 1996), four in the USA (Lenders et al., 1994; Lenders et al., 1997; Lagiou et al., 2004; Scholl et al., 2004), one in Australia (Moore et al., 2004) and one in New Zealand (Watson & McDonald, 2010).
A7.7 Three cohort studies were conducted in low-income pregnant women; two cohort studies included only adolescents (Lenders et al., 1994; Lenders et al., 1997) and the other included adolescents and adult women (Scholl et al., 2004).
Total carbohydrate A7.8 Seven cohort studies were identified that presented evidence on maternal total
carbohydrate intake, either as grams or percentage energy, and infant birth weight (Haste et al., 1991; Godfrey et al., 1996; Mathews et al., 1999; Langley-Evans & Langley-Evans, 2003; Lagiou et al., 2004; Moore et al., 2004; Watson & McDonald, 2010).
A7.9 Three of these studies were conducted in England. One assessed maternal carbohydrate intake (g/day) at 28 and 36 weeks gestation in non-smokers (n=97) and smokers (n=72) (Haste et al., 1991). The amount of total carbohydrate consumed at either dietary assessment during pregnancy was not associated with the infant birth weight in either smokers or non-smokers. In another study, 693 women had their dietary intake assessed in early pregnancy (recorded at the booking appointment) and the 28th week of gestation (Mathews et al., 1999). The amount of total carbohydrate consumed (g/day) either early or later in pregnancy was not associated with infant birth weight (p=0.90). The third cohort indicated no association between infant birth weight and maternal intakes of total carbohydrate (g/day or % energy) (Langley-Evans & Langley-Evans, 2003).
A7.10 A UK cohort study assessed maternal carbohydrate intake (g/day) in early and late pregnancy in 538 women in relation to infant birth weight (Godfrey et al., 1996). Nutrient intakes were log transformed where appropriate. Increased carbohydrate intake in early pregnancy was associated with a lower birth weight (-143 g, 95% CI -28 g, -258 g; P=0.01 per log gram increase in carbohydrate intake). However, there was no significant association between the mothers’ carbohydrate intake in late pregnancy and infant birth weight.
247
A7.11 An Australian study conducted in 557 women observed no association between the percentage of energy from carbohydrate in early and late pregnancy and infant birth weight (Moore et al., 2004).
A7.12 A study in the USA conducted in 224 women assessed dietary intake at the 27th week of gestation (Lagiou et al., 2004). The intake of total carbohydrate (g/day) was not associated with infant birth weight (p=0.21). Partial regression coefficients showing changes in adjusted birth weight per increments of one standard deviation of carbohydrate intake also indicated no association (p=0.62).
A7.13 A study conducted in New Zealand assessed maternal diet at months four and seven of gestation in 439 low-income women. Maternal total carbohydrate intake was not associated with birth weight. A further analysis indicated that percentage energy from carbohydrate, but not grams carbohydrate/day, was associated with birth weight in a quadratic relationship. In multiple regression analyses the authors observe that when carbohydrate consumption was below or above 48% of energy, birth weight was significantly lower (Watson & McDonald, 2010). The subgroup with the highest mean birth weight (approximately 3600g) had a percentage energy intake from carbohydrate of 48%, 35% from fat and 17% from protein.
A7.14 Overall, the seven cohort studies provide little indication that maternal total carbohydrate intake (g/day or % energy) is associated with infant birth weight.
Total carbohydrate (g/day or % energy) and birth weight
• No association • Adequate evidence
Sugars A7.15 Five cohort studies were identified that presented evidence on maternal intake
of sugars (total and individual sugars) and infant birth weight (Lenders et al., 1994; Godfrey et al., 1996; Lenders et al., 1997; Langley-Evans & Langley-Evans, 2003; Watson & McDonald, 2010).
A7.16 The two studies conducted in adolescents from low income families both compared participants in the top 10th percentile of sugars intake (≥206 g/day) with the remainder of adolescents (sugars intake <206 g/day). In the first study, adolescents in the top 10th percentile defined as high consumers of sugars (n = 34) gave birth to infants weighing 215 ± 104 g (mean±sd) less (p = 0.04) than the remainder of adolescents (n = 303) (Lenders et al., 1994). The total sugars intake was computed from a single 24-hour recall conducted at the first prenatal visit. In the second study, the adjusted odds ratio for delivering a small-for-gestational-age infant (defined as <10th percentile of birth weight for gestational age) was 2.01 (95% CI 1.05, 7.53) for adolescents with a high sugars intake (n=60) compared with the remainder of adolescents (n=534) (Lenders et al., 1997). The total sugars intake was computed from three 24-hour recalls in the course of pregnancy. Any associations between sugars intake and birth weight were not reported in this latter study.
248
A7.17 One cohort study observed that a higher total sugars intake during early pregnancy was associated with a significantly lower birth weight (P= 0.02; only the p-value was reported) (Godfrey et al., 1996). Results for sugars intake in late pregnancy were not reported. Another cohort study found that a higher sucrose intake at 4 months, but not 7 months, was associated with reduced birth weight. No associations were found for glucose or fructose independent of sucrose, lactose or maltose (Watson & McDonald, 2010).
A7.18 Overall, four studies provide some indication that higher sugars intake is associated with lower infant birth weight (Lenders et al., 1994; Godfrey et al., 1996; Lenders et al., 1997; Watson & McDonald, 2010), but one other indicates no association (Langley-Evans & Langley-Evans, 2003). The biological plausibility and significance of these findings is unclear. Only one study presents birth weights according to sugars intake (Lenders et al., 1994); the other studies report birth weights only for the whole cohort. Confounding by other dietary factors, e.g. micronutrient intakes, cannot be excluded. Only two of the studies excluded preterm births (born before the 37th week of pregnancy) from their analyses (Godfrey et al., 1996; Langley-Evans & Langley-Evans, 2003).
Sugars (g/day) and infant birth weight
• Association • Limited evidence • The direction of the association indicates that greater consumption of sugars during pregnancy is associated with lower birth weight, but the studies are insufficient in number and quality to allow confidence in the observed association. It is also not possible to exclude confounding by other dietary variables • The biological relevance is unclear
249
Gestational diabetes mellitus A7.19 All dietary assessments were conducted prior to the development of gestational
diabetes mellitus. Three cohort studies were identified that presented evidence on dietary carbohydrate intake during pregnancy and the risk of developing gestational diabetes mellitus (Saldana et al., 2004; Radesky et al., 2008; Ley et al., 2011). One cohort study was identified that presented evidence on dietary carbohydrate intake pre-pregnancy and risk of gestational diabetes mellitus (Zhang et al., 2006). All the studies were conducted in North America.
Total carbohydrate A7.20 Three cohort studies reported on total carbohydrate, as percentage energy, during
pregnancy and the risk of developing gestational diabetes mellitus (Saldana et al., 2004; Radesky et al., 2008; Ley et al., 2011). One cohort study was identified that reported on total carbohydrate intake pre-pregnancy and the risk of gestational diabetes mellitus (Zhang et al., 2006).
A7.21 A study conducted in 1698 women in the USA assessed maternal diet in the second trimester in relation to the risk of developing gestational diabetes mellitus or impaired glucose tolerance (Saldana et al., 2004). The authors observed that women defined as having developed gestational diabetes mellitus (n=89) consumed a lower percentage of energy from carbohydrates and a higher percentage of energy from fat than the women who maintained normal glucose tolerance. Modelling showed that adding 100 kcal from carbohydrates to the diet was associated with a decrease in the risk of gestational diabetes mellitus (RR 0.9, 95% CI 0.85, 0.98, p=0.01). A theoretical substitution model was devised which substituted one macronutrient for another. It was found that substituting fat for carbohydrates (per each 1% of total dietary energy) resulted in a significant increase in the risk of gestational diabetes mellitus (RR 1.10, 95% CI 1.02, 1.12 and RR 1.10, 95% CI 1.02, 1.10, respectively). Predicted probabilities of gestational diabetes mellitus were reduced by one half with a 10% decrease in dietary fat and a 10% increase in carbohydrate.
A7.22 A study conducted in 1722 women in the USA assessed maternal diet in early pregnancy in relation to the risk of developing gestational diabetes mellitus (Radesky et al., 2008). The percentage energy from carbohydrate was not associated with risk of developing gestational diabetes mellitus (OR 1.00, 95% CI 0.96, 1.03) in this cohort. Unlike the findings reported by Saldana et al. (2004) there was no evidence that adding fat or carbohydrates to the diet, or substituting fat for carbohydrates, fat for protein, or carbohydrates for protein was associated with altered risk for gestational diabetes mellitus.
A7.23 A smaller study in 205 women in Canada assessed maternal diet in the second trimester in relation to the risk of developing gestational diabetes mellitus (Ley et al., 2011). A decreased risk of gestational diabetes mellitus was associated with higher carbohydrate intake as a percentage of energy (OR 0.60, 95% CI 0.40, 0.90 per 1 standard deviation change in intake).
A7.24 A study conducted in 13,110 women in the USA assessed maternal diet pre-pregnancy in relation to the risk of developing gestational diabetes mellitus (Zhang et al., 2006). There was no association observed between total carbohydrate intake as a percentage of energy pre-pregnancy and gestational diabetes mellitus risk (RR 1.00, 95% CI 0.62, 1.63) for the highest versus lowest quartile of intake. In this study, higher carbohydrate intake pre-pregnancy was associated with lower gestational diabetes mellitus risk after adjustment for age and BMI, but this association disappeared after additional adjustment for lifestyle and other dietary factors (Zhang et al., 2006). One of the studies in which it was observed that higher total carbohydrate intake as a percentage of energy was associated with decreased risk of gestational diabetes mellitus only adjusted risk for age, race and BMI (Saldana et al., 2004) and none of the studies assessing diet during pregnancy adjusted for other dietary factors. Overall, there is little indication of an association between total carbohydrate intake as a percentage of energy and risk of gestational diabetes mellitus.
250
Carbohydrate intake (% energy) and risk of gestational diabetes mellitus or impaired glucose tolerance
• No association • Limited evidence
Dietary Fibre A7.25 Two cohort studies reported on fibre intake during pregnancy and the risk of
developing gestational diabetes mellitus (Radesky et al., 2008; Ley et al., 2011). One cohort study was identified that reported on dietary fibre intake pre-pregnancy and the risk of gestational diabetes mellitus (Zhang et al., 2006).
A7.26 Two of the cohort studies observed no association between fibre intakes and the risk of gestational diabetes mellitus (Radesky et al., 2008; Ley et al., 2011). The results for Ley et al. (2011) are as follows: dietary fibre OR 1.03, 95% CI 0.61, 1.74 per 1 standard deviation change in intake; cereal fibre OR 1.07, 95% CI 0.69, 1.65 per 1 standard deviation change in intake; vegetable and fruit fibre OR 0.94, 95% CI 0.63, 1.41 per 1 standard deviation change in intake. The findings for Radesky et al. (2008) are as follows: dietary fibre OR 0.92, 95% CI 0.74, 1.15 per each 5g increase.
A7.27 Higher dietary fibre intake in pre-pregnancy, in particular cereal and fruit fibre, was associated with a reduced risk of gestational diabetes mellitus (Zhang et al., 2006). These associations remained significant after adjustment for the other sources of dietary fibre. For dietary fibre, RR 0.74, 95% CI 0.51, 0.91 for each 10g/day increase, p=0.005; for cereal fibre RR 0.77, 95% CI 0.64, 0.91 for each 5g/day increase, p=0.02; and for fruit fibre RR 0.74, 95% CI 0.58, 0.95 for each 5g/day increase, p=0.02. There was no association observed between vegetable fibre intake and risk of gestational diabetes mellitus.
Dietary fibre intake (g/day) and gestational diabetes mellitus
• No association • Limited evidence
Glycaemic index and glycaemic load A7.28 Two cohort studies were identified which reported on dietary glycaemic load
during pregnancy and the risk of gestational diabetes mellitus (Radesky et al., 2008; Tovar et al., 2009). One cohort study was identified that reported on dietary glycaemic load and glycaemic index pre-pregnancy and the risk of gestational diabetes mellitus (Zhang et al., 2006).
A7.29 Neither of the studies investigating dietary glycaemic load during pregnancy in relation to gestational diabetes mellitus found any significant associations (Radesky et al., 2008: OR 0.96, 95% CI 0.76, 1.22 per 32 unit increase; Tovar et al., 2009: OR 0.99, 95% CI 0.97, 1.01). Higher glycaemic load pre-pregnancy was associated with an increased risk of gestational diabetes mellitus (highest versus lowest quintile RR 1.61, 95% CI 1.02, 2.53; p=0.03); but there was no significant association between glycaemic index and risk of gestational diabetes mellitus (highest versus lowest quintile RR 1.30, 95% CI 1.00, 1.68; p=0.07) (Zhang et al., 2006). The combination
251
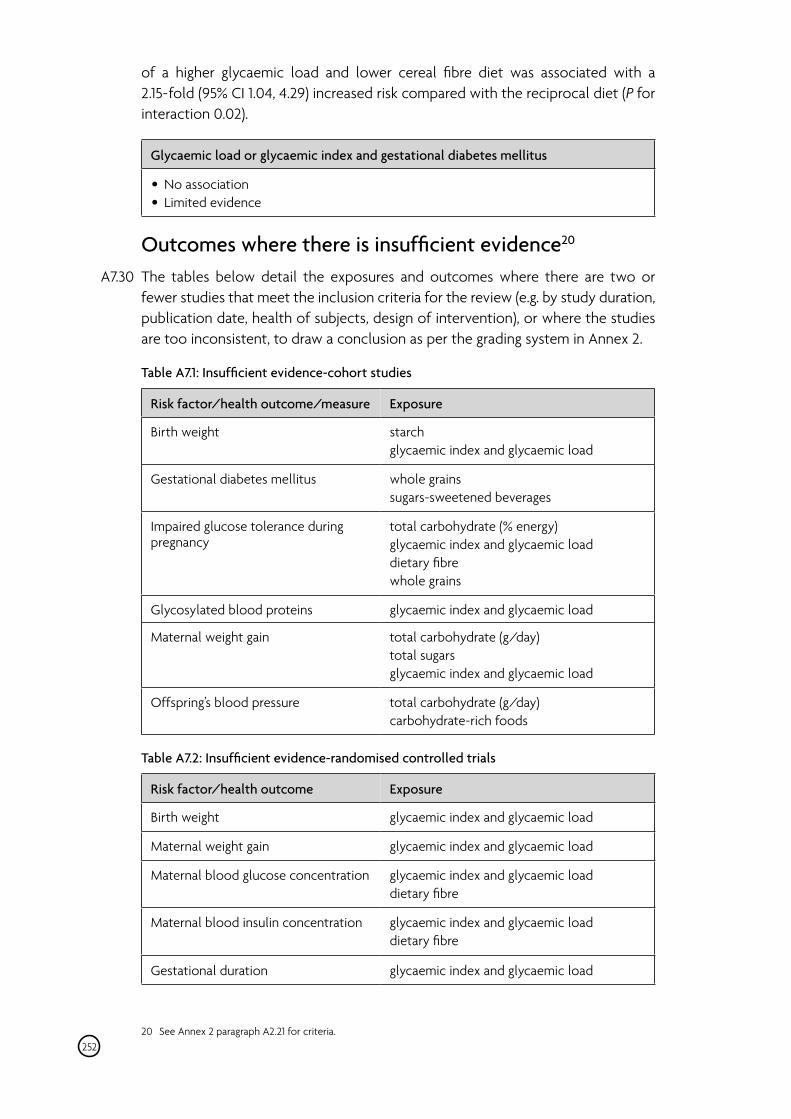
of a higher glycaemic load and lower cereal fibre diet was associated with a 2.15- fold (95% CI 1.04, 4.29) increased risk compared with the reciprocal diet (P for interaction 0.02).
Glycaemic load or glycaemic index and gestational diabetes mellitus
• No association • Limited evidence
Outcomes where there is insufficient evidence20
A7.30 The tables below detail the exposures and outcomes where there are two or fewer studies that meet the inclusion criteria for the review (e.g. by study duration, publication date, health of subjects, design of intervention), or where the studies are too inconsistent, to draw a conclusion as per the grading system in Annex 2.
Table A7.1: Insufficient evidence-cohort studies
Risk factor/health outcome/measure Exposure
Birth weight starch glycaemic index and glycaemic load
Gestational diabetes mellitus whole grains sugars-sweetened beverages
Impaired glucose tolerance during pregnancy
total carbohydrate (% energy) glycaemic index and glycaemic load dietary fibre whole grains
Glycosylated blood proteins glycaemic index and glycaemic load
Maternal weight gain total carbohydrate (g/day) total sugars glycaemic index and glycaemic load
Offspring’s blood pressure total carbohydrate (g/day) carbohydrate-rich foods
Table A7.2: Insufficient evidence-randomised controlled trials
Risk factor/health outcome Exposure
Birth weight glycaemic index and glycaemic load
Maternal weight gain glycaemic index and glycaemic load
Maternal blood glucose concentration glycaemic index and glycaemic load dietary fibre
Maternal blood insulin concentration glycaemic index and glycaemic load dietary fibre
Gestational duration glycaemic index and glycaemic load
20 See Annex 2 paragraph A2.21 for criteria. 252
Summary and conclusions A7.31 This assessment is based on prospective cohort studies investigating the
relationship between carbohydrate intake and birth weight and cardio-metabolic health outcomes. Seven cohort studies indicated there was no association between maternal total carbohydrate intake (g/day or % energy) and infant birth weight.
A7.32 Four cohort studies indicated that higher maternal sugars intake was associated with lower infant birth weight, while one other indicated no association with infant birth weight. The biological plausibility and significance of these findings is unclear. Only one study presented birth weights according to sugars intake; the other studies only reported birth weights for the whole cohort. Confounding by other dietary factors, e.g. micronutrient intakes, could be responsible for the observation and only two of the studies excluded preterm births from their analyses. Overall the studies were insufficient in number and quality to allow confidence in the observed association.
A7.33 Cohort studies provided limited evidence that dietary glycaemic load, glycaemic index, dietary fibre intake and total carbohydrate intake, as a percentage of energy, were not associated with risk of gestational diabetes. For many other outcomes and exposures there was insufficient evidence to enable conclusions to be drawn.
253
AN
NEX
8
Die
tary
sou
rces
and
inta
kes
of c
arbo
hydr
ates
e
e
y ag
y ag
onsu
mer
s) b
onsu
mer
s) b e
y ag
onsu
mer
s) b
e
es (i
nclu
ding
non
-c e
es (i
nclu
ding
non
-c e
y ag
y ag
y se
x an
d ag
onsu
mer
s b
onsu
mer
s b
l (in
clud
ing
non-
c ey
agon
sum
ers
be
bak
e c
e in
t
e c t
e an
d se
x
oods
: mal
oods
: mal em
alem
al a
oods
: al l c
al c
arbo
hydr
e an
d se
x
oods
: foo
ds: f
oods
al
e an
d se
xe
and
sex
y ag
y ag
aini
ng f
aini
ng f
aini
ng f
aini
ng f
aini
ng f
aini
ng f
to
ch b o t
e an
d se
x
ar
char
ides
(NSP
) bon
ton
ton
ton
ton
ton
t
y ag -c -c -c -c -c -ce et t t ou
ps t
y ag
ars
and
st e e e et t t
e an
d se
x
ars
b a a a a a a
y ag ars
b dr dr dr dr dr dr
e b
tae
and
sex
e of
intr
insic
and
milk
sug
e of
non
-milk
ext
rinsic
sug oo
d gr
e of
intr
insic
and
milk
sug
e an
d se
xe
and
sex
e an
d se
xe
and
sex
e an
d se
xsa
c
dr y ag
al c
arbo
hy y ag
y ag y ag
y ag
y ag ch p
oly
ted
carb
ohy
ed c
arbo
hy
ars
b
y ag te
d ca
rboh
yte
d ca
rboh
yt te
d ca
rboh
yed
car
bohy
t
ec ec ec ec ec ec ypes
and
f
ch b
ose
bos
e b
t ose
b
t ar tal s
ug
ose
b
ose
b ar
ood
t
e of
toe
of s
t oe
of t
e of
glu
ce
of fr
uce
of s
ucr
e of
mal
t te
of la
c
ake
daily
int ak ak ak ak ak ak ak ak ak ak
e of
non
-st
ak onsu
med
of s
elon
sum
ed o
f sel
onsu
med
of s
elon
sum
ed o
f sel
onsu
med
of s
elon
sum
ed o
f sel
ontr
ibut
ion
of f
ag age
daily
int
e da
ily in
tag ag
e da
ily in
te
daily
int
ag age
daily
int
e da
ily in
tag
e da
ily in
tag ag
e da
ily in
tag
e da
ily in
te
daily
int
ag age
daily
int
er er er er er er er er er er er er tal q
uant
ities
cal
qua
ntiti
es c
t al q
uant
ities
ct ta
l qua
ntiti
es c
e c
agen
tcta
l qua
ntiti
es c
tal q
uant
ities
c
v v v v v v v v v v v v o o o o o o erA A A A A A A A A A A A T T T T T T P
1 3 4 7 9 10
11 12
13a
13b
14a
14b
15a
15b
e 3.
e 3.
2 e
3.
e 3.
5 e
3.6
e 3.
e 3.
8 16
e 3.
e 3.
e 3.
e 3.
e 3.
e 3.
e 3.
e 3.
e 3.
e 3.
e 3.
e 3.
abl
abl
abl
abl
abl
abl
abl
abl
abl
abl
abl
abl
abl
abl
abl
abl
abl
abl
abl
T T T T T T T T T T T T T T T T T T T
254
ee
y se
x an
d ag
y se
x an
d ag
e b
e b ak
akar
int
char
ides
int
o no
n-m
ilk e
xtrin
sic s
ugsa
c erea
rs a
nd o
v
ears
en 1½
-3 y
o no
n-st
arch
pol
y
ears
ears
ears
en 4
-10
yen
11-1
8 y erv
e: c
hild
re:
chi
ldr
e: c
hild
re:
adu
lts 19
-64
ye:
adu
lts 6
5 y
ears er
ears
ears
ears
ears
and
o
v er
en 1½
-3 y
en 4
-10
yen
11-1
8 y v
e: a
dults
19-6
4 y
ears
ears
ears
ears
oups
tou
ps t
ears
and
oea
rsea
rsea
rsea
rs
ak ak ak ak ak ears
and
o
te in
t
en 1½
-3 y
ood
gr
te in
t
en 4
-10
yen
11-1
8 y
ood
gr
te in
te
int
t e in
tt en
1½-3
yen
4-1
0 y
en 11
-18
y
pes
and
fpe
s an
d f a a a a a e:
chi
ldr
e: c
hild
re:
chi
ldr
e: a
dults
65
y
dr dr dr dr dr ak ak ak ak ake:
chi
ldr
e: c
hild
re:
chi
ldr
e: a
dults
19-6
4 y
e: a
dults
65
ye:
chi
ldr
e: c
hild
re:
chi
ldr
e: a
dults
19-6
4 y
e: a
dults
65
y
y yal
car
bohy
al c
arbo
hyal
car
bohy
al c
arbo
hyal
car
bohy
ar in
tar
int
ar in
tar
int
ar in
tak ak ak ak ak
al s
ugal
sug
al s
ugal
sug
al s
ugch
int
ch in
tch
int
ch in
tch
int ak ak ak ak ak
ood
too
d t
t t t t t t t t t t ar ar ar ar aro o o o o o o o o o
ontr
ibut
ion
of f
ontr
ibut
ion
of f o t
o t
o t
o t
o t
o t
o t
o t
o t
o t
o st
o st
o st
o st
o st
o N
SP in
to
NSP
int
o N
SP in
to
NSP
int
o N
SP in
t
ors
tor
s t
ors
tor
s t
ors
tor
s t
ors
tor
s t
ors
tor
s t
ors
tor
s t
ors
tor
s t
ors
tor
s t
ors
tor
s t
ors
tor
s t
ontr
ibut
ontr
ibut
ontr
ibut
ontr
ibut
ontr
ibut
ontr
ibut
ontr
ibut
ontr
ibut
ontr
ibut
ontr
ibut
ontr
ibut
ontr
ibut
ontr
ibut
ontr
ibut
ontr
ibut
ontr
ibut
ontr
ibut
ontr
ibut
ontr
ibut
ontr
ibut
e c
e c y c
y c
y c
y c
y c
y c
y c
y c
y c
y c
y c
y c
y c
y c
y c
y c
y c
y c
y c
y c
ag ag ent
ent
ent
ent
ent
ent
ent
ent
ent
ent
ent
ent
ent
ent
ent
ent
ent
ent
ent
ent
ent
ent
c cer erP P To
p tw
op tw
T Top
twop
twT op
twT op
twT To
p tw
Top
twTo
p tw
op tw
T Top
twTo
p tw
Top
twTo
p tw
Top
twTo
p tw
Top
twop
twT To
p tw
Top
tw
17
18
19a
19b
19c
19d
19e
e 3.
e 3.
e 3.
e 3.
e 3.
e 3.
e 3.
e 3.
20a
e 3.
20b
e 3.
20c
e 3.
20d
e 3.
20e
e 3.
21a
e 3.
21b
e 3.
21c
e 3.
21d
e 3.
21e
e 3.
22a
e 3.
22b
e 3.
22c
e 3.
22d
e 3.
22e
abl
abl
abl
abl
abl
abl
abl
abl
abl
abl
abl
abl
abl
abl
abl
abl
abl
abl
abl
abl
abl
abl
T T T T T T T T T T T T T T T T T T T T T T
255
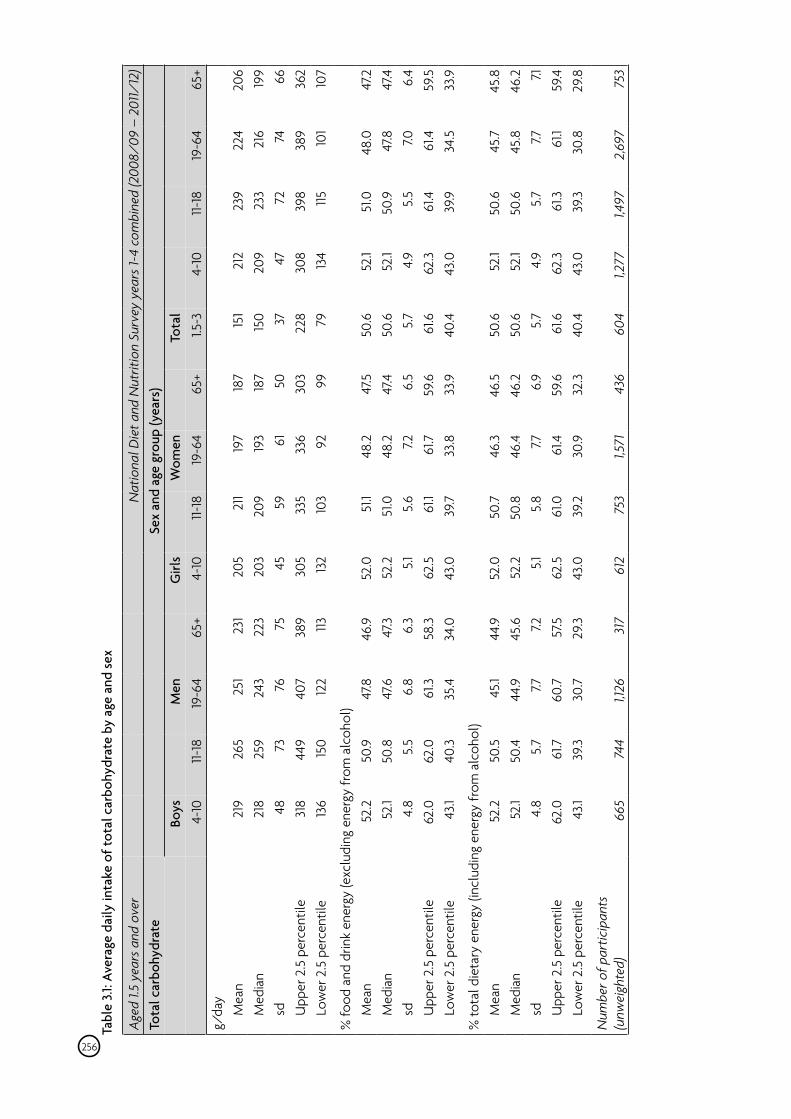
Tabl
e 3.1
: Ave
rage
dai
ly in
take
of t
otal
car
bohy
drat
e by
age
and
sex
Aged
1.5
year
s and
ove
r
N
atio
nal D
iet a
nd N
utrit
ion
Surv
ey y
ears
1-4
com
bine
d (2
008/
09 –
201
1/12
)To
tal c
arbo
hydr
ate
Sex
and
age
grou
p (y
ears
)
Boys
Men
Girl
s
Wom
en
To
tal
4-
10
11-18
19
-64
65+
4-10
11-
18
19-6
4 65
+ 1.5
-3
4-10
11-
18
19-6
4 65
+ g/
day
M
ean
219
265
M
edia
n 21
8 25
9
sd
48
73
U
pper
2.5
per
cent
ile
318
449
Lo
wer
2.5
per
cent
ile
136
150
% fo
od a
nd d
rink
ener
gy (e
xclu
ding
ene
rgy
from
alc
ohol
)
Mea
n 52
.2
50.9
Med
ian
52.1
50.8
sd
4.8
5.5
U
pper
2.5
per
cent
ile
62.0
62
.0
Lo
wer
2.5
per
cent
ile
43.1
40.3
% to
tal d
ieta
ry e
nerg
y (in
clud
ing
ener
gy fr
om a
lcoh
ol)
M
ean
52.2
50
.5
M
edia
n 52
.1 50
.4
sd
4.
8 5.
7
Upp
er 2
.5 p
erce
ntile
62
.0
61.7
Low
er 2
.5 p
erce
ntile
43
.1 39
.3
Num
ber o
f par
ticip
ants
(u
nwei
ghte
d)
665
744
25
1 24
3 76
407
122
47.8
47.6 6.8
61.3
35
.4
45.1
44.9
7.7
60
.7
30.7
1,126
23
1 22
3 75
389 113
46.9
47
.3 6.3
58.3
34
.0
44.9
45
.6
7.2
57.5
29.3 317
20
5 20
3 45
305
132
52.0
52
.2
5.1
62.5
43.0
52.0
52
.2
5.1
62.5
43.0
612
211
209 59
33
5 10
3
51.1
51.0
5.
6 61
.1 39
.7
50.7
50
.8
5.8
61.0
39
.2
753
19
7 19
3 61
336 92
48.2
48
.2
7.2
61.7
33
.8
46.3
46
.4
7.7
61.4
30
.9
1,571
18
7 18
7 50
303 99
47.5
47.4 6.5
59.6
33
.9
46.5
46.2
6.
9 59
.6
32.3
436
151
150 37
22
8 79
50.6
50
.6
5.7
61.6
40
.4
50.
6 50
.6
5.7
61.6
40
.4
604
21
2 20
9 47
308
134
52.1
52.1
4.9
62.3
43.0
52.1
52.1
4.9
62.3
43.0
1,277
23
9 23
3 72
398 115
51.0
50
.9
5.5
61.4
39
.9
50.6
50
.6
5.7
61.3
39
.3
1,497
22
4 21
6 74
389
101
48.0
47
.8 7.0
61.4
34
.5
45.7
45
.8
7.7
61.1
30.8
2,69
7
20
6 19
9 66
362
107
47.2
47.4 6.4
59.5
33.9
45.8
46
.2
7.1
59.4
29
.8
753
256
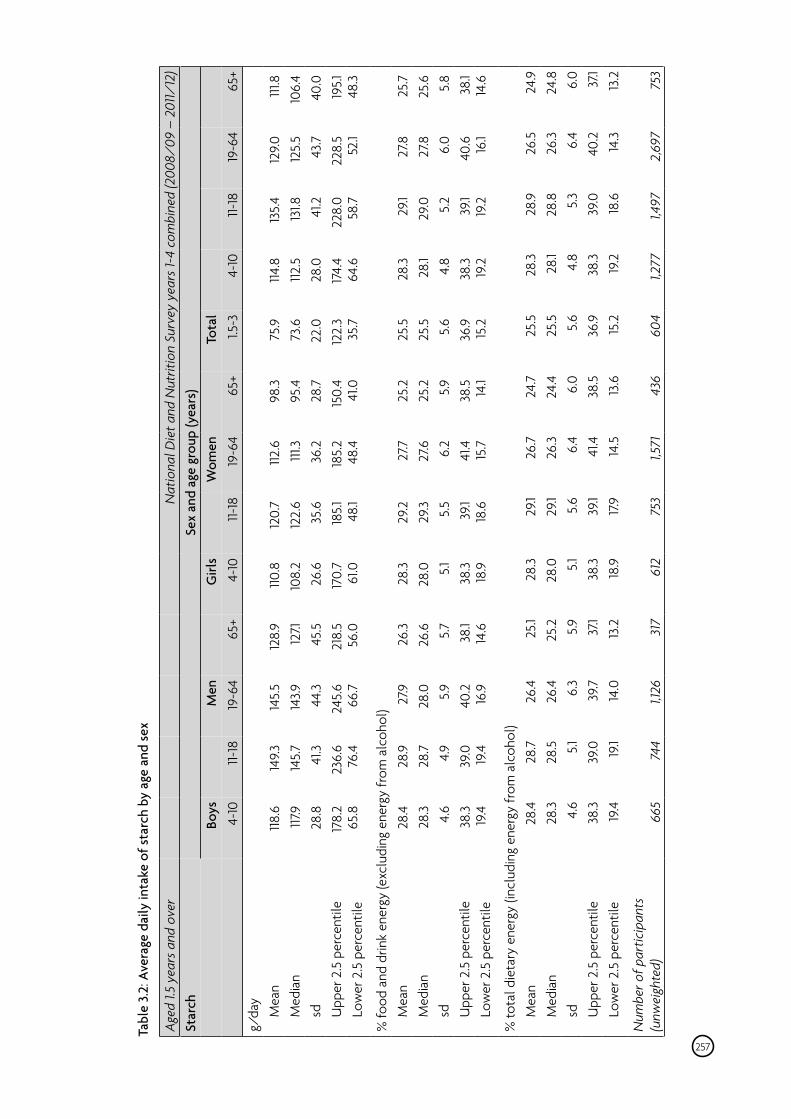
Tabl
e 3.
2: A
vera
ge d
aily
inta
ke o
f sta
rch
by a
ge a
nd se
x
Aged
1.5
year
s and
ove
r
N
atio
nal D
iet a
nd N
utrit
ion
Surv
ey y
ears
1-4
com
bine
d (2
008/
09 –
201
1/12
)St
arch
Se
x an
d ag
e gr
oup
(yea
rs)
Bo
ys
M
en
G
irls
W
omen
Tota
l
4-10
11-
18
19-6
4 65
+ 4-
10
11-18
19
-64
65+
1.5-3
4-
10
11-18
19
-64
65+
g/da
y
M
ean
118.6
14
9.3
145.
5
Med
ian
117.9
14
5.7
143.9
sd
28.8
41
.3
44.3
Upp
er 2
.5 p
erce
ntile
17
8.2
236.
6 24
5.6
65.8
76
.4
66.7
Low
er 2
.5 p
erce
ntile
% fo
od a
nd d
rink
ener
gy (e
xclu
ding
ene
rgy
from
alc
ohol
)
Mea
n 28
.4
28.9
27
.9
Med
ian
28.3
28
.7
28.0
sd
4.6
4.9
5.9
U
pper
2.5
per
cent
ile
38.3
39
.0
40.2
19
.4 19
.4 16
.9
Lo
wer
2.5
per
cent
ile
% to
tal d
ieta
ry e
nerg
y (in
clud
ing
ener
gy fr
om a
lcoh
ol)
M
ean
28.4
28
.7
26.4
Med
ian
28.3
28
.5
26.4
sd
4.6
5.1
6.3
U
pper
2.5
per
cent
ile
38.3
39
.0
39.7
Low
er 2
.5 p
erce
ntile
19
.4 19
.1 14
.0
Num
ber o
f par
ticip
ants
(u
nwei
ghte
d)
665
744
1,126
12
8.9
127.1
45
.5
218.
5 56
.0
26.3
26
.6
5.7
38.1
14.6
25.1
25.2
5.9
37
.1 13
.2
317
110
.8
108.
2 26
.6
170.
7 61
.0
28.3
28
.0
5.1
38.3
18
.9
28.3
28
.0
5.1
38.3
18
.9
612
12
0.7
122.
6 35
.6
185.1
48
.1
29.2
29
.3 5.5
39.1
18.6
29.1
29.1
5.6
39.1
17.9
753
112
.6
111.3
36
.2
185.
2 48
.4
27.7
27.6
6.
2 41
.4
15.7
26.7
26
.3
6.4
41.4
14
.5
1,571
98
.3
95.4
28
.7
150.
4 41
.0
25.2
25
.2
5.9
38.5
14
.1
24.7
24
.4
6.0
38.5
13
.6
436
75
.9
73.6
22
.0
122.
3 35
.7
25.5
25
.5
5.6
36.9
15
.2
25.5
25
.5
5.6
36.9
15
.2
604
114
.8
112.5
28
.0
174.
4 64
.6
28.3
28
.1 4.
8 38
.3
19.2
28.3
28
.1 4.
8 38
.3
19.2
1,277
13
5.4
131.8
41
.2
228.
0 58
.7
29.1
29.0
5.
2 39
.1 19
.2
28.9
28
.8
5.3
39.0
18
.6
1,497
12
9.0
125.
5 43
.7
228.
5 52
.1
27.8
27
.8
6.0
40.6
16
.1
26.5
26
.3
6.4
40.2
14
.3
2,69
7
111
.8
106.
4 40
.0
195.1
48
.3
25.7
25
.6
5.8
38.1
14.6
24.9
24
.8
6.0 37.1
13.2
753
257
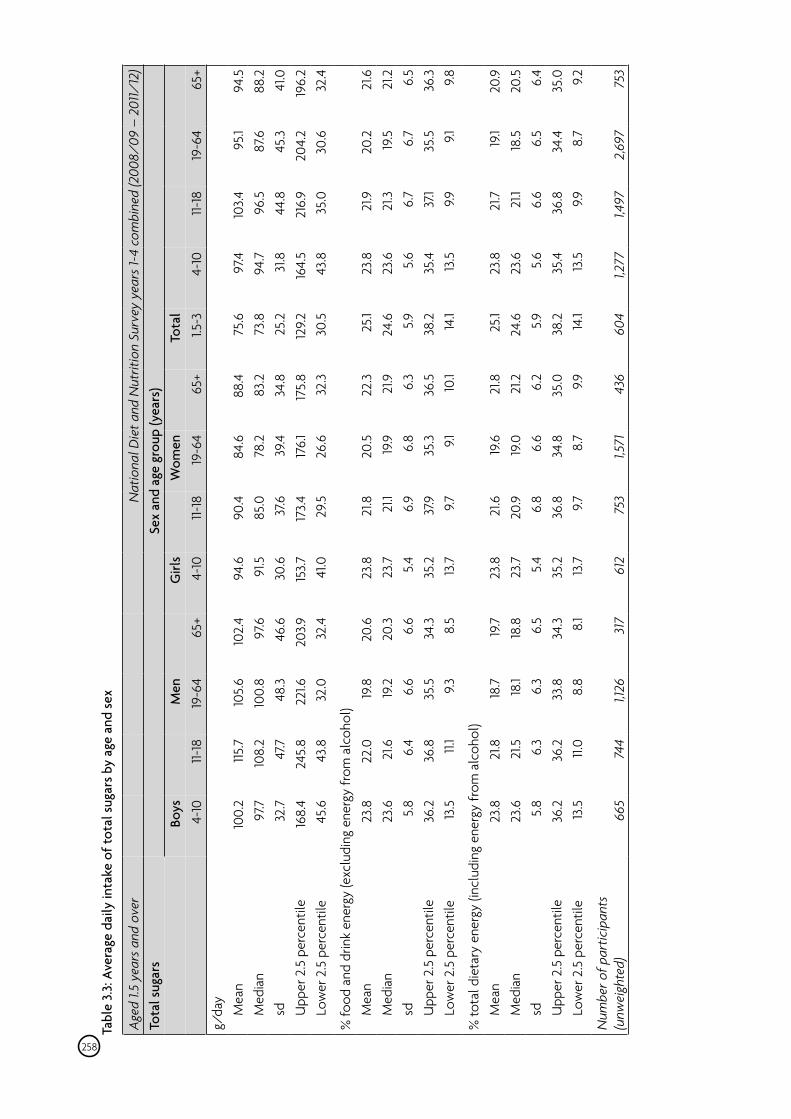
Tabl
e 3.
3: A
vera
ge d
aily
inta
ke o
f tot
al su
gars
by
age
and
sex
Aged
1.5
year
s and
ove
r
N
atio
nal D
iet a
nd N
utrit
ion
Surv
ey y
ears
1-4
com
bine
d (2
008/
09 –
201
1/12
)To
tal s
ugar
s Se
x an
d ag
e gr
oup
(yea
rs)
Bo
ys
M
en
G
irls
W
omen
Tota
l
4-10
11-
18
19-6
4 65
+ 4-
10
11-18
19
-64
65+
1.5-3
4-
10
11-18
19
-64
65+
g/da
y
M
ean
100.
2 115
.7
105.
6
Med
ian
97.7
108.
2 10
0.8
sd
32
.7 47
.7 48
.3
U
pper
2.5
per
cent
ile
168.
4 24
5.8
221.6
Low
er 2
.5 p
erce
ntile
45
.6
43.8
32
.0
% fo
od a
nd d
rink
ener
gy (e
xclu
ding
ene
rgy
from
alc
ohol
)
Mea
n 23
.8
22.0
19
.8
M
edia
n 23
.6
21.6
19
.2
sd
5.
8 6.
4 6.
6
Upp
er 2
.5 p
erce
ntile
36
.2
36.8
35
.5
Lo
wer
2.5
per
cent
ile
13.5
11.
1 9.
3
% to
tal d
ieta
ry e
nerg
y (in
clud
ing
ener
gy fr
om a
lcoh
ol)
M
ean
23.8
21
.8
18.7
Med
ian
23.6
21
.5
18.1
sd
5.
8 6.
3 6.
3
Upp
er 2
.5 p
erce
ntile
36
.2
36.2
33
.8
Lo
wer
2.5
per
cent
ile
13.5
11.
0 8.
8
Num
ber o
f par
ticip
ants
(u
nwei
ghte
d)
665
744
1,126
10
2.4
97.6
46
.6
203.9
32
.4
20.6
20
.3
6.6
34.3
8.
5
19.7
18.8
6.
5 34
.3
8.1
317
94
.6
91.5
30
.6
153.7
41
.0
23.8
23
.7
5.4
35.2
13
.7
23.8
23
.7
5.4
35.2
13
.7
612
90
.4
85.0
37
.6 17
3.4
29.5
21.8
21
.1 6.
9 37
.9 9.7
21.6
20
.9
6.8
36.8
9.
7
753
84
.6
78.2
39
.4
176.
1 26
.6
20.5
19
.9 6.8
35.3
9.1
19.6
19
.0
6.6
34.8
8.
7
1,571
88
.4
83.2
34
.8
175.
8 32
.3
22.3
21
.9
6.3
36.5
10
.1
21.8
21
.2
6.2
35.0
9.9
436
75
.6
73.8
25
.2
129.
2 30
.5
25.1
24.6
5.9
38
.2
14.1
25.1
24.6
5.9
38
.2
14.1
604
97
.4 94
.7
31.8
16
4.5
43.8
23.8
23
.6
5.6
35.4
13
.5
23.8
23
.6
5.6
35.4
13
.5
1,277
10
3.4
96.5
44
.8
216.
9 35
.0
21.9
21
.3
6.7
37.1
9.9
21.7
21
.1 6.
6 36
.8
9.9
1,497
95
.1 87
.6
45.3
20
4.2
30.6
20.2
19
.5
6.7
35.5
9.1
19.1
18.5
6.
5 34
.4
8.7
2,69
7
94
.5
88.2
41
.0
196.
2 32
.4
21.6
21
.2
6.5
36.3
9.
8
20.9
20
.5
6.4
35.0
9.
2
753
258
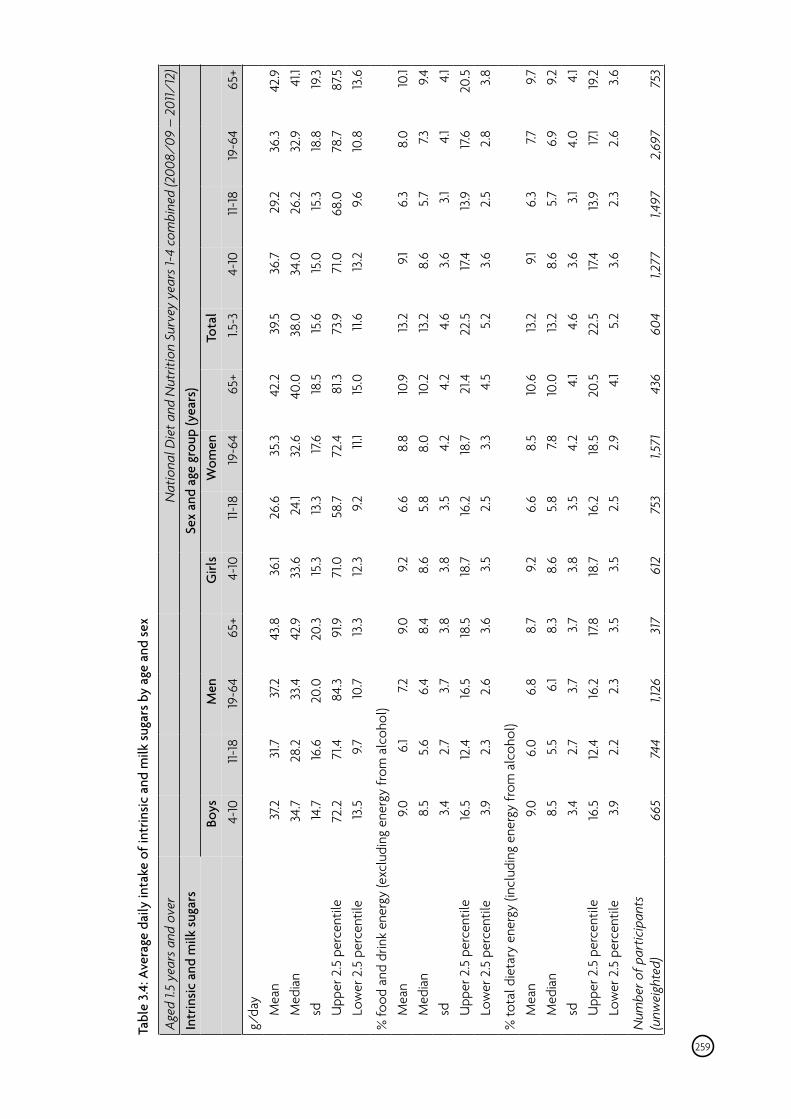
Tabl
e 3.4
: Ave
rage
dai
ly in
take
of i
ntrin
sic a
nd m
ilk su
gars
by
age
and
sex
Aged
1.5
year
s and
ove
r
N
atio
nal D
iet a
nd N
utrit
ion
Surv
ey y
ears
1-4
com
bine
d (2
008/
09 –
201
1/12
)In
trin
sic a
nd m
ilk su
gars
Se
x an
d ag
e gr
oup
(yea
rs)
Bo
ys
M
en
G
irls
W
omen
Tota
l
4-10
11-
18
19-6
4 65
+ 4-
10
11-18
19
-64
65+
1.5-3
4-
10
11-18
19
-64
65+
g/da
y
Mea
n 37
.2 31
.7
M
edia
n 34
.7
28.2
sd
14.7
16
.6
U
pper
2.5
per
cent
ile
72.2
71
.4
Lo
wer
2.5
per
cent
ile
13.5
9.
7
% fo
od a
nd d
rink
ener
gy (e
xclu
ding
ene
rgy
from
alc
ohol
)
Mea
n 9.
0 6.
1
Med
ian
8.5
5.6
sd
3.4
2.
7
Upp
er 2
.5 p
erce
ntile
16
.5
12.4
Low
er 2
.5 p
erce
ntile
3.9
2.
3
% to
tal d
ieta
ry e
nerg
y (in
clud
ing
ener
gy fr
om a
lcoh
ol)
M
ean
9.0
6.0
M
edia
n 8.
5 5.
5
sd
3.4
2.7
U
pper
2.5
per
cent
ile
16.5
12
.4
Lo
wer
2.5
per
cent
ile
3.9
2.2
Num
ber o
f par
ticip
ants
(u
nwei
ghte
d)
665
744
37
.2 33
.4
20.0
84
.3
10.7
7.2
6.4 3.7
16.5
2.
6
6.8 6.1
3.7
16.2
2.
3
1,126
43
.8
42.9
20.3
91
.9
13.3
9.0
8.4
3.8
18.5
3.
6
8.7
8.3
3.7
17.8
3.
5
317
36
.1 33
.6
15.3
71
.0
12.3
9.2
8.6
3.8
18.7
3.
5
9.2
8.6
3.8
18.7
3.
5
612
26
.6
24.1
13.3
58
.7
9.2
6.6
5.8 3.5
16.2
2.
5
6.6
5.8 3.5
16.2
2.
5
753
35
.3
32.6
17
.6
72.4
11.
1
8.8
8.0 4.2
18.7
3.
3
8.5 7.8
4.2
18.5
2.
9
1,571
42
.2
40.0
18
.5
81.3
15
.0
10.9
10
.2
4.2
21.4
4.
5
10.6
10
.0
4.1
20.5
4.
1
436
39
.5 38
.0
15.6
73
.9
11.6
13.2
13
.2
4.6
22.5
5.
2
13.2
13
.2
4.6
22.5
5.
2
604
36
.7
34.0
15
.0
71.0
13
.2
9.1
8.6
3.6
17.4 3.6 9.1
8.6
3.6
17.4 3.6
1,277
29
.2
26.2
15
.3
68.0
9.
6
6.3
5.7 3.1
13.9
2.
5
6.3
5.7 3.1
13.9
2.
3
1,497
36
.3
32.9
18.8
78
.7 10
.8
8.0 7.3
4.1
17.6
2.
8 7.7
6.9
4.0 17.1
2.6
2,69
7
42
.9 41.1
19.3
87.5
13
.6
10.1
9.4 4.1
20.5
3.
8 9.7
9.2 4.1
19.2
3.
6
753
259
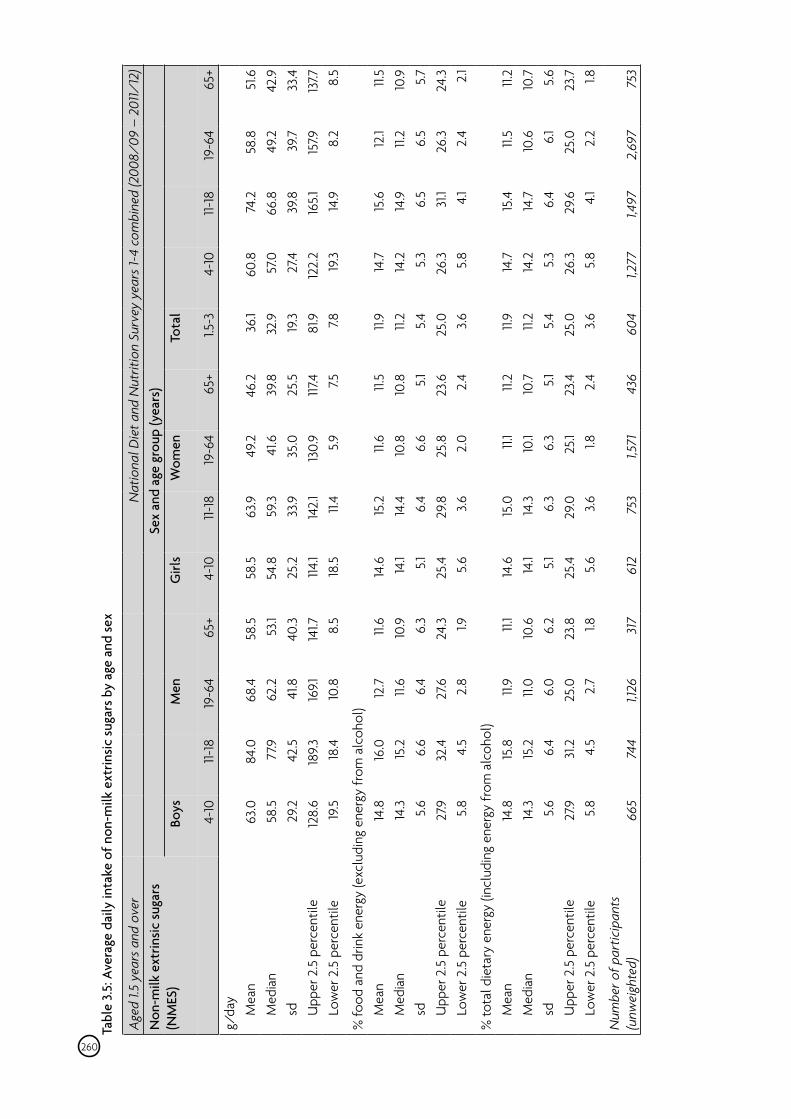
Tabl
e 3.
5: A
vera
ge d
aily
inta
ke o
f non
-milk
ext
rinsic
suga
rs b
y ag
e an
d se
x
Aged
1.5
year
s and
ove
r
N
atio
nal D
iet a
nd N
utrit
ion
Surv
ey y
ears
1-4
com
bine
d (2
008/
09 –
201
1/12
)N
on-m
ilk e
xtrin
sic su
gars
(NM
ES)
Sex
and
age
grou
p (y
ears
)Bo
ys
M
en
G
irls
W
omen
Tota
l
4-
10
11-18
19
-64
65+
4-10
11-
18
19-6
4 65
+ 1.5
-3
4-10
11-
18
19-6
4 65
+ g/
day
M
ean
63.0
84
.0
M
edia
n 58
.5
77.9
sd
29
.2
42.5
Upp
er 2
.5 p
erce
ntile
12
8.6
189.
3
Low
er 2
.5 p
erce
ntile
19
.5
18.4
% fo
od a
nd d
rink
ener
gy (e
xclu
ding
ene
rgy
from
alc
ohol
)
Mea
n 14
.8
16.0
Med
ian
14.3
15
.2
sd
5.
6 6.
6
Upp
er 2
.5 p
erce
ntile
27
.9 32
.4
Lo
wer
2.5
per
cent
ile
5.8
4.5
% to
tal d
ieta
ry e
nerg
y (in
clud
ing
ener
gy fr
om a
lcoh
ol)
M
ean
14.8
15
.8
M
edia
n 14
.3
15.2
sd
5.6
6.4
U
pper
2.5
per
cent
ile
27.9
31.2
Low
er 2
.5 p
erce
ntile
5.
8 4.
5
Num
ber o
f par
ticip
ants
(u
nwei
ghte
d)
665
744
68
.4
62.2
41
.8
169.1
10
.8
12.7
11.
6 6.
4 27
.6
2.8
11.9
11.0
6.0
25.0
2.
7
1,126
58
.5
53.1
40.3
14
1.7
8.5
11.6
10.9
6.
3 24
.3
1.9
11.1
10.6
6.
2 23
.8
1.8
317
58
.5
54.8
25
.2
114.1
18.5
14.6
14
.1 5.1
25.4
5.
6
14.6
14
.1 5.1
25.4
5.
6
612
63
.9
59.3
33.9
14
2.1
11.4
15.2
14
.4
6.4
29.8
3.
6
15.0
14
.3
6.3
29.0
3.
6
753
49
.2
41.6
35
.0
130.
9 5.9
11.6
10.8
6.
6 25
.8
2.0 11.1
10.1
6.3
25.1 1.8
1,571
46
.2
39.8
25
.5
117.4
7.5
11.5
10.8
5.1
23
.6
2.4
11.2
10.7
5.1
23
.4
2.4
436
36
.1 32
.9 19
.3 81
.9
7.8
11.9
11.2
5.4
25.0
3.
6
11.9
11.2
5.4
25.0
3.
6
604
60
.8
57.0
27
.4 12
2.2
19.3
14.7
14
.2
5.3
26.3
5.
8
14.7
14
.2
5.3
26.3
5.
8
1,277
74
.2
66.8
39
.8
165.1
14
.9
15.6
14
.9
6.5
31.1 4.1
15.4
14
.7
6.4
29.6
4.
1
1,497
58
.8
49.2
39
.7
157.9
8.
2
12.1
11.2
6.5
26.3
2.
4
11.5
10.6
6.
1 25
.0
2.2
2,69
7
51
.6
42.9
33.4
13
7.7
8.5
11.5
10.9
5.
7 24
.3
2.1
11.2
10.7
5.
6 23
.7
1.8
753
260
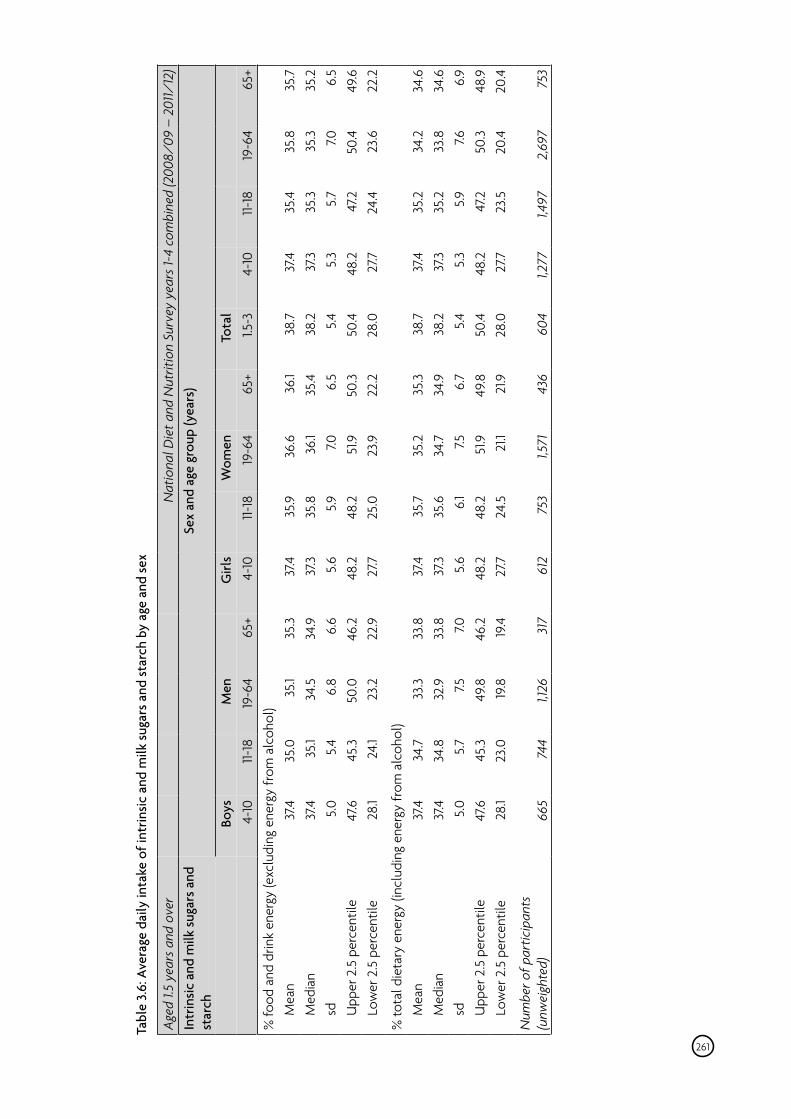
Tabl
e 3.
6: A
vera
ge d
aily
inta
ke o
f int
rinsic
and
milk
suga
rs a
nd st
arch
by
age
and
sex
Aged
1.5
year
s and
ove
r
N
atio
nal D
iet a
nd N
utrit
ion
Surv
ey y
ears
1-4
com
bine
d (2
008/
09 –
201
1/12
)In
trin
sic a
nd m
ilk su
gars
and
star
ch
Sex
and
age
grou
p (y
ears
)
Bo
ys
M
en
G
irls
W
omen
Tota
l
4-10
11-
18
19-6
4 65
+ 4-
10
11-18
19
-64
65+
1.5-3
4-
10
11-18
19
-64
65+
% fo
od a
nd d
rink
ener
gy (e
xclu
ding
ene
rgy
from
alc
ohol
)
Mea
n 37
.4 35
.0
35.1
35.3
37
.4 35
.9
36.6
36
.1 38
.7
37.4
35.4
35
.8
35.7
Med
ian
37.4
35.1
34.5
34
.9
37.3
35.8
36
.1 35
.4
38.2
37
.3 35
.3
35.3
35
.2
sd
5.
0 5.
4 6.
8 6.
6 5.
6 5.9
7.0
6.
5 5.
4 5.
3 5.
7 7.0
6.
5
Upp
er 2
.5 p
erce
ntile
47
.6 45
.3
50.0
46
.2
48.2
48
.2
51.9
50
.3
50.4
48
.2
47.2
50.4
49
.6
Lo
wer
2.5
per
cent
ile
28.1
24.1
23.2
22
.9 27
.7 25
.0
23.9
22
.2
28.0
27
.7 24
.4
23.6
22
.2
% to
tal d
ieta
ry e
nerg
y (in
clud
ing
ener
gy fr
om a
lcoh
ol)
M
ean
37.4
34.7
33
.3
33.8
37
.4 35
.7
35.2
35
.3
38.7
37
.4 35
.2
34.2
34
.6
M
edia
n 37
.4 34
.8
32.9
33.8
37
.3 35
.6
34.7
34
.9
38.2
37
.3 35
.2
33.8
34
.6
sd
5.
0 5.
7 7.5
7.0
5.
6 6.
1 7.5
6.
7 5.
4 5.
3 5.9
7.6
6.
9
Upp
er 2
.5 p
erce
ntile
47
.6 45
.3
49.8
46
.2
48.2
48
.2
51.9
49
.8
50.4
48
.2
47.2
50.3
48
.9
Lo
wer
2.5
per
cent
ile
28.1
23.0
19
.8
19.4
27.7
24.5
21
.1 21
.9
28.0
27
.7 23
.5
20.4
20
.4
Num
ber o
f par
ticip
ants
(u
nwei
ghte
d)
665
744
1,126
31
7 61
2 75
3 1,5
71
436
604
1,277
1,4
97
2,69
7 75
3
261
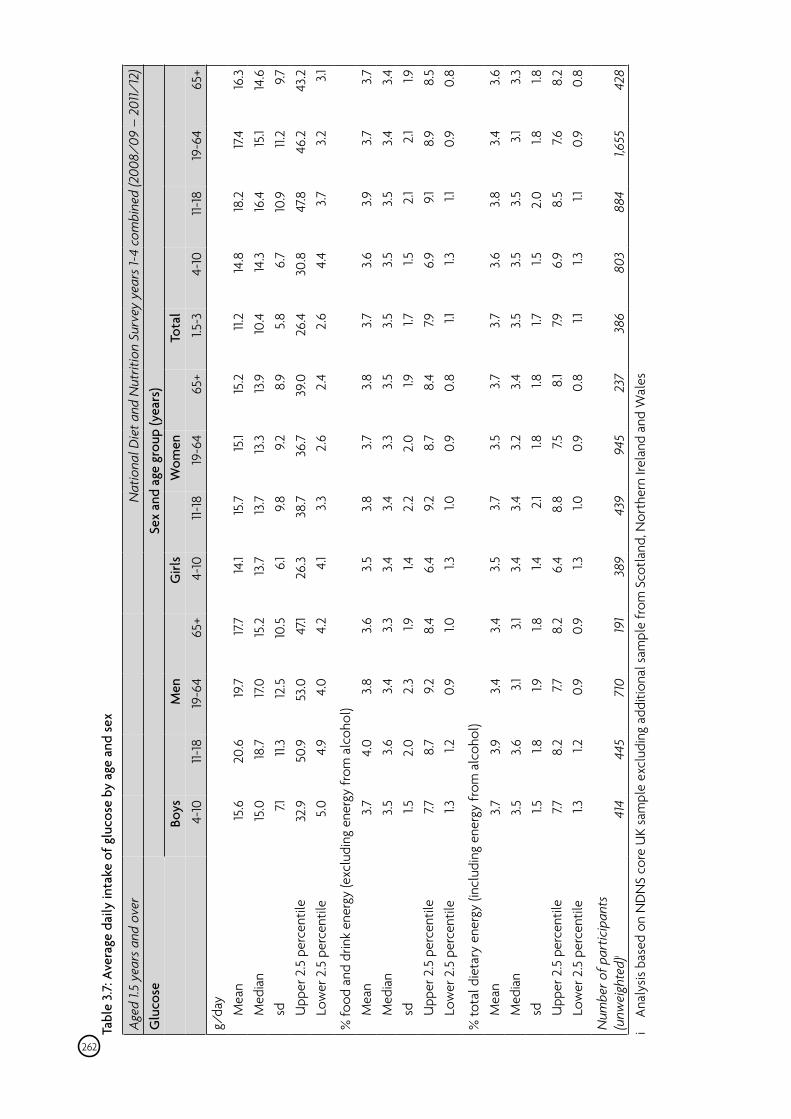
Tabl
e 3.7
: Ave
rage
dai
ly in
take
of g
luco
se b
y ag
e an
d se
x
Aged
1.5
year
s and
ove
r
N
atio
nal D
iet a
nd N
utrit
ion
Surv
ey y
ears
1-4
com
bine
d (2
008/
09 –
201
1/12
)G
luco
se
Sex
and
age
grou
p (y
ears
)
Boys
Men
Girl
s
Wom
en
To
tal
4-
10
11-18
19
-64
65+
4-10
11-
18
19-6
4 65
+ 1.5
-3
4-10
11-
18
19-6
4 65
+ g/
day
M
ean
15.6
20
.6
M
edia
n 15
.0
18.7
sd
7.1
11.3
U
pper
2.5
per
cent
ile
32.9
50.9
Low
er 2
.5 p
erce
ntile
5.
0 4.
9
% fo
od a
nd d
rink
ener
gy (e
xclu
ding
ene
rgy
from
alc
ohol
)
Mea
n 3.7
4.
0
Med
ian
3.5
3.6
sd
1.5
2.
0
Upp
er 2
.5 p
erce
ntile
7.7
8.
7
Low
er 2
.5 p
erce
ntile
1.3
1.2
% to
tal d
ieta
ry e
nerg
y (in
clud
ing
ener
gy fr
om a
lcoh
ol)
M
ean
3.7
3.9
M
edia
n 3.
5 3.
6
sd
1.5
1.8
U
pper
2.5
per
cent
ile
7.7
8.2
Lo
wer
2.5
per
cent
ile
1.3
1.2
Num
ber o
f par
ticip
ants
(u
nwei
ghte
d)i
414
445
19
.7 17
.0
12.5
53
.0
4.0 3.8 3.4
2.
3 9.
2 0.
9 3.4
3.1
1.9
7.7
0.9
710
17
.7 15
.2
10.5
47
.1 4.
2
3.6 3.3 1.9
8.4 1.0
3.4
3.1
1.8
8.2
0.9 191
14
.1 13
.7
6.1
26.3
4.
1
3.5
3.4
1.4
6.4 1.3
3.5
3.4
1.4
6.4 1.3
389
15
.7
13.7
9.
8 38
.7
3.3
3.8 3.4
2.
2 9.
2 1.0
3.7
3.4
2.1
8.8 1.0
439
15
.1 13
.3
9.2
36.7
2.
6 3.7
3.3
2.0 8.7
0.9 3.5
3.2 1.8
7.5
0.9
945
15
.2
13.9
8.
9 39
.0
2.4
3.8 3.5 1.9
8.4
0.8 3.7
3.4
1.8
8.
1 0.
8
237
11.
2 10
.4
5.8
26.4
2.
6 3.7
3.5 1.7
7.9 1.1
3.7
3.5 1.7
7.9 1.1
386
14
.8
14.3
6.
7 30
.8
4.4
3.6 3.5 1.5
6.9 1.3
3.6 3.5 1.5
6.9 1.3
803
18
.2
16.4
10
.9
47.8 3.7
3.9
3.5 2.1 9.1
1.1
3.8 3.5
2.0 8.5 1.1
884
17
.4 15.1
11.2
46.2
3.
2 3.7
3.4
2.1
8.9
0.9 3.4
3.1
1.8
7.6
0.
9
1,655
16
.3
14.6
9.
7 43
.2
3.1
3.7
3.4
1.9
8.5
0.8 3.6 3.3 1.8
8.2
0.8
428
i An
alys
is ba
sed
on N
DN
S co
re U
K sa
mpl
e ex
clud
ing
addi
tiona
l sam
ple
from
Sco
tland
, Nor
ther
n Ire
land
and
Wal
es
262

Tabl
e 3.
8: A
vera
ge d
aily
inta
ke o
f fru
ctos
e by
age
and
sex
Aged
1.5
year
s and
ove
r
N
atio
nal D
iet a
nd N
utrit
ion
Surv
ey y
ears
1-4
com
bine
d (2
008/
09 –
201
1/12
)Fr
ucto
se
Sex
and
age
grou
p (y
ears
)
Boys
Men
Girl
s
Wom
en
To
tal
4-
10
11-18
19
-64
65+
4-10
11-
18
19-6
4 65
+ 1.5
-3
4-10
11-
18
19-6
4 65
+ g/
day
M
ean
17.5
19
.4
Med
ian
15.8
16
.8
sd
9.
4 10
.9
U
pper
2.5
per
cent
ile
41.2
45
.7
Lo
wer
2.5
per
cent
ile
4.6
3.8
% fo
od a
nd d
rink
ener
gy (e
xclu
ding
ene
rgy
from
alc
ohol
)
Mea
n 4.
2 3.7
Med
ian
3.8
3.4
sd
2.
2 1.9
Upp
er 2
.5 p
erce
ntile
9.
8 7.9
Low
er 2
.5 p
erce
ntile
1.3
1.0
% to
tal d
ieta
ry e
nerg
y (in
clud
ing
ener
gy fr
om a
lcoh
ol)
M
ean
4.2
3.7
M
edia
n 3.
8 3.4
sd
2.2
1.8
U
pper
2.5
per
cent
ile
9.8
7.9
Lo
wer
2.5
per
cent
ile
1.3
0.9
Num
ber o
f par
ticip
ants
(u
nwei
ghte
d)i
414
445
17
.3 15
.0
11.5
46.6
2.
8 3.3
2.8 2.1
8.1
0.6 3.1
2.6
2.0 7.5
0.5
710
17
.4 15
.0
10.9
42
.4
3.4
3.5 3.3
2.0
8.0
0.8 3.3
3.0 1.9
7.7
0.
7
191
15
.5
14.3
7.7
34
.0
3.3
3.9
3.7
1.9
8.6 1.0
3.9
3.7
1.9
8.6 1.0
389
15
.6
14.6
9.
4 37
.5 3.0 3.8 3.4
2.
2 9.
2 0.
8 3.7
3.4
2.1
9.2
0.8
439
15
.4
13.8
9.
7 37
.4 2.0 3.8 3.4
2.
1 9.
2 0.
7
3.6 3.2
2.0 8.1
0.6
945
15
.6
13.7
10
.2
39.1
2.3
3.9
3.5
2.3
9.7
0.8
3.8 3.3
2.2
9.6
0.8
237
12
.9 11.
6 7.7
31.7
2.
6 4.3
3.9
2.2
9.5 1.1
4.3
3.9
2.2
9.5 1.1
386
16
.5
14.7
8.
6 37
.0
4.0 4.1
3.7
2.0 9.3 1.2
4.1
3.7
2.0 9.2 1.2
803
17
.6
15.9
10
.4
43.0
3.1
3.8 3.4
2.
0 8.
8 0.
9 3.7
3.4
2.0 8.5
0.9
884
16
.3
14.4
10
.7
42.5
2.
3
3.6 3.1
2.1
8.8
0.6 3.3
2.9
2.0 7.9
0.6
1,655
16
.4
14.2
10
.5
41.7
2.
9
3.8 3.4
2.
2 9.
2 0.
8 3.6 3.1
2.1
8.9
0.8
428
i An
alys
is ba
sed
on N
DN
S co
re U
K sa
mpl
e ex
clud
ing
addi
tiona
l sam
ple
from
Sco
tland
, Nor
ther
n Ire
land
and
Wal
es
263
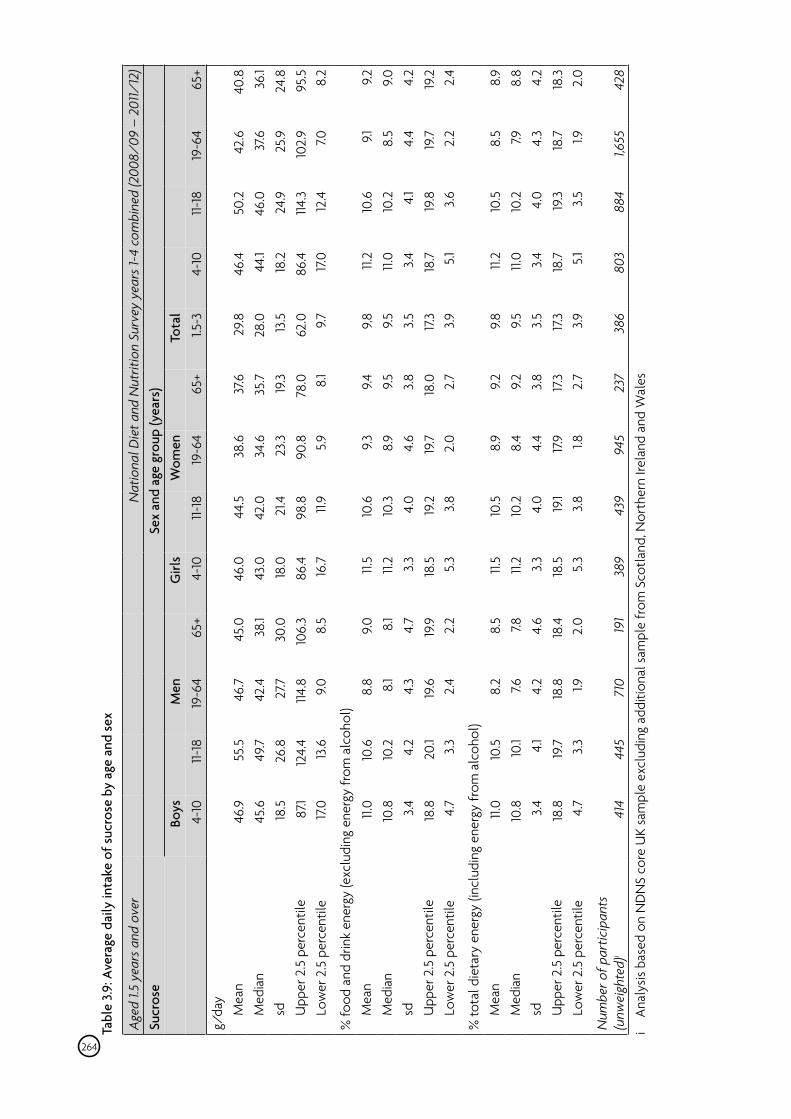
Tabl
e 3.9
: Ave
rage
dai
ly in
take
of s
ucro
se b
y ag
e an
d se
x
Aged
1.5
year
s and
ove
r
N
atio
nal D
iet a
nd N
utrit
ion
Surv
ey y
ears
1-4
com
bine
d (2
008/
09 –
201
1/12
)Su
cros
e Se
x an
d ag
e gr
oup
(yea
rs)
Bo
ys
M
en
G
irls
W
omen
Tota
l
4-10
11-
18
19-6
4 65
+ 4-
10
11-18
19
-64
65+
1.5-3
4-
10
11-18
19
-64
65+
g/da
y
Mea
n 46
.9
55.5
Med
ian
45.6
49
.7
sd
18.5
26
.8
U
pper
2.5
per
cent
ile
87.1
124.
4
Low
er 2
.5 p
erce
ntile
17
.0
13.6
% fo
od a
nd d
rink
ener
gy (e
xclu
ding
ene
rgy
from
alc
ohol
)
Mea
n 11.
0 10
.6
M
edia
n 10
.8
10.2
sd
3.4
4.2
U
pper
2.5
per
cent
ile
18.8
20
.1
Low
er 2
.5 p
erce
ntile
4.
7 3.
3
% to
tal d
ieta
ry e
nerg
y (in
clud
ing
ener
gy fr
om a
lcoh
ol)
M
ean
11.0
10.5
Med
ian
10.8
10
.1
sd
3.4
4.1
U
pper
2.5
per
cent
ile
18.8
19
.7
Low
er 2
.5 p
erce
ntile
4.
7 3.
3
Num
ber o
f par
ticip
ants
(u
nwei
ghte
d)i
414
445
46
.7
42.4
27
.7 114
.8
9.0
8.8 8.1
4.3
19.6
2.
4
8.2 7.6
4.2
18.8
1.9
710
45
.0
38.1
30.0
10
6.3
8.5
9.0 8.1
4.7
19.9 2.2
8.5 7.8
4.6
18.4
2.
0 191
46
.0
43.0
18
.0
86.4
16
.7
11.5
11.2 3.3
18.5
5.
3
11.5
11.2 3.3
18.5
5.
3
389
44
.5
42.0
21
.4
98.8
11.
9
10.6
10
.3
4.0
19.2
3.
8
10.5
10
.2
4.0 19.1
3.8
439
38
.6
34.6
23
.3
90.8
5.9
9.3
8.9
4.6
19.7 2.0 8.9
8.4
4.4
17.9 1.8
945
37
.6 35
.7
19.3
78.0
8.
1
9.4 9.5
3.8
18.0
2.
7
9.2
9.2
3.8
17.3 2.7
237
29
.8
28.0
13
.5
62.0
9.
7
9.8 9.5
3.5
17.3 3.9
9.8 9.5
3.5
17.3 3.9
386
46
.4
44.1
18.2
86
.4
17.0
11.2
11.0 3.4
18
.7
5.1
11.2
11.0 3.4
18
.7
5.1
803
50
.2
46.0
24
.9
114.3
12
.4
10.6
10
.2
4.1
19.8
3.
6
10.5
10
.2
4.0
19.3 3.5
884
42
.6
37.6
25.9
10
2.9 7.0
9.1
8.5
4.4
19.7 2.2
8.5 7.9
4.3
18.7
1.9
1,655
40
.8
36.1
24.8
95
.5
8.2
9.2
9.0 4.2
19.2
2.
4
8.9
8.8
4.2
18.3
2.
0
428
i An
alys
is ba
sed
on N
DN
S co
re U
K sa
mpl
e ex
clud
ing
addi
tiona
l sam
ple
from
Sco
tland
, Nor
ther
n Ire
land
and
Wal
es
264
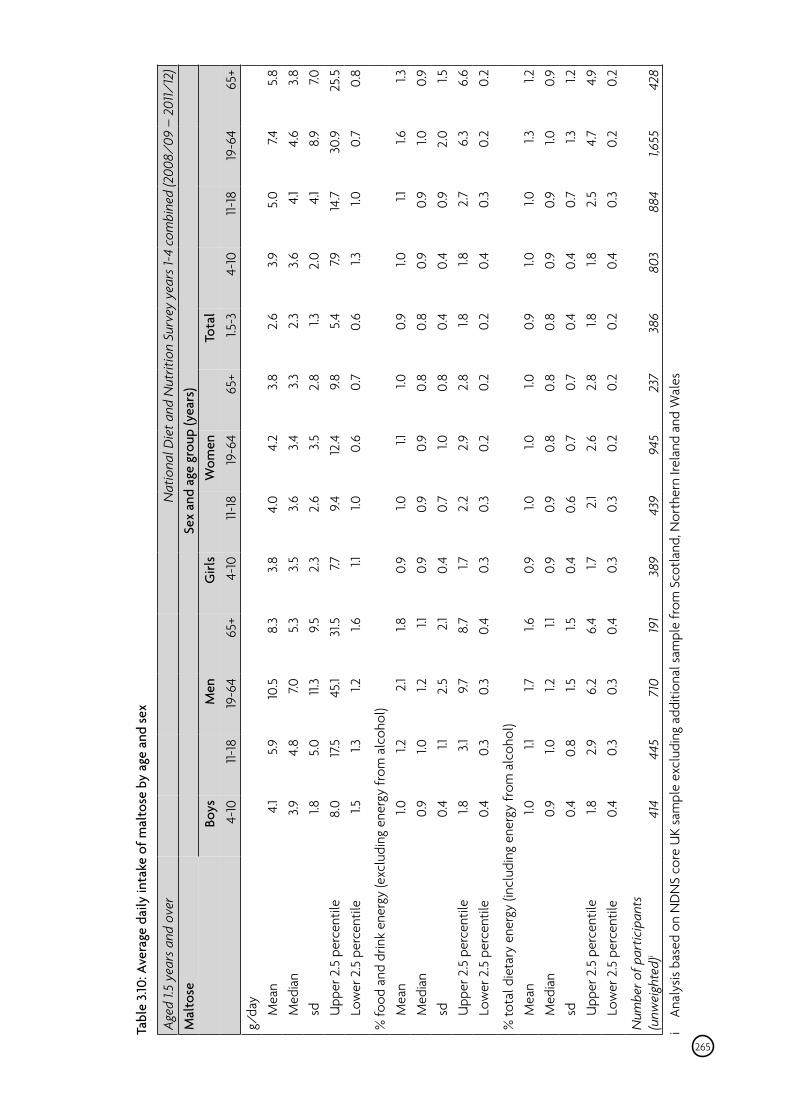
Tabl
e 3.1
0: A
vera
ge d
aily
inta
ke o
f mal
tose
by
age
and
sex
Aged
1.5
year
s and
ove
r
N
atio
nal D
iet a
nd N
utrit
ion
Surv
ey y
ears
1-4
com
bine
d (2
008/
09 –
201
1/12
)M
alto
se
Sex
and
age
grou
p (y
ears
)
Boys
Men
Girl
s
Wom
en
To
tal
4-
10
11-18
19
-64
65+
4-10
11-
18
19-6
4 65
+ 1.5
-3
4-10
11-
18
19-6
4 65
+ g/
day
M
ean
4.1
5.9
M
edia
n 3.9
4.
8
sd
1.8
5.0
U
pper
2.5
per
cent
ile
8.0
17.5
Low
er 2
.5 p
erce
ntile
1.5
1.3
% fo
od a
nd d
rink
ener
gy (e
xclu
ding
ene
rgy
from
alc
ohol
)
Mea
n 1.0
1.2
Med
ian
0.9
1.0
sd
0.
4 1.1
Upp
er 2
.5 p
erce
ntile
1.8
3.1
Low
er 2
.5 p
erce
ntile
0.
4 0.
3
% to
tal d
ieta
ry e
nerg
y (in
clud
ing
ener
gy fr
om a
lcoh
ol)
M
ean
1.0
1.1
M
edia
n 0.
9 1.0
sd
0.4
0.8
U
pper
2.5
per
cent
ile
1.8
2.9
Lo
wer
2.5
per
cent
ile
0.4
0.3
Num
ber o
f par
ticip
ants
(u
nwei
ghte
d)i
414
445
10
.5
7.0
11.3
45.1 1.2
2.1
1.2
2.5
9.7
0.3 1.7
1.2
1.5
6.2
0.3
710
8.
3 5.
3 9.
5 31
.5
1.6
1.8
1.1
2.1
8.7
0.4 1.6
1.1
1.5
6.
4 0.
4 191
3.
8 3.5
2.3 7.7 1.1
0.9
0.9
0.4 1.7
0.3
0.9
0.9
0.4 1.7
0.3
389
4.
0 3.6
2.6 9.4 1.0
1.0
0.9
0.7
2.2
0.3 1.0
0.9
0.6 2.1
0.3
439
4.
2 3.4
3.
5 12
.4
0.6 1.1
0.9 1.0
2.
9 0.
2 1.0
0.8
0.7
2.6
0.2
945
3.
8 3.3
2.8
9.8
0.7 1.0
0.8
0.8
2.8
0.2 1.0
0.8
0.7
2.8
0.2
237
2.
6 2.3 1.3
5.4
0.6
0.9
0.8
0.4 1.8
0.
2
0.9
0.8
0.4 1.8
0.
2
386
3.9
3.6
2.0 7.9
1.3
1.0
0.9
0.4 1.8
0.
4 1.0
0.9
0.4 1.8
0.
4
803
5.
0 4.1
4.1
14.7
1.0
1.1
0.9
0.9 2.7
0.3 1.0
0.9
0.7
2.5
0.3
884
7.4
4.6
8.9
30.9
0.
7 1.6
1.0
2.0 6.3
0.2 1.3
1.0
1.3
4.7
0.2
1,655
5.
8 3.
8 7.0
25.5
0.
8 1.3
0.9 1.5
6.
6 0.
2 1.2
0.9 1.2
4.
9 0.
2
428
i An
alys
is ba
sed
on N
DN
S co
re U
K sa
mpl
e ex
clud
ing
addi
tiona
l sam
ple
from
Sco
tland
, Nor
ther
n Ire
land
and
Wal
es
265
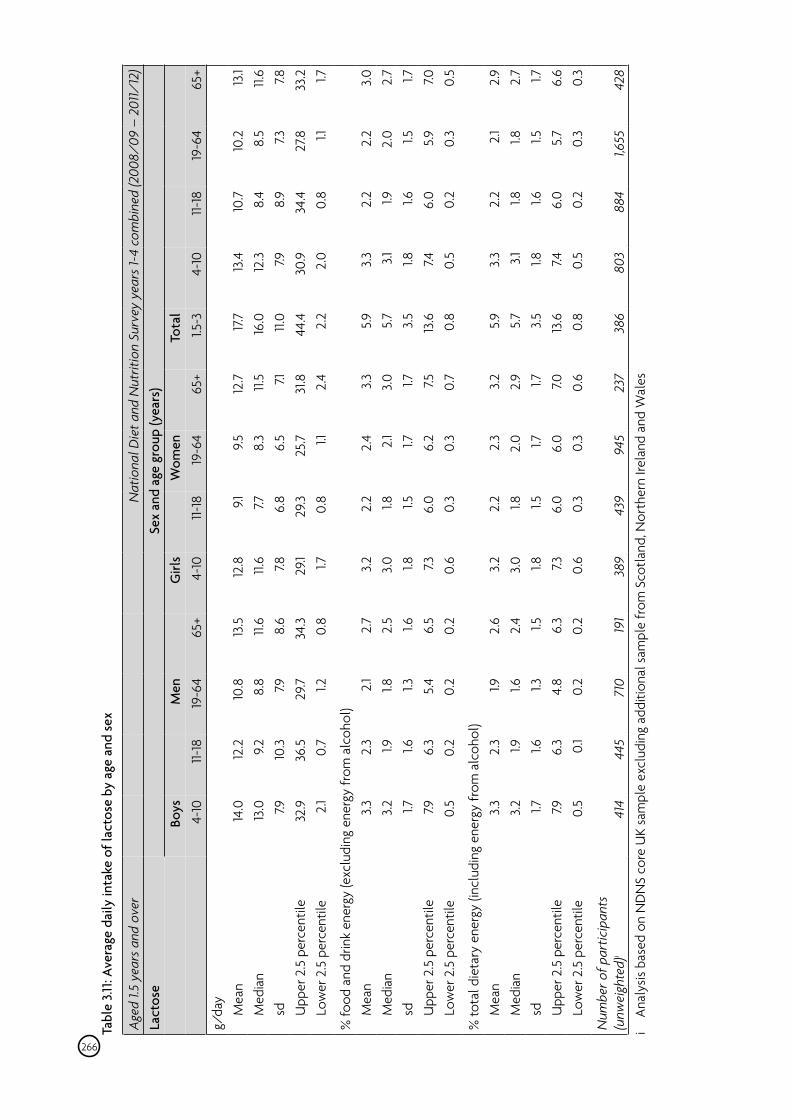
Tabl
e 3.1
1: Av
erag
e da
ily in
take
of l
acto
se b
y ag
e an
d se
x
Aged
1.5
year
s and
ove
r
N
atio
nal D
iet a
nd N
utrit
ion
Surv
ey y
ears
1-4
com
bine
d (2
008/
09 –
201
1/12
)La
ctos
e Se
x an
d ag
e gr
oup
(yea
rs)
Bo
ys
M
en
G
irls
W
omen
Tota
l
4-10
11-
18
19-6
4 65
+ 4-
10
11-18
19
-64
65+
1.5-3
4-
10
11-18
19
-64
65+
g/da
y
Mea
n 14
.0
12.2
Med
ian
13.0
9.
2
sd
7.9
10.3
Upp
er 2
.5 p
erce
ntile
32
.9 36
.5
Lo
wer
2.5
per
cent
ile
2.1
0.7
% fo
od a
nd d
rink
ener
gy (e
xclu
ding
ene
rgy
from
alc
ohol
)
Mea
n 3.
3 2.
3
Med
ian
3.2
1.9
sd
1.7
1.6
Upp
er 2
.5 p
erce
ntile
7.9
6.
3
Low
er 2
.5 p
erce
ntile
0.
5 0.
2
% to
tal d
ieta
ry e
nerg
y (in
clud
ing
ener
gy fr
om a
lcoh
ol)
M
ean
3.3
2.3
M
edia
n 3.
2 1.9
sd
1.7
1.6
U
pper
2.5
per
cent
ile
7.9
6.3
Lo
wer
2.5
per
cent
ile
0.5
0.1
Num
ber o
f par
ticip
ants
(u
nwei
ghte
d)i
414
445
10
.8
8.8 7.9
29.7 1.2
2.1
1.8
1.3
5.4
0.2 1.9
1.6
1.3
4.8
0.2
710
13
.5
11.6
8.6
34.3
0.
8 2.7
2.5 1.6
6.5
0.2
2.6
2.4 1.5
6.
3 0.
2
191
12
.8
11.6 7.8
29.1 1.7
3.2
3.0 1.8
7.3
0.
6 3.2
3.0 1.8
7.3
0.
6
389
9.1
7.7
6.8
29.3
0.8
2.2 1.8
1.5
6.0
0.3
2.2 1.8
1.5
6.0
0.3
439
9.5
8.3
6.5
25.7
1.1
2.4 2.1
1.7
6.2
0.3
2.3
2.0 1.7
6.
0 0.
3
945
12
.7
11.5 7.1
31.8
2.
4 3.3
3.0 1.7
7.5
0.
7
3.2
2.9 1.7
7.0
0.
6
237
17
.7 16
.0
11.0
44.4
2.
2
5.9
5.7
3.5
13.6
0.
8 5.9
5.7
3.5
13.6
0.
8
386
13
.4
12.3
7.9
30
.9
2.0 3.3 3.1
1.8
7.4
0.5 3.3 3.1
1.8
7.4
0.5
803
10
.7
8.4
8.9
34.4
0.
8
2.2 1.9
1.6
6.0
0.2
2.2 1.8
1.6
6.0
0.2
884
10
.2
8.5 7.3
27.8
1.1
2.2
2.0 1.5
5.9
0.
3 2.1
1.8
1.5
5.7
0.3
1,655
13
.1 11.
6 7.8
33.2
1.7
3.0 2.7 1.7
7.0
0.5
2.9 2.7 1.7
6.6
0.3
428
i An
alys
is ba
sed
on N
DN
S co
re U
K sa
mpl
e ex
clud
ing
addi
tiona
l sam
ple
from
Sco
tland
, Nor
ther
n Ire
land
and
Wal
es
266
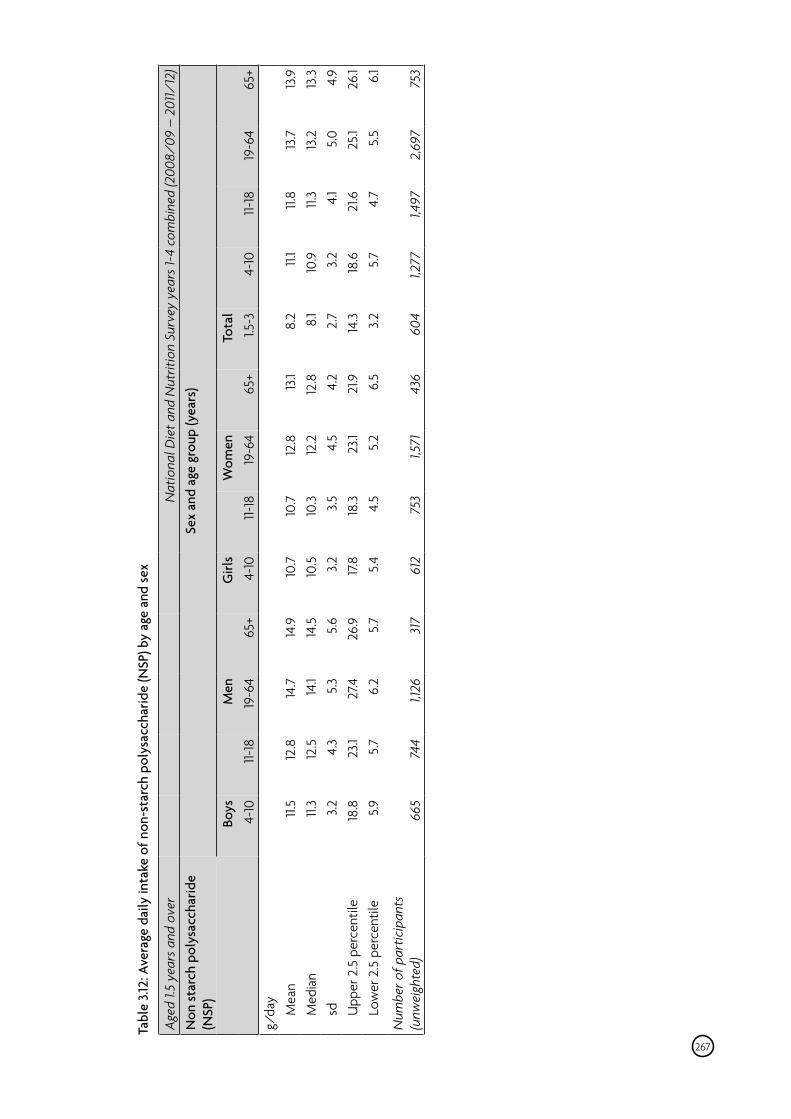
Tabl
e 3.1
2: A
vera
ge d
aily
inta
ke o
f non
-sta
rch
poly
sacc
harid
e (N
SP) b
y ag
e an
d se
x
Aged
1.5
year
s and
ove
r
N
atio
nal D
iet a
nd N
utrit
ion
Surv
ey y
ears
1-4
com
bine
d (2
008/
09 –
201
1/12
)N
on st
arch
pol
ysac
char
ide
(NSP
) Se
x an
d ag
e gr
oup
(yea
rs)
Bo
ys
M
en
G
irls
W
omen
Tota
l
4-10
11-
18
19-6
4 65
+ 4-
10
11-18
19
-64
65+
1.5-3
4-
10
11-18
19
-64
65+
g/da
y
M
ean
11.5
12.8
14
.7
14.9
10
.7
10.7
12
.8
13.1
8.2
11.1
11.8
13.7
13
.9
M
edia
n 11.
3 12
.5
14.1
14.5
10
.5
10.3
12
.2
12.8
8.
1 10
.9
11.3
13.2
13
.3
sd
3.
2 4.
3 5.
3 5.
6 3.
2 3.
5 4.
5 4.
2 2.
7 3.
2 4.
1 5.
0 4.
9
Upp
er 2
.5 p
erce
ntile
18
.8
23.1
27.4
26.9
17
.8
18.3
23
.1 21
.9
14.3
18
.6
21.6
25
.1 26
.1
Low
er 2
.5 p
erce
ntile
5.9
5.
7 6.
2 5.
7 5.
4 4.
5 5.
2 6.
5 3.
2 5.
7 4.
7 5.
5 6.
1
Num
ber o
f par
ticip
ants
(u
nwei
ghte
d)
665
744
1,126
31
7 61
2 75
3 1,5
71
436
604
1,277
1,4
97
2,69
7 75
3
267
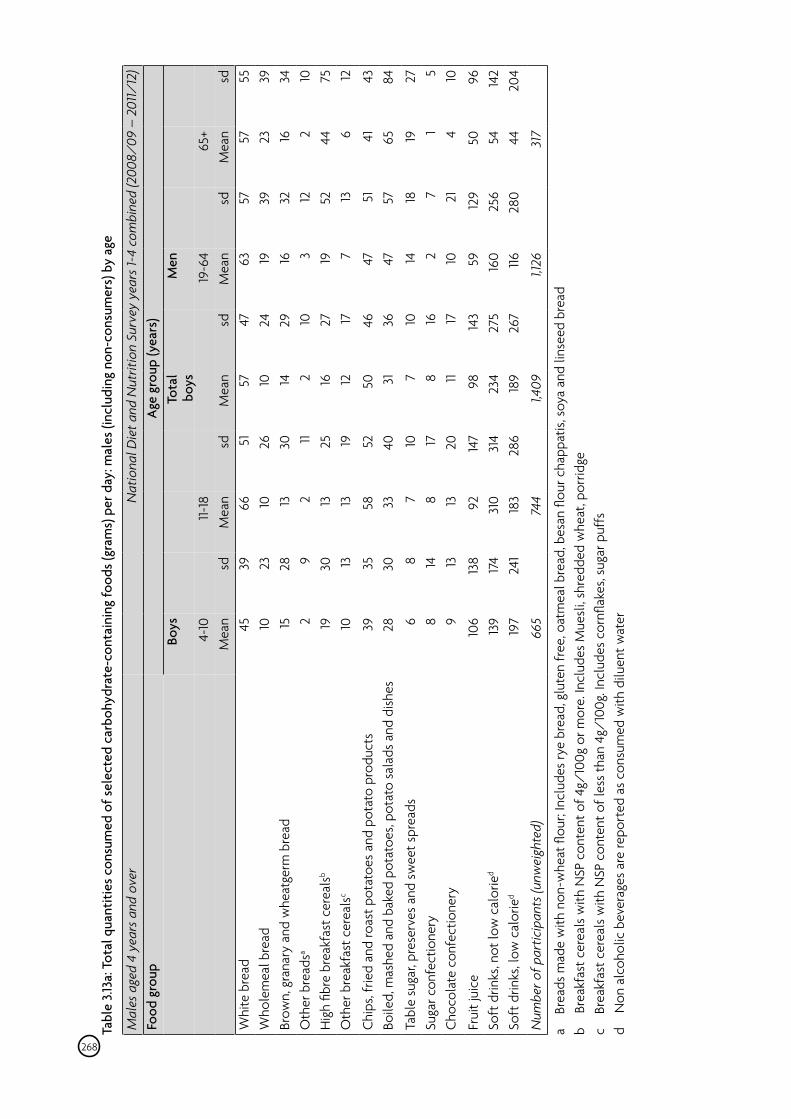
Tabl
e 3.1
3a: T
otal
qua
ntiti
es c
onsu
med
of s
elec
ted
carb
ohyd
rate
-con
tain
ing
food
s (gr
ams)
per
day
: mal
es (i
nclu
ding
non
-con
sum
ers)
by
age
Mal
es a
ged
4 ye
ars a
nd o
ver
Nat
iona
l Die
t and
Nut
ritio
n Su
rvey
yea
rs 1-
4 co
mbi
ned
(200
8/09
– 2
011/
12)
Food
gro
up
Age
gro
up (y
ears
)
Boys
Tota
l
Men
boys
4-10
11-18
19
-64
65
+
M
ean
sd
Mea
n sd
M
ean
sd
Mea
n sd
M
ean
sd
Whi
te b
read
45
39
66
51
57
47
63
57
57
55
W
hole
mea
l bre
ad
10
23
10
26
10
24
19
39
23
39
Brow
n, g
rana
ry a
nd w
heat
germ
bre
ad
15
28
13
30
14
29
16
32
16
34
Oth
er b
read
sa 2
9 2
11 2
10
3 12
2
10
Hig
h fib
re b
reak
fast
cer
eals
b 19
30
13
25
16
27
19
52
44
75
O
ther
bre
akfa
st c
erea
lsc
10
13
13
19
12
17
7 13
6
12
Chip
s, fr
ied
and
roas
t pot
atoe
s an
d po
tato
pro
duct
s 39
35
58
52
50
46
47
51
41
43
Bo
iled,
mas
hed
and
bake
d po
tato
es, p
otat
o sa
lads
and
dish
es
28
30
33
40
31
36
47
57
65
84
Tabl
e su
gar,
pres
erve
s an
d sw
eet s
prea
ds
6 8
7 10
7
10
14
18
19
27
Suga
r con
fect
ione
ry
8 14
8
17
8 16
2
7 1
5 Ch
ocol
ate
conf
ectio
nery
9
13
13
20
11 17
10
21
4
10
Frui
t jui
ce
106
138
92
147
98
143
59
129
50
96
Soft
drin
ks, n
ot lo
w c
alor
ied
139
174
310
314
234
275
160
256
54
142
Soft
drin
ks, l
ow c
alor
ied
197
241
183
286
189
267
116
280
44
204
Num
ber o
f par
ticip
ants
(unw
eigh
ted)
66
5
744
1,4
09
1,1
26
31
7
a Br
eads
mad
e w
ith n
on-w
heat
flou
r; In
clud
es ry
e br
ead,
glu
ten
free
, oat
mea
l bre
ad, b
esan
flou
r cha
ppat
is, s
oya
and
linse
ed b
read
b Br
eakf
ast c
erea
ls w
ith N
SP c
onte
nt o
f 4g/
100g
or m
ore.
Incl
udes
Mue
sli,
shre
dded
whe
at, p
orrid
ge c
Brea
kfas
t cer
eals
with
NSP
con
tent
of l
ess
than
4g/
100g
. Inc
lude
s co
rnfla
kes,
suga
r puf
fs d
Non
alc
ohol
ic b
ever
ages
are
repo
rted
as
cons
umed
with
dilu
ent w
ater
268
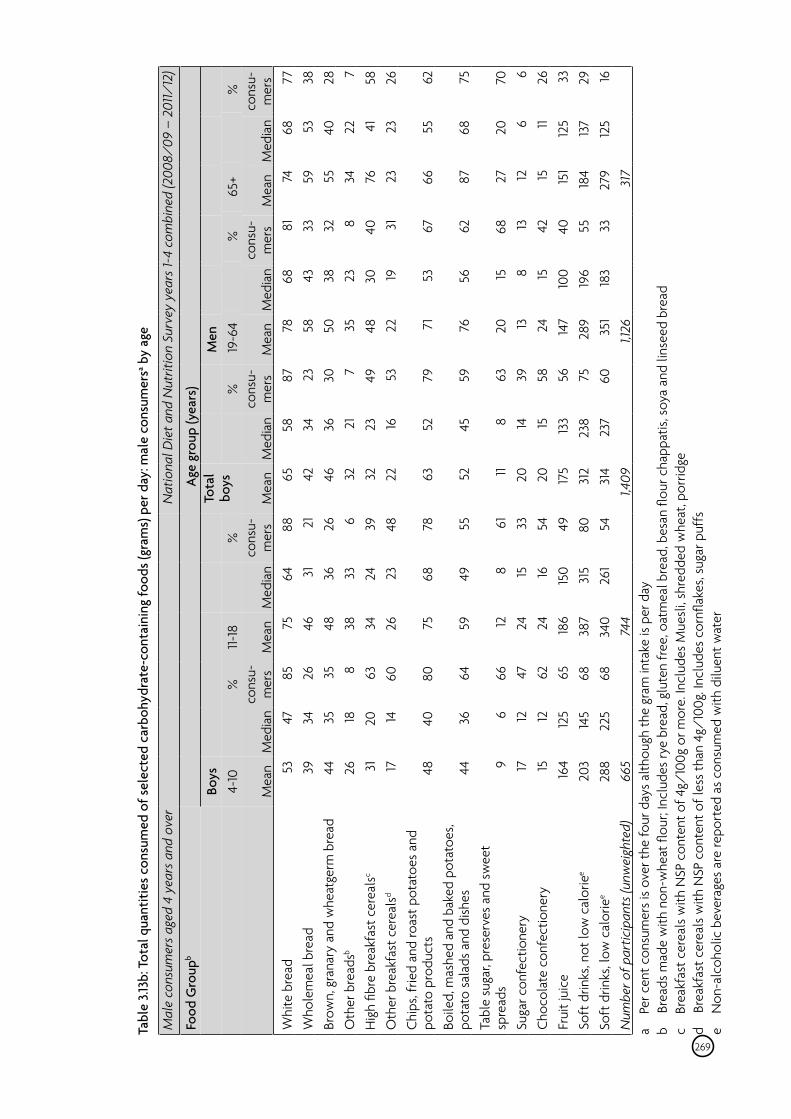
Tabl
e 3.1
3b: T
otal
qua
ntiti
es c
onsu
med
of s
elec
ted
carb
ohyd
rate
-con
tain
ing
food
s (gr
ams)
per
day
: mal
e co
nsum
ersa b
y ag
e
Mal
e co
nsum
ers a
ged
4 ye
ars a
nd o
ver
Nat
iona
l Die
t and
Nut
ritio
n Su
rvey
yea
rs 1-
4 co
mbi
ned
(200
8/09
– 2
011/
12)
Food
Gro
upb
A
ge g
roup
(yea
rs)
Bo
ys
4-10
%
11-
18
%
Tota
l bo
ys
%
Men
19-6
4
%
65+
%
M
ean
M
edia
n co
nsu-
mer
s M
ean
M
edia
n co
nsu-
mer
s M
ean
M
edia
n co
nsu-
mer
s M
ean
M
edia
n co
nsu-
mer
s M
ean
M
edia
n co
nsu-
mer
s W
hite
bre
ad
Who
lem
eal b
read
Br
own,
gra
nary
and
whe
atge
rm b
read
O
ther
bre
adsb
Hig
h fib
re b
reak
fast
cer
eals
c
Oth
er b
reak
fast
cer
eals
d
Chip
s, fr
ied
and
roas
t pot
atoe
s an
d po
tato
pro
duct
s Bo
iled,
mas
hed
and
bake
d po
tato
es,
pota
to s
alad
s an
d di
shes
Ta
ble
suga
r, pr
eser
ves
and
swee
t sp
read
s Su
gar c
onfe
ctio
nery
Ch
ocol
ate
conf
ectio
nery
Fr
uit j
uice
So
ft d
rinks
, not
low
cal
orie
e
Soft
drin
ks, l
ow c
alor
iee
Num
ber o
f par
ticip
ants
(unw
eigh
ted)
53
39
44
26
31
17
48
44 9 17
15
164
203
288
665
47
34
35
18
20
14
40
36 6 12
12
125
145
225
85
26
35 8 63
60
80
64
66
47
62
65
68
68
75
46
48
38
34
26
75
59
12
24
24
186
387
340
744
64
31
36
33
24
23
68
49 8 15
16
150
315
261
88
21
26 6 39
48
78
55
61
33
54
49
80
54
65
42
46
32
32
22
63
52 11 20
20
175
312
314
1,409
58
34
36
21
23
16
52
45 8 14
15
133
238
237
87
23
30 7 49
53
79
59
63
39
58
56
75
60
78
58
50
35
48
22
71
76
20
13
24
147
289
351
1,126
68
43
38
23
30
19
53
56
15 8 15
100
196
183
81
33
32 8 40
31
67
62
68
13
42
40
55
33
74
59
55
34
76
23
66
87
27
12
15
151
184
279
317
68
53
40
22
41
23
55
68
20 6 11
125
137
125
77
38
28 7 58
26
62
75
70 6 26
33
29
16
a Pe
r cen
t con
sum
ers
is ov
er th
e fo
ur d
ays
alth
ough
the
gram
inta
ke is
per
day
b Br
eads
mad
e w
ith n
on-w
heat
flou
r; In
clud
es ry
e br
ead,
glu
ten
free
, oat
mea
l bre
ad, b
esan
flou
r cha
ppat
is, s
oya
and
linse
ed b
read
c Br
eakf
ast c
erea
ls w
ith N
SP c
onte
nt o
f 4g/
100g
or m
ore.
Incl
udes
Mue
sli,
shre
dded
whe
at, p
orrid
ged
Brea
kfas
t cer
eals
with
NSP
con
tent
of l
ess
than
4g/
100g
. Inc
lude
s co
rnfla
kes,
suga
r puf
fse
Non
-alc
ohol
ic b
ever
ages
are
repo
rted
as
cons
umed
with
dilu
ent w
ater
269
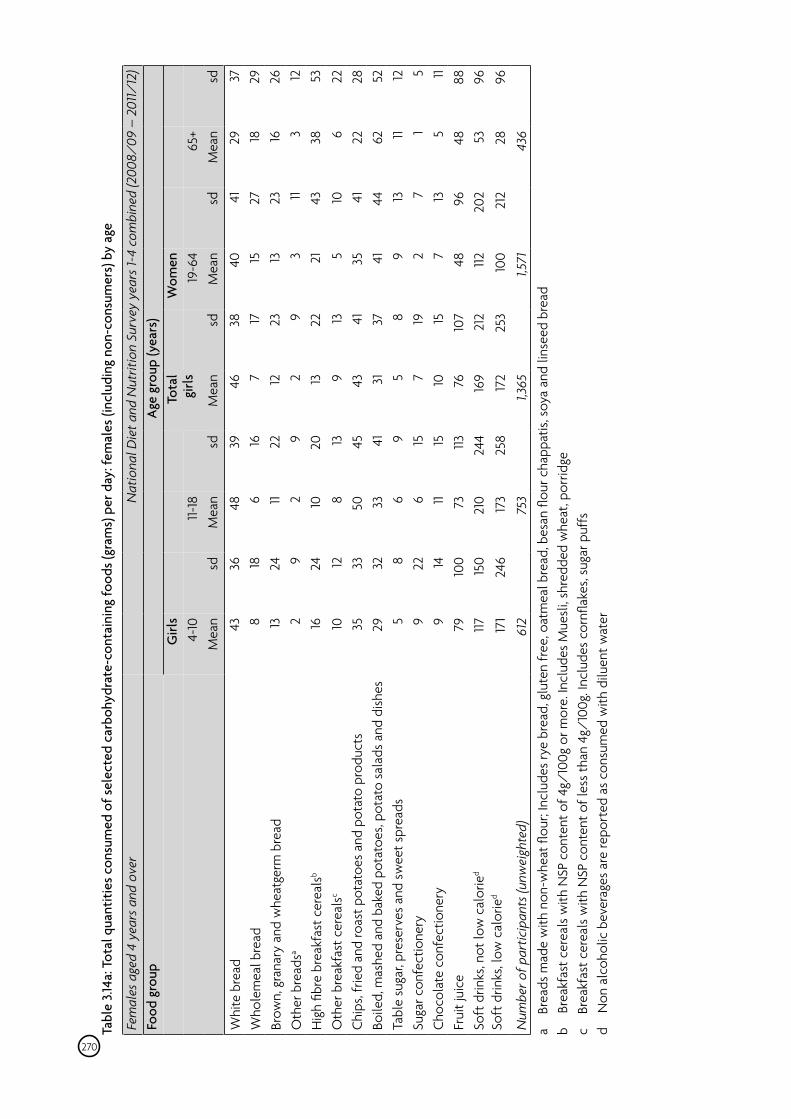
Tabl
e 3.1
4a: T
otal
qua
ntiti
es c
onsu
med
of s
elec
ted
carb
ohyd
rate
-con
tain
ing
food
s (gr
ams)
per
day
: fem
ales
(inc
ludi
ng n
on-c
onsu
mer
s) b
y ag
e
Fem
ales
age
d 4
year
s and
ove
r N
atio
nal D
iet a
nd N
utrit
ion
Surv
ey y
ears
1-4
com
bine
d (2
008/
09 –
201
1/12
)Fo
od g
roup
A
ge g
roup
(yea
rs)
G
irls
T
otal
Wom
en
gi
rls
4-
10
11-
18
19-6
4
65+
Mea
n sd
M
ean
sd
Mea
n sd
M
ean
sd
Mea
n sd
Whi
te b
read
43
36
48
39
46
38
40
41
29
37
W
hole
mea
l bre
ad
8 18
6
16
7 17
15
27
18
29
Br
own,
gra
nary
and
whe
atge
rm b
read
13
24
11
22
12
23
13
23
16
26
Oth
er b
read
sa 2
9 2
9 2
9 3
11 3
12
Hig
h fib
re b
reak
fast
cer
eals
b 16
24
10
20
13
22
21
43
38
53
O
ther
bre
akfa
st c
erea
lsc
10
12
8 13
9
13
5 10
6
22
Chip
s, fr
ied
and
roas
t pot
atoe
s an
d po
tato
pro
duct
s 35
33
50
45
43
41
35
41
22
28
Bo
iled,
mas
hed
and
bake
d po
tato
es, p
otat
o sa
lads
and
dish
es
29
32
33
41
31
37
41
44
62
52
Tabl
e su
gar,
pres
erve
s an
d sw
eet s
prea
ds
5 8
6 9
5 8
9 13
11
12
Suga
r con
fect
ione
ry
9 22
6
15
7 19
2
7 1
5 Ch
ocol
ate
conf
ectio
nery
9
14
11 15
10
15
7
13
5 11
Frui
t jui
ce 7
9 10
0 73
113
76
10
7 48
96
48
88
So
ft d
rinks
, not
low
cal
orie
d 117
15
0 21
0 24
4 16
9 21
2 112
20
2 53
96
So
ft d
rinks
, low
cal
orie
d 17
1 24
6 17
3 25
8 17
2 25
3 10
0 21
2 28
96
N
umbe
r of p
artic
ipan
ts (u
nwei
ghte
d)
612
75
3
1,365
1,571
436
a
Brea
ds m
ade
with
non
-whe
at fl
our;
Incl
udes
rye
brea
d, g
lute
n fr
ee, o
atm
eal b
read
, bes
an fl
our c
happ
atis,
soy
a an
d lin
seed
bre
ad b
Brea
kfas
t cer
eals
with
NSP
con
tent
of 4
g/10
0g o
r mor
e. In
clud
es M
uesl
i, sh
redd
ed w
heat
, por
ridge
c Br
eakf
ast c
erea
ls w
ith N
SP c
onte
nt o
f les
s th
an 4
g/10
0g. I
nclu
des
corn
flake
s, su
gar p
uffs
d N
on a
lcoh
olic
bev
erag
es a
re re
port
ed a
s co
nsum
ed w
ith d
iluen
t wat
er
270
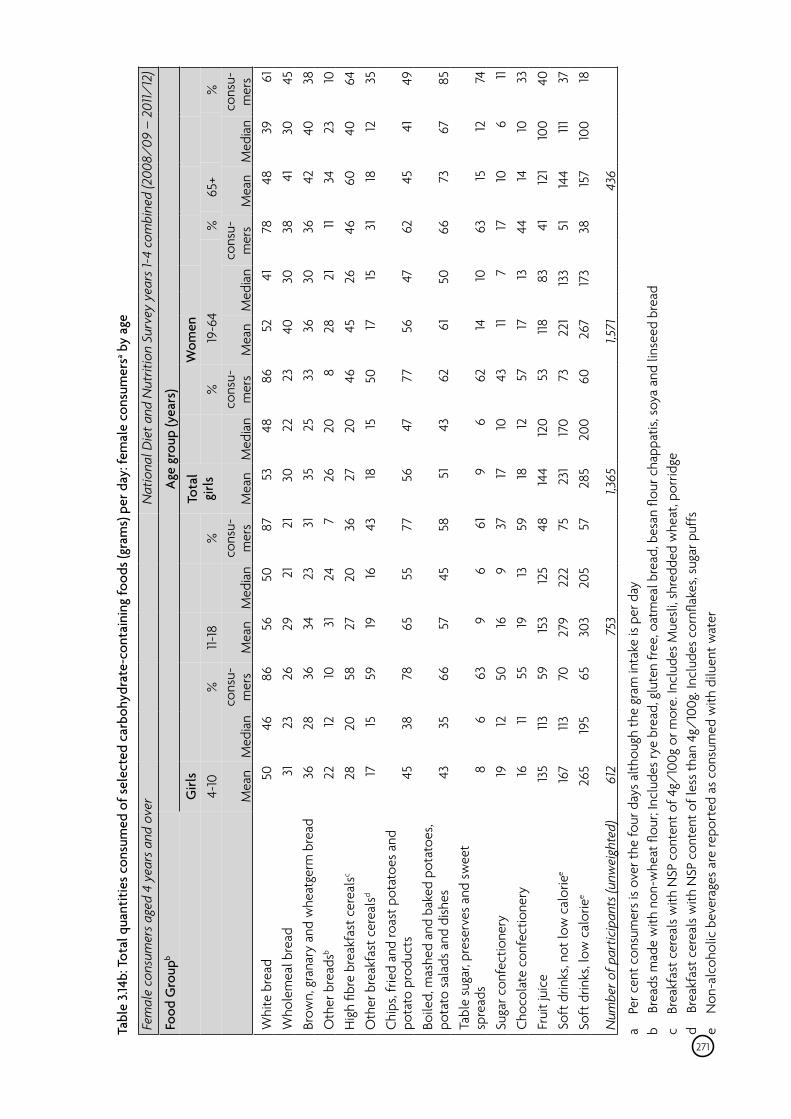
Tabl
e 3.1
4b: T
otal
qua
ntiti
es c
onsu
med
of s
elec
ted
carb
ohyd
rate
-con
tain
ing
food
s (gr
ams)
per
day
: fem
ale
cons
umer
sa by
age
Fem
ale
cons
umer
s age
d 4
year
s and
ove
r N
atio
nal D
iet a
nd N
utrit
ion
Surv
ey y
ears
1-4
com
bine
d (2
008/
09 –
201
1/12
)
Food
Gro
upb
A
ge g
roup
(yea
rs)
G
irls
To
tal
Wom
en
4-10
%
11-18
%
girls
%
19-6
4
%
65+
%
cons
u-
cons
u-
cons
u-
cons
u-
cons
u-
Mea
n M
edia
n m
ers
Mea
n M
edia
n m
ers
Mea
n M
edia
n m
ers
Mea
n M
edia
n m
ers
Mea
n M
edia
n m
ers
Whi
te b
read
50
46
86
56
50
87
53
48
86
52
41
78
48
39
61
W
hole
mea
l bre
ad
31
23
26
29
21
21
30
22
23
40
30
38
41
30
45
Brow
n, g
rana
ry a
nd w
heat
germ
bre
ad
36
28
36
34
23
31
35
25
33
36
30
36
42
40
38
Oth
er b
read
sb 22
12
10
31
24
7
26
20
8 28
21
11
34
23
10
Hig
h fib
re b
reak
fast
cer
eals
c 28
20
58
27
20
36
27
20
46
45
26
46
60
40
64
O
ther
bre
akfa
st c
erea
lsd
17
15
59
19
16
43
18
15
50
17
15
31
18
12
35
Chip
s, fr
ied
and
roas
t pot
atoe
s an
d po
tato
pro
duct
s 4
5
38
78
65
55
77
56
47
77
56
47
62
45
41
49
Bo
iled,
mas
hed
and
bake
d po
tato
es,
pota
to s
alad
s an
d di
shes
4
3
35
66
57
45
58
51
43
62
61
50
66
73
67
85
Ta
ble
suga
r, pr
eser
ves
and
swee
t sp
read
s 8
6 63
9
6 61
9
6 62
14
10
63
15
12
74
Su
gar c
onfe
ctio
nery
19
12
50
16
9
37
17
10
43
11 7
17
10
6 11
Choc
olat
e co
nfec
tione
ry
16
11 55
19
13
59
18
12
57
17
13
44
14
10
33
Fr
uit j
uice
13
5 113
59
15
3 12
5 48
14
4 12
0 53
118
83
41
12
1 10
0 40
So
ft d
rinks
, not
low
cal
orie
e 16
7 113
70
27
9 22
2 75
23
1 17
0 73
22
1 13
3 51
14
4 111
37
So
ft d
rinks
, low
cal
orie
e 26
5 19
5 65
30
3 20
5 57
28
5 20
0 60
26
7 17
3 38
15
7 10
0 18
Num
ber o
f par
ticip
ants
(unw
eigh
ted)
61
2 75
3 1,3
65
1,571
43
6
a Pe
r cen
t con
sum
ers
is ov
er th
e fo
ur d
ays
alth
ough
the
gram
inta
ke is
per
day
b Br
eads
mad
e w
ith n
on-w
heat
flou
r; In
clud
es ry
e br
ead,
glu
ten
free
, oat
mea
l bre
ad, b
esan
flou
r cha
ppat
is, s
oya
and
linse
ed b
read
c Br
eakf
ast c
erea
ls w
ith N
SP c
onte
nt o
f 4g/
100g
or m
ore.
Incl
udes
Mue
sli,
shre
dded
whe
at, p
orrid
ge d
Brea
kfas
t cer
eals
with
NSP
con
tent
of l
ess
than
4g/
100g
. Inc
lude
s co
rnfla
kes,
suga
r puf
fs e
Non
-alc
ohol
ic b
ever
ages
are
repo
rted
as
cons
umed
with
dilu
ent w
ater
271
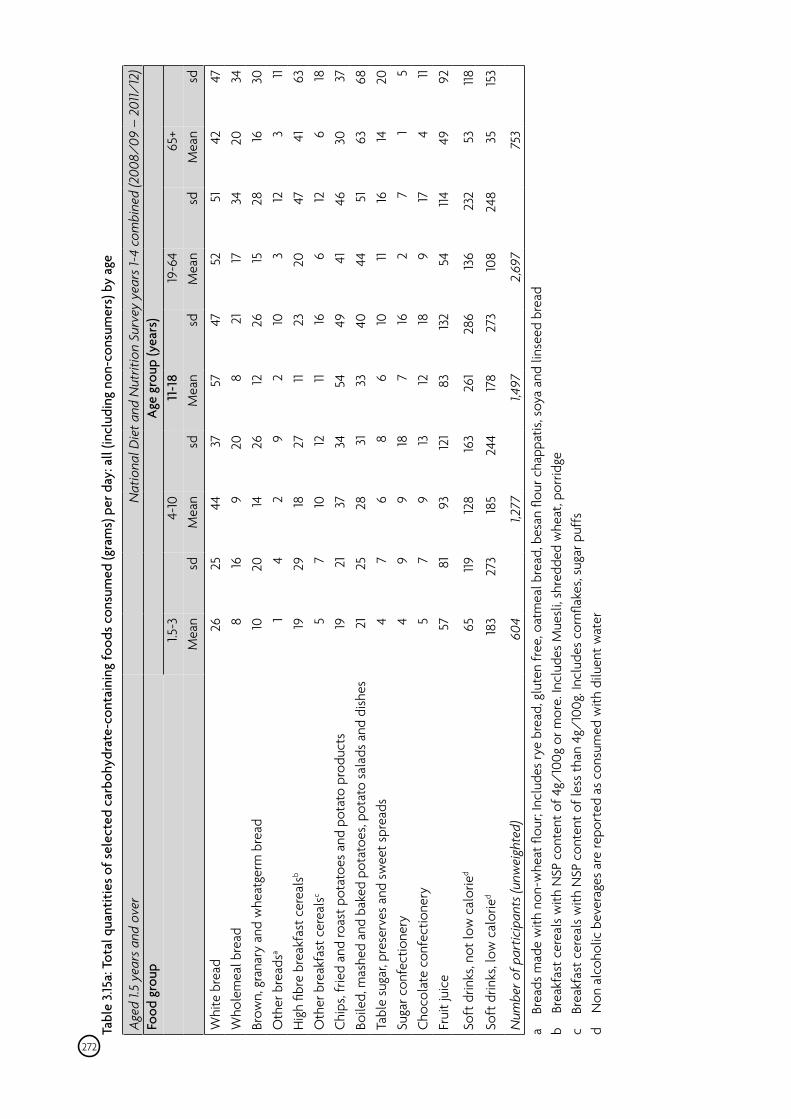
Tabl
e 3.1
5a: T
otal
qua
ntiti
es o
f sel
ecte
d ca
rboh
ydra
te-c
onta
inin
g fo
ods c
onsu
med
(gra
ms)
per
day
: all
(incl
udin
g no
n-co
nsum
ers)
by
age
Aged
1.5
year
s and
ove
r N
atio
nal D
iet a
nd N
utrit
ion
Surv
ey y
ears
1-4
com
bine
d (2
008/
09 –
201
1/12
)Fo
od g
roup
A
ge g
roup
(yea
rs)
1.5
-3
4-
10
11
-18
19
-64
65
+
M
ean
sd
Mea
n sd
M
ean
sd
Mea
n sd
M
ean
sd
Whi
te b
read
W
hole
mea
l bre
ad
Brow
n, g
rana
ry a
nd w
heat
germ
bre
ad
Oth
er b
read
sa
Hig
h fib
re b
reak
fast
cer
eals
b
Oth
er b
reak
fast
cer
eals
c
Chip
s, fr
ied
and
roas
t pot
atoe
s an
d po
tato
pro
duct
s Bo
iled,
mas
hed
and
bake
d po
tato
es, p
otat
o sa
lads
and
dish
es
Tabl
e su
gar,
pres
erve
s an
d sw
eet s
prea
ds
Suga
r con
fect
ione
ry
Choc
olat
e co
nfec
tione
ry
Frui
t jui
ce
Soft
drin
ks, n
ot lo
w c
alor
ied
Soft
drin
ks, l
ow c
alor
ied
Num
ber o
f par
ticip
ants
(unw
eigh
ted)
26 8 10 1 19 5 19
21 4 4 5 57
65
183
604
25
16
20 4 29 7 21
25 7 9 7 81
119
273
44 9 14 2 18
10
37
28 6 9 9 93
128
185
1,277
37
20
26 9 27
12
34
31 8 18
13
121
163
244
57 8 12 2 11 11 54
33 6 7 12
83
261
178
1,497
47
21
26
10
23
16
49
40
10
16
18
132
286
273
52
17
15 3 20 6 41
44 11 2 9 54
136
108
2,69
7
51
34
28
12
47
12
46
51
16 7 17
114
232
248
42
20
16 3 41 6 30
63
14 1 4 49
53
35
753
47
34
30 11 63
18
37
68
20 5 11 92
118
153
a Br
eads
mad
e w
ith n
on-w
heat
flou
r; In
clud
es ry
e br
ead,
glu
ten
free
, oat
mea
l bre
ad, b
esan
flou
r cha
ppat
is, s
oya
and
linse
ed b
read
b Br
eakf
ast c
erea
ls w
ith N
SP c
onte
nt o
f 4g/
100g
or m
ore.
Incl
udes
Mue
sli,
shre
dded
whe
at, p
orrid
ge c
Brea
kfas
t cer
eals
with
NSP
con
tent
of l
ess
than
4g/
100g
. Inc
lude
s co
rnfla
kes,
suga
r puf
fs d
Non
alc
ohol
ic b
ever
ages
are
repo
rted
as
cons
umed
with
dilu
ent w
ater
272
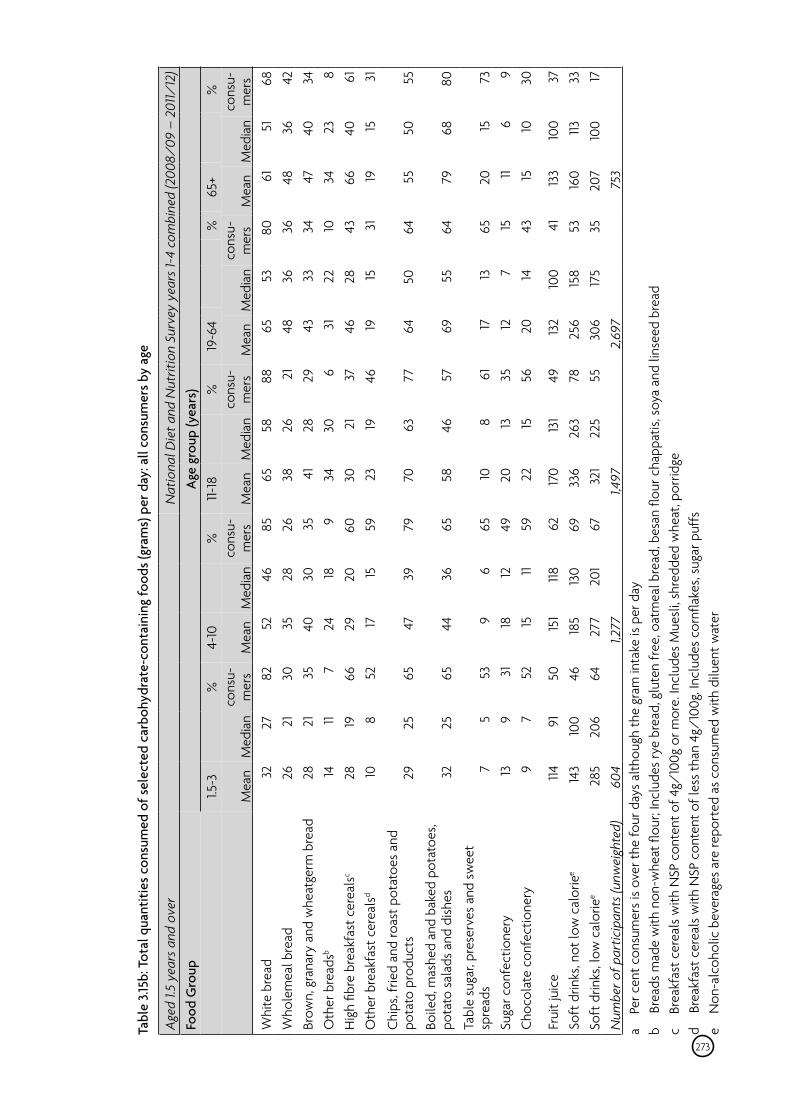
Tabl
e 3.1
5b: T
otal
qua
ntiti
es c
onsu
med
of s
elec
ted
carb
ohyd
rate
-con
tain
ing
food
s (gr
ams)
per
day
: all
cons
umer
s by
age
Aged
1.5
year
s and
ove
r N
atio
nal D
iet a
nd N
utrit
ion
Surv
ey y
ears
1-4
com
bine
d (2
008/
09 –
201
1/12
)Fo
od G
roup
Age
gro
up (y
ears
)
1.5-3
%
4-10
%
11-18
%
19-6
4
%
65+
%
M
ean
M
edia
n co
nsu-
mer
s M
ean
M
edia
n co
nsu-
mer
s M
ean
M
edia
n co
nsu-
mer
s M
ean
M
edia
n co
nsu-
mer
s M
ean
M
edia
n co
nsu-
mer
s W
hite
bre
ad
Who
lem
eal b
read
Br
own,
gra
nary
and
whe
atge
rm b
read
O
ther
bre
adsb
Hig
h fib
re b
reak
fast
cer
eals
c
Oth
er b
reak
fast
cer
eals
d
Chip
s, fr
ied
and
roas
t pot
atoe
s an
d po
tato
pro
duct
s
Boile
d, m
ashe
d an
d ba
ked
pota
toes
, po
tato
sal
ads
and
dish
es
Tabl
e su
gar,
pres
erve
s an
d sw
eet
spre
ads
Suga
r con
fect
ione
ry
Choc
olat
e co
nfec
tione
ry
Frui
t jui
ce
Soft
drin
ks, n
ot lo
w c
alor
iee
Soft
drin
ks, l
ow c
alor
iee
Num
ber o
f par
ticip
ants
(unw
eigh
ted)
32
26
28
14
28
10
29
32 7 13 9 114
143
285
604
27
21
21 11 19 8 25
25 5 9 7 91
100
206
82
30
35 7 66
52
65
65
53
31
52
50
46
64
52
35
40
24
29
17
47
44 9 18
15
151
185
277
1,277
46
28
30
18
20
15
39
36 6 12 11 118
130
201
85
26
35 9 60
59
79
65
65
49
59
62
69
67
65
38
41
34
30
23
70
58
10
20
22
170
336
321
1,497
58
26
28
30
21
19
63
46 8 13
15
131
263
225
88
21
29 6 37
46
77
57
61
35
56
49
78
55
65
48
43
31
46
19
64
69
17
12
20
132
256
306
2,69
7
53
36
33
22
28
15
50
55
13 7 14
100
158
175
80
36
34
10
43
31
64
64
65
15
43
41
53
35
61
48
47
34
66
19
55
79
20 11 15
133
160
207
753
51
36
40
23
40
15
50
68
15 6 10
100 113
10
0
68
42
34 8 61
31
55
80
73 9 30
37
33
17
273
a Pe
r cen
t con
sum
ers
is ov
er th
e fo
ur d
ays
alth
ough
the
gram
inta
ke is
per
day
b Br
eads
mad
e w
ith n
on-w
heat
flou
r; In
clud
es ry
e br
ead,
glu
ten
free
, oat
mea
l bre
ad, b
esan
flou
r cha
ppat
is, s
oya
and
linse
ed b
read
c Br
eakf
ast c
erea
ls w
ith N
SP c
onte
nt o
f 4g/
100g
or m
ore.
Incl
udes
Mue
sli,
shre
dded
whe
at, p
orrid
ged
Brea
kfas
t cer
eals
with
NSP
con
tent
of l
ess
than
4g/
100g
. Inc
lude
s co
rnfla
kes,
suga
r puf
fse
Non
-alc
ohol
ic b
ever
ages
are
repo
rted
as
cons
umed
with
dilu
ent w
ater
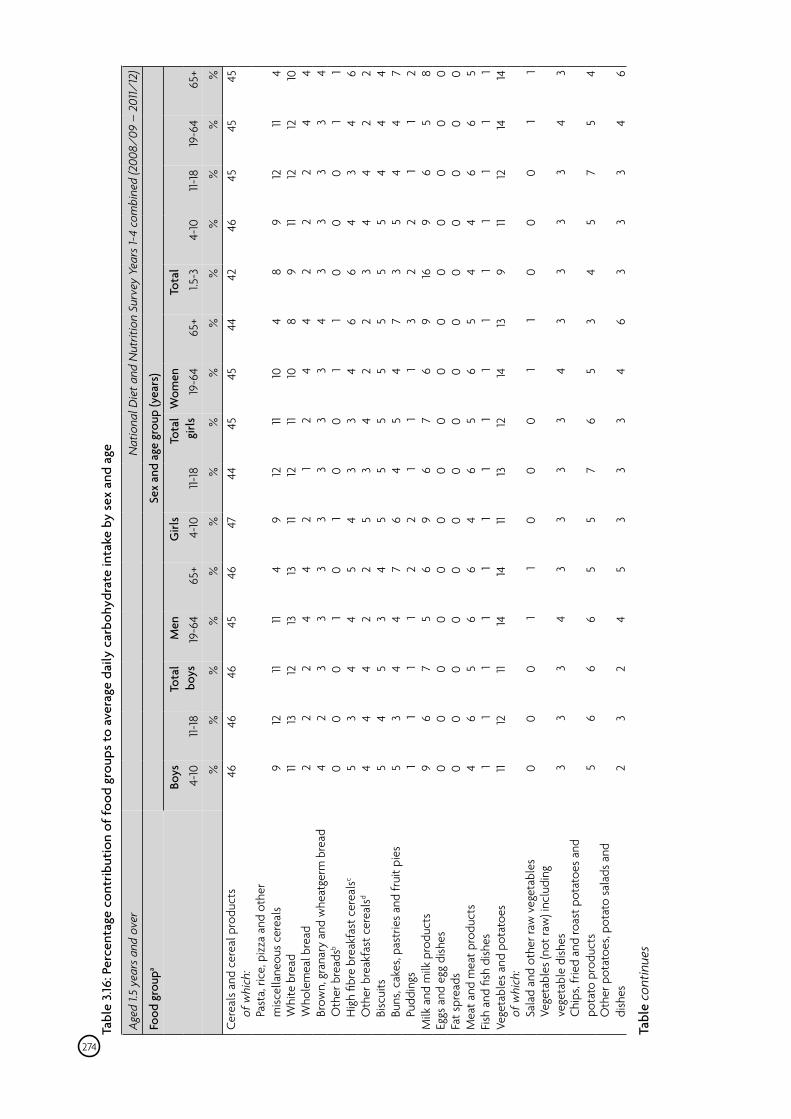
Tabl
e 3.1
6: P
erce
ntag
e co
ntrib
utio
n of
food
gro
ups
to a
vera
ge d
aily
car
bohy
drat
e in
take
by
sex
and
age
Aged
1.5
year
s and
ove
r N
atio
nal D
iet a
nd N
utrit
ion
Surv
ey Y
ears
1-4
com
bine
d (2
008/
09 –
201
1/12
)
Food
gro
upa
Sex
and
age
grou
p (y
ears
)
Bo
ys
To
tal
Men
Girl
s
Tota
l W
omen
Tota
l
4-
10
11-18
bo
ys
19-6
4 65
+ 4-
10
11-18
gi
rls
19-6
4 65
+ 1.5
-3
4-10
11-
18
19-6
4 65
+
%
%
%
%
%
%
%
%
%
%
%
%
%
%
%
Ce
real
s an
d ce
real
pro
duct
s
of w
hich
:
Past
a, ri
ce, p
izza
and
oth
er
misc
ella
neou
s ce
real
s
Whi
te b
read
Who
lem
eal b
read
Brow
n, g
rana
ry a
nd w
heat
germ
bre
ad
O
ther
bre
adsb
H
igh
fibre
bre
akfa
st c
erea
lsc
O
ther
bre
akfa
st c
erea
lsd
Bi
scui
ts
Bu
ns, c
akes
, pas
trie
s an
d fr
uit p
ies
Pu
ddin
gs
Milk
and
milk
pro
duct
s Eg
gs a
nd e
gg d
ishes
Fat s
prea
ds
Mea
t and
mea
t pro
duct
s Fi
sh a
nd fi
sh d
ishes
Ve
geta
bles
and
pot
atoe
s
of w
hich
:
Sala
d an
d ot
her r
aw v
eget
able
s
Vege
tabl
es (n
ot ra
w) i
nclu
ding
ve
geta
ble
dish
es
Ch
ips,
frie
d an
d ro
ast p
otat
oes
and
pota
to p
rodu
cts
O
ther
pot
atoe
s, po
tato
sal
ads
and
dish
es
46 9 11 2 4 0 5 4 5 5 1 9 0 0 4 1 11 0 3 5 2
46 12
13 2 2 0 3 4 4 3 1 6 0 0 6 1 12 0 3 6 3
46 11 12 2 3 0 4 4 5 4 1 7 0 0 5 1 11 0 3 6 2
45 11 13 4 3 1 4 2 3 4 1 5 0 0 6 1 14 1 4 6 4
46 4 13 4 3 0 5 2 4 7 2 6 0 0 6 1 14 1 3 5 5
47 9 11 2 3 1 4 5 5 6 2 9 0 0 4 1 11 0 3 5 3
44 12
12 1 3 0 3 3 5 4 1 6 0 0 6 1 13 0 3 7 3
45 11 11 2 3 0 3 4 5 5 1 7 0 0 5 1 12 0 3 6 3
45 10
10 4 3 1 4 2 5 4 1 6 0 0 6 1 14 1 4 5 4
44 4 8 4 4 1 6 2 5 7 3 9 0 0 5 1 13 1 3 3 6
42 8 9 2 3 0 6 3 5 3 2 16 0 0 4 1 9 0 3 4 3
46 9 11 2 3 0 4 4 5 5 2 9 0 0 4 1 11 0 3 5 3
45 12
12 2 3 0 3 4 4 4 1 6 0 0 6 1 12 0 3 7 3
45 11 12 4 3 1 4 2 4 4 1 5 0 0 6 1 14 1 4 5 4
45 4 10 4 4 1 6 2 4 7 2 8 0 0 5 1 14 1 3 4 6
Tabl
e co
ntin
ues
274
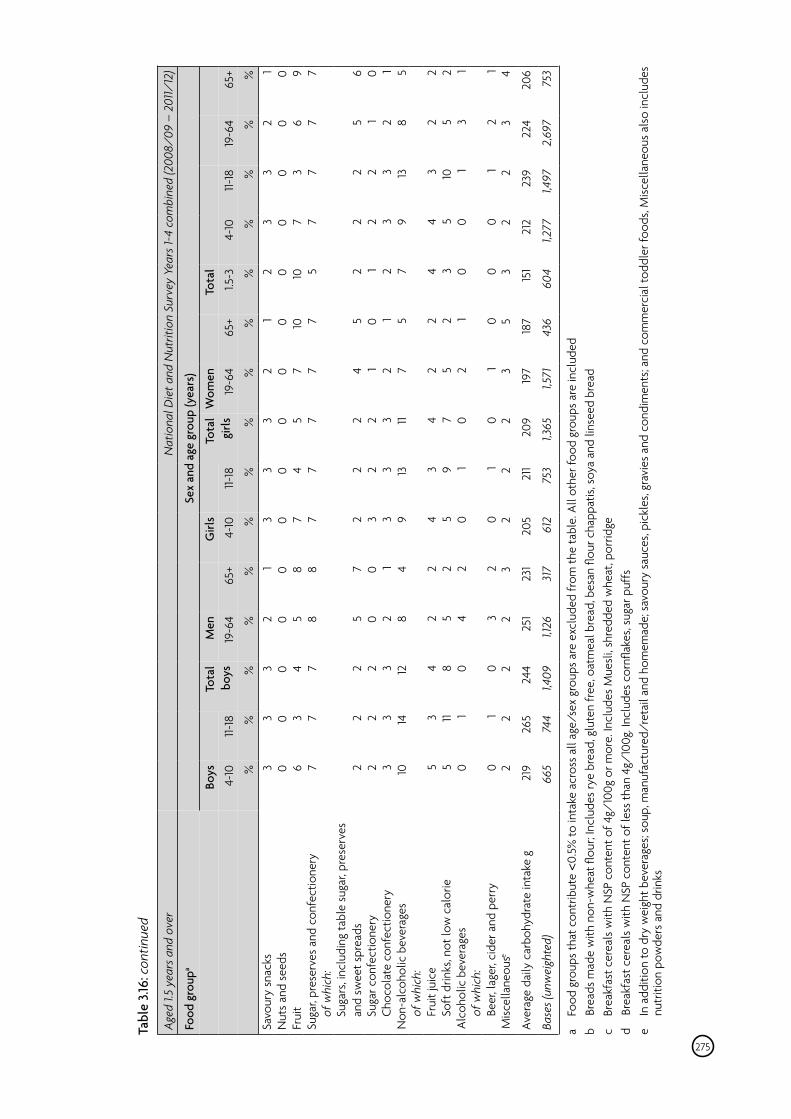
Tabl
e 3.1
6: c
ontin
ued
Aged
1.5
year
s and
ove
r N
atio
nal D
iet a
nd N
utrit
ion
Surv
ey Y
ears
1-4
com
bine
d (2
008/
09 –
201
1/12
)
Food
gro
upa
Sex
and
age
grou
p (y
ears
)
Bo
ys
To
tal
Men
Girl
s
Tota
l W
omen
Tota
l
4-
10
11-18
bo
ys
19-6
4 65
+ 4-
10
11-18
gi
rls
19-6
4 65
+ 1.5
-3
4-10
11-
18
19-6
4 65
+
%
%
%
%
%
%
%
%
%
%
%
%
%
%
%
Sa
vour
y sn
acks
N
uts
and
seed
s 3 0
3 0 3 0
2 0 1 0
3 0 3 0
3 0 2 0
1 0 2 0
3 0 3 0
2 0 1 0
Frui
t 6
3 4
5 8
7 4
5 7
10
10
7 3
6 9
Suga
r, pr
eser
ves
and
conf
ectio
nery
of w
hich
:7
7 7
8 8
7 7
7 7
7 5
7 7
7 7
Su
gars
, inc
ludi
ng ta
ble
suga
r, pr
eser
ves
and
swee
t spr
eads
Suga
r con
fect
ione
ry
Ch
ocol
ate
conf
ectio
nery
N
on-a
lcoh
olic
bev
erag
es
of
whi
ch:
2 2 3 10
2 2 3 14
2 2 3 12
5 0 2 8
7 0 1 4
2 3 3 9
2 2 3 13
2 2 3 11
4 1 2 7
5 0 1 5
2 1 2 7
2 2 3 9
2 2 3 13
5 1 2 8
6 0 1 5
Frui
t jui
ce
So
ft d
rinks
, not
low
cal
orie
5 5
3 11 4 8
2 5 2 2
4 5 3 9
4 7 2 5
2 2 4 3
4 5 3 10
2 5 2 2
Alco
holic
bev
erag
es
of
whi
ch:
0 1
0 4
2 0
1 0
2 1
0 0
1 3
1
Beer
, lag
er, c
ider
and
per
ry
Misc
ella
neou
se 0 2
1 2 0 2
3 2 2 3
0 2 1 2
0 2 1 3
0 5 0 3
0 2 1 2
2 3 1 4
Aver
age
daily
car
bohy
drat
e in
take
g
219
265
244
251
231
205
211
209
197
187
151
212
239
224
206
Base
s (un
wei
ghte
d)
665
744
1,409
1,1
26
317
612
753
1,365
1,5
71
436
604
1,277
1,4
97
2,69
7 75
3
a Fo
od g
roup
s th
at c
ontr
ibut
e <0
.5%
to in
take
acr
oss
all a
ge/s
ex g
roup
s ar
e ex
clud
ed fr
om th
e ta
ble.
All
othe
r foo
d gr
oups
are
incl
uded
b Br
eads
mad
e w
ith n
on-w
heat
flou
r; In
clud
es ry
e br
ead,
glu
ten
free
, oat
mea
l bre
ad, b
esan
flou
r cha
ppat
is, s
oya
and
linse
ed b
read
c Br
eakf
ast c
erea
ls w
ith N
SP c
onte
nt o
f 4g/
100g
or m
ore.
Incl
udes
Mue
sli,
shre
dded
whe
at, p
orrid
ged
Brea
kfas
t cer
eals
with
NSP
con
tent
of l
ess
than
4g/
100g
. Inc
lude
s co
rnfla
kes,
suga
r puf
fse
In a
dditi
on to
dry
wei
ght b
ever
ages
; sou
p, m
anuf
actu
red/
reta
il an
d ho
mem
ade;
sav
oury
sau
ces,
pick
les,
grav
ies
and
cond
imen
ts; a
nd c
omm
erci
al to
ddle
r foo
ds, M
iscel
lane
ous
also
incl
udes
nu
triti
on p
owde
rs a
nd d
rinks
275
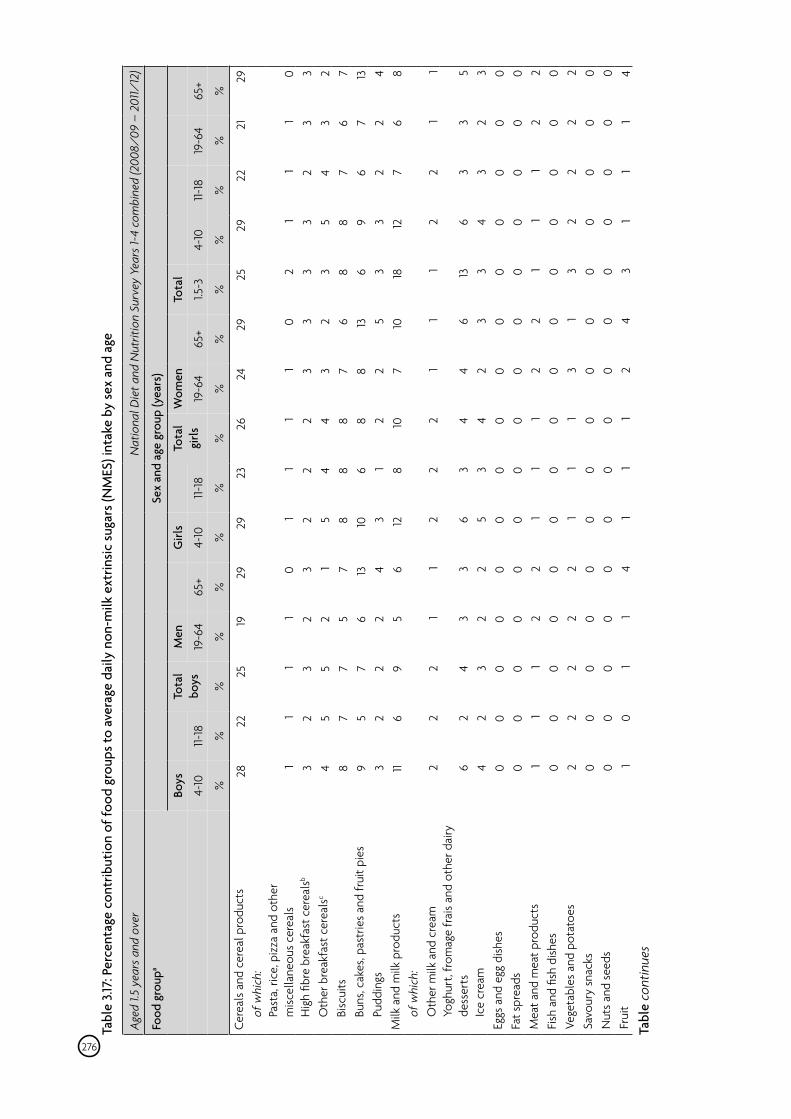
Tabl
e 3.1
7: P
erce
ntag
e co
ntrib
utio
n of
food
gro
ups t
o av
erag
e da
ily n
on-m
ilk e
xtrin
sic su
gars
(NM
ES) i
ntak
e by
sex
and
age
Aged
1.5
year
s and
ove
r N
atio
nal D
iet a
nd N
utrit
ion
Surv
ey Y
ears
1-4
com
bine
d (2
008/
09 –
201
1/12
)
Food
gro
upa
Sex
and
age
grou
p (y
ears
)
Bo
ys
To
tal
Men
Girl
s
Tota
l W
omen
Tota
l
bo
ys
girls
4-10
11-
18
19-6
4 65
+ 4-
10
11-18
19
-64
65+
1.5-3
4-
10
11-18
19
-64
65+
%
%
%
%
%
%
%
%
%
%
%
%
%
%
%
Cere
als
and
cere
al p
rodu
cts
28
22
25
19
29
29
23
26
24
29
25
29
22
21
29
of
whi
ch:
P
a
sta,
rice
, piz
za a
nd o
ther
m
iscel
lane
ous
cere
als
1 1
1 1
0 1
1 1
1 0
2 1
1 1
0
Hig
h fib
re b
reak
fast
cer
ealsb
3 2
3 2
3 2
2 2
3 3
3 3
2 3
3
Oth
er b
reak
fast
cer
eals
c 4
5 5
2 1
5 4
4 3
2 3
5 4
3 2
Bi
scui
ts
8 7
7 5
7 8
8 8
7 6
8 8
7 6
7
Buns
, cak
es, p
astr
ies
and
frui
t pie
s 9
5 7
6 13
10
6
8 8
13
6 9
6 7
13
Pu
ddin
gs
3 2
2 2
4 3
1 2
2 5
3 3
2 2
4 M
ilk a
nd m
ilk p
rodu
cts
11 6
9 5
6 12
8
10
7 10
18
12
7
6 8
of
whi
ch:
Oth
er m
ilk a
nd c
ream
2
2 2
1 1
2 2
2 1
1 1
2 2
1 1
Y
ogh
urt,
from
age
frai
s an
d ot
her d
airy
de
sser
ts
6 2
4 3
3 6
3 4
4 6
13
6 3
3 5
Ic
e
crea
m
4 2
3 2
2 5
3 4
2 3
3 4
3 2
3 Eg
gs a
nd e
gg d
ishes
0
0 0
0 0
0 0
0 0
0 0
0 0
0 0
Fat s
prea
ds
0 0
0 0
0 0
0 0
0 0
0 0
0 0
0 M
eat a
nd m
eat p
rodu
cts
1 1
1 2
2 1
1 1
2 2
1 1
1 2
2 Fi
sh a
nd fi
sh d
ishes
0
0 0
0 0
0 0
0 0
0 0
0 0
0 0
Vege
tabl
es a
nd p
otat
oes
2 2
2 2
2 1
1 1
3 1
3 2
2 2
2 Sa
vour
y sn
acks
0
0 0
0 0
0 0
0 0
0 0
0 0
0 0
Nut
s an
d se
eds
0 0
0 0
0 0
0 0
0 0
0 0
0 0
0 Fr
uit
1 0
1 1
4 1
1 1
2 4
3 1
1 1
4 Ta
ble
cont
inue
s
276
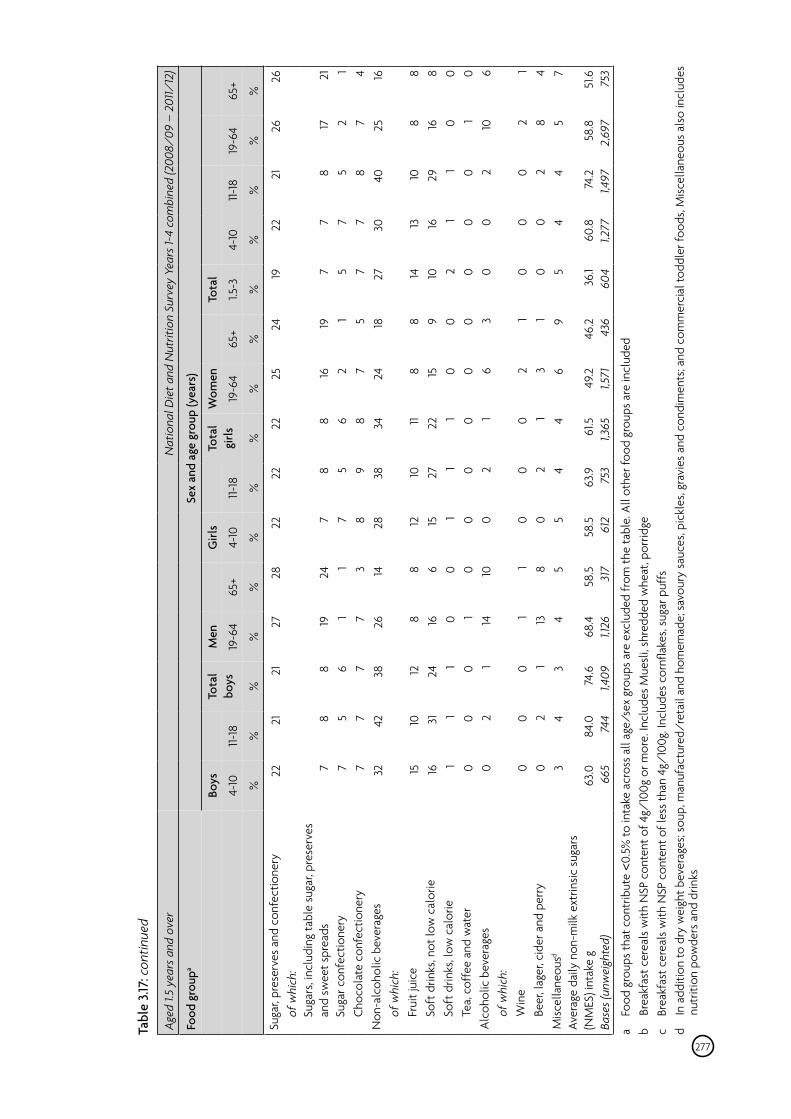
Tabl
e 3.1
7: c
ontin
ued
Aged
1.5
year
s and
ove
r N
atio
nal D
iet a
nd N
utrit
ion
Surv
ey Y
ears
1-4
com
bine
d (2
008/
09 –
201
1/12
)
Food
gro
upa
Sex
and
age
grou
p (y
ears
)
Bo
ys
To
tal
Men
Girl
s
Tota
l W
omen
Tota
l
4-
10
11-18
bo
ys
19-6
4 65
+ 4-
10
11-18
gi
rls
19-6
4 65
+ 1.5
-3
4-10
11-
18
19-6
4 65
+
%
%
%
%
%
%
%
%
%
%
%
%
%
%
%
Suga
r, pr
eser
ves
and
conf
ectio
nery
of w
hich
:
Suga
rs, i
nclu
ding
tabl
e su
gar,
pres
erve
s an
d sw
eet s
prea
ds
Su
gar c
onfe
ctio
nery
Choc
olat
e co
nfec
tione
ry
Non
-alc
ohol
ic b
ever
ages
of w
hich
:
Frui
t jui
ce
So
ft d
rinks
, not
low
cal
orie
Soft
drin
ks, l
ow c
alor
ie
Te
a, c
offe
e an
d w
ater
Al
coho
lic b
ever
ages
of w
hich
:
Win
e
Beer
, lag
er, c
ider
and
per
ry
Misc
ella
neou
sd
Aver
age
daily
non
-milk
ext
rinsic
sug
ars
(NM
ES) i
ntak
e g
Base
s (un
wei
ghte
d)
22 7 7 7 32
15
16 1 0 0 0 0 3
63.0
66
5
21 8 5 7 42
10
31 1 0 2 0 2 4
84.0
74
4
21 8 6 7 38
12
24 1 0 1 0 1 3
74.6
1,4
09
27
19 1 7 26 8 16 0 1 14 1 13 4
68.4
1,1
26
28
24 1 3 14 8 6 0 0 10 1 8 5
58.5
31
7
22 7 7 8 28
12
15 1 0 0 0 0 5
58.5
61
2
22 8 5 9 38
10
27 1 0 2 0 2 4
63.9
75
3
22 8 6 8 34 11 22 1 0 1 0 1 4
61.5
1,3
65
25
16 2 7 24 8 15 0 0 6 2 3 6
49.2
1,5
71
24
19 1 5 18 8 9 0 0 3 1 1 9
46.2
43
6
19 7 5 7 27
14
10 2 0 0 0 0 5
36.1
604
22 7 7 7 30
13
16 1 0 0 0 0 4
60.8
1,2
77
21 8 5 8 40
10
29 1 0 2 0 2 4
74.2
1,4
97
26
17 2 7 25 8 16 0 1 10 2 8 5
58.8
2,
697
26
21 1 4 16 8 8 0 0 6 1 4 7
51.6
75
3
a
Food
gro
ups
that
con
trib
ute
<0.5
% to
inta
ke a
cros
s al
l age
/sex
gro
ups
are
excl
uded
from
the
tabl
e. A
ll ot
her f
ood
grou
ps a
re in
clud
edb
Br
eakf
ast c
erea
ls w
ith N
SP c
onte
nt o
f 4g/
100g
or m
ore.
Incl
udes
Mue
sli,
shre
dded
whe
at, p
orrid
gec
Brea
kfas
t cer
eals
with
NSP
con
tent
of l
ess
than
4g/
100g
. Inc
lude
s co
rnfla
kes,
suga
r puf
fsd
In
add
ition
to d
ry w
eigh
t bev
erag
es; s
oup,
man
ufac
ture
d/re
tail
and
hom
emad
e; s
avou
ry s
auce
s, pi
ckle
s, gr
avie
s an
d co
ndim
ents
; and
com
mer
cial
todd
ler f
oods
, Misc
ella
neou
s al
so in
clud
es
nutr
ition
pow
ders
and
drin
ks
277
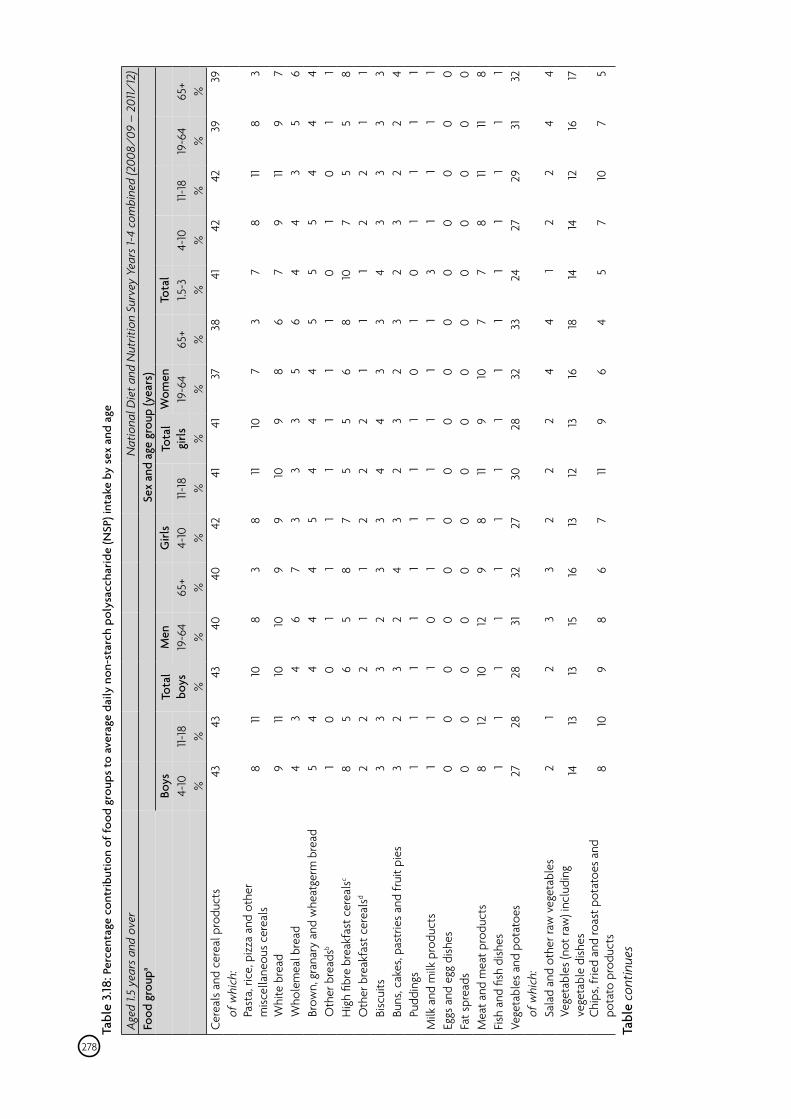
Tabl
e 3.1
8: P
erce
ntag
e co
ntrib
utio
n of
food
gro
ups
to a
vera
ge d
aily
non
-sta
rch
poly
sacc
harid
e (N
SP) i
ntak
e by
sex
and
age
Aged
1.5
year
s and
ove
r
N
atio
nal D
iet a
nd N
utrit
ion
Surv
ey Y
ears
1-4
com
bine
d (2
008/
09 –
201
1/12
)Fo
od g
roup
a S
ex a
nd a
ge g
roup
(yea
rs)
Bo
ys
To
tal
Men
Girl
s
Tota
l W
omen
Tota
l
4-10
11-
18
boys
19
-64
65+
4-10
11-
18
girls
19
-64
65+
1.5-3
4-
10
11-18
19
-64
65+
%
%
%
%
%
%
%
%
%
%
%
%
%
%
%
Ce
real
s an
d ce
real
pro
duct
s
of w
hich
:
Past
a, ri
ce, p
izza
and
oth
er
misc
ella
neou
s ce
real
s
Whi
te b
read
Who
lem
eal b
read
Brow
n, g
rana
ry a
nd w
heat
germ
bre
ad
O
ther
bre
adsb
H
igh
fibre
bre
akfa
st c
erea
lsc
O
ther
bre
akfa
st c
erea
lsd
Bi
scui
ts
Bu
ns, c
akes
, pas
trie
s an
d fr
uit p
ies
Pu
ddin
gs
Milk
and
milk
pro
duct
s Eg
gs a
nd e
gg d
ishes
Fat s
prea
ds
Mea
t and
mea
t pro
duct
s Fi
sh a
nd fi
sh d
ishes
Ve
geta
bles
and
pot
atoe
s
of w
hich
:
Sala
d an
d ot
her r
aw v
eget
able
s
Vege
tabl
es (n
ot ra
w) i
nclu
ding
ve
geta
ble
dish
es
Ch
ips,
frie
d an
d ro
ast p
otat
oes
and
pota
to p
rodu
cts
Tabl
e co
ntin
ues
43 8 9 4 5 1 8 2 3 3 1 1 0 0 8 1
27 2 14 8
43 11 11 3 4 0 5 2 3 2 1 1 0 0 12 1
28 1 13
10
43 10
10 4 4 0 6 2 3 3 1 1 0 0 10 1
28 2 13 9
40 8 10 6 4 1 5 1 2 2 1 0 0 0 12 1 31 3 15 8
40 3 9 7 4 1 8 1 3 4 1 1 0 0 9 1 32 3 16 6
42 8 9 3 5 1 7 2 3 3 1 1 0 0 8 1
27 2 13 7
41 11 10 3 4 1 5 2 4 2 1 1 0 0 11 1
30 2 12 11
41 10 9 3 4 1 5 2 4 3 1 1 0 0 9 1
28 2 13 9
37 7 8 5 4 1 6 1 3 2 0 1 0 0 10 1 32 4 16 6
38 3 6 6 5 1 8 1 3 3 1 1 0 0 7 1 33 4 18 4
41 7 7 4 5 0 10 1 4 2 0 3 0 0 7 1
24 1 14 5
42 8 9 4 5 1 7 2 3 3 1 1 0 0 8 1
27 2 14 7
42 11 11 3 4 0 5 2 3 2 1 1 0 0 11 1
29 2 12
10
39 8 9 5 4 1 5 1 3 2 1 1 0 0 11 1 31 4 16 7
39 3 7 6 4 1 8 1 3 4 1 1 0 0 8 1 32 4 17 5
278
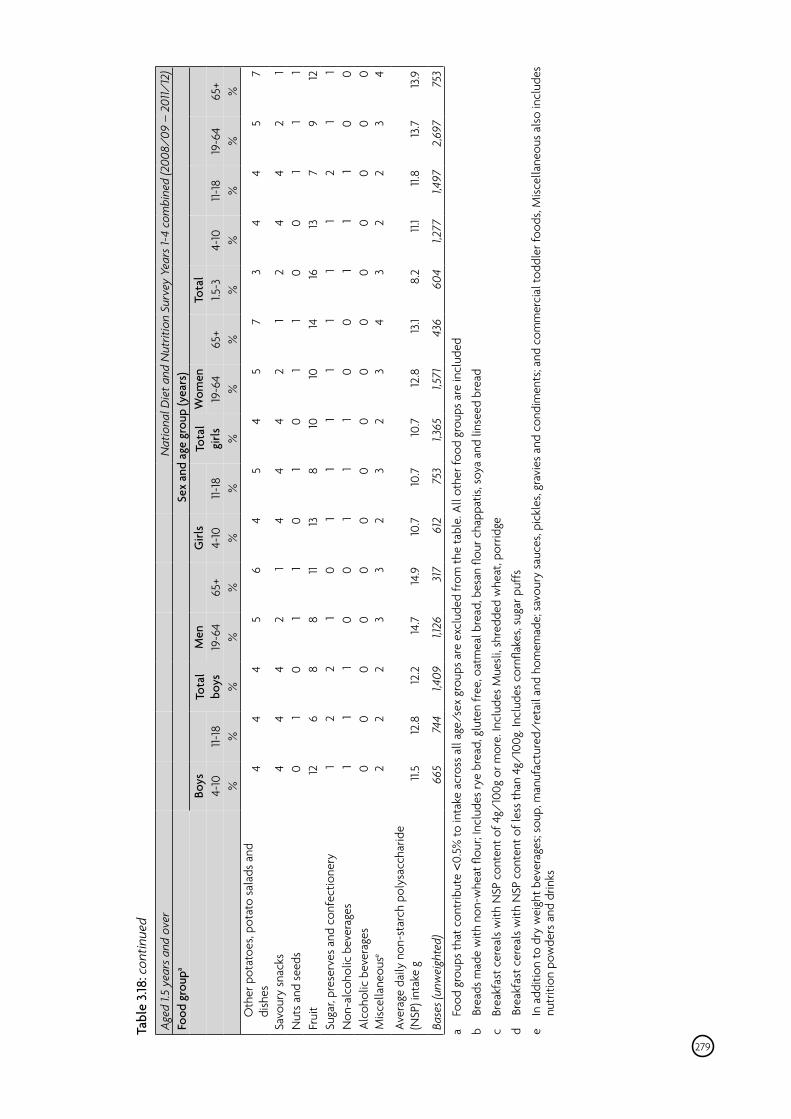
Tabl
e 3.1
8: c
ontin
ued
Aged
1.5
year
s and
ove
r
N
atio
nal D
iet a
nd N
utrit
ion
Surv
ey Y
ears
1-4
com
bine
d (2
008/
09 –
201
1/12
)Fo
od g
roup
a S
ex a
nd a
ge g
roup
(yea
rs)
Bo
ys
To
tal
Men
Girl
s
Tota
l W
omen
Tota
l
4-10
11-
18
boys
19
-64
65+
4-10
11-
18
girls
19
-64
65+
1.5-3
4-
10
11-18
19
-64
65+
%
%
%
%
%
%
%
%
%
%
%
%
%
%
%
Oth
er p
otat
oes,
pota
to s
alad
s an
d di
shes
4
4 4
5 6
4 5
4 5
7 3
4 4
5 7
Savo
ury
snac
ks
4 4
4 2
1 4
4 4
2 1
2 4
4 2
1 N
uts
and
seed
s 0
1 0
1 1
0 1
0 1
1 0
0 1
1 1
Frui
t 12
6
8 8
11 13
8
10
10
14
16
13
7 9
12
Suga
r, pr
eser
ves
and
conf
ectio
nery
1
2 2
1 0
1 1
1 1
1 1
1 2
1 1
Non
-alc
ohol
ic b
ever
ages
1
1 1
0 0
1 1
1 0
0 1
1 1
0 0
Alco
holic
bev
erag
es
0 0
0 0
0 0
0 0
0 0
0 0
0 0
0 M
iscel
lane
ouse
2 2
2 3
3 2
3 2
3 4
3 2
2 3
4
Aver
age
daily
non
-sta
rch
poly
sacc
harid
e (N
SP) i
ntak
e g
11.5
12.8
12
.2
14.7
14
.9
10.7
10
.7
10.7
12
.8
13.1
8.2
11.1
11.8
13.7
13
.9
Base
s (un
wei
ghte
d)
665
744
1,409
1,1
26
317
612
753
1,365
1,5
71
436
604
1,277
1,4
97
2,69
7 75
3
279
a Fo
od g
roup
s th
at c
ontr
ibut
e <0
.5%
to in
take
acr
oss
all a
ge/s
ex g
roup
s ar
e ex
clud
ed fr
om th
e ta
ble.
All
othe
r foo
d gr
oups
are
incl
uded
b Br
eads
mad
e w
ith n
on-w
heat
flou
r; In
clud
es ry
e br
ead,
glu
ten
free
, oat
mea
l bre
ad, b
esan
flou
r cha
ppat
is, s
oya
and
linse
ed b
read
c Br
eakf
ast c
erea
ls w
ith N
SP c
onte
nt o
f 4g/
100g
or m
ore.
Incl
udes
Mue
sli,
shre
dded
whe
at, p
orrid
ge
d Br
eakf
ast c
erea
ls w
ith N
SP c
onte
nt o
f les
s th
an 4
g/10
0g. I
nclu
des
corn
flake
s, su
gar p
uffs
e In
add
ition
to d
ry w
eigh
t bev
erag
es; s
oup,
man
ufac
ture
d/re
tail
and
hom
emad
e; s
avou
ry s
auce
s, pi
ckle
s, gr
avie
s an
d co
ndim
ents
; and
com
mer
cial
todd
ler f
oods
, Misc
ella
neou
s al
so in
clud
es
nutr
ition
pow
ders
and
drin
ks
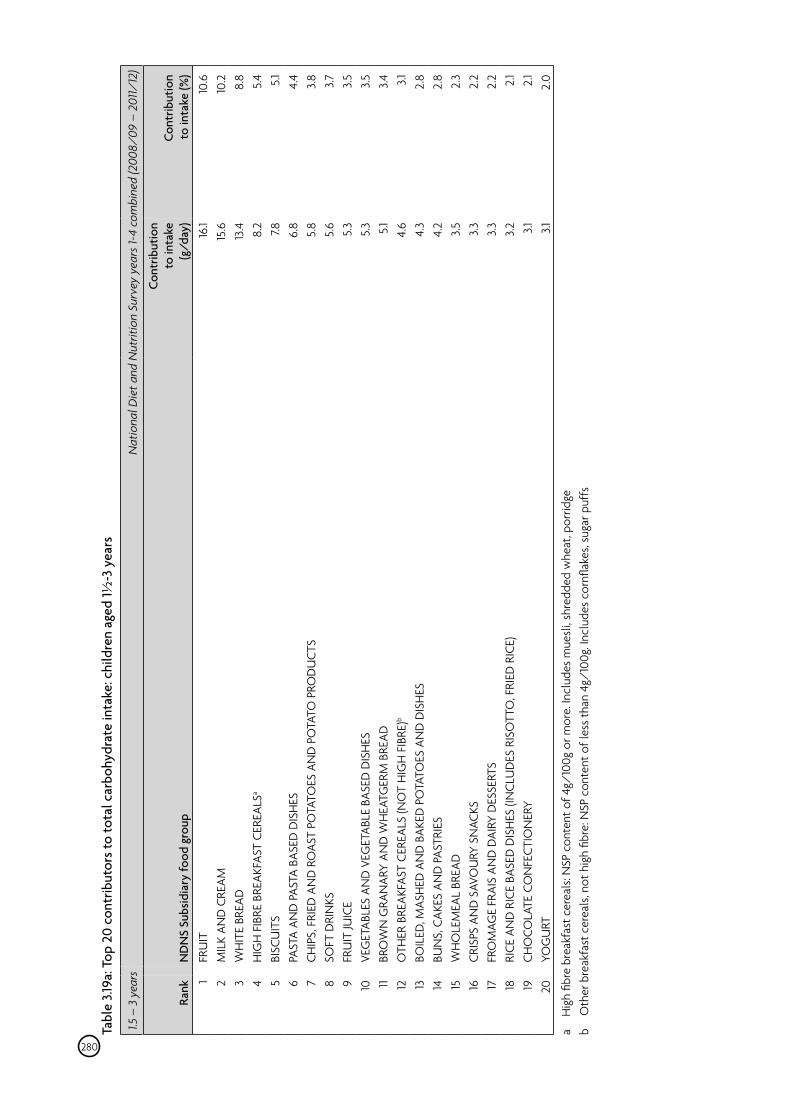
Tabl
e 3.1
9a: T
op 2
0 co
ntrib
utor
s to
tota
l car
bohy
drat
e in
take
: chi
ldre
n ag
ed 1½
-3 y
ears
1.5 –
3 y
ears
N
atio
nal D
iet a
nd N
utrit
ion
Surv
ey y
ears
1-4
com
bine
d (2
008/
09 –
201
1/12
)
Rank
N
DN
S Su
bsid
iary
food
gro
up
Co
ntrib
utio
n to
inta
ke
(g/d
ay)
Co
ntrib
utio
n to
inta
ke (%
) 1 2 3 4 5 6 7 8 9 10 11 12
13
14
15
16
17
18
19
20
FRU
IT
MIL
K AN
D C
REAM
W
HIT
E BR
EAD
H
IGH
FIB
RE B
REAK
FAST
CER
EALS
a
BISC
UIT
S PA
STA
AND
PAS
TA B
ASED
DIS
HES
CH
IPS,
FRI
ED A
ND
RO
AST
POTA
TOES
AN
D P
OTA
TO P
ROD
UCT
S SO
FT D
RIN
KS
FRU
IT JU
ICE
VEG
ETAB
LES
AND
VEG
ETAB
LE B
ASED
DIS
HES
BR
OW
N G
RAN
ARY
AND
WH
EATG
ERM
BRE
AD
OTH
ER B
REAK
FAST
CER
EALS
(NO
T H
IGH
FIB
RE)b
BOIL
ED, M
ASH
ED A
ND
BAK
ED P
OTA
TOES
AN
D D
ISH
ES
BUN
S, C
AKES
AN
D P
ASTR
IES
WH
OLE
MEA
L BR
EAD
CR
ISPS
AN
D S
AVO
URY
SN
ACKS
FR
OM
AGE
FRAI
S AN
D D
AIRY
DES
SERT
S RI
CE A
ND
RIC
E BA
SED
DIS
HES
(IN
CLU
DES
RIS
OTT
O, F
RIED
RIC
E)
CHO
COLA
TE C
ON
FECT
ION
ERY
YOG
URT
16.1
15.6
13
.4
8.2 7.8
6.8
5.8
5.6 5.3
5.3 5.1
4.6 4.3
4.2 3.5 3.3
3.3
3.2 3.1
3.1
10.6
10
.2
8.8 5.4 5.1
4.4
3.8 3.7
3.
5 3.
5 3.4
3.1
2.
8 2.
8 2.3
2.2
2.2 2.1
2.1
2.0
a H
igh
fibre
bre
akfa
st c
erea
ls: N
SP c
onte
nt o
f 4g/
100g
or m
ore.
Incl
udes
mue
sli,
shre
dded
whe
at, p
orrid
ge b
Oth
er b
reak
fast
cer
eals
, not
hig
h fib
re: N
SP c
onte
nt o
f les
s th
an 4
g/10
0g. I
nclu
des
corn
flake
s, su
gar p
uffs
280
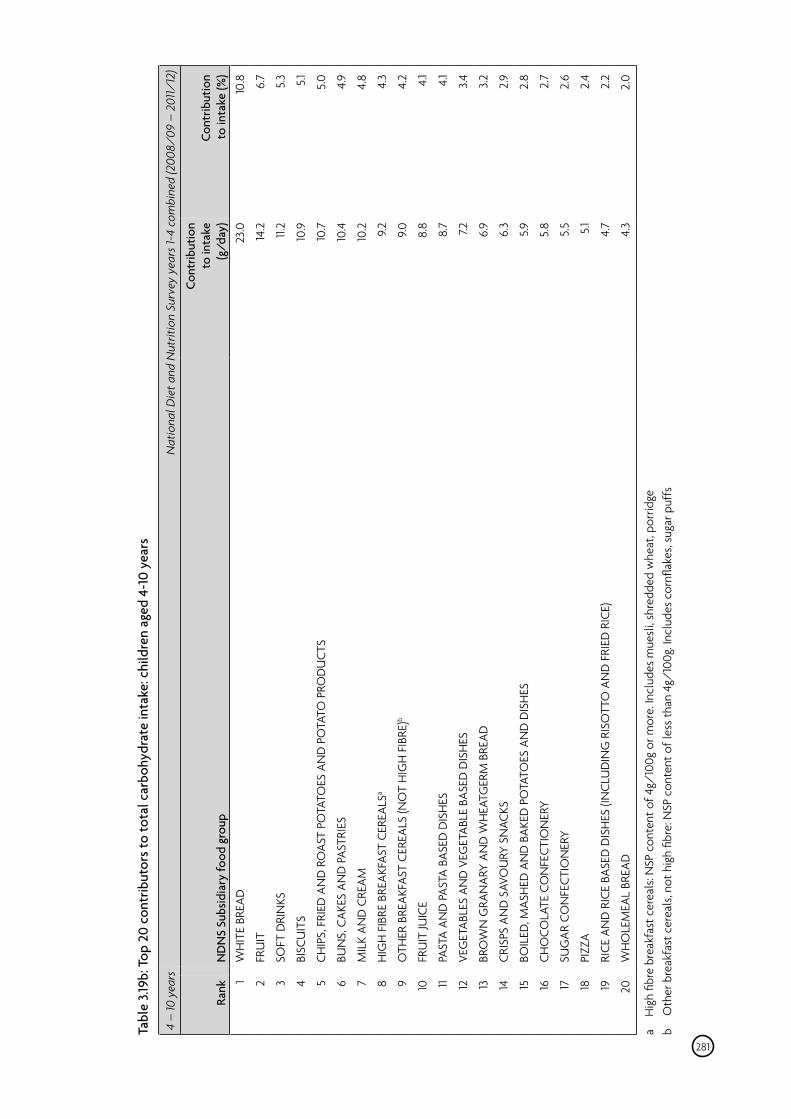
Tabl
e 3.1
9b: T
op 2
0 co
ntrib
utor
s to
tota
l car
bohy
drat
e in
take
: chi
ldre
n ag
ed 4
-10
year
s
4 –
10 y
ears
N
atio
nal D
iet a
nd N
utrit
ion
Surv
ey y
ears
1-4
com
bine
d (2
008/
09 –
201
1/12
)
Rank
N
DN
S Su
bsid
iary
food
gro
up
Co
ntrib
utio
n to
inta
ke
(g/d
ay)
Co
ntrib
utio
n to
inta
ke (%
) 1 2 3 4 5 6 7 8 9 10 11 12
13
14
15
16
17
18
19
20
WH
ITE
BREA
D
FRU
IT
SOFT
DRI
NKS
BISC
UIT
S
CHIP
S, F
RIED
AN
D R
OAS
T PO
TATO
ES A
ND
PO
TATO
PRO
DU
CTS
BUN
S, C
AKES
AN
D P
ASTR
IES
MIL
K AN
D C
REAM
HIG
H F
IBRE
BRE
AKFA
ST C
EREA
LSa
OTH
ER B
REAK
FAST
CER
EALS
(NO
T H
IGH
FIB
RE)b
FRU
IT JU
ICE
PAST
A AN
D P
ASTA
BAS
ED D
ISH
ES
VEG
ETAB
LES
AND
VEG
ETAB
LE B
ASED
DIS
HES
BRO
WN
GRA
NAR
Y AN
D W
HEA
TGER
M B
READ
CRIS
PS A
ND
SAV
OU
RY S
NAC
KS
BOIL
ED, M
ASH
ED A
ND
BAK
ED P
OTA
TOES
AN
D D
ISH
ES
CHO
COLA
TE C
ON
FECT
ION
ERY
SUG
AR C
ON
FECT
ION
ERY
PIZZ
A
RICE
AN
D R
ICE
BASE
D D
ISH
ES (I
NCL
UD
ING
RIS
OTT
O A
ND
FRI
ED R
ICE)
WH
OLE
MEA
L BR
EAD
23.0
14.2
11.2
10.9
10.7
10.4
10.2
9.2
9.0
8.8
8.7 7.2
6.9
6.3
5.9
5.8 5.5 5.1
4.7
4.3
10.8
6.7
5.3 5.1
5.0 4.9
4.8 4.3
4.2 4.1
4.1
3.4
3.2
2.9
2.8 2.7
2.6
2.4
2.2
2.0
a H
igh
fibre
bre
akfa
st c
erea
ls: N
SP c
onte
nt o
f 4g/
100g
or m
ore.
Incl
udes
mue
sli,
shre
dded
whe
at, p
orrid
ge b
Oth
er b
reak
fast
cer
eals
, not
hig
h fib
re: N
SP c
onte
nt o
f les
s th
an 4
g/10
0g. I
nclu
des
corn
flake
s, su
gar p
uffs
281
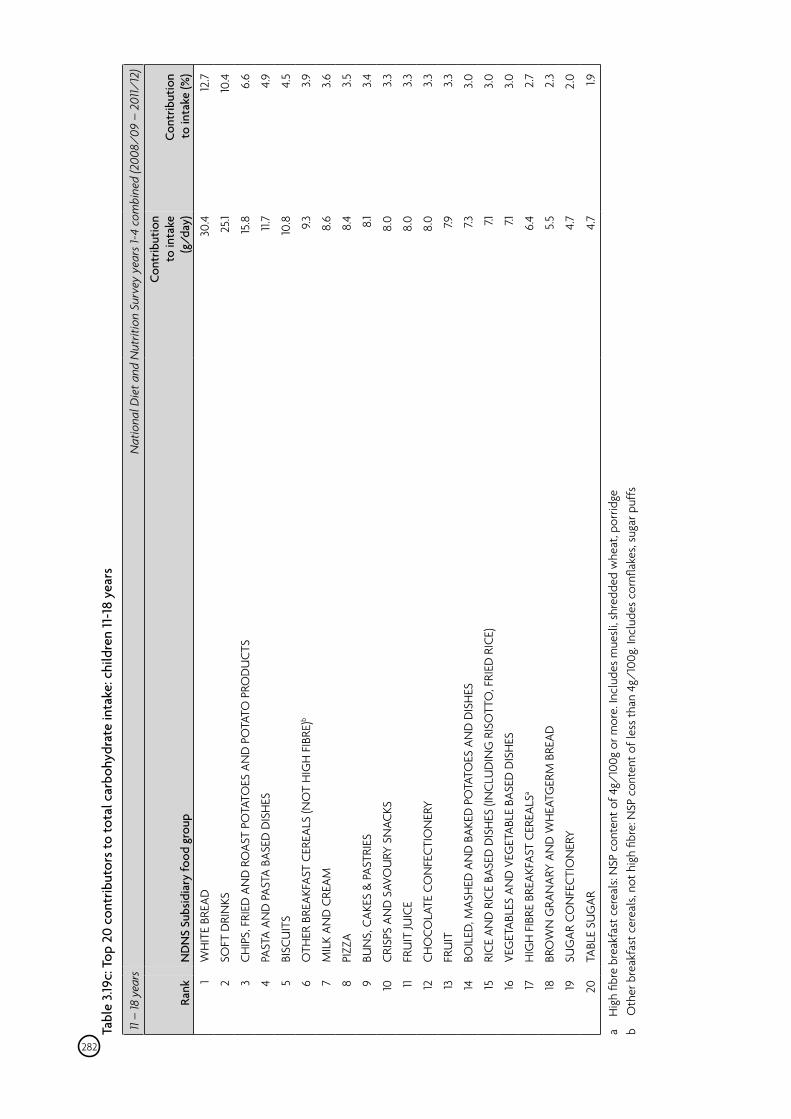
Tabl
e 3.1
9c: T
op 2
0 co
ntrib
utor
s to
tota
l car
bohy
drat
e in
take
: chi
ldre
n 11
-18
year
s
11 –
18 y
ears
N
atio
nal D
iet a
nd N
utrit
ion
Surv
ey y
ears
1-4
com
bine
d (2
008/
09 –
201
1/12
)
Rank
N
DN
S Su
bsid
iary
food
gro
up
Co
ntrib
utio
n to
inta
ke
(g/d
ay)
Co
ntrib
utio
n to
inta
ke (%
) 1 2 3 4 5 6 7 8 9 10 11 12
13
14
15
16
17
18
19
20
WH
ITE
BREA
D
SOFT
DRI
NKS
CHIP
S, F
RIED
AN
D R
OAS
T PO
TATO
ES A
ND
PO
TATO
PRO
DU
CTS
PAST
A AN
D P
ASTA
BAS
ED D
ISH
ES
BISC
UIT
S
OTH
ER B
REAK
FAST
CER
EALS
(NO
T H
IGH
FIB
RE)b
MIL
K AN
D C
REAM
PIZZ
A
BUN
S, C
AKES
& P
ASTR
IES
CRIS
PS A
ND
SAV
OU
RY S
NAC
KS
FRU
IT JU
ICE
CHO
COLA
TE C
ON
FECT
ION
ERY
FRU
IT
BOIL
ED, M
ASH
ED A
ND
BAK
ED P
OTA
TOES
AN
D D
ISH
ES
RICE
AN
D R
ICE
BASE
D D
ISH
ES (I
NCL
UD
ING
RIS
OTT
O, F
RIED
RIC
E)
VEG
ETAB
LES
AND
VEG
ETAB
LE B
ASED
DIS
HES
HIG
H F
IBRE
BRE
AKFA
ST C
EREA
LSa
BRO
WN
GRA
NAR
Y AN
D W
HEA
TGER
M B
READ
SUG
AR C
ON
FECT
ION
ERY
TABL
E SU
GAR
30.4
25.1
15.8
11.7
10.8
9.3
8.6
8.4 8.1
8.0
8.0
8.0 7.9
7.3
7.1
7.1
6.4 5.5
4.7
4.7
12.7
10.4
6.6
4.9
4.5
3.9
3.6 3.5
3.4
3.3
3.3
3.3
3.3
3.0
3.0
3.0 2.7
2.3
2.0 1.9
a H
igh
fibre
bre
akfa
st c
erea
ls: N
SP c
onte
nt o
f 4g/
100g
or m
ore.
Incl
udes
mue
sli,
shre
dded
whe
at, p
orrid
ge b
Oth
er b
reak
fast
cer
eals
, not
hig
h fib
re: N
SP c
onte
nt o
f les
s th
an 4
g/10
0g. I
nclu
des
corn
flake
s, su
gar p
uffs
282
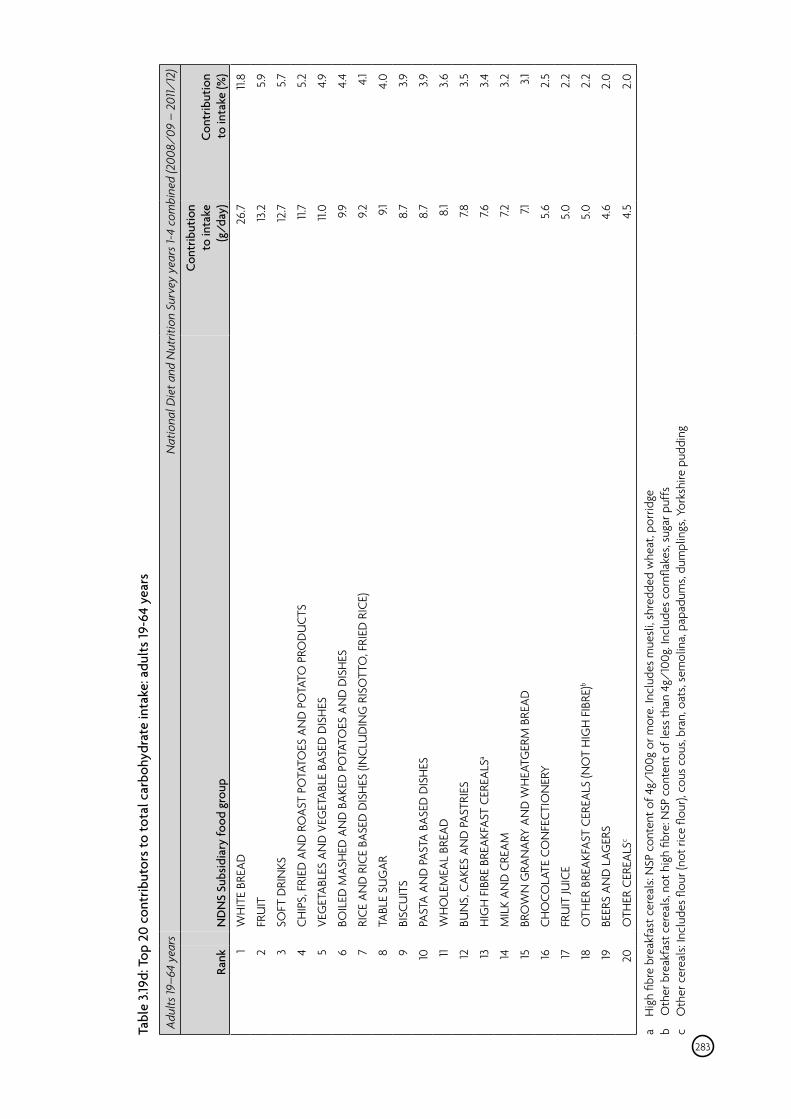
Tabl
e 3.1
9d: T
op 2
0 co
ntrib
utor
s to
tota
l car
bohy
drat
e in
take
: adu
lts 1
9-64
yea
rs
Adul
ts 19
–64
year
s N
atio
nal D
iet a
nd N
utrit
ion
Surv
ey y
ears
1-4
com
bine
d (2
008/
09 –
201
1/12
)
Rank
N
DN
S Su
bsid
iary
food
gro
up
Cont
ribut
ion
to in
take
(g
/day
) Co
ntrib
utio
n to
inta
ke (%
) 1
WH
ITE
BREA
D
26.7
11.
8
2 FR
UIT
13
.2
5.9
3 SO
FT D
RIN
KS
12.7
5.
7
4 CH
IPS,
FRI
ED A
ND
RO
AST
POTA
TOES
AN
D P
OTA
TO P
ROD
UCT
S 11.
7 5.
2
5 VE
GET
ABLE
S AN
D V
EGET
ABLE
BAS
ED D
ISH
ES
11.0
4.9
6 BO
ILED
MAS
HED
AN
D B
AKED
PO
TATO
ES A
ND
DIS
HES
9.9
4.
4
7 RI
CE A
ND
RIC
E BA
SED
DIS
HES
(IN
CLU
DIN
G R
ISO
TTO
, FRI
ED R
ICE)
9.
2 4.
1
8 TA
BLE
SUG
AR
9.1
4.0
9 BI
SCU
ITS
8.7
3.9
10
PAST
A AN
D P
ASTA
BAS
ED D
ISH
ES
8.7
3.9
11 W
HO
LEM
EAL
BREA
D
8.1
3.6
12
BUN
S, C
AKES
AN
D P
ASTR
IES
7.8
3.5
13
HIG
H F
IBRE
BRE
AKFA
ST C
EREA
LSa
7.6
3.4
14
MIL
K AN
D C
REAM
7.2
3.
2
15
BRO
WN
GRA
NAR
Y AN
D W
HEA
TGER
M B
READ
7.1
3.1
16
CHO
COLA
TE C
ON
FECT
ION
ERY
5.6
2.5
17
FRU
IT JU
ICE
5.0
2.2
18
OTH
ER B
REAK
FAST
CER
EALS
(NO
T H
IGH
FIB
RE)b
5.0
2.2
19
BEER
S AN
D L
AGER
S 4.
6 2.
0
20
OTH
ER C
EREA
LSc
4.5
2.0
a H
igh
fibre
bre
akfa
st c
erea
ls: N
SP c
onte
nt o
f 4g/
100g
or m
ore.
Incl
udes
mue
sli,
shre
dded
whe
at, p
orrid
geb
Oth
er b
reak
fast
cer
eals
, not
hig
h fib
re: N
SP c
onte
nt o
f les
s th
an 4
g/10
0g. I
nclu
des
corn
flake
s, su
gar p
uffs
Oth
er c
erea
ls: I
nclu
des
flour
(not
rice
flou
r), c
ous
cous
, bra
n, o
ats,
sem
olin
a, p
apad
ums,
dum
plin
gs, Y
orks
hire
pud
ding
283
c
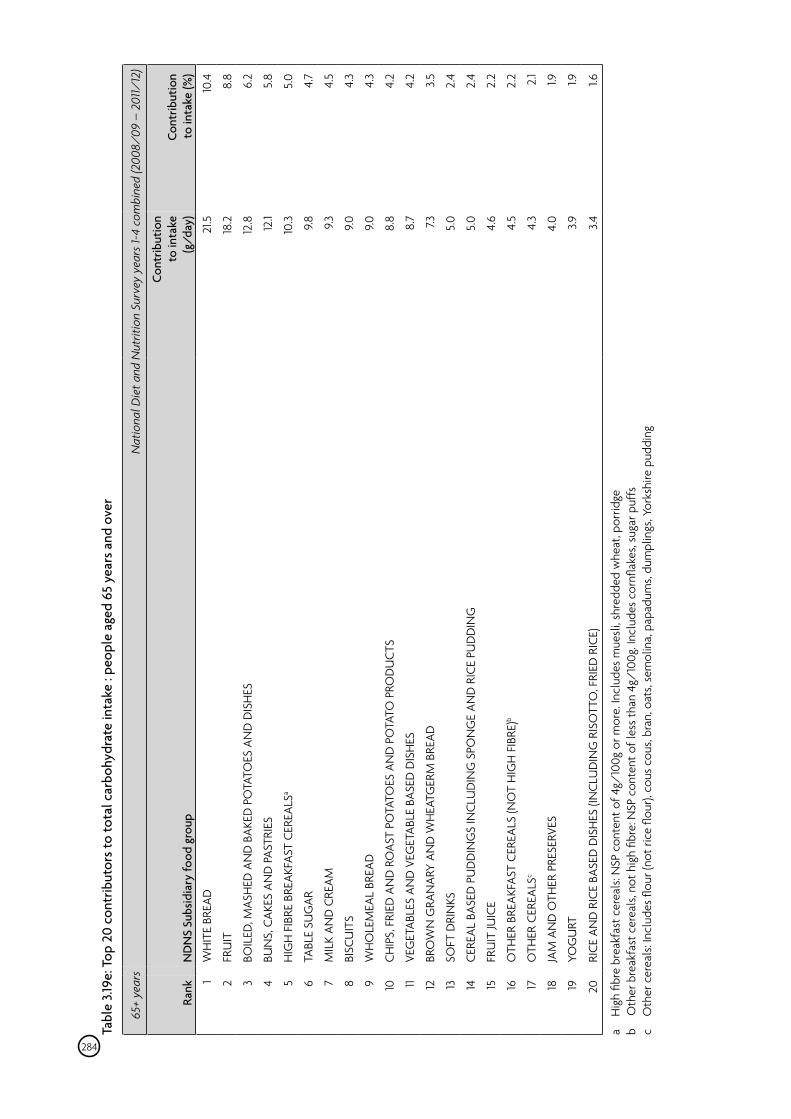
Tabl
e 3.1
9e: T
op 2
0 co
ntrib
utor
s to
tota
l car
bohy
drat
e in
take
: pe
ople
age
d 65
yea
rs a
nd o
ver
65+
year
s N
atio
nal D
iet a
nd N
utrit
ion
Surv
ey y
ears
1-4
com
bine
d (2
008/
09 –
201
1/12
)
Rank
N
DN
S Su
bsid
iary
food
gro
up
Cont
ribut
ion
to in
take
(g
/day
) Co
ntrib
utio
n to
inta
ke (%
) 1
WH
ITE
BREA
D
21.5
10
.4
2 FR
UIT
18
.2
8.8
3 BO
ILED
, MAS
HED
AN
D B
AKED
PO
TATO
ES A
ND
DIS
HES
12
.8
6.2
4 BU
NS,
CAK
ES A
ND
PAS
TRIE
S 12
.1 5.
8
5 H
IGH
FIB
RE B
REAK
FAST
CER
EALS
a 10
.3
5.0
6 TA
BLE
SUG
AR
9.8
4.7
7 M
ILK
AND
CRE
AM
9.3
4.5
8 BI
SCU
ITS
9.0
4.3
9 W
HO
LEM
EAL
BREA
D
9.0
4.3
10
CHIP
S, F
RIED
AN
D R
OAS
T PO
TATO
ES A
ND
PO
TATO
PRO
DU
CTS
8.8
4.2
11 VE
GET
ABLE
S AN
D V
EGET
ABLE
BAS
ED D
ISH
ES
8.7
4.2
12
BRO
WN
GRA
NAR
Y AN
D W
HEA
TGER
M B
READ
7.3
3.
5
13
SOFT
DRI
NKS
5.
0 2.
4
14
CERE
AL B
ASED
PU
DD
ING
S IN
CLU
DIN
G S
PON
GE
AND
RIC
E PU
DD
ING
5.
0 2.
4
15
FRU
IT JU
ICE
4.6
2.2
16
OTH
ER B
REAK
FAST
CER
EALS
(NO
T H
IGH
FIB
RE)b
4.5
2.2
17
OTH
ER C
EREA
LSc
4.3
2.1
18
JAM
AN
D O
THER
PRE
SERV
ES
4.0
1.9
19
YOG
URT
3.9
1.9
20
RICE
AN
D R
ICE
BASE
D D
ISH
ES (I
NCL
UD
ING
RIS
OTT
O, F
RIED
RIC
E)
3.4
1.6
a H
igh
fibre
bre
akfa
st c
erea
ls: N
SP c
onte
nt o
f 4g/
100g
or m
ore.
Incl
udes
mue
sli,
shre
dded
whe
at, p
orrid
geb
Oth
er b
reak
fast
cer
eals
, not
hig
h fib
re: N
SP c
onte
nt o
f les
s th
an 4
g/10
0g. I
nclu
des
corn
flake
s, su
gar p
uffs
Oth
er c
erea
ls: I
nclu
des
flour
(not
rice
flou
r), c
ous
cous
, bra
n, o
ats,
sem
olin
a, p
apad
ums,
dum
plin
gs, Y
orks
hire
pud
ding
284
c
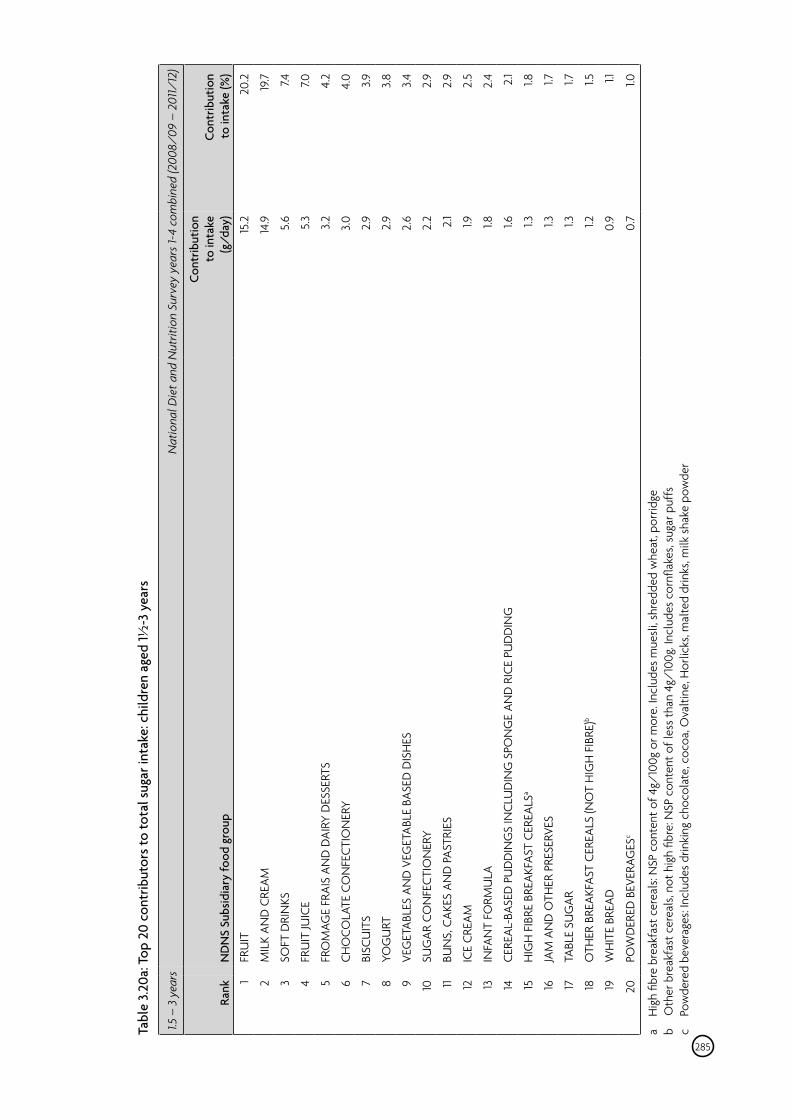
Tabl
e 3.
20a:
Top
20
cont
ribut
ors t
o to
tal s
ugar
inta
ke: c
hild
ren
aged
1½-3
yea
rs
1.5 –
3 y
ears
N
atio
nal D
iet a
nd N
utrit
ion
Surv
ey y
ears
1-4
com
bine
d (2
008/
09 –
201
1/12
)
Rank
N
DN
S Su
bsid
iary
food
gro
up
Cont
ribut
ion
to in
take
(g
/day
) Co
ntrib
utio
n to
inta
ke (%
) 1
FRU
IT
15.2
20
.2
2 M
ILK
AND
CRE
AM
14.9
19
.7
3 SO
FT D
RIN
KS
5.6
7.4
4 FR
UIT
JUIC
E 5.
3 7.0
5 FR
OM
AGE
FRAI
S AN
D D
AIRY
DES
SERT
S 3.
2 4.
2
6 CH
OCO
LATE
CO
NFE
CTIO
NER
Y 3.
0 4.
0
7 BI
SCU
ITS
2.9
3.9
8 YO
GU
RT
2.9
3.8
9 VE
GET
ABLE
S AN
D V
EGET
ABLE
BAS
ED D
ISH
ES
2.6
3.4
10
SUG
AR C
ON
FECT
ION
ERY
2.2
2.9
11 BU
NS,
CAK
ES A
ND
PAS
TRIE
S 2.
1 2.
9
12
ICE
CREA
M
1.9
2.5
13
INFA
NT
FORM
ULA
1.8
2.
4
14
CERE
AL-B
ASED
PU
DD
ING
S IN
CLU
DIN
G S
PON
GE
AND
RIC
E PU
DD
ING
1.6
2.
1
15
HIG
H F
IBRE
BRE
AKFA
ST C
EREA
LSa
1.3
1.8
16
JAM
AN
D O
THER
PRE
SERV
ES
1.3
1.7
17
TABL
E SU
GAR
1.3
1.7
18
OTH
ER B
REAK
FAST
CER
EALS
(NO
T H
IGH
FIB
RE)b
1.2
1.5
19
WH
ITE
BREA
D
0.9
1.1
20
POW
DER
ED B
EVER
AGES
c 0.
7 1.0
a
Hig
h fib
re b
reak
fast
cer
eals
: NSP
con
tent
of 4
g/10
0g o
r mor
e. In
clud
es m
uesl
i, sh
redd
ed w
heat
, por
ridge
b
Oth
er b
reak
fast
cer
eals
, not
hig
h fib
re: N
SP c
onte
nt o
f les
s th
an 4
g/10
0g. I
nclu
des
corn
flake
s, su
gar p
uffs
Pow
dere
d be
vera
ges:
Incl
udes
drin
king
cho
cola
te, c
ocoa
, Ova
ltine
, Hor
licks
, mal
ted
drin
ks, m
ilk s
hake
pow
der
285
c
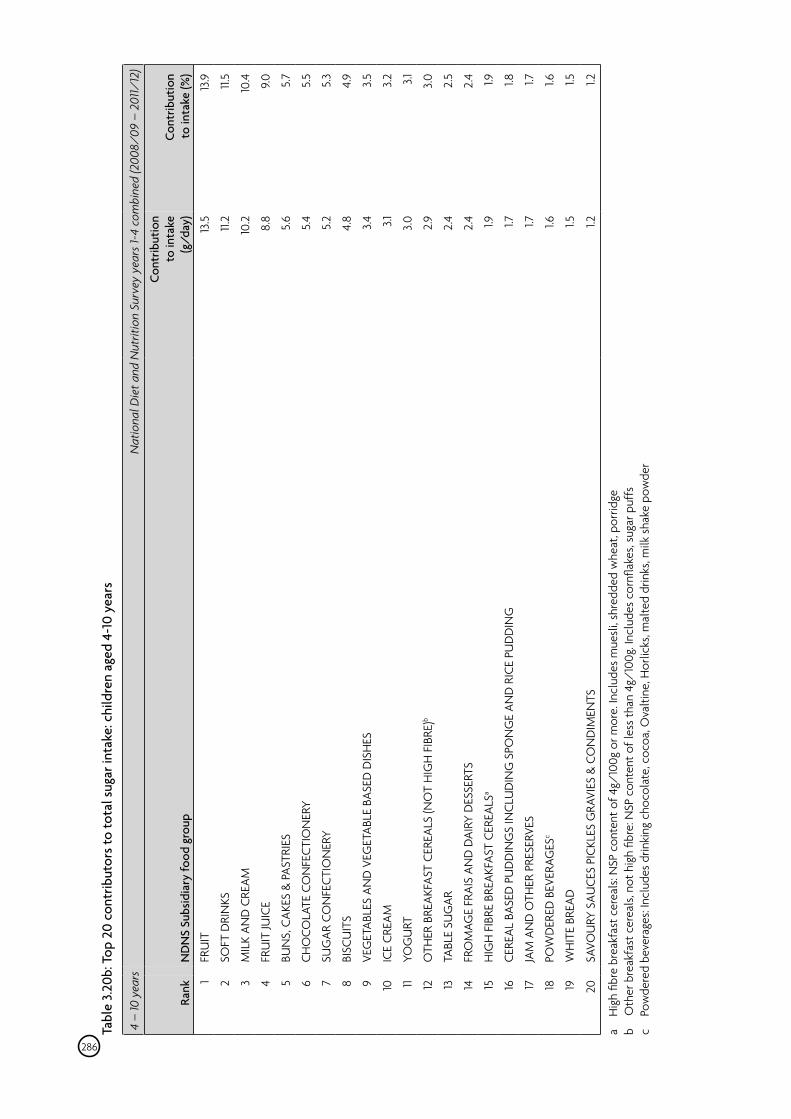
Tabl
e 3.
20b:
Top
20
cont
ribut
ors t
o to
tal s
ugar
inta
ke: c
hild
ren
aged
4-1
0 ye
ars
4 –
10 y
ears
N
atio
nal D
iet a
nd N
utrit
ion
Surv
ey y
ears
1-4
com
bine
d (2
008/
09 –
201
1/12
)
Rank
N
DN
S Su
bsid
iary
food
gro
up
Cont
ribut
ion
to in
take
(g
/day
) Co
ntrib
utio
n to
inta
ke (%
) 1
FRU
IT
13.5
13
.9
2 SO
FT D
RIN
KS
11.2
11.5
3 M
ILK
AND
CRE
AM
10.2
10
.4
4 FR
UIT
JUIC
E 8.
8 9.
0
5 BU
NS,
CAK
ES &
PAS
TRIE
S 5.
6 5.
7
6 CH
OCO
LATE
CO
NFE
CTIO
NER
Y 5.
4 5.
5
7 SU
GAR
CO
NFE
CTIO
NER
Y 5.
2 5.
3
8 BI
SCU
ITS
4.8
4.9
9 VE
GET
ABLE
S AN
D V
EGET
ABLE
BAS
ED D
ISH
ES
3.4
3.5
10
ICE
CREA
M
3.1
3.2
11 YO
GU
RT
3.0
3.1
12
OTH
ER B
REAK
FAST
CER
EALS
(NO
T H
IGH
FIB
RE)b
2.9
3.0
13
TABL
E SU
GAR
2.
4 2.
5
14
FRO
MAG
E FR
AIS
AND
DAI
RY D
ESSE
RTS
2.4
2.4
15
HIG
H F
IBRE
BRE
AKFA
ST C
EREA
LSa
1.9
1.9
16
CERE
AL B
ASED
PU
DD
ING
S IN
CLU
DIN
G S
PON
GE
AND
RIC
E PU
DD
ING
1.7
1.8
17
JAM
AN
D O
THER
PRE
SERV
ES
1.7
1.7
18
POW
DER
ED B
EVER
AGES
c 1.6
1.6
19
WH
ITE
BREA
D
1.5
1.5
20
SAVO
URY
SAU
CES
PICK
LES
GRA
VIES
& C
ON
DIM
ENTS
1.2
1.2
a
Hig
h fib
re b
reak
fast
cer
eals
: NSP
con
tent
of 4
g/10
0g o
r mor
e. In
clud
es m
uesl
i, sh
redd
ed w
heat
, por
ridge
b
Oth
er b
reak
fast
cer
eals
, not
hig
h fib
re: N
SP c
onte
nt o
f les
s th
an 4
g/10
0g. I
nclu
des
corn
flake
s, su
gar p
uffs
Pow
dere
d be
vera
ges:
Incl
udes
drin
king
cho
cola
te, c
ocoa
, Ova
ltine
, Hor
licks
, mal
ted
drin
ks, m
ilk s
hake
pow
der
286
c
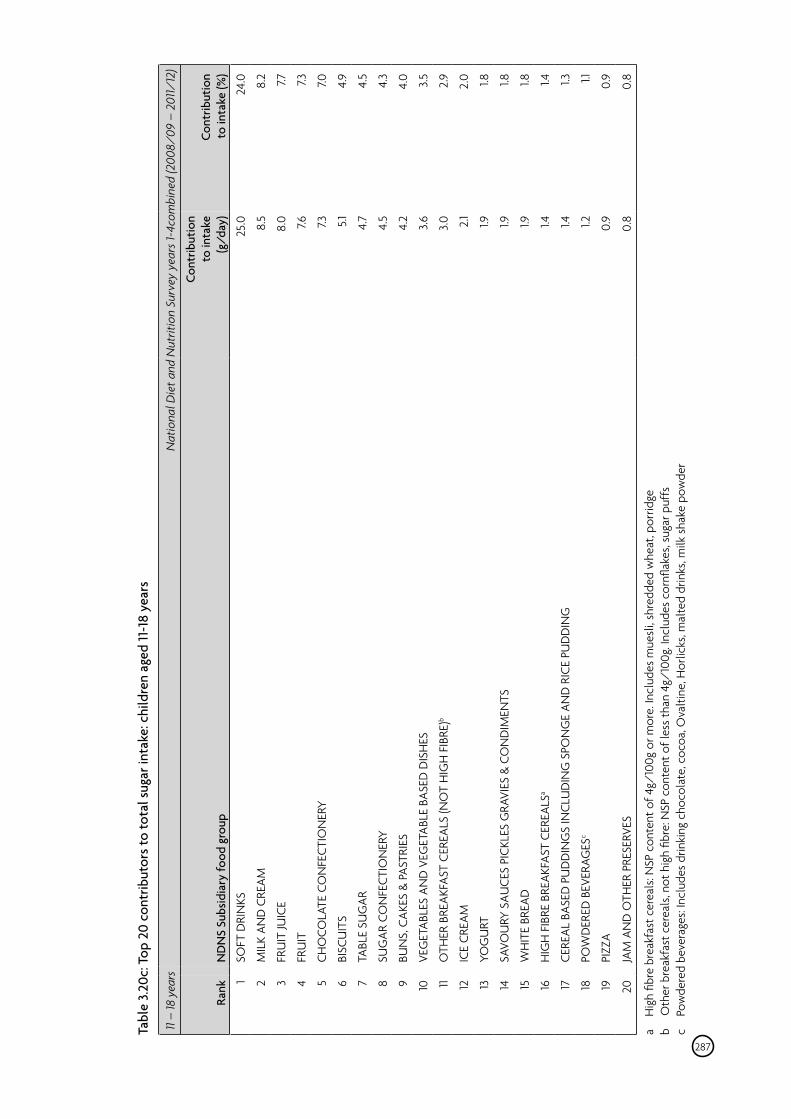
Tabl
e 3.
20c:
Top
20
cont
ribut
ors t
o to
tal s
ugar
inta
ke: c
hild
ren
aged
11-1
8 ye
ars
11 –
18 y
ears
N
atio
nal D
iet a
nd N
utrit
ion
Surv
ey y
ears
1-4c
ombi
ned
(200
8/09
– 2
011/
12)
Rank
N
DN
S Su
bsid
iary
food
gro
up
Cont
ribut
ion
to in
take
(g
/day
) Co
ntrib
utio
n to
inta
ke (%
) 1
SOFT
DRI
NKS
25
.0
24.0
2 M
ILK
AND
CRE
AM
8.5
8.2
3 FR
UIT
JUIC
E 8.
0 7.7
4 FR
UIT
7.6
7.3
5 CH
OCO
LATE
CO
NFE
CTIO
NER
Y 7.3
7.0
6 BI
SCU
ITS
5.1
4.9
7 TA
BLE
SUG
AR
4.7
4.5
8 SU
GAR
CO
NFE
CTIO
NER
Y 4.
5 4.
3
9 BU
NS,
CAK
ES &
PAS
TRIE
S 4.
2 4.
0
10
VEG
ETAB
LES
AND
VEG
ETAB
LE B
ASED
DIS
HES
3.
6 3.
5
11 O
THER
BRE
AKFA
ST C
EREA
LS (N
OT
HIG
H F
IBRE
)b 3.
0 2.
9
12
ICE
CREA
M
2.1
2.0
13
YOG
URT
1.9
1.8
14
SAVO
URY
SAU
CES
PICK
LES
GRA
VIES
& C
ON
DIM
ENTS
1.9
1.8
15
WH
ITE
BREA
D
1.9
1.8
16
HIG
H F
IBRE
BRE
AKFA
ST C
EREA
LSa
1.4
1.4
17
CERE
AL B
ASED
PU
DD
ING
S IN
CLU
DIN
G S
PON
GE
AND
RIC
E PU
DD
ING
1.4
1.3
18
POW
DER
ED B
EVER
AGES
c 1.2
1.1
19
PIZZ
A 0.
9 0.
9
20
JAM
AN
D O
THER
PRE
SERV
ES
0.8
0.8
a
Hig
h fib
re b
reak
fast
cer
eals
: NSP
con
tent
of 4
g/10
0g o
r mor
e. In
clud
es m
uesl
i, sh
redd
ed w
heat
, por
ridge
b
Oth
er b
reak
fast
cer
eals
, not
hig
h fib
re: N
SP c
onte
nt o
f les
s th
an 4
g/10
0g. I
nclu
des
corn
flake
s, su
gar p
uffs
Pow
dere
d be
vera
ges:
Incl
udes
drin
king
cho
cola
te, c
ocoa
, Ova
ltine
, Hor
licks
, mal
ted
drin
ks, m
ilk s
hake
pow
der
287
c
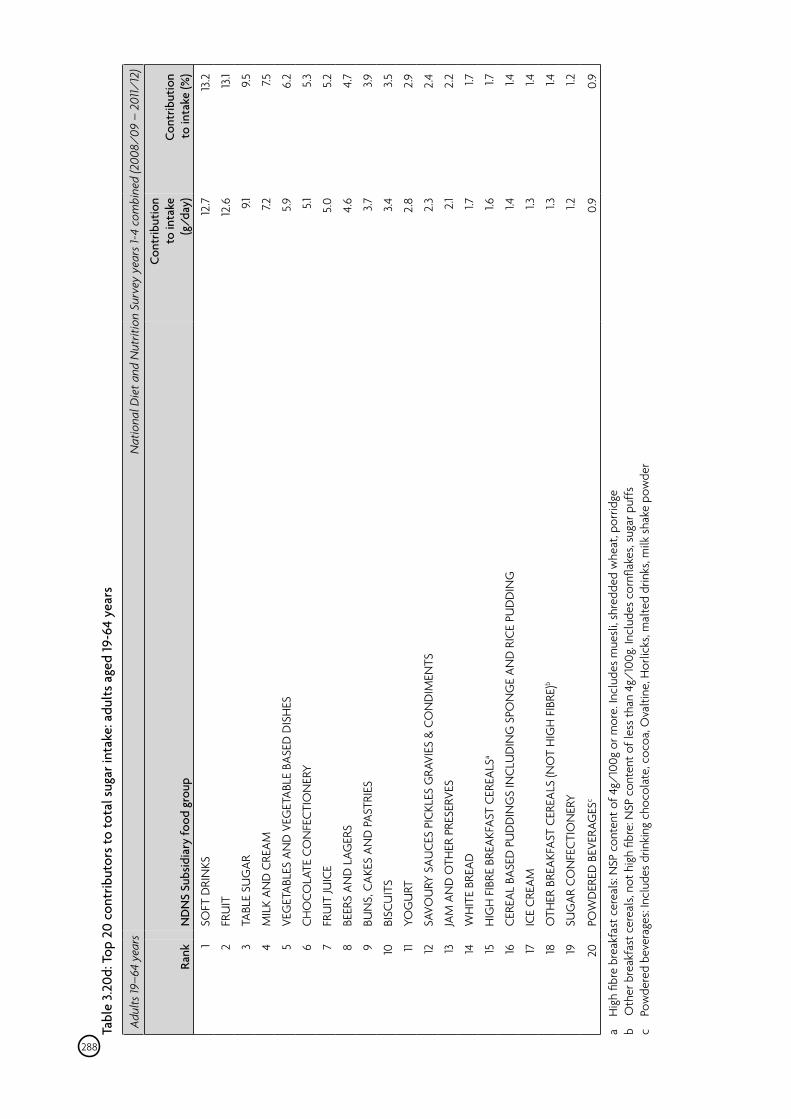
Tabl
e 3.
20d:
Top
20
cont
ribut
ors t
o to
tal s
ugar
inta
ke: a
dult
s age
d 19
-64
year
s
Adul
ts 19
–64
year
s N
atio
nal D
iet a
nd N
utrit
ion
Surv
ey y
ears
1-4
com
bine
d (2
008/
09 –
201
1/12
)
Rank
N
DN
S Su
bsid
iary
food
gro
up
Cont
ribut
ion
to in
take
(g
/day
) Co
ntrib
utio
n to
inta
ke (%
)
1 SO
FT D
RIN
KS
12.7
13
.2
2 FR
UIT
12
.6
13.1
3 TA
BLE
SUG
AR
9.1
9.5
4 M
ILK
AND
CRE
AM
7.2
7.5
5 VE
GET
ABLE
S AN
D V
EGET
ABLE
BAS
ED D
ISH
ES
5.9
6.2
6 CH
OCO
LATE
CO
NFE
CTIO
NER
Y 5.1
5.
3
7 FR
UIT
JUIC
E 5.
0 5.
2
8 BE
ERS
AND
LAG
ERS
4.6
4.7
9 BU
NS,
CAK
ES A
ND
PAS
TRIE
S 3.7
3.9
10
BISC
UIT
S 3.4
3.
5
11 YO
GU
RT
2.8
2.9
12
SAVO
URY
SAU
CES
PICK
LES
GRA
VIES
& C
ON
DIM
ENTS
2.
3 2.
4
13
JAM
AN
D O
THER
PRE
SERV
ES
2.1
2.2
14
WH
ITE
BREA
D
1.7
1.7
15
HIG
H F
IBRE
BRE
AKFA
ST C
EREA
LSa
1.6
1.7
16
CERE
AL B
ASED
PU
DD
ING
S IN
CLU
DIN
G S
PON
GE
AN
D R
ICE
PUD
DIN
G
1.4
1.4
17
ICE
CREA
M
1.3
1.4
18
OTH
ER B
REAK
FAST
CER
EALS
(NO
T H
IGH
FIB
RE)b
1.3
1.4
19
SUG
AR C
ON
FECT
ION
ERY
1.2
1.2
20
POW
DER
ED B
EVER
AGES
c 0.
9 0.
9
a
Hig
h fib
re b
reak
fast
cer
eals
: NSP
con
tent
of 4
g/10
0g o
r mor
e. In
clud
es m
uesl
i, sh
redd
ed w
heat
, por
ridge
b
Oth
er b
reak
fast
cer
eals
, not
hig
h fib
re: N
SP c
onte
nt o
f les
s th
an 4
g/10
0g. I
nclu
des
corn
flake
s, su
gar p
uffs
Pow
dere
d be
vera
ges:
Incl
udes
drin
king
cho
cola
te, c
ocoa
, Ova
ltine
, Hor
licks
, mal
ted
drin
ks, m
ilk s
hake
pow
der
288
c
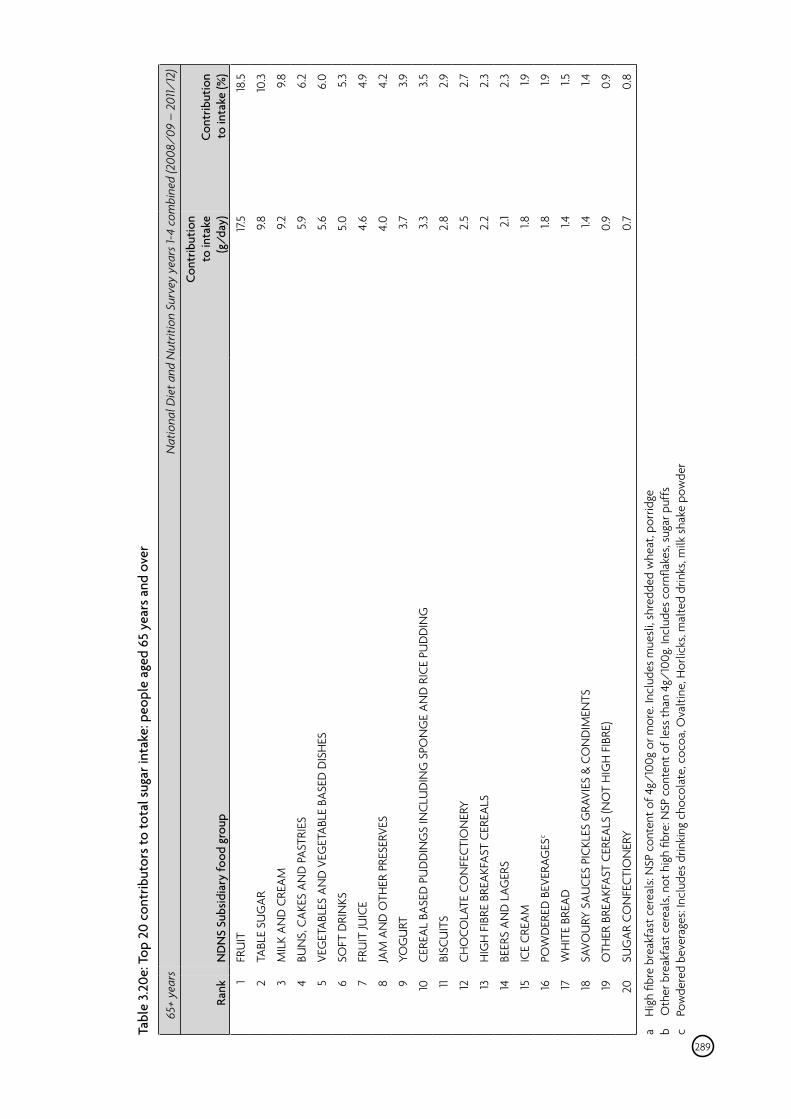
Tabl
e 3.
20e:
Top
20
cont
ribut
ors t
o to
tal s
ugar
inta
ke: p
eopl
e ag
ed 6
5 ye
ars a
nd o
ver
65+
year
s N
atio
nal D
iet a
nd N
utrit
ion
Surv
ey y
ears
1-4
com
bine
d (2
008/
09 –
201
1/12
)
Rank
N
DN
S Su
bsid
iary
food
gro
up
Cont
ribut
ion
to in
take
(g
/day
) Co
ntrib
utio
n to
inta
ke (%
) 1
FRU
IT
17.5
18
.5
2 TA
BLE
SUG
AR
9.8
10.3
3 M
ILK
AND
CRE
AM
9.2
9.8
4 BU
NS,
CAK
ES A
ND
PAS
TRIE
S 5.9
6.
2
5 VE
GET
ABLE
S AN
D V
EGET
ABLE
BAS
ED D
ISH
ES
5.6
6.0
6 SO
FT D
RIN
KS
5.0
5.3
7 FR
UIT
JUIC
E 4.
6 4.
9
8 JA
M A
ND
OTH
ER P
RESE
RVES
4.
0 4.
2
9 YO
GU
RT
3.7
3.9
10
CERE
AL B
ASED
PU
DD
ING
S IN
CLU
DIN
G S
PON
GE
AND
RIC
E PU
DD
ING
3.
3 3.
5
11 BI
SCU
ITS
2.8
2.9
12
CHO
COLA
TE C
ON
FECT
ION
ERY
2.5
2.7
13
HIG
H F
IBRE
BRE
AKFA
ST C
EREA
LS
2.2
2.3
14
BEER
S AN
D L
AGER
S 2.
1 2.
3
15
ICE
CREA
M
1.8
1.9
16
POW
DER
ED B
EVER
AGES
c 1.8
1.9
17
WH
ITE
BREA
D
1.4
1.5
18
SAVO
URY
SAU
CES
PICK
LES
GRA
VIES
& C
ON
DIM
ENTS
1.4
1.4
19
OTH
ER B
REAK
FAST
CER
EALS
(NO
T H
IGH
FIB
RE)
0.9
0.9
20
SUG
AR C
ON
FECT
ION
ERY
0.7
0.8
a
Hig
h fib
re b
reak
fast
cer
eals
: NSP
con
tent
of 4
g/10
0g o
r mor
e. In
clud
es m
uesl
i, sh
redd
ed w
heat
, por
ridge
b
Oth
er b
reak
fast
cer
eals
, not
hig
h fib
re: N
SP c
onte
nt o
f les
s th
an 4
g/10
0g. I
nclu
des
corn
flake
s, su
gar p
uffs
Pow
dere
d be
vera
ges:
Incl
udes
drin
king
cho
cola
te, c
ocoa
, Ova
ltine
, Hor
licks
, mal
ted
drin
ks, m
ilk s
hake
pow
der
289
c
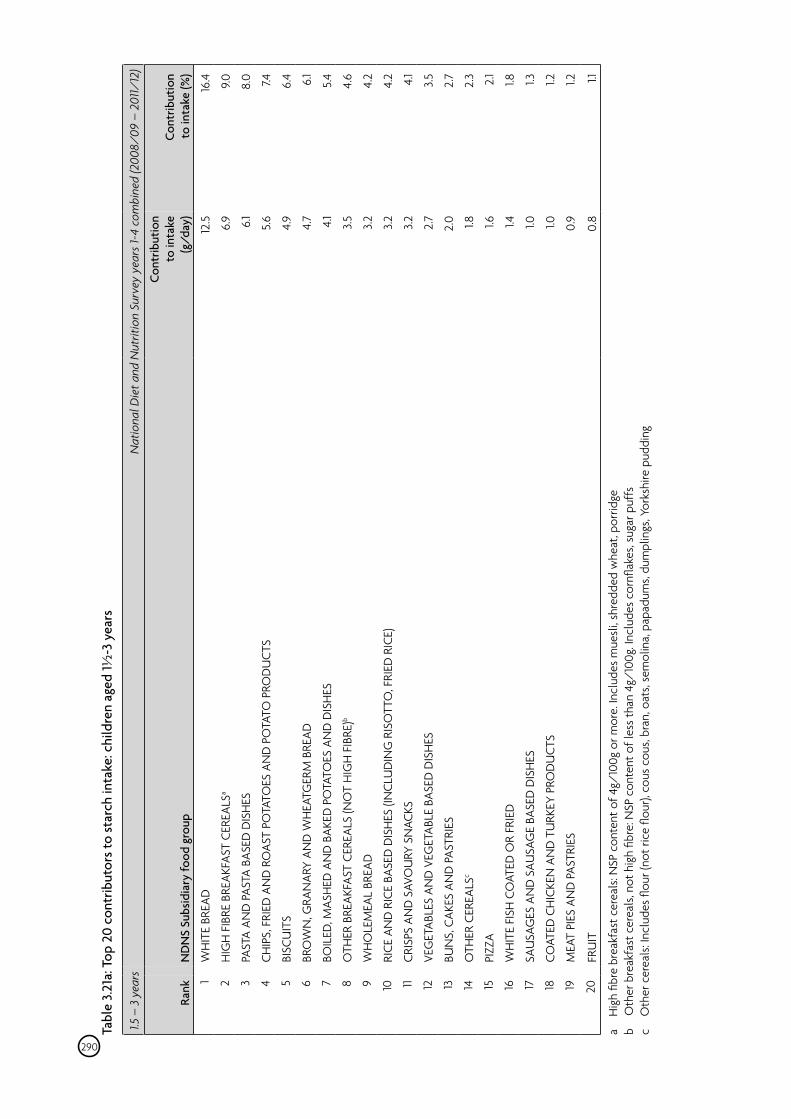
Tabl
e 3.
21a:
Top
20
cont
ribut
ors t
o st
arch
inta
ke: c
hild
ren
aged
1½-3
yea
rs
1.5 –
3 y
ears
N
atio
nal D
iet a
nd N
utrit
ion
Surv
ey y
ears
1-4
com
bine
d (2
008/
09 –
201
1/12
)
Rank
N
DN
S Su
bsid
iary
food
gro
up
Cont
ribut
ion
to in
take
(g
/day
) Co
ntrib
utio
n to
inta
ke (%
) 1
WH
ITE
BREA
D
12.5
16
.4
2 H
IGH
FIB
RE B
REAK
FAST
CER
EALS
a 6.
9 9.
0
3 PA
STA
AND
PAS
TA B
ASED
DIS
HES
6.
1 8.
0
4 CH
IPS,
FRI
ED A
ND
RO
AST
POTA
TOES
AN
D P
OTA
TO P
ROD
UCT
S 5.
6 7.4
5 BI
SCU
ITS
4.9
6.4
6 BR
OW
N, G
RAN
ARY
AND
WH
EATG
ERM
BRE
AD
4.7
6.1
7 BO
ILED
, MAS
HED
AN
D B
AKED
PO
TATO
ES A
ND
DIS
HES
4.
1 5.
4
8 O
THER
BRE
AKFA
ST C
EREA
LS (N
OT
HIG
H F
IBRE
)b 3.
5 4.
6
9 W
HO
LEM
EAL
BREA
D
3.2
4.2
10
RICE
AN
D R
ICE
BASE
D D
ISH
ES (I
NCL
UD
ING
RIS
OTT
O, F
RIED
RIC
E)
3.2
4.2
11 CR
ISPS
AN
D S
AVO
URY
SN
ACKS
3.
2 4.
1
12
VEG
ETAB
LES
AND
VEG
ETAB
LE B
ASED
DIS
HES
2.
7 3.
5
13
BUN
S, C
AKES
AN
D P
ASTR
IES
2.0
2.7
14
OTH
ER C
EREA
LSc
1.8
2.3
15
PIZZ
A 1.6
2.
1
16
WH
ITE
FISH
CO
ATED
OR
FRIE
D
1.4
1.8
17
SAU
SAG
ES A
ND
SAU
SAG
E BA
SED
DIS
HES
1.0
1.3
18
COAT
ED C
HIC
KEN
AN
D T
URK
EY P
ROD
UCT
S 1.0
1.2
19
MEA
T PI
ES A
ND
PAS
TRIE
S 0.
9 1.2
20
FRU
IT
0.8
1.1
a H
igh
fibre
bre
akfa
st c
erea
ls: N
SP c
onte
nt o
f 4g/
100g
or m
ore.
Incl
udes
mue
sli,
shre
dded
whe
at, p
orrid
geb
Oth
er b
reak
fast
cer
eals
, not
hig
h fib
re: N
SP c
onte
nt o
f les
s th
an 4
g/10
0g. I
nclu
des
corn
flake
s, su
gar p
uffs
Oth
er c
erea
ls: I
nclu
des
flour
(not
rice
flou
r), c
ous
cous
, bra
n, o
ats,
sem
olin
a, p
apad
ums,
dum
plin
gs, Y
orks
hire
pud
ding
290
c
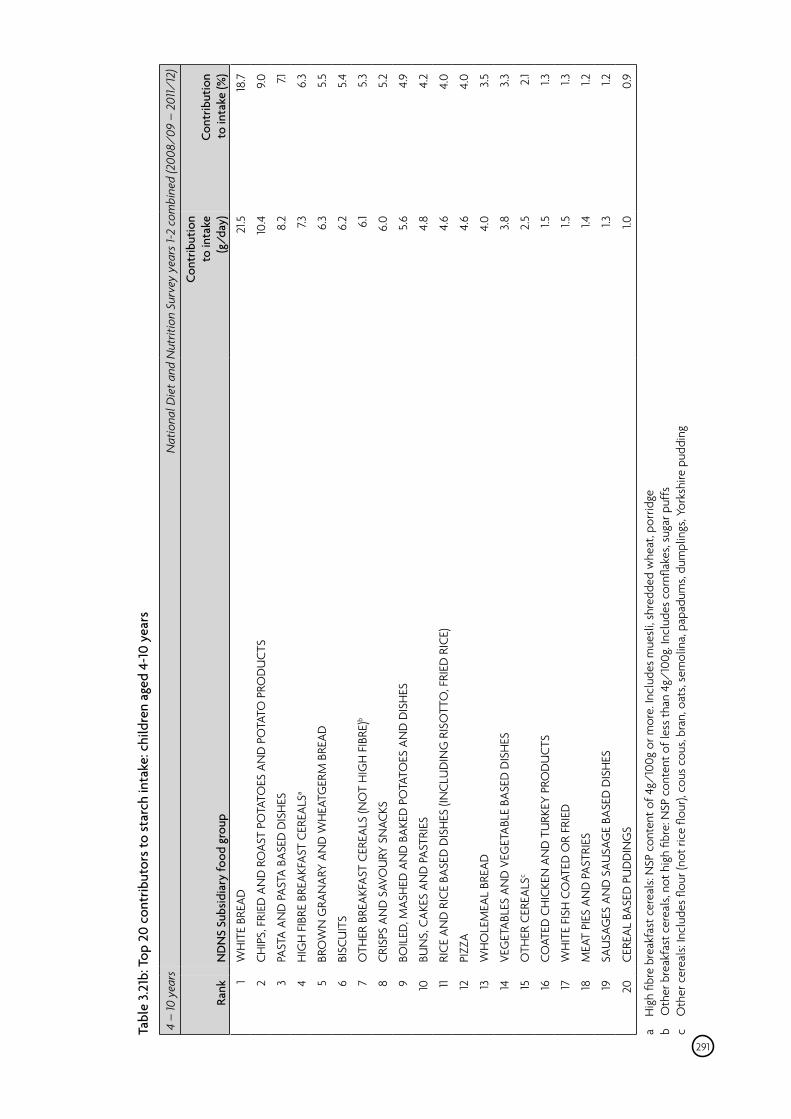
Tabl
e 3.
21b:
Top
20
cont
ribut
ors t
o st
arch
inta
ke: c
hild
ren
aged
4-1
0 ye
ars
4 –
10 y
ears
N
atio
nal D
iet a
nd N
utrit
ion
Surv
ey y
ears
1-2
com
bine
d (2
008/
09 –
201
1/12
)
Rank
N
DN
S Su
bsid
iary
food
gro
up
Cont
ribut
ion
to in
take
(g
/day
) Co
ntrib
utio
n to
inta
ke (%
) 1
WH
ITE
BREA
D
21.5
18
.7
2 CH
IPS,
FRI
ED A
ND
RO
AST
POTA
TOES
AN
D P
OTA
TO P
ROD
UCT
S 10
.4
9.0
3 PA
STA
AND
PAS
TA B
ASED
DIS
HES
8.
2 7.1
4 H
IGH
FIB
RE B
REAK
FAST
CER
EALS
a 7.3
6.
3
5 BR
OW
N G
RAN
ARY
AND
WH
EATG
ERM
BRE
AD
6.3
5.5
6 BI
SCU
ITS
6.2
5.4
7 O
THER
BRE
AKFA
ST C
EREA
LS (N
OT
HIG
H F
IBRE
)b 6.
1 5.
3
8 CR
ISPS
AN
D S
AVO
URY
SN
ACKS
6.
0 5.
2
9 BO
ILED
, MAS
HED
AN
D B
AKED
PO
TATO
ES A
ND
DIS
HES
5.
6 4.
9
10
BUN
S, C
AKES
AN
D P
ASTR
IES
4.8
4.2
11 RI
CE A
ND
RIC
E BA
SED
DIS
HES
(IN
CLU
DIN
G R
ISO
TTO
, FRI
ED R
ICE)
4.
6 4.
0
12
PIZZ
A 4.
6 4.
0
13
WH
OLE
MEA
L BR
EAD
4.
0 3.
5
14
VEG
ETAB
LES
AND
VEG
ETAB
LE B
ASED
DIS
HES
3.
8 3.
3
15
OTH
ER C
EREA
LSc
2.5
2.1
16
COAT
ED C
HIC
KEN
AN
D T
URK
EY P
ROD
UCT
S 1.5
1.3
17
WH
ITE
FISH
CO
ATED
OR
FRIE
D
1.5
1.3
18
MEA
T PI
ES A
ND
PAS
TRIE
S 1.4
1.2
19
SAU
SAG
ES A
ND
SAU
SAG
E BA
SED
DIS
HES
1.3
1.2
20
CERE
AL B
ASED
PU
DD
ING
S 1.0
0.
9
a H
igh
fibre
bre
akfa
st c
erea
ls: N
SP c
onte
nt o
f 4g/
100g
or m
ore.
Incl
udes
mue
sli,
shre
dded
whe
at, p
orrid
geb
Oth
er b
reak
fast
cer
eals
, not
hig
h fib
re: N
SP c
onte
nt o
f les
s th
an 4
g/10
0g. I
nclu
des
corn
flake
s, su
gar p
uffs
Oth
er c
erea
ls: I
nclu
des
flour
(not
rice
flou
r), c
ous
cous
, bra
n, o
ats,
sem
olin
a, p
apad
ums,
dum
plin
gs, Y
orks
hire
pud
ding
291
c
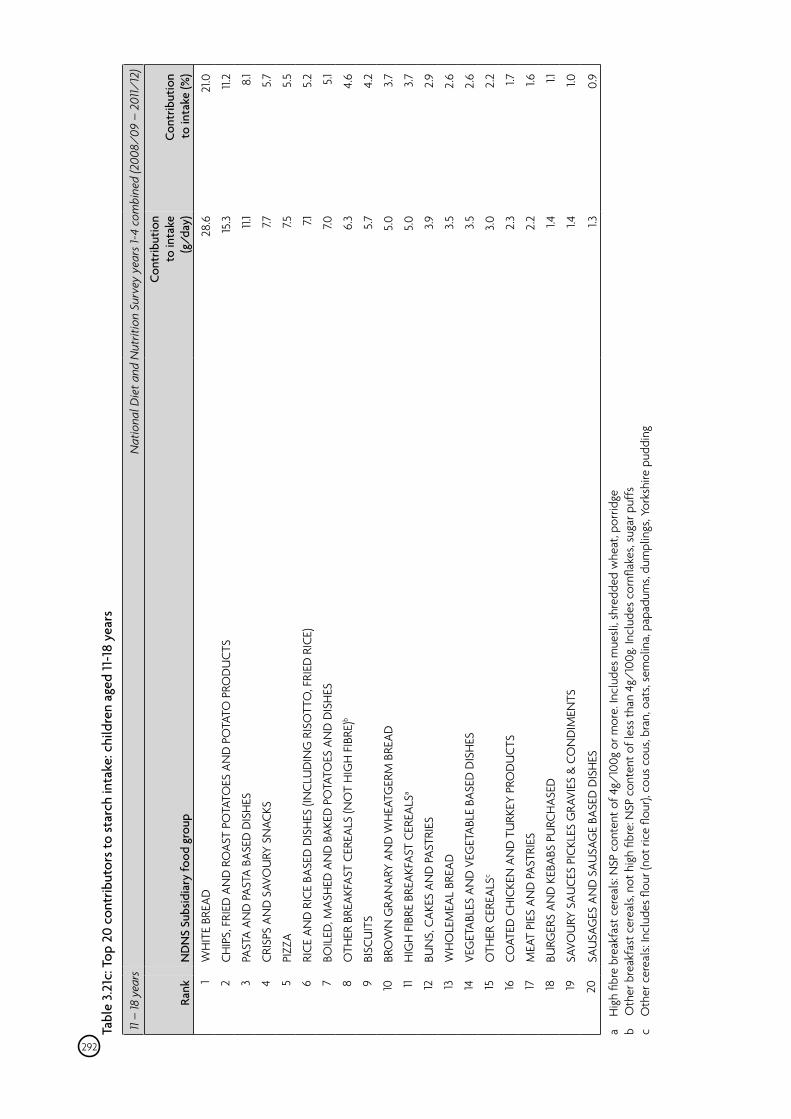
Tabl
e 3.
21c:
Top
20
cont
ribut
ors t
o st
arch
inta
ke: c
hild
ren
aged
11-1
8 ye
ars
11 –
18 y
ears
N
atio
nal D
iet a
nd N
utrit
ion
Surv
ey y
ears
1-4
com
bine
d (2
008/
09 –
201
1/12
)
Rank
N
DN
S Su
bsid
iary
food
gro
up
Cont
ribut
ion
to in
take
(g
/day
) Co
ntrib
utio
n to
inta
ke (%
)
1 W
HIT
E BR
EAD
28
.6
21.0
2 CH
IPS,
FRI
ED A
ND
RO
AST
POTA
TOES
AN
D P
OTA
TO P
ROD
UCT
S 15
.3
11.2
3 PA
STA
AND
PAS
TA B
ASED
DIS
HES
11.
1 8.
1
4 CR
ISPS
AN
D S
AVO
URY
SN
ACKS
7.7
5.
7
5 PI
ZZA
7.5
5.5
6 RI
CE A
ND
RIC
E BA
SED
DIS
HES
(IN
CLU
DIN
G R
ISO
TTO
, FRI
ED R
ICE)
7.1
5.
2
7 BO
ILED
, MAS
HED
AN
D B
AKED
PO
TATO
ES A
ND
DIS
HES
7.0
5.1
8 O
THER
BRE
AKFA
ST C
EREA
LS (N
OT
HIG
H F
IBRE
)b 6.
3 4.
6
9 BI
SCU
ITS
5.7
4.2
10
BRO
WN
GRA
NAR
Y AN
D W
HEA
TGER
M B
READ
5.
0 3.7
11 H
IGH
FIB
RE B
REAK
FAST
CER
EALS
a 5.
0 3.7
12
BUN
S, C
AKES
AN
D P
ASTR
IES
3.9
2.9
13
WH
OLE
MEA
L BR
EAD
3.
5 2.
6
14
VEG
ETAB
LES
AND
VEG
ETAB
LE B
ASED
DIS
HES
3.
5 2.
6
15
OTH
ER C
EREA
LSc
3.0
2.2
16
COAT
ED C
HIC
KEN
AN
D T
URK
EY P
ROD
UCT
S 2.
3 1.7
17
MEA
T PI
ES A
ND
PAS
TRIE
S 2.
2 1.6
18
BURG
ERS
AND
KEB
ABS
PURC
HAS
ED
1.4
1.1
19
SAVO
URY
SAU
CES
PICK
LES
GRA
VIES
& C
ON
DIM
ENTS
1.4
1.0
20
SAU
SAG
ES A
ND
SAU
SAG
E BA
SED
DIS
HES
1.3
0.
9
a H
igh
fibre
bre
akfa
st c
erea
ls: N
SP c
onte
nt o
f 4g/
100g
or m
ore.
Incl
udes
mue
sli,
shre
dded
whe
at, p
orrid
geb
Oth
er b
reak
fast
cer
eals
, not
hig
h fib
re: N
SP c
onte
nt o
f les
s th
an 4
g/10
0g. I
nclu
des
corn
flake
s, su
gar p
uffs
Oth
er c
erea
ls: I
nclu
des
flour
(not
rice
flou
r), c
ous
cous
, bra
n, o
ats,
sem
olin
a, p
apad
ums,
dum
plin
gs, Y
orks
hire
pud
ding
292
c
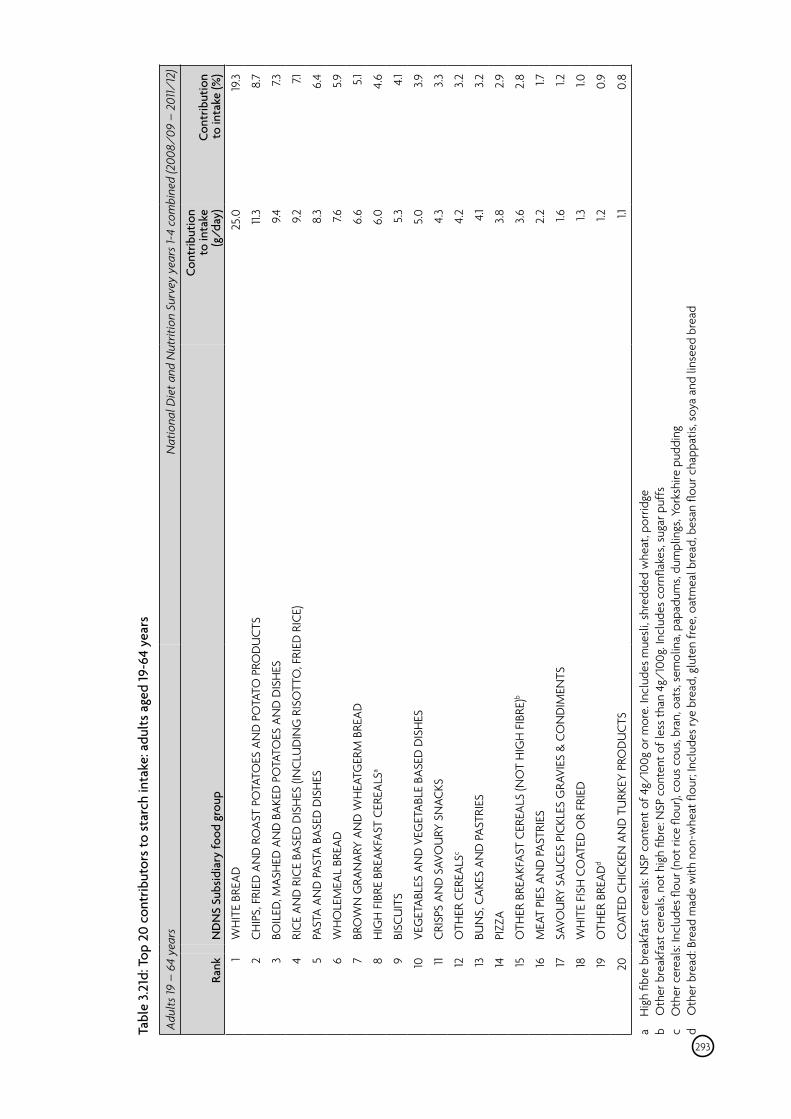
Tabl
e 3.
21d:
Top
20
cont
ribut
ors t
o st
arch
inta
ke: a
dult
s age
d 19
-64
year
s
Adul
ts 19
– 6
4 ye
ars
Nat
iona
l Die
t and
Nut
ritio
n Su
rvey
yea
rs 1-
4 co
mbi
ned
(200
8/09
– 2
011/
12)
Rank
N
DN
S Su
bsid
iary
food
gro
up
Cont
ribut
ion
to in
take
(g
/day
) Co
ntrib
utio
n to
inta
ke (%
) 1
WH
ITE
BREA
D
25.0
19
.3
2 CH
IPS,
FRI
ED A
ND
RO
AST
POTA
TOES
AN
D P
OTA
TO P
ROD
UCT
S 11.
3 8.
7
3 BO
ILED
, MAS
HED
AN
D B
AKED
PO
TATO
ES A
ND
DIS
HES
9.
4 7.3
4 RI
CE A
ND
RIC
E BA
SED
DIS
HES
(IN
CLU
DIN
G R
ISO
TTO
, FRI
ED R
ICE)
9.
2 7.1
5 PA
STA
AND
PAS
TA B
ASED
DIS
HES
8.
3 6.
4
6 W
HO
LEM
EAL
BREA
D
7.6
5.9
7 BR
OW
N G
RAN
ARY
AND
WH
EATG
ERM
BRE
AD
6.6
5.1
8 H
IGH
FIB
RE B
REAK
FAST
CER
EALS
a 6.
0 4.
6
9 BI
SCU
ITS
5.3
4.1
10
VEG
ETAB
LES
AND
VEG
ETAB
LE B
ASED
DIS
HES
5.
0 3.9
11 CR
ISPS
AN
D S
AVO
URY
SN
ACKS
4.
3 3.
3
12
OTH
ER C
EREA
LSc
4.2
3.2
13
BUN
S, C
AKES
AN
D P
ASTR
IES
4.1
3.2
14
PIZZ
A 3.
8 2.
9
15
OTH
ER B
REAK
FAST
CER
EALS
(NO
T H
IGH
FIB
RE)b
3.6
2.8
16
MEA
T PI
ES A
ND
PAS
TRIE
S 2.
2 1.7
17
SAVO
URY
SAU
CES
PICK
LES
GRA
VIES
& C
ON
DIM
ENTS
1.6
1.2
18
WH
ITE
FISH
CO
ATED
OR
FRIE
D
1.3
1.0
19
OTH
ER B
READ
d 1.2
0.
9
20
COAT
ED C
HIC
KEN
AN
D T
URK
EY P
ROD
UCT
S 1.1
0.
8
a H
igh
fibre
bre
akfa
st c
erea
ls: N
SP c
onte
nt o
f 4g/
100g
or m
ore.
Incl
udes
mue
sli,
shre
dded
whe
at, p
orrid
geb
Oth
er b
reak
fast
cer
eals
, not
hig
h fib
re: N
SP c
onte
nt o
f les
s th
an 4
g/10
0g. I
nclu
des
corn
flake
s, su
gar p
uffs
Oth
er c
erea
ls: I
nclu
des
flour
(not
rice
flou
r), c
ous
cous
, bra
n, o
ats,
sem
olin
a, p
apad
ums,
dum
plin
gs, Y
orks
hire
pud
ding
d O
ther
bre
ad: B
read
mad
e w
ith n
on-w
heat
flou
r; In
clud
es ry
e br
ead,
glu
ten
free
, oat
mea
l bre
ad, b
esan
flou
r cha
ppat
is, s
oya
and
linse
ed b
read
293
c
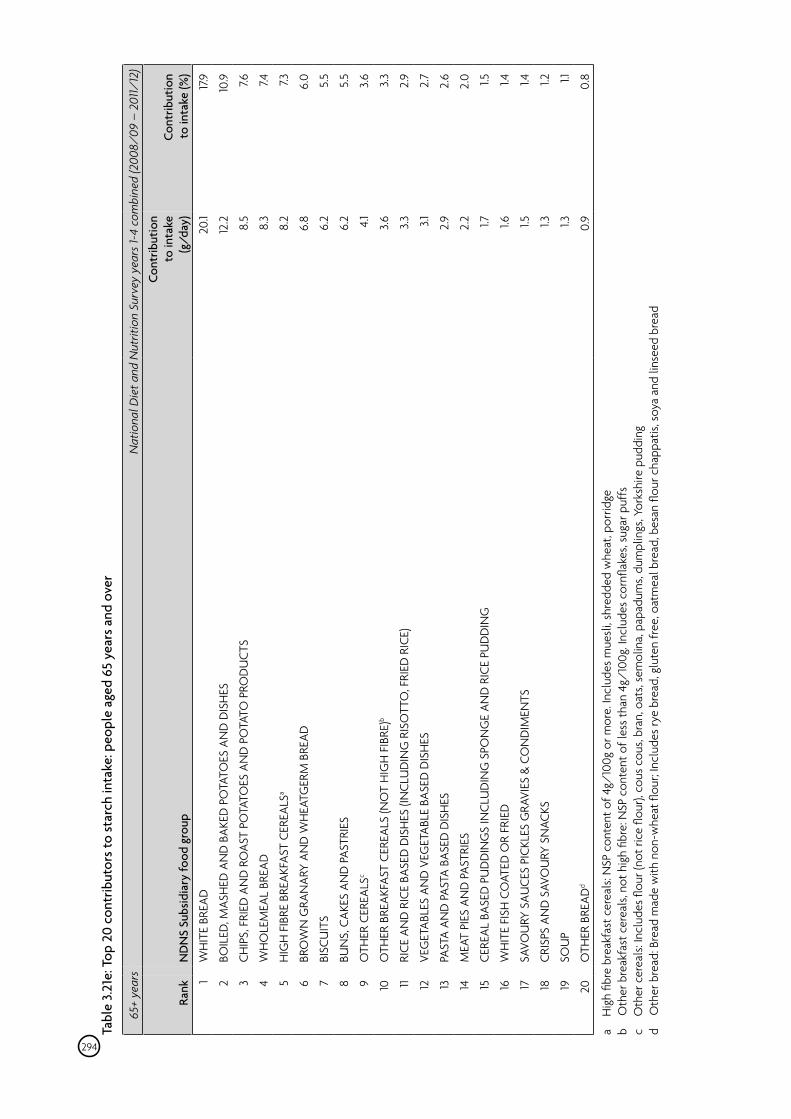
Tabl
e 3.
21e:
Top
20
cont
ribut
ors t
o st
arch
inta
ke: p
eopl
e ag
ed 6
5 ye
ars a
nd o
ver
65+
year
s N
atio
nal D
iet a
nd N
utrit
ion
Surv
ey y
ears
1-4
com
bine
d (2
008/
09 –
201
1/12
)
Rank
N
DN
S Su
bsid
iary
food
gro
up
Cont
ribut
ion
to in
take
(g
/day
) Co
ntrib
utio
n to
inta
ke (%
)
1 W
HIT
E BR
EAD
20
.1 17
.9
2 BO
ILED
, MAS
HED
AN
D B
AKED
PO
TATO
ES A
ND
DIS
HES
12
.2
10.9
3 CH
IPS,
FRI
ED A
ND
RO
AST
POTA
TOES
AN
D P
OTA
TO P
ROD
UCT
S 8.
5 7.6
4 W
HO
LEM
EAL
BREA
D
8.3
7.4
5 H
IGH
FIB
RE B
REAK
FAST
CER
EALS
a 8.
2 7.3
6 BR
OW
N G
RAN
ARY
AND
WH
EATG
ERM
BRE
AD
6.8
6.0
7 BI
SCU
ITS
6.2
5.5
8 BU
NS,
CAK
ES A
ND
PAS
TRIE
S 6.
2 5.
5
9 O
THER
CER
EALS
c 4.
1 3.
6
10
OTH
ER B
REAK
FAST
CER
EALS
(NO
T H
IGH
FIB
RE)b
3.6
3.3
11 RI
CE A
ND
RIC
E BA
SED
DIS
HES
(IN
CLU
DIN
G R
ISO
TTO
, FRI
ED R
ICE)
3.
3 2.
9
12
VEG
ETAB
LES
AND
VEG
ETAB
LE B
ASED
DIS
HES
3.1
2.
7
13
PAST
A AN
D P
ASTA
BAS
ED D
ISH
ES
2.9
2.6
14
MEA
T PI
ES A
ND
PAS
TRIE
S 2.
2 2.
0
15
CERE
AL B
ASED
PU
DD
ING
S IN
CLU
DIN
G S
PON
GE
AND
RIC
E PU
DD
ING
1.7
1.5
16
WH
ITE
FISH
CO
ATED
OR
FRIE
D
1.6
1.4
17
SAVO
URY
SAU
CES
PICK
LES
GRA
VIES
& C
ON
DIM
ENTS
1.5
1.4
18
CRIS
PS A
ND
SAV
OU
RY S
NAC
KS
1.3
1.2
19
SOU
P 1.3
1.1
20
OTH
ER B
READ
d 0.
9 0.
8
a H
igh
fibre
bre
akfa
st c
erea
ls: N
SP c
onte
nt o
f 4g/
100g
or m
ore.
Incl
udes
mue
sli,
shre
dded
whe
at, p
orrid
geb
Oth
er b
reak
fast
cer
eals
, not
hig
h fib
re: N
SP c
onte
nt o
f les
s th
an 4
g/10
0g. I
nclu
des
corn
flake
s, su
gar p
uffs
Oth
er c
erea
ls: I
nclu
des
flour
(not
rice
flou
r), c
ous
cous
, bra
n, o
ats,
sem
olin
a, p
apad
ums,
dum
plin
gs, Y
orks
hire
pud
ding
d O
ther
bre
ad: B
read
mad
e w
ith n
on-w
heat
flou
r; In
clud
es ry
e br
ead,
glu
ten
free
, oat
mea
l bre
ad, b
esan
flou
r cha
ppat
is, s
oya
and
linse
ed b
read
294
c
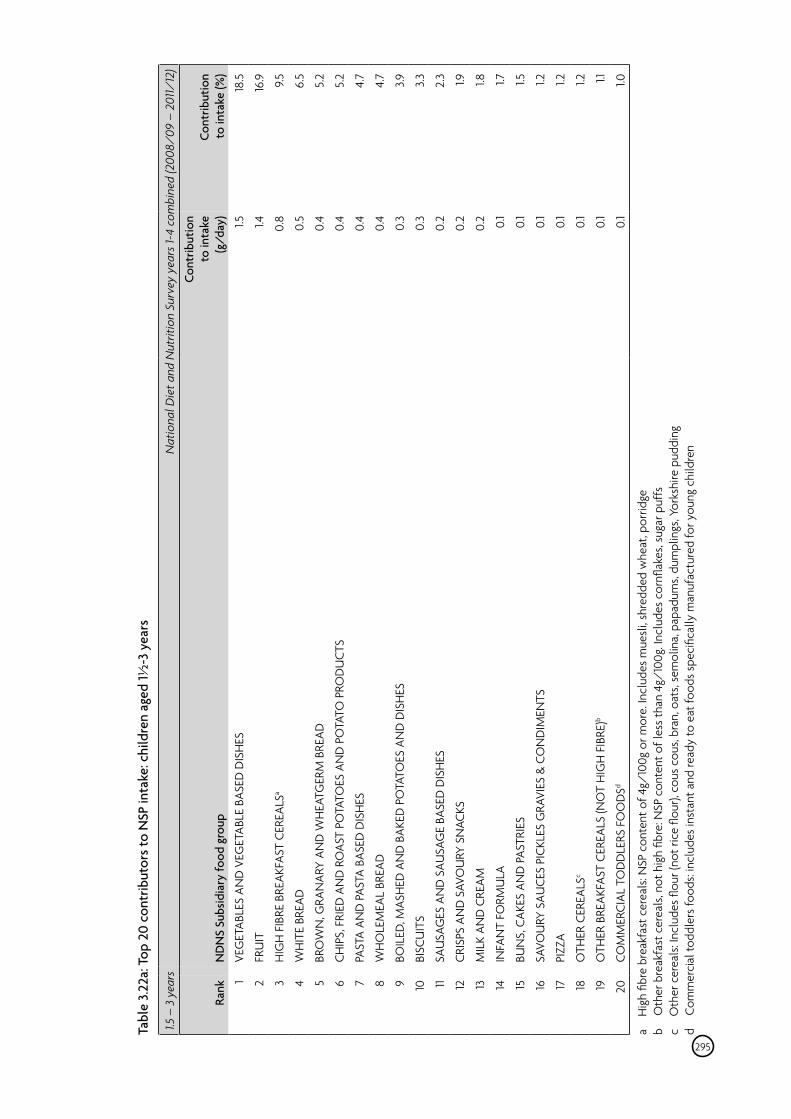
Tabl
e 3.
22a:
Top
20
cont
ribut
ors t
o N
SP in
take
: chi
ldre
n ag
ed 1½
-3 y
ears
1.5 –
3 y
ears
N
atio
nal D
iet a
nd N
utrit
ion
Surv
ey y
ears
1-4
com
bine
d (2
008/
09 –
201
1/12
)
Rank
N
DN
S Su
bsid
iary
food
gro
up
Co
ntrib
utio
n to
inta
ke
(g/d
ay)
Co
ntrib
utio
n to
inta
ke (%
) 1 2 3 4 5 6 7 8 9 10 11 12
13
14
15
16
17
18
19
20
VEG
ETAB
LES
AND
VEG
ETAB
LE B
ASED
DIS
HES
FRU
IT
HIG
H F
IBRE
BRE
AKFA
ST C
EREA
LSa
WH
ITE
BREA
D
BRO
WN
, GRA
NAR
Y AN
D W
HEA
TGER
M B
READ
CHIP
S, F
RIED
AN
D R
OAS
T PO
TATO
ES A
ND
PO
TATO
PRO
DU
CTS
PAST
A AN
D P
ASTA
BAS
ED D
ISH
ES
WH
OLE
MEA
L BR
EAD
BOIL
ED, M
ASH
ED A
ND
BAK
ED P
OTA
TOES
AN
D D
ISH
ES
BISC
UIT
S
SAU
SAG
ES A
ND
SAU
SAG
E BA
SED
DIS
HES
CRIS
PS A
ND
SAV
OU
RY S
NAC
KS
MIL
K AN
D C
REAM
INFA
NT
FORM
ULA
BUN
S, C
AKES
AN
D P
ASTR
IES
SAVO
URY
SAU
CES
PICK
LES
GRA
VIES
& C
ON
DIM
ENTS
PIZZ
A
OTH
ER C
EREA
LSc
OTH
ER B
REAK
FAST
CER
EALS
(NO
T H
IGH
FIB
RE)b
COM
MER
CIAL
TO
DD
LERS
FO
OD
Sd
1.5
1.4
0.8
0.5
0.4
0.4
0.4
0.4
0.3
0.3
0.2
0.2
0.2 0.1
0.1
0.1
0.1
0.1
0.1
0.1
18.5
16.9
9.5
6.5
5.2
5.2
4.7
4.7
3.9
3.3
2.3 1.9
1.8
1.7
1.5
1.2
1.2
1.2
1.1
1.0
a H
igh
fibre
bre
akfa
st c
erea
ls: N
SP c
onte
nt o
f 4g/
100g
or m
ore.
Incl
udes
mue
sli,
shre
dded
whe
at, p
orrid
geb
Oth
er b
reak
fast
cer
eals
, not
hig
h fib
re: N
SP c
onte
nt o
f les
s th
an 4
g/10
0g. I
nclu
des
corn
flake
s, su
gar p
uffs
c O
ther
cer
eals
: Inc
lude
s flo
ur (n
ot ri
ce fl
our),
cou
s co
us, b
ran,
oat
s, se
mol
ina,
pap
adum
s, du
mpl
ings
, Yor
kshi
re p
uddi
ngd
Com
mer
cial
todd
lers
food
s: in
clud
es in
stan
t and
read
y to
eat
food
s sp
ecifi
cally
man
ufac
ture
d fo
r you
ng c
hild
ren
295
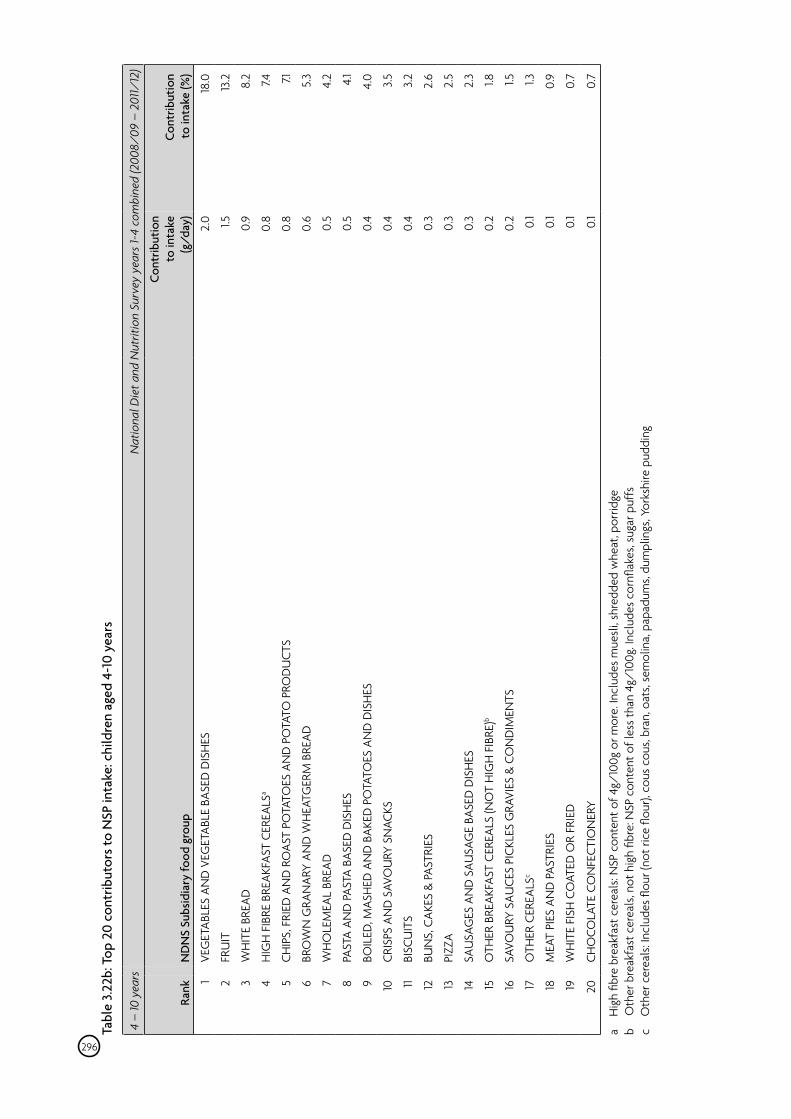
Tabl
e 3.
22b:
Top
20
cont
ribut
ors t
o N
SP in
take
: chi
ldre
n ag
ed 4
-10
year
s
4 –
10 y
ears
N
atio
nal D
iet a
nd N
utrit
ion
Surv
ey y
ears
1-4
com
bine
d (2
008/
09 –
201
1/12
)
Rank
N
DN
S Su
bsid
iary
food
gro
up
Cont
ribut
ion
to in
take
(g
/day
) Co
ntrib
utio
n to
inta
ke (%
)
1 VE
GET
ABLE
S AN
D V
EGET
ABLE
BAS
ED D
ISH
ES
2.0
18.0
2 FR
UIT
1.5
13
.2
3 W
HIT
E BR
EAD
0.
9 8.
2
4 H
IGH
FIB
RE B
REAK
FAST
CER
EALS
a 0.
8 7.4
5 CH
IPS,
FRI
ED A
ND
RO
AST
POTA
TOES
AN
D P
OTA
TO P
ROD
UCT
S 0.
8 7.1
6 BR
OW
N G
RAN
ARY
AND
WH
EATG
ERM
BRE
AD
0.6
5.3
7 W
HO
LEM
EAL
BREA
D
0.5
4.2
8 PA
STA
AND
PAS
TA B
ASED
DIS
HES
0.
5 4.
1
9 BO
ILED
, MAS
HED
AN
D B
AKED
PO
TATO
ES A
ND
DIS
HES
0.
4 4.
0
10
CRIS
PS A
ND
SAV
OU
RY S
NAC
KS
0.4
3.5
11 BI
SCU
ITS
0.4
3.2
12
BUN
S, C
AKES
& P
ASTR
IES
0.3
2.6
13
PIZZ
A 0.
3 2.
5
14
SAU
SAG
ES A
ND
SAU
SAG
E BA
SED
DIS
HES
0.
3 2.
3
15
OTH
ER B
REAK
FAST
CER
EALS
(NO
T H
IGH
FIB
RE)b
0.2
1.8
16
SAVO
URY
SAU
CES
PICK
LES
GRA
VIES
& C
ON
DIM
ENTS
0.
2 1.5
17
OTH
ER C
EREA
LSc
0.1
1.3
18
MEA
T PI
ES A
ND
PAS
TRIE
S 0.
1 0.
9
19
WH
ITE
FISH
CO
ATED
OR
FRIE
D
0.1
0.7
20
CHO
COLA
TE C
ON
FECT
ION
ERY
0.1
0.7
a H
igh
fibre
bre
akfa
st c
erea
ls: N
SP c
onte
nt o
f 4g/
100g
or m
ore.
Incl
udes
mue
sli,
shre
dded
whe
at, p
orrid
geb
Oth
er b
reak
fast
cer
eals
, not
hig
h fib
re: N
SP c
onte
nt o
f les
s th
an 4
g/10
0g. I
nclu
des
corn
flake
s, su
gar p
uffs
Oth
er c
erea
ls: I
nclu
des
flour
(not
rice
flou
r), c
ous
cous
, bra
n, o
ats,
sem
olin
a, p
apad
ums,
dum
plin
gs, Y
orks
hire
pud
ding
296
c
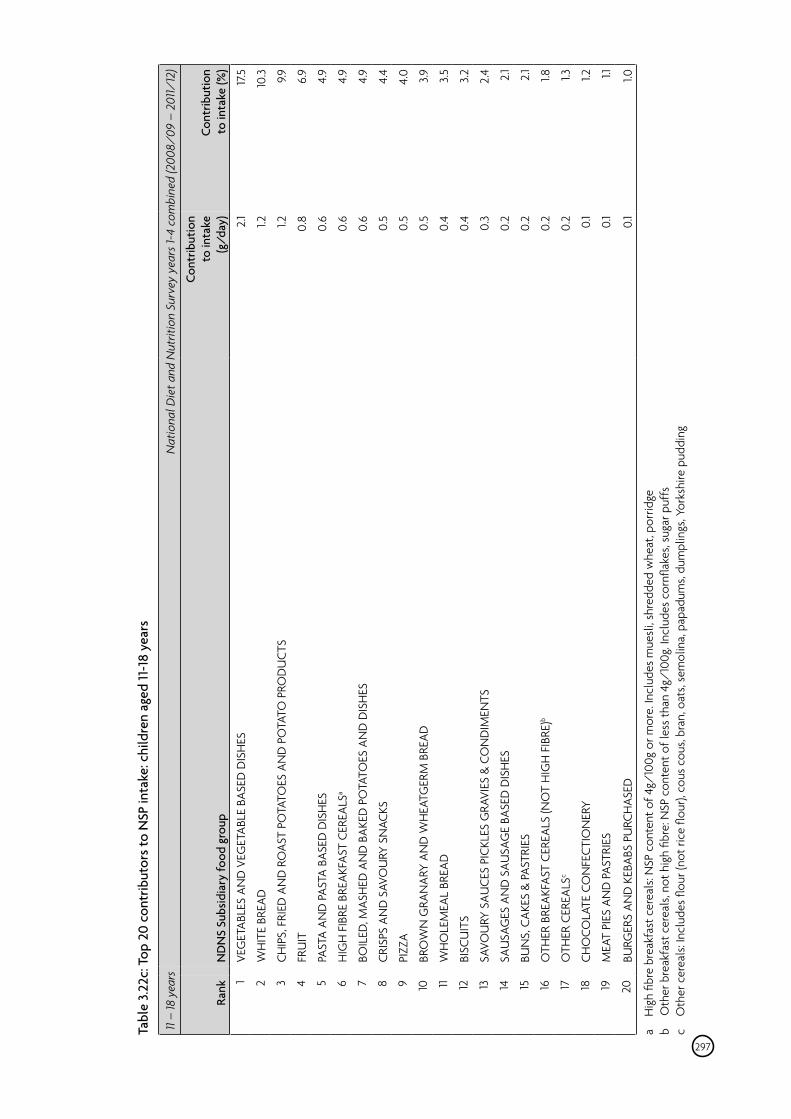
Tabl
e 3.
22c:
Top
20
cont
ribut
ors t
o N
SP in
take
: chi
ldre
n ag
ed 11
-18
year
s
11 –
18 y
ears
N
atio
nal D
iet a
nd N
utrit
ion
Surv
ey y
ears
1-4
com
bine
d (2
008/
09 –
201
1/12
)
Rank
N
DN
S Su
bsid
iary
food
gro
up
Cont
ribut
ion
to in
take
(g
/day
) Co
ntrib
utio
n to
inta
ke (%
) 1
VEG
ETAB
LES
AND
VEG
ETAB
LE B
ASED
DIS
HES
2.
1 17
.5
2 W
HIT
E BR
EAD
1.2
10
.3
3 CH
IPS,
FRI
ED A
ND
RO
AST
POTA
TOES
AN
D P
OTA
TO P
ROD
UCT
S 1.2
9.9
4 FR
UIT
0.
8 6.
9
5 PA
STA
AND
PAS
TA B
ASED
DIS
HES
0.
6 4.
9
6 H
IGH
FIB
RE B
REAK
FAST
CER
EALS
a 0.
6 4.
9
7 BO
ILED
, MAS
HED
AN
D B
AKED
PO
TATO
ES A
ND
DIS
HES
0.
6 4.
9
8 CR
ISPS
AN
D S
AVO
URY
SN
ACKS
0.
5 4.
4
9 PI
ZZA
0.5
4.0
10
BRO
WN
GRA
NAR
Y AN
D W
HEA
TGER
M B
READ
0.
5 3.9
11 W
HO
LEM
EAL
BREA
D
0.4
3.5
12
BISC
UIT
S 0.
4 3.
2
13
SAVO
URY
SAU
CES
PICK
LES
GRA
VIES
& C
ON
DIM
ENTS
0.
3 2.
4
14
SAU
SAG
ES A
ND
SAU
SAG
E BA
SED
DIS
HES
0.
2 2.
1
15
BUN
S, C
AKES
& P
ASTR
IES
0.2
2.1
16
OTH
ER B
REAK
FAST
CER
EALS
(NO
T H
IGH
FIB
RE)b
0.2
1.8
17
OTH
ER C
EREA
LSc
0.2
1.3
18
CHO
COLA
TE C
ON
FECT
ION
ERY
0.1
1.2
19
MEA
T PI
ES A
ND
PAS
TRIE
S 0.
1 1.1
20
BURG
ERS
AND
KEB
ABS
PURC
HAS
ED
0.1
1.0
a H
igh
fibre
bre
akfa
st c
erea
ls: N
SP c
onte
nt o
f 4g/
100g
or m
ore.
Incl
udes
mue
sli,
shre
dded
whe
at, p
orrid
geb
Oth
er b
reak
fast
cer
eals
, not
hig
h fib
re: N
SP c
onte
nt o
f les
s th
an 4
g/10
0g. I
nclu
des
corn
flake
s, su
gar p
uffs
Oth
er c
erea
ls: I
nclu
des
flour
(not
rice
flou
r), c
ous
cous
, bra
n, o
ats,
sem
olin
a, p
apad
ums,
dum
plin
gs, Y
orks
hire
pud
ding
297
c
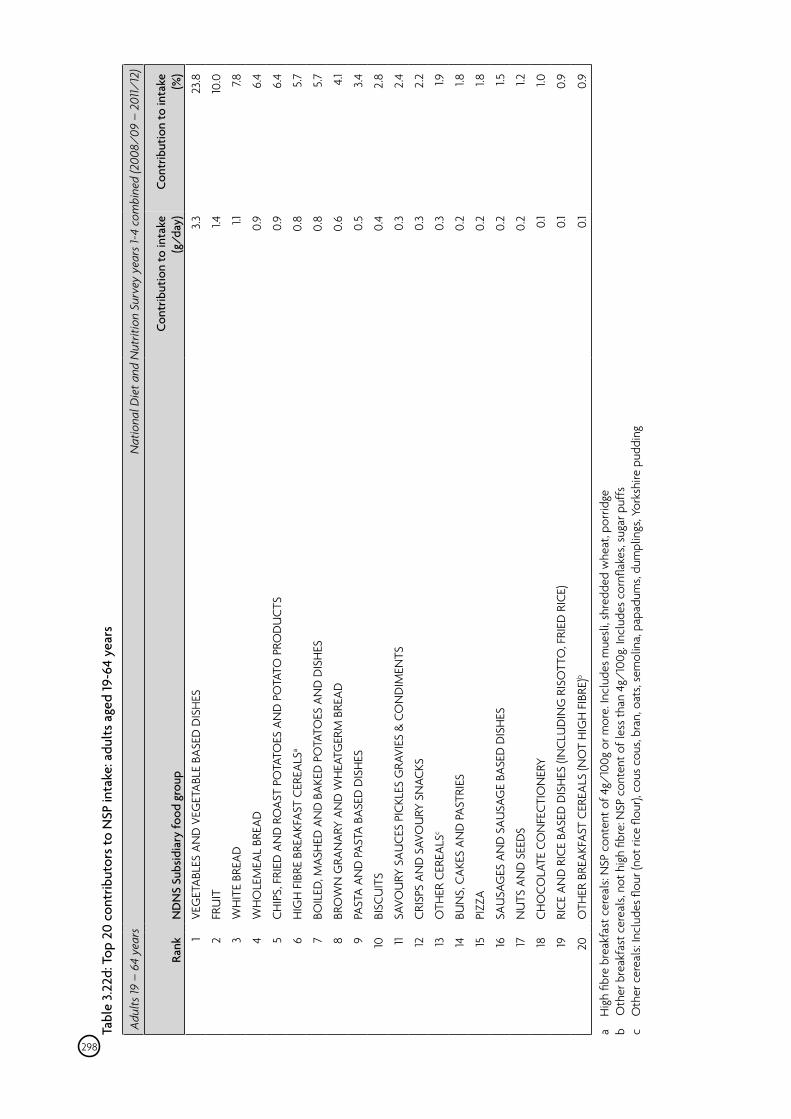
Tabl
e 3.
22d:
Top
20
cont
ribut
ors t
o N
SP in
take
: adu
lts a
ged
19-6
4 ye
ars
Adul
ts 19
– 6
4 ye
ars
Nat
iona
l Die
t and
Nut
ritio
n Su
rvey
yea
rs 1-
4 co
mbi
ned
(200
8/09
– 2
011/
12)
Rank
N
DN
S Su
bsid
iary
food
gro
up
Cont
ribut
ion
to in
take
(g
/day
) Co
ntrib
utio
n to
inta
ke
(%)
1 VE
GET
ABLE
S AN
D V
EGET
ABLE
BAS
ED D
ISH
ES
3.3
23.8
2 FR
UIT
1.4
10
.0
3 W
HIT
E BR
EAD
1.1
7.8
4 W
HO
LEM
EAL
BREA
D
0.9
6.4
5 CH
IPS,
FRI
ED A
ND
RO
AST
POTA
TOES
AN
D P
OTA
TO P
ROD
UCT
S 0.
9 6.
4
6 H
IGH
FIB
RE B
REAK
FAST
CER
EALS
a 0.
8 5.
7
7 BO
ILED
, MAS
HED
AN
D B
AKED
PO
TATO
ES A
ND
DIS
HES
0.
8 5.
7
8 BR
OW
N G
RAN
ARY
AND
WH
EATG
ERM
BRE
AD
0.6
4.1
9 PA
STA
AND
PAS
TA B
ASED
DIS
HES
0.
5 3.4
10
BISC
UIT
S 0.
4 2.
8
11 SA
VOU
RY S
AUCE
S PI
CKLE
S G
RAVI
ES &
CO
ND
IMEN
TS
0.3
2.4
12
CRIS
PS A
ND
SAV
OU
RY S
NAC
KS
0.3
2.2
13
OTH
ER C
EREA
LSc
0.3
1.9
14
BUN
S, C
AKES
AN
D P
ASTR
IES
0.2
1.8
15
PIZZ
A 0.
2 1.8
16
SAU
SAG
ES A
ND
SAU
SAG
E BA
SED
DIS
HES
0.
2 1.5
17
NU
TS A
ND
SEE
DS
0.2
1.2
18
CHO
COLA
TE C
ON
FECT
ION
ERY
0.1
1.0
19
RICE
AN
D R
ICE
BASE
D D
ISH
ES (I
NCL
UD
ING
RIS
OTT
O, F
RIED
RIC
E)
0.1
0.9
20
OTH
ER B
REAK
FAST
CER
EALS
(NO
T H
IGH
FIB
RE)b
0.1
0.9
a H
igh
fibre
bre
akfa
st c
erea
ls: N
SP c
onte
nt o
f 4g/
100g
or m
ore.
Incl
udes
mue
sli,
shre
dded
whe
at, p
orrid
geb
Oth
er b
reak
fast
cer
eals
, not
hig
h fib
re: N
SP c
onte
nt o
f les
s th
an 4
g/10
0g. I
nclu
des
corn
flake
s, su
gar p
uffs
Oth
er c
erea
ls: I
nclu
des
flour
(not
rice
flou
r), c
ous
cous
, bra
n, o
ats,
sem
olin
a, p
apad
ums,
dum
plin
gs, Y
orks
hire
pud
ding
298
c
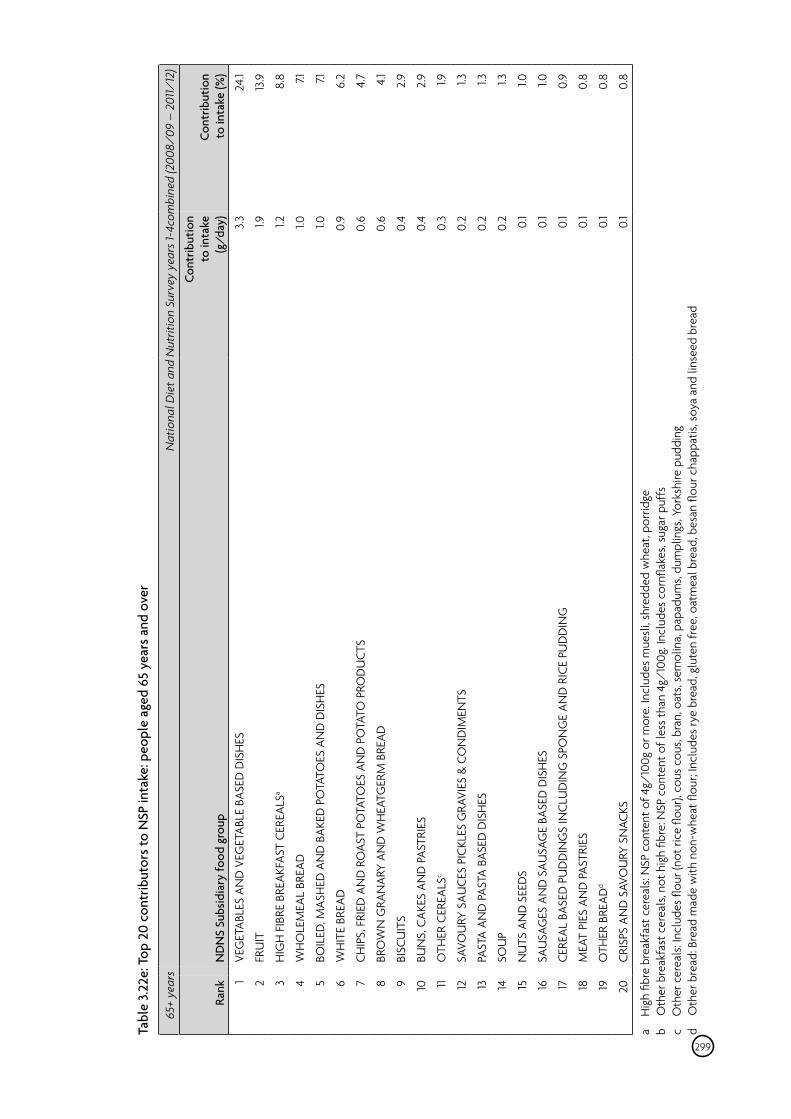
Tabl
e 3.
22e:
Top
20
cont
ribut
ors t
o N
SP in
take
: peo
ple
aged
65
year
s and
ove
r
65+
year
s N
atio
nal D
iet a
nd N
utrit
ion
Surv
ey y
ears
1-4c
ombi
ned
(200
8/09
– 2
011/
12)
Rank
N
DN
S Su
bsid
iary
food
gro
up
Cont
ribut
ion
to in
take
(g
/day
) Co
ntrib
utio
n to
inta
ke (%
) 1
VEG
ETAB
LES
AND
VEG
ETAB
LE B
ASED
DIS
HES
3.
3 24
.1
2 FR
UIT
1.9
13
.9
3 H
IGH
FIB
RE B
REAK
FAST
CER
EALS
a 1.2
8.
8
4 W
HO
LEM
EAL
BREA
D
1.0
7.1
5 BO
ILED
, MAS
HED
AN
D B
AKED
PO
TATO
ES A
ND
DIS
HES
1.0
7.1
6 W
HIT
E BR
EAD
0.
9 6.
2
7 CH
IPS,
FRI
ED A
ND
RO
AST
POTA
TOES
AN
D P
OTA
TO P
ROD
UCT
S 0.
6 4.
7
8 BR
OW
N G
RAN
ARY
AND
WH
EATG
ERM
BRE
AD
0.6
4.1
9 BI
SCU
ITS
0.4
2.9
10
BUN
S, C
AKES
AN
D P
ASTR
IES
0.4
2.9
11 O
THER
CER
EALS
c 0.
3 1.9
12
SAVO
URY
SAU
CES
PICK
LES
GRA
VIES
& C
ON
DIM
ENTS
0.
2 1.3
13
PAST
A AN
D P
ASTA
BAS
ED D
ISH
ES
0.2
1.3
14
SOU
P 0.
2 1.3
15
NU
TS A
ND
SEE
DS
0.1
1.0
16
SAU
SAG
ES A
ND
SAU
SAG
E BA
SED
DIS
HES
0.
1 1.0
17
CERE
AL B
ASED
PU
DD
ING
S IN
CLU
DIN
G S
PON
GE
AND
RIC
E PU
DD
ING
0.
1 0.
9
18
MEA
T PI
ES A
ND
PAS
TRIE
S 0.
1 0.
8
19
OTH
ER B
READ
d 0.
1 0.
8
20
CRIS
PS A
ND
SAV
OU
RY S
NAC
KS
0.1
0.8
a H
igh
fibre
bre
akfa
st c
erea
ls: N
SP c
onte
nt o
f 4g/
100g
or m
ore.
Incl
udes
mue
sli,
shre
dded
whe
at, p
orrid
geb
Oth
er b
reak
fast
cer
eals
, not
hig
h fib
re: N
SP c
onte
nt o
f les
s th
an 4
g/10
0g. I
nclu
des
corn
flake
s, su
gar p
uffs
Oth
er c
erea
ls: I
nclu
des
flour
(not
rice
flou
r), c
ous
cous
, bra
n, o
ats,
sem
olin
a, p
apad
ums,
dum
plin
gs, Y
orks
hire
pud
ding
d O
ther
bre
ad: B
read
mad
e w
ith n
on-w
heat
flou
r; In
clud
es ry
e br
ead,
glu
ten
free
, oat
mea
l bre
ad, b
esan
flou
r cha
ppat
is, s
oya
and
linse
ed b
read
299
c

Annex 9
Meta-analysis and meta-regression of trials that presented evidence on diets differing in the proportion of sugars in relation to total dietary energy intake
Figure A9.1: Randomised controlled trials investigating the effect of higher versus lower sugars consumption on energy intake using difference in end of intervention total dietary energy intakes, except for two trials where change from baseline values were reported (Saris et al., 2000) or computed (Drummond et al., 2003)
Favours higher sugar diet Favours lower sugar diet Difference in energy intake between groups (MJ/day)
BBeettwweeen en trtreaeattmmentsents
Trial WWeeiigghted hted ddiiffffeerreennccee iin sn sugugarars s
name ddiiffffeererennccee iin mn meaeanns s ((9595% % CCII) ) iinnttakake e ((%% eneenergrgyy))
Drummond & Kirk, 1998 00..885 (5 (--00..6644, , 22..3333) ) 2.5 2.5
Drummond et al., 2003 -0.-0.21 21 ((-1.-1.446, 6, 11..0404) ) 2.9 2.9
Reid et al., 2010 11..008 8 ((00..1212,, 22..0404)) 9.5 9.5
Saris et al., 2000 11..110 0 ((00..4040, , 11..8080)) 10.7 10.7
Aeberli et al., 2011 11..0077 ((--00..3333, , 22..4477) ) 11 11
Reid et al.,2014 11..110 0 ((00..0505, , 22..1414)) 12.912.9
Byrnes et al., 2003 00..888 (8 (--00..3322, , 22..0088) ) 13.3 13.3
Poppitt et al., 2002 11..447 (7 (--00..4499, , 33..4433) ) 13.6 13.6
Njike et al., 2011 00..8899 ((--00..1133, , 11..9900) ) 18.3 18.3
Raben et al., 2002 22..880 0 ((11..4545,, 44..1414) ) 1199
Reid et al., 2007 11..332 2 ((00..6868,, 11..9595)) 20.120.1
Overall (I-squared = 11.8%, p = 0.332) 11..111 1 ((00..7878, , 11..4545))
0-2 0 2 4
Results of meta-analysis for lower sugars diet vs. higher sugars diet and total dietary energy intake
Model Pooled risk ratio estimate1
No.2 MJ/day (95%CI) Z (p-value)
Random effect 11 1.11 (0.78-1.45) 6.50 (p<0.001)
1 I2 = 11.76 %; p for test of heterogeneity = 0.332 2 No. of mean difference estimates included in pooled analysis.
300
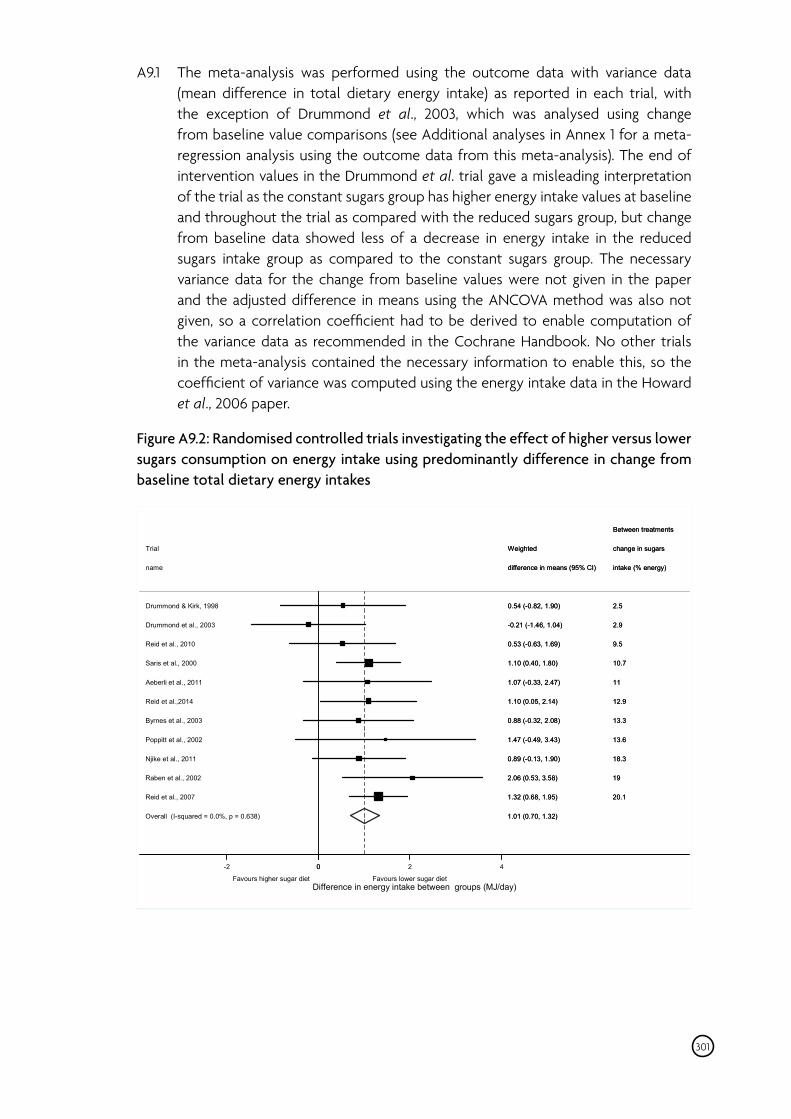
A9.1 The meta-analysis was performed using the outcome data with variance data (mean difference in total dietary energy intake) as reported in each trial, with the exception of Drummond et al., 2003, which was analysed using change from baseline value comparisons (see Additional analyses in Annex 1 for a meta-regression analysis using the outcome data from this meta-analysis). The end of intervention values in the Drummond et al. trial gave a misleading interpretation of the trial as the constant sugars group has higher energy intake values at baseline and throughout the trial as compared with the reduced sugars group, but change from baseline data showed less of a decrease in energy intake in the reduced sugars intake group as compared to the constant sugars group. The necessary variance data for the change from baseline values were not given in the paper and the adjusted difference in means using the ANCOVA method was also not given, so a correlation coefficient had to be derived to enable computation of the variance data as recommended in the Cochrane Handbook. No other trials in the meta-analysis contained the necessary information to enable this, so the coefficient of variance was computed using the energy intake data in the Howard et al., 2006 paper.
Figure A9.2: Randomised controlled trials investigating the effect of higher versus lower sugars consumption on energy intake using predominantly difference in change from baseline total dietary energy intakes
BeBettwweeeenn t trreaeattmmenenttss
Trial WWeieigghthted ed cchahangnge e iin n ssuuggaarrss
name didiffffeerreencnce ie in mn meeananss ((995% C5% CII) ) ininttaakkee (%(% enenerergy)gy)
Drummond & Kirk, 1998 00..554 4 (-(-0.0.8282,, 1.1.9090)) 22.5.5
Drummond et al., 2003 -0-0..221 (1 (--11..4466,, 1. 1.0404)) 22.9.9
Reid et al., 2010 00..553 3 (-(-0.0.6363, , 1.1.6969)) 99.5 .5
Saris et al., 2000 1.1.1010 ((0.0.4400,, 1. 1.8080) ) 110.0.77
Aeberli et al., 2011 11..007 7 (-(-0.0.3333, , 2.2.4747)) 1111
Reid et al.,2014 1.1.1010 ((0.0.0055,, 2. 2.1414) ) 112.2.9 9
Byrnes et al., 2003 00..888 8 (-(-0.0.3232,, 2.2.0808)) 113.3.3 3
Poppitt et al., 2002 11..447 7 (-(-0.0.4949, , 3.3.4343)) 113.3.6 6
Njike et al., 2011 00..889 9 (-(-0.0.1313, , 1.1.9090)) 118.8.33
Raben et al., 2002 2.2.0606 ((0.0.5533,, 3. 3.5858) ) 19 19
Reid et al., 2007 1.1.3232 ((0.0.6688,, 1. 1.9595) ) 220.0.1 1
Overall (I-squared = 0.0%, p = 0.638) 1.1.0101 ((0.0.7700,, 1. 1.3232) )
-2 00 2 4
Favours higher sugar diet Favours lower sugar diet Difference in energy intake between groups (MJ/day)
301
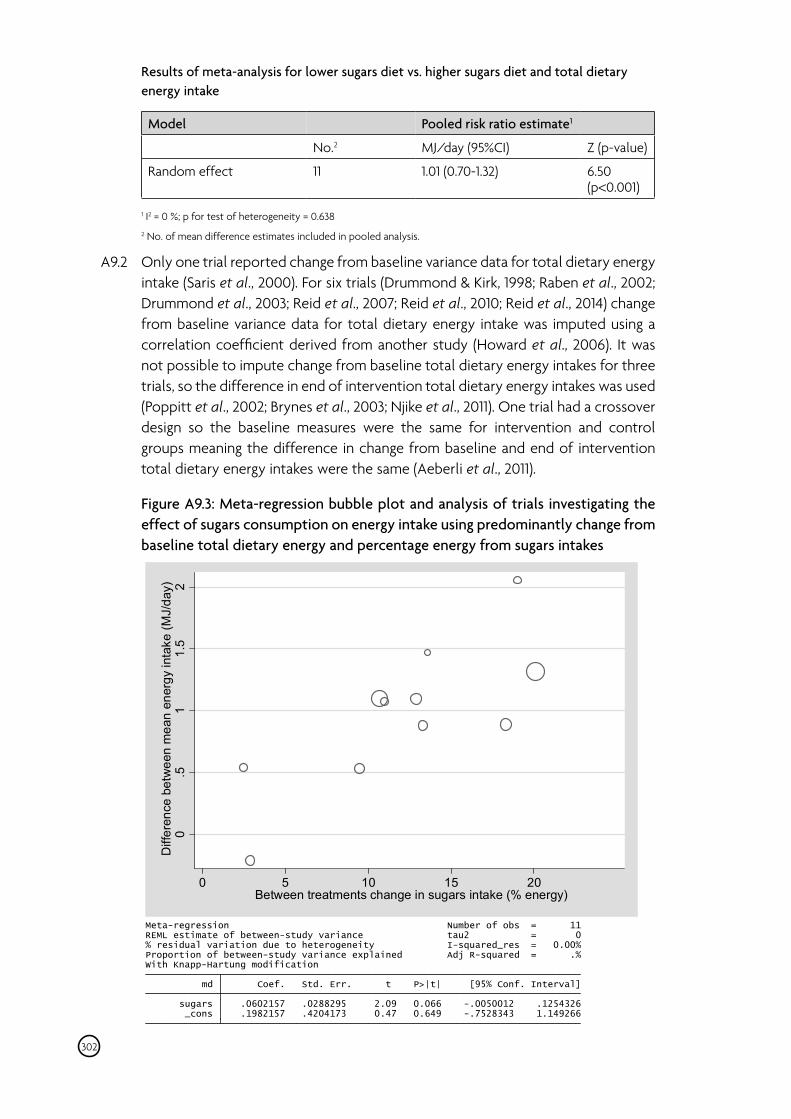
Results of meta-analysis for lower sugars diet vs. higher sugars diet and total dietary energy intake
Model Pooled risk ratio estimate1
No.2 MJ/day (95%CI) Z (p-value)
Random effect 11 1.01 (0.70-1.32) 6.50 (p<0.001)
1 I2 = 0 %; p for test of heterogeneity = 0.638 2 No. of mean difference estimates included in pooled analysis.
A9.2 Only one trial reported change from baseline variance data for total dietary energy intake (Saris et al., 2000). For six trials (Drummond & Kirk, 1998; Raben et al., 2002; Drummond et al., 2003; Reid et al., 2007; Reid et al., 2010; Reid et al., 2014) change from baseline variance data for total dietary energy intake was imputed using a correlation coefficient derived from another study (Howard et al., 2006). It was not possible to impute change from baseline total dietary energy intakes for three trials, so the difference in end of intervention total dietary energy intakes was used (Poppitt et al., 2002; Brynes et al., 2003; Njike et al., 2011). One trial had a crossover design so the baseline measures were the same for intervention and control groups meaning the difference in change from baseline and end of intervention total dietary energy intakes were the same (Aeberli et al., 2011).
Figure A9.3: Meta-regression bubble plot and analysis of trials investigating the effect of sugars consumption on energy intake using predominantly change from baseline total dietary energy and percentage energy from sugars intakes
302
��
�
� � � �
�
�����
�����
���
D\�
G�-0�
H�DN
QWL\�J
HUHQ
DQ�
HP
HQ�
HZW
EHH�F
HQUHIIL'
�� �� ��� ��� ���%HWZHHQ�WUHDWPHQWV�FKDQJH�LQ�VXJDUV�LQWDNH����HQHUJ\�
Meta-regression Number of obs = 11 REML estimate of between-study variance tau2 = 0 % residual variation due to heterogeneity I-squared_res = 0.00% Proportion of between-study variance explained Adj R-squared = .% With Knapp-Hartung modification
md Coef. Std. Err. t P>|t| [95% Conf. Interval]
sugars .0602157 .0288295 2.09 0.066 -.0050012 .1254326 _cons .1982157 .4204173 0.47 0.649 -.7528343 1.149266
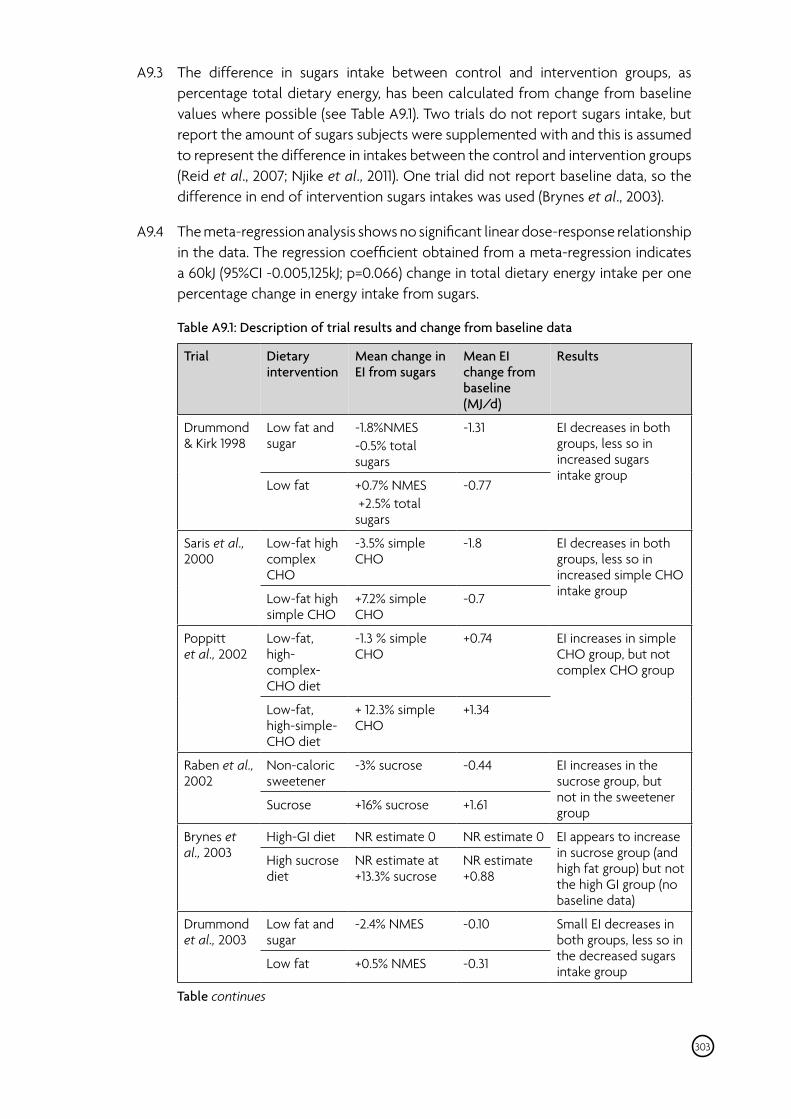
A9.3 The difference in sugars intake between control and intervention groups, as percentage total dietary energy, has been calculated from change from baseline values where possible (see Table A9.1). Two trials do not report sugars intake, but report the amount of sugars subjects were supplemented with and this is assumed to represent the difference in intakes between the control and intervention groups (Reid et al., 2007; Njike et al., 2011). One trial did not report baseline data, so the difference in end of intervention sugars intakes was used (Brynes et al., 2003).
A9.4 The meta-regression analysis shows no significant linear dose-response relationship in the data. The regression coefficient obtained from a meta-regression indicates a 60kJ (95%CI -0.005,125kJ; p=0.066) change in total dietary energy intake per one percentage change in energy intake from sugars.
Table A9.1: Description of trial results and change from baseline data
Trial Dietary intervention
Mean change in EI from sugars
Mean EI change from baseline (MJ/d)
Results
Drummond & Kirk 1998
Low fat and sugar
Low fat
-1.8%NMES -0.5% total sugars
+0.7% NMES +2.5% total sugars
-1.31
-0.77
EI decreases in both groups, less so in increased sugars intake group
Saris et al., 2000
Low-fat high complex CHO
Low-fat high simple CHO
-3.5% simple CHO
+7.2% simple CHO
-1.8
-0.7
EI decreases in both groups, less so in increased simple CHO intake group
Poppitt et al., 2002
Low-fat, high-complex-CHO diet
Low-fat, high-simple-CHO diet
-1.3 % simple CHO
+ 12.3% simple CHO
+0.74
+1.34
EI increases in simple CHO group, but not complex CHO group
Raben et al., 2002
Non-caloric sweetener
Sucrose
-3% sucrose
+16% sucrose
-0.44
+1.61
EI increases in the sucrose group, but not in the sweetener group
Brynes et al., 2003
High-GI diet
High sucrose diet
NR estimate 0
NR estimate at +13.3% sucrose
NR estimate 0
NR estimate +0.88
EI appears to increase in sucrose group (and high fat group) but not the high GI group (no baseline data)
Drummond et al., 2003
Low fat and sugar
Low fat
-2.4% NMES
+0.5% NMES
-0.10
-0.31
Small EI decreases in both groups, less so in the decreased sugars intake group
Table continues
303
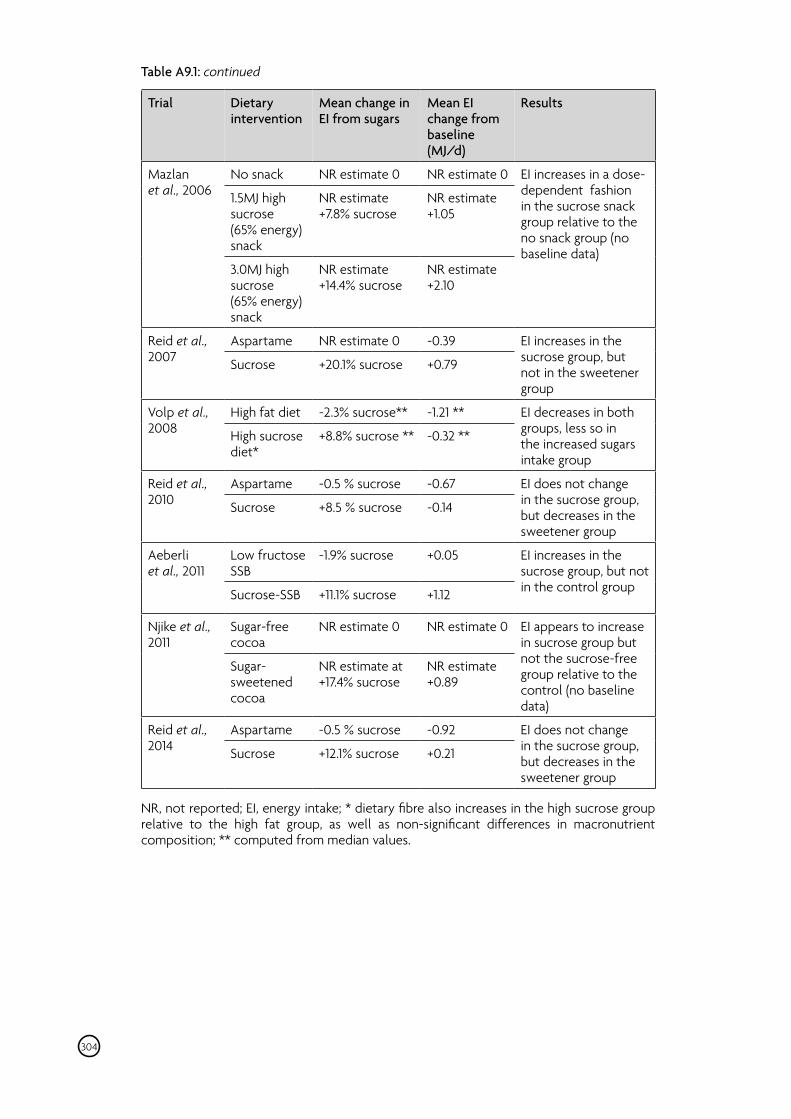
Table A9.1: continued
Trial Dietary intervention
Mean change in EI from sugars
Mean EI change from baseline (MJ/d)
Results
Mazlan et al., 2006
No snack
1.5MJ high sucrose (65% energy) snack
3.0MJ high sucrose (65% energy) snack
NR estimate 0
NR estimate +7.8% sucrose
NR estimate +14.4% sucrose
NR estimate 0
NR estimate +1.05
NR estimate +2.10
EI increases in a dose-dependent fashion in the sucrose snack group relative to the no snack group (no baseline data)
Reid et al., 2007
Aspartame
Sucrose
NR estimate 0
+20.1% sucrose
-0.39
+0.79
EI increases in the sucrose group, but not in the sweetener group
Volp et al., 2008
High fat diet
High sucrose diet*
-2.3% sucrose**
+8.8% sucrose **
-1.21 **
-0.32 **
EI decreases in both groups, less so in the increased sugars intake group
Reid et al., 2010
Aspartame
Sucrose
-0.5 % sucrose
+8.5 % sucrose
-0.67
-0.14
EI does not change in the sucrose group, but decreases in the sweetener group
Aeberli et al., 2011
Low fructose SSB
Sucrose-SSB
-1.9% sucrose
+11.1% sucrose
+0.05
+1.12
EI increases in the sucrose group, but not in the control group
Njike et al., 2011
Sugar-free cocoa
Sugar-sweetened cocoa
NR estimate 0
NR estimate at +17.4% sucrose
NR estimate 0
NR estimate +0.89
EI appears to increase in sucrose group but not the sucrose-free group relative to the control (no baseline data)
Reid et al., 2014
Aspartame
Sucrose
-0.5 % sucrose
+12.1% sucrose
-0.92
+0.21
EI does not change in the sucrose group, but decreases in the sweetener group
NR, not reported; EI, energy intake; * dietary fibre also increases in the high sucrose group relative to the high fat group, as well as non-significant differences in macronutrient composition; ** computed from median values.
304
References
Abete I, Parra D & Martinez JA (2008) Energy-restricted diets based on a distinct food selection affecting the glycemic index induce different weight loss and oxidative response. Clinical Nutrition 27, 545-551.
Abrahamsson L, Goranzon H, Karlstrom B, Vessby B & Aman P (1994) Metabolic effects of oat bran and wheat bran in healthy women. Scand J Nutr 38, 5-10.
Abrams SA, Griffin IJ, Hawthorne KM, Liang L, Gunn SK, Darlington G & Ellis KJ (2005) A combination of prebiotic short- and long-chain inulin-type fructans enhances calcium absorption and bone mineralization in young adolescents. Am J Clin Nutr 82, 471-476.
Aeberli I, Gerber PA, Hochuli M, Kohler S, Haile SR, Gouni-Berthold I, Berthold HK, Spinas GA & Berneis K (2011) Low to moderate sugar-sweetened beverage consumption impairs glucose and lipid metabolism and promotes inflammation in healthy young men: a randomized controlled trial. American Journal of Clinical Nutrition 94, 479-485.
Aires CP, Del Bel Cury AA, Tenuta LM, Klein MI, Koo H, Duarte S & Cury JA (2008) Effect of starch and sucrose on dental biofilm formation and on root dentine demineralization. Caries Res 42, 380-386.
Aires CP, Tabchoury CP, Del Bel Cury AA & Cury JA (2002) Effect of a lactose-containing sweetener on root dentine demineralization in situ. Caries Res 36, 167-169.
Aires CP, Tabchoury CP, Del Bel Cury AA, Koo H & Cury JA (2006) Effect of sucrose concentration on dental biofilm formed in situ and on enamel demineralization. Caries Res 40, 28-32.
Akbaraly TN, Ferrie JE, Berr C, Brunner EJ, Head J, Marmot MG, Singh-Manoux A, Ritchie K, Shipley MJ & Kivimaki M (2011) Alternative Healthy Eating Index and mortality over 18 y of follow-up: results from the Whitehall II cohort. The American Journal of Clinical Nutrition 94, 247-253.
Akerberg AK, Liljeberg HG, Granfeldt YE, Drews AW & Bjorck IM (1998) An in vitro method, based on chewing, to predict resistant starch content in foods allows parallel determination of potentially available starch and dietary fiber. Journal of Nutrition 128, 651-660.
Alanen P, Isokangas P & Gutmann K (2000) Xylitol candies in caries prevention: results of a field study in Estonian children. Community Dentistry & Oral Epidemiology 28, 218-224.
Alberts DS, Martinez ME, Roe DJ, et al. (2000) Lack of Effect of a High-Fiber Cereal Supplement on the Recurrence of Colorectal Adenomas. N Engl J Med 342, 1156-1162.
305
Albertson AM, Thompson D, Franko DL, Holschuh NM, Bauserman R & Barton BA (2009) Prospective associations among cereal intake in childhood and adiposity, lipid levels, and physical activity during late adolescence. Journal of the American Dietetic Association 109, 1775-1780.
Aldrich ND, Reicks MM, Sibley SD, Redmon JB, Thomas W & Raatz SK (2011) Varying protein source and quantity do not significantly improve weight loss, fat loss, or satiety in reduced energy diets among midlife adults. Nutrition Research 31, 104-112.
Alfenas RC & Mattes RD (2005) Influence of glycemic index/load on glycemic response, appetite, and food intake in healthy humans. Diabetes Care 28, 2123-2129.
Aller R, De Luis DA, Izaola O, la CF, del OL, Fernandez L, Arranz T & Hernandez JM (2004) Effect of soluble fiber intake in lipid and glucose levels in healthy subjects: a randomized clinical trial. Diabetes Research & Clinical Practice 65, 7-11.
Alles MS, Hartemink R, Meyboom S, Harryvan JL, Van Laere KM, Nagengast FM & Hautvast JG (1999) Effect of transgalactooligosaccharides on the composition of the human intestinal microflora and on putative risk markers for colon cancer. American Journal of Clinical Nutrition 69, 980-991.
Alm A, Wendt LK, Koch G, Birkhed D & Nilsson M (2012) Caries in adolescence — influence from early childhood. Community Dentistry & Oral Epidemiology 40, 125-133.
American Association of Cereal Chemists International (1999) AACC members agree on definition of whole grain.
American Diabetes Association and National Institute of Diabetes Digestive and Kidney Diseases (2002) The prevention or delay of type 2 diabetes. Diabetes Care 25, 742-749.
Anderson AS & Whichelow MJ (1985) Constipation during pregnancy: dietary fibre intake and the effect of fibre supplementation. Human Nutrition — Applied Nutrition 39, 202-207.
Andersson A, Tengblad S, Karlstrom B, Kamal-Eldin A, Landberg R, Basu S, Aman P & Vessby B (2007) Whole-grain foods do not affect insulin sensitivity or markers of lipid peroxidation and inflammation in healthy, moderately overweight subjects. Journal of Nutrition 137, 1401-1407.
Andersson H, Navert B, Bingham SA, Englyst HN & Cummings JH (1983) The effects of breads containing similar amounts of phytate but different amounts of wheat bran on calcium, zinc and iron balance in man. British Journal of Nutrition 50, 503-510.
Appel LJ, Sacks FM, Carey VJ, et al. (2005) Effects of protein, monounsaturated fat, and carbohydrate intake on blood pressure and serum lipids: results of the OmniHeart randomized trial. JAMA 294, 2455-2464.
Appleby PN, Thorogood M, Mann JI & Key TJ (1999) The Oxford Vegetarian Study: an overview. American Journal of Clinical Nutrition 70, Suppl-531S.
306
Asayama K, Thijs L, Brguljan-Hitij J, et al. (2014) Risk stratification by self-measured home blood pressure across categories of conventional blood pressure: a participant-level meta-analysis. PLoS Med 11, e1001591.
Ascherio A, Rimm EB, Hernan MA, Giovannucci EL, Kawachi I, Stampfer MJ & Willett WC (1998) Intake of potassium, magnesium, calcium, and fiber and risk of stroke among US men. Circulation 98, 1198-1204.
Ashraf W, Park F, Lof J & Quigley EM (1995) Effects of psyllium therapy on stool characteristics, colon transit and anorectal function in chronic idiopathic constipation. Alimentary Pharmacology & Therapeutics 9, 639-647.
Ashraf W, Pfeiffer RF, Park F, Lof J & Quigley EM (1997) Constipation in Parkinson's disease: objective assessment and response to psyllium. Movement Disorders 12, 946-951.
Asp NG, van Amelsvoort JM & Hautvast JG (1996) Nutritional implications of resistant starch. Nutr Res Rev 9, 1-31.
Aune D, Chan DSM, Viera R, Lau R, Greenwood DC, Kampman E & Norat T (2011) Dietary fibre, whole grains, and risk of colorectal cancer: systematic review and dose-response meta-analysis of prospective studies. BMJ 343, d6617.
Aune D, Norat T, Romundstad P & Vatten L (2013) Whole grain and refined grain consumption and the risk of type 2 diabetes: a systematic review and dose-response meta-analysis of cohort studies. Eur J Epidemiol 28, 845-858.
Badiali D, Corazziari E, Habib FI, Tomei E, Bausano G, Magrini P, Anzini F & Torsoli A (1995) Effect of wheat bran in treatment of chronic nonorganic constipation. A double-blind controlled trial. Digestive Diseases & Sciences 40, 349-356.
Baer HJ, Glynn RJ, Hu FB, Hankinson SE, Willett WC, Colditz GA, Stampfer M & Rosner B (2011) Risk Factors for Mortality in the Nurses' Health Study: A Competing Risks Analysis. Am J Epidemiol 173, 319-329.
Bakker-Zierikzee AM, Alles MS, Knol J, Kok FJ, Tolboom JJ & Bindels JG (2005) Effects of infant formula containing a mixture of galacto- and fructo-oligosaccharides or viable Bifidobacterium animalis on the intestinal microflora during the first 4 months of life. British Journal of Nutrition 94, 783-790.
Ballongue J, Schumann C & Quignon P (1997) Effects of lactulose and lactitol on colonic microflora and enzymatic activity. Scandinavian Journal of Gastroenterology, Supplement 32, 41-44.
Bandera EV, Freudenheim JL, Marshall JR, Zielezny M, Priore RL, Brasure J, Baptiste M & Graham S (1997) Diet and alcohol consumption and lung cancer risk in the New York State Cohort (United States). Cancer Causes Control 8, 828-840.
Bantle JP, Raatz SK, Thomas W & Georgopoulos A (2000) Effects of dietary fructose on plasma lipids in healthy subjects. American Journal of Clinical Nutrition 72, 1128-1134.
307
Barclay AW, Flood VM, Rochtchina E, Mitchell P & Brand-Miller JC (2007) Glycemic index, dietary fiber, and risk of type 2 diabetes in a cohort of older Australians. Diabetes Care 30, 2811-2813.
Barger-Lux MJ, Heaney RP & Recker RR (1989) Time course of calcium absorption in humans: evidence for a colonic component. Calcif Tissue Int 44, 308-311.
Barr EL, Zimmet PZ, Welborn TA, et al. (2007) Risk of cardiovascular and all-cause mortality in individuals with diabetes mellitus, impaired fasting glucose, and impaired glucose tolerance: the Australian Diabetes, Obesity, and Lifestyle Study (AusDiab). Circulation 116, 151-157.
Basu A, Devaraj S & Jialal I (2006) Dietary factors that promote or retard inflammation. Arteriosclerosis, Thrombosis, and Vascular Biology 26, 995-1001.
Bates B, Lennox A, Prentice A, Bates CJ, Page P, Nicholson S, Swan G (2014) National Diet and Nutrition Survey: results from Years 1 to 4 (combined) of the rolling programme for 2008 and 2009 to 2011 and 2012. https://www.gov.uk/government/statistics/national-diet-and-nutrition-survey-results-from-years-1-to-4-combined-of-the-rolling-programme-for-2008-and-2009-to-2011-and-2012 .
Bates B, Lennox A & Swan G (2009) National Diet and Nutrition Survey: Headline results from Year 1 of the rolling programme. [Online]. http://tna.europarchive.org/20110116113217/http://www.food.gov.uk/science/ dietarysurveys/ndnsdocuments/ndns0809year1
Bays H, Frestedt JL, Bell M, Williams C, Kolberg L, Schmelzer W & Anderson JW (2011) Reduced viscosity Barley beta-Glucan versus placebo: a randomized controlled trial of the effects on insulin sensitivity for individuals at risk for diabetes mellitus. Nutrition & Metabolism 8, 58.
Bazzano LA, He J, Ogden LG, Loria C, Vupputuri S, Myers L & Whelton PK (2001) Legume consumption and risk of coronary heart disease in US men and women: NHANES I Epidemiologic Follow-up Study. Archives of Internal Medicine 161, 2573-2578.
Bazzano LA, He J, Ogden LG, Loria CM, Whelton PK & National Health and Nutrition Examination Survey (2003) Dietary fiber intake and reduced risk of coronary heart disease in US men and women: the National Health and Nutrition Examination Survey I Epidemiologic Follow-up Study. Archives of Internal Medicine 163, 1897-1904.
Beards E, Tuohy K & Gibson G (2010) A human volunteer study to assess the impact of confectionery sweeteners on the gut microbiota composition. British Journal of Nutrition 104, 701-708.
Behall KM, Howe JC & Anderson RA (2002) Apparent mineral retention is similar in control and hyperinsulinemic men after consumption of high amylose cornstarch. Journal of Nutrition 132, 1886-1891.
Behall KM, Scholfield DJ & Lee K (1987) Mineral balance in adult men: Effect of four refined fibers. American Journal of Clinical Nutrition 46, 307-314.
308
Beiswanger BB, Boneta AE, Jau MS, Katz BP, Proskin HM & Stookey GK (1998) Advances in dental products. The effect of chewing sugar-free gum after meals on clinical caries incidence. J Am Dent Assoc 129, 1623-1627.
Bell LP, Hectorn KJ, Reynolds H & Hunninghake DB (1990) Cholesterol-lowering effects of soluble-fiber cereals as part of a prudent diet for patients with mild to moderate hypercholesterolemia. American Journal of Clinical Nutrition 52, 1020-1026.
Bellisle F, Dalix AM, De Assis MA, Kupek E, Gerwig U, Slama G & Oppert JM (2007) Motivational effects of 12-week moderately restrictive diets with or without special attention to the Glycaemic Index of foods. British Journal of Nutrition 97, 790-798.
Ben XM, Li J, Feng ZT, Shi SY, Lu YD, Chen R & Zhou XY (2008) Low level of galacto-oligosaccharide in infant formula stimulates growth of intestinal Bifidobacteria and Lactobacilli. World Journal of Gastroenterology 14, 6564-6568.
Ben XM, Zhou XY, Zhao WH, Yu WL, Pan W, Zhang WL, Wu SM, Van Beusekom CM & Schaafsma A (2004) Supplementation of milk formula with galacto-oligosaccharides improves intestinal micro-flora and fermentation in term infants. Chinese Medical Journal 117, 927-931.
Bernabe E & Sheiham A (2014) Tooth loss in the United Kingdom — trends in social inequalities: an age-period-and-cohort analysis. PLoS ONE 9, e104808.
Bernabe E, Vehkalahti MM, Sheiham A, Aromaa A & Suominen AL (2014) Sugar-sweetened beverages and dental caries in adults: a 4-year prospective study. J Dent 42, 952-958.
Berry CS (1986) Resistant starch: Formation and measurement of starch that survives exhaustive digestion with amylolytic enzymes during the determination of dietary fibre. Journal of Cereal Science 4, 301-314.
Beulens JW, de Bruijne LM, Stolk RP, Peeters PH, Bots ML, Grobbee DE & van der Schouw YT (2007) High dietary glycemic load and glycemic index increase risk of cardiovascular disease among middle-aged women: a population-based follow-up study. J Am Coll Cardiol 50, 14-21.
Beyer PL & Flynn MA (1978) Effects of high- and low-fiber diets on human feces. Journal of the American Dietetic Association 72, 271-277.
Bhargava A (2006) Fiber intakes and anthropometric measures are predictors of circulating hormone, triglyceride, and cholesterol concentrations in the women's health trial. Journal of Nutrition 136, 2249-2254.
Bhupathiraju SN, Pan A, Malik VS, Manson JE, Willett WC, van Dam RM & Hu FB (2013) Caffeinated and caffeine-free beverages and risk of type 2 diabetes. The American Journal of Clinical Nutrition 97, 155-166.
Bidani AK & Griffin KA (2002) Long-term renal consequences of hypertension for normal and diseased kidneys. Curr Opin Nephrol Hypertens 11, 73-80.
309
Bingham SA, Norat T, Moskal A, et al. (2005) Is the Association with Fiber from Foods in Colorectal Cancer Confounded by Folate Intake? Cancer Epidemiology Biomarkers Prevention 14, 1552-1556.
Bird AR, Vuaran MS, King RA, Noakes M, Keogh J, Morell MK & Topping DL (2008) Wholegrain foods made from a novel high-amylose barley variety (Himalaya 292) improve indices of bowel health in human subjects. British Journal of Nutrition 99, 1032-1040.
Birkhed D, Imfeld T & Edwardsson S (1993) pH changes in human dental plaque from lactose and milk before and after adaptation. Caries Res 27, 43-50.
Bishop DT, Mathers JC, Topping DL & Bird AR (2009) Correspondence on Effect of Aspirin or Resistant Starch on Colorectal Neoplasia in the Lynch Syndrome. New England Journal of Medicine 360, 1461-1463.
Björkstén B, Sepp E, Julge K, Voor T & Mikelsaar M (2001) Allergy development and the intestinal microflora during the first year of life. The Journal of allergy and clinical immunology 108, 516-520.
Black RN, Spence M, McMahon RO, Cuskelly GJ, Ennis CN, McCance DR, Young IS, Bell PM & Hunter SJ (2006) Effect of eucaloric high- and low-sucrose diets with identical macronutrient profile on insulin resistance and vascular risk: a randomized controlled trial. Diabetes 55, 3566-3572.
Blundell JE, Finlayson G & Halford JCG (2008) Eating Behaviour. In Clinical Obesity in Adults and Children, pp. 134-150 [Kopelman PG, Caterson ID, and Dietz WH, editors]. London: Blackwell.
Blundell J, de GC, Hulshof T, et al. (2010) Appetite control: methodological aspects of the evaluation of foods. Obes Rev 11, 251-270.
Bode L (2006) Recent Advances on Structure, Metabolism, and Function of Human Milk Oligosaccharides. The Journal of Nutrition 136, 2127-2130.
Boehm G+ & Stahl B (2007) Oligosaccharides from Milk. The Journal of Nutrition 137, 847S-849S.
Bonnema AL, Kolberg LW, Thomas W & Slavin JL (2010) Gastrointestinal tolerance of chicory inulin products. J Am Diet Assoc 110, 865-868.
Boreham C, Twisk J, van MW, Savage M, Strain J & Cran G (1999) Relationships between the development of biological risk factors for coronary heart disease and lifestyle parameters during adolescence: The Northern Ireland Young Hearts Project. Public Health 113, 7-12.
Borkman M, Campbell LV, Chisholm DJ & Storlien LH (1991) Comparison of the effects on insulin sensitivity of high carbohydrate and high fat diets in normal subjects. J Clin Endocrinol Metab 72, 432-437.
310
Bouhnik Y, Flourie B, Riottot M, Bisetti N, Gailing MF, Guibert A, Bornet F & Rambaud JC (1996) Effects of fructo-oligosaccharides ingestion on fecal bifidobacteria and selected metabolic indexes of colon carcinogenesis in healthy humans. Nutrition & Cancer 26, 21-29.
Bouhnik Y, Raskine L, Champion K, Andrieux C, Penven S, Jacobs H & Simoneau G (2007) Prolonged administration of low-dose inulin stimulates the growth of bifidobacteria in humans. Nutrition Research 27, 187-193.
Bouhnik Y, Raskine L, Simoneau G, Paineau D & Bornet F (2006) The capacity of short-chain fructo-oligosaccharides to stimulate faecal bifidobacteria: a dose-response relationship study in healthy humans. Nutrition Journal 5, 8.
Bouhnik Y, Raskine L, Simoneau G, Vicaut E, Neut C, Flourie B, Brouns F & Bornet FR (2004) The capacity of nondigestible carbohydrates to stimulate fecal bifidobacteria in healthy humans: a double-blind, randomized, placebo-controlled, parallel-group, dose-response relation study. American Journal of Clinical Nutrition 80, 1658-1664.
Bouhnik Y, Vahedi K, Achour L, Attar A, Salfati J, Pochart P, Marteau P, Flourie B, Bornet F & Rambaud JC (1999) Short-chain fructo-oligosaccharide administration dose-dependently increases fecal bifidobacteria in healthy humans. Journal of Nutrition 129, 113-116.
Bowden RG, Lanning BA, Doyle EI, Slonaker B, Johnston HM & Scanes G (2007) Systemic glucose level changes with a carbohydrate-restricted and higher protein diet combined with exercise. J Am Coll Health 56, 147-152.
Brainin M & Heiss WD (2009) Textbook of Stroke Medicine. Cambridge, United Kingdom: Cambridge University Press.
Bravo S, Lowndes J, Sinnett S, Yu Z & Rippe J (2013) Consumption of sucrose and high-fructose corn syrup does not increase liver fat or ectopic fat deposition in muscles. Appl Physiol Nutr Metab 38, 681-688.
Brehm BJ, Seeley RJ, Daniels SR & D'Alessio DA (2003) A randomized trial comparing a very low carbohydrate diet and a calorie-restricted low fat diet on body weight and cardiovascular risk factors in healthy women. J Clin Endocrinol Metab 88, 1617-1623.
Brehm BJ, Spang SE, Lattin BL, Seeley RJ, Daniels SR & D'Alessio DA (2005) The role of energy expenditure in the differential weight loss in obese women on low-fat and low-carbohydrate diets. J Clin Endocrinol Metab 90, 1475-1482.
Brighenti F, Casiraghi MC & Baggio C (1998) Resistant starch in the Italian diet. British Journal of Nutrition 80, 333-341.
British Heart Foundation (2012) Coronary Heart Disease Statistics: a compendium of health statistics.
British Heart Foundation (2014) Cardiovascular disease statistics. https://www.bhf.org.uk/~/media/files/publications/research/bhf_cvd-statistics-2014_web_2.pdf
311
Brooking LA, Williams SM & Mann JI (2012) Effects of macronutrient composition of the diet on body fat in indigenous people at high risk of type 2 diabetes. Diabetes Research & Clinical Practice 96, 40-46.
Brouns F, Bjorck I, Frayn KN, Gibbs AL, Lang V, Slama G & Wolever TM (2005) Glycaemic index methodology. Nutr Res Rev 18, 145-171.
Brown MK & Everett I (1990) Gentler bowel fitness with fiber. Geriatr Nurs 11, 26-27.
Brownlee IA, Moore C, Chatfield M, Richardson DP, Ashby P, Kuznesof SA, Jebb SA & Seal CJ (2010) Markers of cardiovascular risk are not changed by increased whole-grain intake: the WHOLEheart study, a randomised, controlled dietary intervention. British Journal of Nutrition 104, 125-134.
Bruno-Ambrosius K, Swanholm G & Twetman S (2005) Eating habits, smoking and toothbrushing in relation to dental caries: a 3-year study in Swedish female teenagers. Int J Paediatr Dent 15, 190-196.
Brunser O, Figueroa G, Gotteland M, et al. (2006) Effects of probiotic or prebiotic supplemented milk formulas on fecal microbiota composition of infants. Asia Pacific Journal of Clinical Nutrition 15, 368-376.
Brynes AE, Mark EC, Ghatei MA, Dornhorst A, Morgan LM, Bloom SR & Frost GS (2003) A randomised four-intervention crossover study investigating the effect of carbohydrates on daytime profiles of insulin, glucose, non-esterified fatty acids and triacylglycerols in middle-aged men. British Journal of Nutrition 89, 207-218.
Burger KN, Beulens JW, Boer JM, Spijkerman AM & van ADL (2011) Dietary glycemic load and glycemic index and risk of coronary heart disease and stroke in Dutch men and women: the EPIC-MORGEN study. PLoS ONE 6, e25955.
Buss DH, Lewis J & Smithers G (1994) Non-milk extrinsic sugars. Journal of Human Nutrition and Dietetics 7, 87.
Butler LM, Wang R, Koh WP & Yu MC (2008) Prospective study of dietary patterns and colorectal cancer among Singapore Chinese. Br J Cancer 99, 1511-1516.
Buyken AE, Flood V, Empson M, Rochtchina E, Barclay AW, Brand-Miller J & Mitchell P (2010) Carbohydrate nutrition and inflammatory disease mortality in older adults. The American Journal of Clinical Nutrition 92, 634-643.
Caglar E, Cildir SK & Sandalli N (2008) The erosive potential of different malt drinks: an in vitro and in situ study. J Clin Pediatr Dent 33, 35-37.
Calame W, Weseler AR, Viebke C, Flynn C & Siemensma AD (2008) Gum arabic establishes prebiotic functionality in healthy human volunteers in a dose-dependent manner. British Journal of Nutrition 100, 1269-1275.
Calorie Reduction Expert Group (2011) Statement of the Calorie Reduction Expert Group. https://www.gov.uk/government/uploads/system/uploads/attachment_data/ file/215561/dh_127554.pdf
312
Campain AC, Morgan MV, Evans RW, Ugoni A, Adams GG, Conn JA & Watson MJ (2003) Sugar-starch combinations in food and the relationship to dental caries in low-risk adolescents. Eur J Oral Sci 111, 316-325.
Campos H, Dreon DM & Krauss RM (1995) Associations of hepatic and lipoprotein lipase activities with changes in dietary composition and low density lipoprotein subclasses. J Lipid Res 36, 462-472.
Cancer Research UK (2014a) Bowel cancer. Cancer Stats 2014. http://publications.cancerresearchuk.org/downloads/Product/CS_KF_BOWEL.pdf.
Cancer Research UK (2014b) CancerStats: Cancer Statistics for the UK. http://www.cancerresearchuk.org/cancer-info/cancerstats/.
Cani PD, Joly E, Horsmans Y & Delzenne NM (2006) Oligofructose promotes satiety in healthy human: a pilot study. European Journal of Clinical Nutrition 60, 567-572.
Cani PD, Lecourt E, Dewulf EM, Sohet FM, Pachikian BD, Naslain D, De BF, Neyrinck AM & Delzenne NM (2009) Gut microbiota fermentation of prebiotics increases satietogenic and incretin gut peptide production with consequences for appetite sensation and glucose response after a meal. American Journal of Clinical Nutrition 90, 1236-1243.
Carvalho-Wells AL, Helmolz K, Nodet C, Molzer C, Leonard C, McKevith B, Thielecke F, Jackson KG & Tuohy KM (2010) Determination of the in vivo prebiotic potential of a maize-based whole grain breakfast cereal: a human feeding study. British Journal of Nutrition 104, 1353-1356.
Causey JL, Feirtag JM, Gallaher DD, Tungland BC & Slavin JL (2000) Effects of dietary inulin on serum lipids, blood glucose and the gastrointestinal environment in hypercholesterolemic men. Nutrition Research 20, 191-201.
Ccahuana-Vasquez RA, Tabchoury CP, Tenuta LM, Del Bel Cury AA, Vale GC & Cury JA (2007) Effect of frequency of sucrose exposure on dental biofilm composition and enamel demineralization in the presence of fluoride. Caries Res 41, 9-15.
Chadwick BL, White DA, Morris AJ, Evans D & Pitts NB (2006) Non-carious tooth conditions in children in the UK, 2003. Br Dent J 200, 379-384.
Champ M, Langkilde AM, Brouns F, Kettlitz B & Bail-Collet YL (2003) Advances in dietary fibre characterisation. 2. Consumption, chemistry, physiology and measurement of resistant starch; implications for health and food labelling. Nutr Res Rev 16, 143-161.
Charlton KE, Tapsell LC, Batterham MJ, O'Shea J, Thorne R, Beck E & Tosh SM (2012) Effect of 6 weeks' consumption of beta-glucan-rich oat products on cholesterol levels in mildly hypercholesterolaemic overweight adults. British Journal of Nutrition 107, 1037-1047.
Chen J, He J, Wildman RP, Reynolds K, Streiffer RH & Whelton PK (2006) A randomized controlled trial of dietary fiber intake on serum lipids. European Journal of Clinical Nutrition 60, 62-68.
313
Cheng G, Karaolis-Danckert N, Libuda L, Bolzenius K, Remer T & Buyken AE (2009) Relation of dietary glycemic index, glycemic load, and fiber and whole-grain intakes during puberty to the concurrent development of percent body fat and body mass index. Am J Epidemiol 169, 667-677.
Cherbut C, Aube AC, Mekki N, Dubois C, Lairon D & Barry JL (1997) Digestive and metabolic effects of potato and maize fibres in human subjects. British Journal of Nutrition 77, 33-46.
Cheskin LJ, Kamal N, Crowell MD, Schuster MM & Whitehead WE (1995) Mechanisms of constipation in older persons and effects of fiber compared with placebo. Journal of the American Geriatrics Society 43, 666-669.
Chuang SC, Norat T, Murphy N, et al. (2012) Fiber intake and total and cause-specific mortality in the European Prospective Investigation into Cancer and Nutrition cohort. American Journal of Clinical Nutrition 96, 164-174.
Claessens M, van Baak MA, Monsheimer S & Saris WHM (2009) The effect of a low-fat, high-protein or high-carbohydrate ad libitum diet on weight loss maintenance and metabolic risk factors. International Journal of Obesity 33, 296-304.
Clevidence BA, Judd JT, Schatzkin A, Muesing RA, Campbell WS, Brown CC & Taylor PR (1992) Plasma lipid and lipoprotein concentrations of men consuming a low-fat, high-fiber diet. American Journal of Clinical Nutrition 55, 689-694.
Clifton PM, Keogh JB & Noakes M (2008) Long-term effects of a high-protein weight-loss diet. American Journal of Clinical Nutrition 87, 23-29.
Clifton PM, Noakes M & Keogh JB (2004) Very Low-Fat (12%) and High Monounsaturated Fat (35%) Diets Do Not Differentially Affect Abdominal Fat Loss in Overweight, Nondiabetic Women. Journal of Nutrition 134, 1741-1745.
Cloetens L, Broekaert WF, Delaedt Y, Ollevier F, Courtin CM, Delcour JA, Rutgeerts P & Verbeke K (2010) Tolerance of arabinoxylan-oligosaccharides and their prebiotic activity in healthy subjects: a randomised, placebo-controlled cross-over study. British Journal of Nutrition 103, 703-713.
Colditz GA, Manson JE, Stampfer MJ, Rosner B, Willett WC & Speizer FE (1992) Diet and risk of clinical diabetes in women. American Journal of Clinical Nutrition 55, 1018-1023.
Colditz GA, Willett WC, Stampfer MJ, London SJ, Segal MR & Speizer FE (1990) Patterns of weight change and their relation to diet in a cohort of healthy women. American Journal of Clinical Nutrition 51, 1100-1105.
Colette C, Percheron C, Pares-Herbute N, Michel F, Pham TC, Brillant L, Descomps B & Monnier L (2003) Exchanging carbohydrates for monounsaturated fats in energy-restricted diets: effects on metabolic profile and other cardiovascular risk factors. International Journal of Obesity 27, 648-656.
COMA (1989) Dietary Sugars and Human Disease. London: HMSO.
314
COMA (1991) Dietary Reference Values for Food Energy and Nutrients for the United Kingdom. London: HMSO.
COMA (1994) Nutritional aspects of cardiovascular disease, 46 ed. London: HMSO.
Connell AM, Hilton C, Irvine G, Lennard-Jones JE & Misiewicz JJ (1965) Variation of bowel habit in two population samples. British Medical Journal 2, 1095-1099.
Connell AM & Smith CL (1974) The effect of dietary fibre on transit time. Vancouver, Canada: Mitchell Press.
Corinaldesi R, Stanghellini V & Bocci G (1982) Dietary fibers and intestinal transit times. Current Therapeutic Research - Clinical and Experimental 31, 173-180.
Cornier MA, Donahoo WT, Pereira R, et al. (2005) Insulin sensitivity determines the effectiveness of dietary macronutrient composition on weight loss in obese women. Obes Res 13, 703-709.
Costabile A, Fava F, Roytio H, et al. (2012) Impact of polydextrose on the faecal microbiota: a double-blind, crossover, placebo-controlled feeding study in healthy human subjects. British Journal of Nutrition 108, 471-481.
Costabile A, Kolida S, Klinder A, Gietl E, Bauerlein M, Frohberg C, Landschutze V & Gibson GR (2010) A double-blind, placebo-controlled, cross-over study to establish the bifidogenic effect of a very-long-chain inulin extracted from globe artichoke (Cynara scolymus) in healthy human subjects. British Journal of Nutrition 104, 1007-1017.
Costalos C, Kapiki A, Apostolou M & Papathoma E (2008) The effect of a prebiotic supplemented formula on growth and stool microbiology of term infants. Early Human Development 84, 45-49.
Coudray C, Demigne C & Rayssiguier Y (2003) Effects of dietary fibers on magnesium absorption in animals and humans. Journal of Nutrition 133, 1-4.
Coussement PAA (1999) Inulin and Oligofructose: Safe Intakes and Legal Status. The Journal of Nutrition 129, 1412S-1417S.
Couture P, Archer WR, Lamarche B, Landry N, Deriaz O, Corneau L, Bergeron J & Bergeron N (2003) Influences of apolipoprotein E polymorphism on the response of plasma lipids to the ad libitum consumption of a high-carbohydrate diet compared with a high-monounsaturated fatty acid diet. Metabolism 52, 1454-1459.
Crowe FL, Key TJ, Appleby PN, et al. (2012) Dietary fibre intake and ischaemic heart disease mortality: the European Prospective Investigation into Cancer and Nutrition-Heart study. Eur J Clin Nutr 66, 950-956.
Cullen G & O'Donoghue D (2007) Constipation and pregnancy. Best Practice & Research Clinical Gastroenterology 21, 807-818.
Cullen P (2000) Evidence that triglycerides are an independent coronary heart disease risk factor. Am J Cardiol 86, 943-949.
315
Cummings JH, Beatty ER, Kingman SM, Bingham SA & Englyst HN (1996) Digestion and physiological properties of resistant starch in the human large bowel. British Journal of Nutrition 75, 733-747.
Cummings JH, Bingham SA, Heaton KW & Eastwood MA (1992) Fecal weight, colon cancer risk, and dietary intake of nonstarch polysaccharides (dietary fiber). Gastroenterology 103, 1783-1789.
Cummings JH, Jenkins DJ & Wiggins HS (1976) Measurement of the mean transit time of dietary residue through the human gut. Gut 17, 210-218.
Cummings JH, Mann JI, Nishida C & Vorster HH (2009) Dietary fibre: an agreed definition. Lancet 373, 365-366.
Cummings JH & Stephen AM (2007) Carbohydrate terminology and classification. European Journal of Clinical Nutrition 61 Suppl 1, S5-18.
Curhan GC, Chertow GM, Willett WC, Spiegelman D, Colditz GA, Manson JE, Speizer FE & Stampfer MJ (1996) Birth weight and adult hypertension and obesity in women. Circulation 94, 1310-1315.
Cury JA, Rebelo MA, Del Bel Cury AA, Derbyshire MT & Tabchoury CP (2000) Biochemical composition and cariogenicity of dental plaque formed in the presence of sucrose or glucose and fructose. Caries Res 34, 491-497.
Dale KS, McAuley KA, Taylor RW, Williams SM, Farmer VL, Hansen P, Vorgers SM, Chisholm AW & Mann JI (2009) Determining optimal approaches for weight maintenance: a randomized controlled trial. Can Med Assoc J 180, E39-E46.
Dansinger ML, Gleason JA, Griffith JL, Selker HP & Schaefer EJ (2005) Comparison of the Atkins, Ornish, Weight Watchers, and Zone diets for weight loss and heart disease risk reduction: a randomized trial. JAMA 293, 43-53.
Das SK, Gilhooly CH, Golden JK, et al. (2007) Long-term effects of 2 energy-restricted diets differing in glycemic load on dietary adherence, body composition, and metabolism in CALERIE: a 1-y randomized controlled trial. American Journal of Clinical Nutrition 85, 1023-1030.
Davidson MH, Maki KC, Synecki C, Torri SA & Drennan KB (1998) Effects of dietary inulin on serum lipids in men and women with hypercholesterolemia. Nutrition Research 18, 503-517.
Davies AA, Smith GD, May MT & Ben-Shlomo Y (2006) Association between birth weight and blood pressure is robust, amplifies with age, and may be underestimated. Hypertension 48, 431-436.
Davy BM, Davy KP, Ho RC, Beske SD, Davrath LR & Melby CL (2002a) High-fiber oat cereal compared with wheat cereal consumption favorably alters LDL-cholesterol subclass and particle numbers in middle-aged and older men. American Journal of Clinical Nutrition 76, 351-358.
316
Davy BM, Melby CL, Beske SD, Ho RC, Davrath LR & Davy KP (2002b) Oat consumption does not affect resting casual and ambulatory 24-h arterial blood pressure in men with high-normal blood pressure to stage I hypertension. Journal of Nutrition 132, 394-398.
de Koning L, Malik VS, Rimm EB, Willett WC & Hu FB (2011) Sugar-sweetened and artificially sweetened beverage consumption and risk of type 2 diabetes in men. American Journal of Clinical Nutrition 93, 1321-1327.
de Luis DA, Aller R, Izaola O, Gonzalez SM, Bellioo D & Conde R (2007) Effects of a low-fat versus a low-carbohydrate diet on adipocytokines in obese adults. Hormone Research 67, 296-300.
de Luis DA, Aller R, Izaola O, Gonzalez SM & Conde R (2009a) Modulation of insulin concentrations and metabolic parameters in obese patients by -55CT polymorphism of the UCP3 gene secondary to two hypocaloric diets. Hormone and Metabolic Research 41, 62-66.
de Luis DA, Sagrado MG, Conde R, Aller R & Izaola O (2009b) The effects of two different hypocaloric diets on glucagon-like peptide 1 in obese adults, relation with insulin response after weight loss. Journal of Diabetes and Its Complications 23, 239-243.
de Munter JS, Hu FB, Spiegelman D, Franz M & Van Dam RM (2007) Whole grain, bran, and germ intake and risk of type 2 diabetes: a prospective cohort study and systematic review. PLoS Medicine / Public Library of Science 4, e261.
De Roos N, Heini AF, de Graaf C, Woestenenk G & Hobbel E (1995) Resistant starch has little effect on appetite, food intake and insulin secretion of healthy young men. European Journal of Clinical Nutrition 49, 532-541.
de Rougemont A, Normand S, Nazare JA, Skilton MR, Sothier M, Vinoy S & Laville M (2007) Beneficial effects of a 5-week low-glycaemic index regimen on weight control and cardiovascular risk factors in overweight non-diabetic subjects. British Journal of Nutrition 98, 1288-1298.
de Ruyter JC, Olthof MR, Seidell JC & Katan MB (2012) A Trial of Sugar-free or Sugar-Sweetened Beverages and Body Weight in Children. New England Journal of Medicine 367, 1397-1406.
de Souza RJ, Bray GA, Carey VJ, Hall KD, Leboff MS, Loria CM, Laranjo NM, Sacks FM & Smith SR (2012) Effects of 4 weight-loss diets differing in fat, protein, and carbohydrate on fat mass, lean mass, visceral adipose tissue, and hepatic fat: results from the POUNDS LOST trial. American Journal of Clinical Nutrition 95, 614-625.
Delbridge EA, Prendergast LA, Pritchard JE & Proietto J (2009) One-year weight maintenance after significant weight loss in healthy overweight and obese subjects: does diet composition matter? American Journal of Clinical Nutrition 90, 1203-1214.
Demol S, Yackobovitch-Gavan M, Shalitin S, Nagelberg N, Gillon-Keren M & Phillip M (2009) Low-carbohydrate (low & high-fat) versus high-carbohydrate low-fat diets in the treatment of obesity in adolescents. Acta Paediatrica 98, 346-351.
317
Den Hond E, Geypens B & Ghoos Y (2000) Effect of high performance chicory inulin on constipation. Nutrition Research 20, 731-736.
Depeint F, Tzortzis G, Vulevic J, I'Anson K & Gibson GR (2008) Prebiotic evaluation of a novel galactooligosaccharide mixture produced by the enzymatic activity of Bifidobacterium bifidum NCIMB 41171, in healthy humans: a randomized, double-blind, crossover, placebo-controlled intervention study. American Journal of Clinical Nutrition 87, 785-791.
Dhingra R, Sullivan L, Jacques PF, Wang TJ, Fox CS, Meigs JB, D'Agostino RB, Gaziano JM & Vasan RS (2007) Soft drink consumption and risk of developing cardiometabolic risk factors and the metabolic syndrome in middle-aged adults in the community.[erratum appears in Circulation. 2007 Dec 4;116(23):e557]. Circulation 116, 480-488.
Diabetes UK (2013) Evidence-based nutrition guidelines for the prevention and management of diabetes. http://www.diabetes.org.uk/Documents/Reports/nutritional-guidelines-2013-amendment-0413.pdf.
Diabetes UK (2014) Diabetes prevalence 2013. http://www.diabetes.org.uk/About_us/What-we-say/Statistics/Diabetes-prevalence-2013/.
Dow CA, Thomson CA, Flatt SW, Sherwood NE, Pakiz B & Rock CL (2013) Predictors of Improvement in Cardiometabolic Risk Factors With Weight Loss in Women. Journal of the American Heart Association 2, e000152.
Drogan D, Hoffmann K, Schulz M, Bergmann MM, Boeing H & Weikert C (2007) A food pattern predicting prospective weight change is associated with risk of fatal but not with nonfatal cardiovascular disease. Journal of Nutrition 137, 1961-1967.
Drummond S & Kirk T (1998) The effect of different types of dietary advice on body composition in a group of Scottish men. Journal of Human Nutrition and Dietetics 11, 473-485.
Drummond S, Kirk T, Jackson J, Hendry J, Panton S & Gray F (2003) Effectiveness of dietary advice given by community dietitians to men with elevated blood cholesterol in a clinical setting: a pilot study. Journal of Human Nutrition and Dietetics 16, 81-83.
Du H, van der A DL Boshuizen HC, et al. (2010) Dietary fiber and subsequent changes in body weight and waist circumference in European men and women. Am J Clin Nutr 91, 329-336.
Due A, Larsen TM, Hermansen K, Stender S, Holst JJ, Toubro S, Martinussen T & Astrup A (2008a) Comparison of the effects on insulin resistance and glucose tolerance of 6-mo high-monounsaturated-fat, low-fat, and control diets. American Journal of Clinical Nutrition 87, 855-862.
Due A, Larsen TM, Mu H, Hermansen K, Stender S & Astrup A (2008b) Comparison of 3 ad libitum diets for weight-loss maintenance, risk of cardiovascular disease, and diabetes: a 6-mo randomized, controlled trial. American Journal of Clinical Nutrition 88, 1232-1241.
318
Due A, Toubro S, Skov AR & Astrup A (2004) Effect of normal-fat diets, either medium or high in protein, on body weight in overweight subjects: a randomised 1-year trial. International Journal of Obesity 28, 1283-1290.
Due A, Toubro S, Stender S, Skov AR & Astrup A (2005) The effect of diets high in protein or carbohydrate on inflammatory markers in overweight subjects. Diabetes Obes Metab 7, 223-229.
Duggal MS, Toumba KJ, Amaechi BT, Kowash MB & Higham SM (2001) Enamel demineralization in situ with various frequencies of carbohydrate consumption with and without fluoride toothpaste. J Dent Res 80, 1721-1724.
Dugmore CR & Rock WP (2004) A multifactorial analysis of factors associated with dental erosion. Br Dent J 196, 283-286.
Dunn S, Datta A, Kallis S, Law E, Myers CE & Whelan K (2011) Validation of a food frequency questionnaire to measure intakes of inulin and oligofructose. Eur J Clin Nutr 65, 402-408.
Dyson PA, Beatty S & Matthews DR (2007) A low-carbohydrate diet is more effective in reducing body weight than healthy eating in both diabetic and non-diabetic subjects. Diabet Med 24, 1430-1435.
Ebbeling CB, Feldman HA, Chomitz VR, Antonelli TA, Gortmaker SL, Osganian SK & Ludwig DS (2012) A randomized trial of sugar-sweetened beverages and adolescent body weight. N Engl J Med 367, 1407-1416.
Ebbeling CB, Leidig MM, Feldman HA, Lovesky MM & Ludwig DS (2007) Effects of a low-glycemic load vs low-fat diet in obese young adults: a randomized trial.[erratum appears in JAMA. 2007 Aug 8;298(6):627]. JAMA 297, 2092-2102.
Ebbeling CB, Leidig MM, Sinclair KB, Hangen JP & Ludwig DS (2003) A reduced-glycemic load diet in the treatment of adolescent obesity. Arch Pediatr Adolesc Med 157, 773-779.
Ebbeling CB, Leidig MM, Sinclair KB, Seger-Shippee LG, Feldman HA & Ludwig DS (2005) Effects of an ad libitum low-glycemic load diet on cardiovascular disease risk factors in obese young adults. American Journal of Clinical Nutrition 81, 976-982.
Eelderink C, Moerdijk-Poortvliet TCW, Wang H, Schepers M, Preston T, Boer T, Vonk RJ, Schierbeek H & Priebe MG (2012a) The Glycemic Response Does Not Reflect the In Vivo Starch Digestibility of Fiber-Rich Wheat Products in Healthy Men. The Journal of Nutrition 142, 258-263.
Eelderink C, Schepers M, Preston T, Vonk RJ, Oudhuis L & Priebe MG (2012b) Slowly and rapidly digestible starchy foods can elicit a similar glycemic response because of differential tissue glucose uptake in healthy men. The American Journal of Clinical Nutrition 96, 1017-1024.
Effertz ME, Denman P & Slavin JL (1991) The effect of soy polysaccharide on body weight, serum lipids, blood glucose, and fecal parameters in moderately obese adults. Nutrition Research 11, 849-859.
319

EFSA (2009) Review of labelling reference intake values for selected nutritional elements. EFSA Journal 1008, 1-14.
EFSA (2010a) Scientific Opinion on Dietary Reference Values for carbohydrates and dietary fibre. EFSA Journal 8, 1462.
EFSA (2010b) Scientific Opinion on the substantiation of a health claim related to whole grain (ID 831, 832, 833, 1126, 1268, 1269, 1270, 1271, 1431) pursuant to Article 13(1) of Regulation (EC) No 1924/2006. EFSA Journal 8, 1766.
EFSA (2015) Scientific Opinion on the safety of the proposed extension of use of erythritol (E 968) as a food additive. EFSA Journal 13, 4033.
El Aidi H, Bronkhorst EM, Huysmans MCDN & Truin GJ (2011) Multifactorial Analysis of Factors Associated with the Incidence and Progression of Erosive Tooth Wear. Caries Res 45, 303-312.
Elia M & Cummings JH (2007) Physiological aspects of energy metabolism and gastrointestinal effects of carbohydrates. Eur J Clin Nutr 61, S40-S74.
Ells LJ, Seal CJ, Kettlitz B, Bal W & Mathers JC (2005) Postprandial glycaemic, lipaemic and haemostatic responses to ingestion of rapidly and slowly digested starches in healthy young women. British Journal of Nutrition 94, 948-955.
Elmer TB, Langford JW & Morris AJ (2014) An alternative marker for the effectiveness of water fluoridation: hospital extraction rates for dental decay, a two-region study. Br Dent J 216, E10.
Englyst HN, Kingman SM & Cummings JH (1992) Classification and measurement of nutritionally important starch fractions. European Journal of Clinical Nutrition 46, S33-S50.
Englyst HN, Quigley ME & Hudson GJ (1994) Determination of dietary fibre as non- starch polysaccharides with gas-liquid chromatographic, high-performance liquid chromatographic or spectrophotometric measurement of constituent sugars. Analyst 119, 1497-1509.
Englyst KN, Liu S & Englyst HN (2007) Nutritional characterization and measurement of dietary carbohydrates. European Journal of Clinical Nutrition 61, S19-S39.
Ericson U, Sonestedt E, Gullberg B, Hellstrand S, Hindy G, Wirfalt E & Orho-Melander M (2013) High intakes of protein and processed meat associate with increased incidence of type 2 diabetes. Br J Nutr 109, 1143-1153.
Eshak ES, Iso H, Date C, Kikuchi S, Watanabe Y, Wada Y, Wakai K, Tamakoshi A & JACC JACC (2010) Dietary fiber intake is associated with reduced risk of mortality from cardiovascular disease among Japanese men and women. Journal of Nutrition 140, 1445-1453.
Eshak ES, Iso H, Mizoue T, Inoue M, Noda M & Tsugane S (2013) Soft drink, 100% fruit juice, and vegetable juice intakes and risk of diabetes mellitus. Clin Nutr 32, 300-308.
320
Esrey KL, Joseph L & Grover SA (1996) Relationship between dietary intake and coronary heart disease mortality: lipid research clinics prevalence follow-up study. Journal of Clinical Epidemiology 49, 211-216.
Fagherazzi G, Vilier A, Saes Sartorelli D, Lajous M, Balkau B & Clavel-Chapelon F (2013) Consumption of artificially and sugar-sweetened beverages and incident type 2 diabetes in the Etude Etude Epidémiologique auprès des femmes de la Mutuelle Générale de l'Education Nationale−European Prospective Investigation into Cancer and Nutrition cohort. The American Journal of Clinical Nutrition 97, 517-523.
Fallani M, Young D, Scott J, et al. (2010) Intestinal microbiota of 6-week-old infants across Europe: geographic influence beyond delivery mode, breast-feeding, and antibiotics. J Pediatr Gastroenterol Nutr 51, 77-84.
Fanaro S, Jelinek J, Stahl B, Boehm G, Kock R & Vigi V (2005) Acidic oligosaccharides from pectin hydrolysate as new component for infant formulae: effect on intestinal flora, stool characteristics, and pH. Journal of Pediatric Gastroenterology & Nutrition 41, 186-190.
Fanaro S, Marten B, Bagna R, et al. (2009) Galacto-oligosaccharides are bifidogenic and safe at weaning: a double-blind randomized multicenter study. Journal of Pediatric Gastroenterology & Nutrition 48, 82-88.
FAO (2003) Food energy – methods of analysis and conversion factors. Report of a Technical Workshop no. 77. Rome: FAO.
FAO/WHO (1998) Carbohydrates in human nutrition. Report of a joint FAO/WHO expert consultation. FAO Food and Nutrition Paper. no. 66. Rome: FAO.
FAO/WHO (2010) Codex Alimentarius guidelines on nutrition labelling CAC/GL 2-1985. Rome: FAO.
Farchi G, Fidanza F, Grossi P, Lancia A, Mariotti S & Menotti A (1995) Relationship between eating patterns meeting recommendations and subsequent mortality in 20 years. European Journal of Clinical Nutrition 49, 408-419.
Fastinger ND, Karr-Lilienthal LK, Spears JK, Swanson KS, Zinn KE, Nava GM, Ohkuma K, Kanahori S, Gordon DT & Fahey GC, Jr. (2008) A novel resistant maltodextrin alters gastrointestinal tolerance factors, fecal characteristics, and fecal microbiota in healthy adult humans. Journal of the American College of Nutrition 27, 356-366.
Fehily AM, Yarnell JW, Sweetnam PM & Elwood PC (1993) Diet and incident ischaemic heart disease: the Caerphilly Study. British Journal of Nutrition 69, 303-314.
Feinman RD & Fine EJ (2013) Fructose in perspective. Nutr Metab (Lond) 10, 45.
Fenn GC, Wilkinson PD, Lee CE & Akbar FA (1986) A general practice study of the efficacy of Regulan in functional constipation. British Journal of Clinical Practice 40, 192-197.
Ferreira MA, Frias AC & Antunes JL (2011) The incidence of dental caries in children and adolescents who have cerebral palsy and are participating in a dental program in Brazil. Spec Care Dentist 31, 210-215.
321
Feskens EJ, Virtanen SM, Rasanen L, Tuomilehto J, Stengard J, Pekkanen J, Nissinen A & Kromhout D (1995) Dietary factors determining diabetes and impaired glucose tolerance. A 20-year follow-up of the Finnish and Dutch cohorts of the Seven Countries Study. Diabetes Care 18, 1104-1112.
Finlay M (1988) The use of dietary fibre in a long-stay geriatric ward. J Nutr Elder 8, 19-30.
Finn AV, Kolodgie FD & Virmani R (2010) Correlation Between Carotid Intimal/Medial Thickness and Atherosclerosis: A Point of View From Pathology. Arterioscler Thromb Vasc Biol 30, 177-181.
Finn SB, Frew RA, Leibowitz R, Morse W, Manson-Hing L & Brunelle J (1978) The effect of sodium trimetaphosphate (TMP) as a chewing gum additive on caries increments in children. J Am Dent Assoc 96, 651-655.
Finney M, Smullen J, Foster HA, Brokx S & Storey DM (2007) Effects of low doses of lactitol on faecal microflora, pH, short chain fatty acids and gastrointestinal symptomology. European Journal of Nutrition 46, 307-314.
Fiorito LM, Marini M, Francis LA, Smiciklas-Wright H & Birch LL (2009) Beverage intake of girls at age 5 y predicts adiposity and weight status in childhood and adolescence. American Journal of Clinical Nutrition 90, 935-942.
Fisher E, Boeing H, Fritsche A, Doering F, Joost HG & Schulze MB (2009) Whole-grain consumption and transcription factor-7-like 2 (TCF7L2) rs7903146: gene-diet interaction in modulating type 2 diabetes risk. British Journal of Nutrition 101, 478-481.
Flegal KM, Kit BK, Orpana H & Graubard BI (2013) Association of all-cause mortality with overweight and obesity using standard body mass index categories: a systematic review and meta-analysis. JAMA 309, 71-82.
Flint AJ, Hu FB, Glynn RJ, Jensen MK, Franz M, Sampson L & Rimm EB (2009) Whole grains and incident hypertension in men. American Journal of Clinical Nutrition 90, 493-498.
Fontana M, Jackson R, Eckert G, Swigonski N, Chin J, Zandona AF, Ando M, Stookey GK, Downs S & Zero DT (2011) Identification of caries risk factors in toddlers. J Dent Res 90, 209-214.
Forcheron F & Beylot M (2007) Long-term administration of inulin-type fructans has no significant lipid-lowering effect in normolipidemic humans. Metabolism 56, 1093-1098.
Foresight (2007) Tackling Obesities: Future Choices. http://www.bis.gov.uk/assets/foresight/docs/obesity/17.pdf.
Foster GD, Wyatt HR, Hill JO, et al. (2010) Weight and metabolic outcomes after 2 years on a low-carbohydrate versus low-fat diet: a randomized trial. Annals of Internal Medicine 153, 147-157.
Foster GD, Wyatt HR, Hill JO, McGuckin BG, Brill C, Mohammed BS, Szapary PO, Rader DJ, Edman JS & Klein S (2003) A randomized trial of a low-carbohydrate diet for obesity. N Engl J Med 348, 2082-2090.
322
Francois IE, Lescroart O, Veraverbeke WS, et al. (2012) Effects of a wheat bran extract containing arabinoxylan oligosaccharides on gastrointestinal health parameters in healthy adult human volunteers: a double-blind, randomised, placebo-controlled, cross-over trial. British Journal of Nutrition 108, 2229-2242.
Fraser GE, Sabate J, Beeson WL & Strahan TM (1992) A possible protective effect of nut consumption on risk of coronary heart disease. The Adventist Health Study. Archives of Internal Medicine 152, 1416-1424.
Freedman LS, Schatzkin A, Thiebaut ACM, Potischman N, Subar AF, Thompson FE & Kipnis V (2007) Abandon neither the Food Frequency Questionnaire nor the Dietary Fat-Breast Cancer Hypothesis. Cancer Epidemiology Biomarkers & Prevention 16, 1321-1322.
Frisch S, Zittermann A, Berthold HK, Gotting C, Kuhn J, Kleesiek K, Stehle P & Kortke H (2009) A randomized controlled trial on the efficacy of carbohydrate-reduced or fat-reduced diets in patients attending a telemedically guided weight loss program. Cardiovasc Diabetol 8, 36.
Fuller Z, Louis P, Mihajlovski A, Rungapamestry V, Ratcliffe B & Duncan AJ (2007) Influence of cabbage processing methods and prebiotic manipulation of colonic microflora on glucosinolate breakdown in man. British Journal of Nutrition 98, 364-372.
Fung TT, Hu FB, Pereira MA, Liu S, Stampfer MJ, Colditz GA & Willett WC (2002) Whole-grain intake and the risk of type 2 diabetes: a prospective study in men. American Journal of Clinical Nutrition 76, 535-540.
Gamborg M, Byberg L, Rasmussen F, et al. (2007) Birth weight and systolic blood pressure in adolescence and adulthood: meta-regression analysis of sex- and age-specific results from 20 Nordic studies. Am J Epidemiol 166, 634-645.
Garcia AL, Otto B, Reich SC, et al. (2007) Arabinoxylan consumption decreases postprandial serum glucose, serum insulin and plasma total ghrelin response in subjects with impaired glucose tolerance. European Journal of Clinical Nutrition 61, 334-341.
Garcia AL, Steiniger J, Reich SC, et al. (2006) Arabinoxylan fibre consumption improved glucose metabolism, but did not affect serum adipokines in subjects with impaired glucose tolerance. Horm Metab Res 38, 761-766.
García-Godoy F & Hicks MJ (2008) Maintaining the integrity of the enamel surface: The role of dental biofilm, saliva and preventive agents in enamel demineralization and remineralization. The Journal of the American Dental Association 139, 25S-34S.
Gardner CD, Kiazand A, Alhassan S, Kim S, Stafford RS, Balise RR, Kraemer HC & King AC (2007) Comparison of the Atkins, Zone, Ornish, and LEARN diets for change in weight and related risk factors among overweight premenopausal women: the A TO Z Weight Loss Study: a randomized trial. [erratum appears in JAMA. 2007 Jul 11;298(2):178]. JAMA 297, 969-977.
Genta S, Cabrera W, Habib N, Pons J, Carillo IM, Grau A & Sanchez S (2009) Yacon syrup: Beneficial effects on obesity and insulin resistance in humans. Clinical Nutrition 28, 182-187.
323
George SM, Mayne ST, Leitzmann MF, Park Y, Schatzkin A, Flood A, Hollenbeck A & Subar AF (2009) Dietary glycemic index, glycemic load, and risk of cancer: a prospective cohort study. Am J Epidemiol 169, 462-472.
Ginsberg HN, Kris-Etherton P, Dennis B, et al. (1998) Effects of reducing dietary saturated fatty acids on plasma lipids and lipoproteins in healthy subjects – The Delta Study, protocol 1. Arterioscler Thromb Vasc Biol 18, 441-449.
Glass RL (1983) A two-year clinical trial of sorbitol chewing gum. Caries Res 17, 365-368.
Godfrey K, Robinson S, Barker DJ, Osmond C & Cox V (1996) Maternal nutrition in early and late pregnancy in relation to placental and fetal growth. BMJ 312, 410-414.
Gogebakan O, Kohl A, Osterhoff MA, et al. (2011) Effects of weight loss and long-term weight maintenance with diets varying in protein and glycemic index on cardiovascular risk factors: the diet, obesity, and genes (DiOGenes) study: a randomized, controlled trial. Circulation 124, 2829-2838.
Golay A, Allaz AF, Morel Y, de TN, Tankova S & Reaven G (1996) Similar weight loss with low- or high-carbohydrate diets. American Journal of Clinical Nutrition 63, 174-178.
Golay A, Allaz AF, Ybarra J, Bianchi P, Saraiva S, Mensi N, Gomis R & de TN (2000) Similar weight loss with low-energy food combining or balanced diets. International Journal of Obesity 24, 492-496.
Goldberg IJ, Eckel RH & McPherson R (2011) Triglycerides and heart disease: still a hypothesis? Arterioscler Thromb Vasc Biol 31, 1716-1725.
Gopal PK, Prasad J & Gill HS (2003) Effects of the consumption of Bifidobacterium lactis HN019 (DR10[trademark]) and galacto-oligosaccharides on the microflora of the gastrointestinal tract in human subjects. Nutrition Research 23, 1313-1328.
Gordon DJ & Rifkind BM (1989) High-Density Lipoprotein - the Clinical Implications of Recent Studies. N Engl J Med 321, 1311-1316.
Goree LL, Chandler-Laney P, Ellis AC, Casazza K, Granger WM & Gower BA (2011) Dietary macronutrient composition affects beta cell responsiveness but not insulin sensitivity. American Journal of Clinical Nutrition 94, 120-127.
Gostner A, Blaut M, Schaffer V, et al. (2006) Effect of isomalt consumption on faecal microflora and colonic metabolism in healthy volunteers. British Journal of Nutrition 95, 40-50.
Gostner A, Schaffer V, Theis S, et al. (2005) Effects of isomalt consumption on gastrointestinal and metabolic parameters in healthy volunteers. British Journal of Nutrition 94, 575-581.
Grasten SM, Juntunen KS, Matto J, Mykkanen OT, El-Nezami H, Adlercreutz H, Poutanen KS & Mykkanen HM (2007) High-fiber rye bread improves bowel function in postmenopausal women but does not cause other putatively positive changes in the metabolic activity of intestinal microbiota. Nutrition Research 27, 454-461.
324
Grasten SM, Juntunen KS, Poutanen KS, Gylling HK, Miettinen TA & Mykkanen HM (2000) Rye bread improves bowel function and decreases the concentrations of some compounds that are putative colon cancer risk markers in middle-aged women and men. Journal of Nutrition 130, 2215-2221.
Grau K, Hansen T, Holst C, et al. (2009) Macronutrient-specific effect of FTO rs9939609 in response to a 10-week randomized hypo-energetic diet among obese Europeans. International Journal of Obesity 33, 1227-1234.
Grau K, Tetens I, Bjornsbo KS & Heitman BL (2011) Overall glycaemic index and glycaemic load of habitual diet and risk of heart disease. Public Health Nutrition 14, 109-118.
Gray DL, O'Brien KD, D'Alessio DA, Brehm BJ & Deeg MA (2008) Plasma glycosylphosphatidylinositol-specific phospholipase D predicts the change in insulin sensitivity in response to a low-fat but not a low-carbohydrate diet in obese women. Metabolism 57, 473-478.
Greenberg I, Stampfer MJ, Schwarzfuchs D, Shai I & DIRECT Group (2009) Adherence and success in long-term weight loss diets: the dietary intervention randomized controlled trial (DIRECT). Journal of the American College of Nutrition 28, 159-168.
Greenwood DC, Threapleton DE, Evans CE, Cleghorn CL, Nykjaer C, Woodhead C & Burley VJ (2013) Glycemic index, glycemic load, carbohydrates, and type 2 diabetes: systematic review and dose-response meta-analysis of prospective studies. Diabetes Care 36, 4166-4171.
Greenwood DC, Threapleton DE, Evans CE, Cleghorn CL, Nykjaer C, Woodhead C & Burley VJ (2014) Association between sugar-sweetened and artificially sweetened soft drinks and type 2 diabetes: systematic review and dose-response meta-analysis of prospective studies. Br J Nutr 112, 725-734.
Griffin IJ & Abrams SA (2005) Methodological considerations in measuring human calcium absorption: Relevance to study the effects of inulin-type fructans. British Journal of Nutrition 93, S105-S110.
Griffin IJ, Hicks PMD, Heaney RP & Abrams SA (2003) Enriched chicory inulin increases calcium absorption mainly in girls with lower calcium absorption. Nutrition Research 23, 901-909.
Grindefjord M, Dahllof G, Nilsson B & Modeer T (1995) Prediction of dental caries development in 1-year-old children. Caries Res 29, 343-348.
Grindefjord M, Dahllof G, Nilsson B & Modeer T (1996) Stepwise prediction of dental caries in children up to 3.5 years of age. Caries Res 30, 256-266.
Grytten J, Rossow I, Holst D & Steele L (1988) Longitudinal study of dental health behaviors and other caries predictors in early childhood. Community Dentistry & Oral Epidemiology 16, 356-359.
Gulseth HL, Gjelstad IM, Tierney AC, et al. (2010) Dietary fat modifications and blood pressure in subjects with the metabolic syndrome in the LIPGENE dietary intervention study. British Journal of Nutrition 104, 160-163.
325
Gunderson EP, Lewis CE, Tsai A-L, Chiang V, Carnethon M, Quesenberry J & Sidney S (2007) A 20-year prospective study of childbearing and incidence of diabetes in young women, controlling for glycemia before conception: The coronary artery risk development in young adults (CARDIA) study. Diabetes 56, 2990-2996.
Halton TL, Willett WC, Liu S, Manson JE, Stampfer MJ & Hu FB (2006) Potato and french fry consumption and risk of type 2 diabetes in women. American Journal of Clinical Nutrition 83, 284-290.
Hansen L, Skeie G, Landberg R, et al. (2012) Intake of dietary fiber, especially from cereal foods, is associated with lower incidence of colon cancer in the HELGA cohort. International Journal of Cancer 131, 469-478.
Harder T, Rodekamp E, Schellong K, Dudenhausen JW & Plagemann A (2007) Birth weight and subsequent risk of type 2 diabetes: a meta-analysis. Am J Epidemiol 165, 849-857.
Hardy DS, Hoelscher DM, Aragaki C, Stevens J, Steffen LM, Pankow JS & Boerwinkle E (2010) Association of glycemic index and glycemic load with risk of incident coronary heart disease among Whites and African Americans with and without type 2 diabetes: the Atherosclerosis Risk in Communities study. Annals of Epidemiology 20, 610-616.
Harvey-Berino J (1998) The efficacy of dietary fat vs. total energy restriction for weight loss. Obes Res 6, 202-207.
Haskell WL, Spiller GA, Jensen CD, Ellis BK & Gates JE (1992) Role of water-soluble dietary fiber in the management of elevated plasma cholesterol in healthy subjects. Am J Cardiol 69, 433-439.
Haste FM, Brooke OG, Anderson HR & Bland JM (1991) The effect of nutritional intake on outcome of pregnancy in smokers and non-smokers. Br J Nutr 65, 347-354.
Haufe S, Engeli S, Kast P, et al. (2011) Randomized comparison of reduced fat and reduced carbohydrate hypocaloric diets on intrahepatic fat in overweight and obese human subjects. Hepatology 53, 1504-1514.
Hawksworth G, Drasar BS & Hili MJ (1971) Intestinal Bacteria And The Hydrolysis Of Glycosidic Bonds. Journal of Medical Microbiology 4, 451-459.
Hays NP, Bathalon GP, Roubenoff R, McCrory MA & Roberts SB (2006) Eating behavior and weight change in healthy postmenopausal women: Results of a 4-year longitudinal study. Journals of Gerontology Series A-Biological Sciences and Medical Sciences 61, 608-615.
He J, Streiffer RH, Muntner P, Krousel-Wood MA & Whelton PK (2004) Effect of dietary fiber intake on blood pressure: a randomized, double-blind, placebo-controlled trial. J Hypertens 22, 73-80.
He J & Whelton PK (1999) Elevated systolic blood pressure as a risk factor for cardiovascular and renal disease. J Hypertens Suppl 17, S7-13.
326
Health and Social Care Information Centre (2013a) Health Survey for England 2012. http://www.hscic.gov.uk/searchcatalogue?productid=13887&returnid=1685.
Health and Social Care Information Centre (2013b) National Child Measurement Programme England 2012/13 School Year. http://www.hscic.gov.uk/catalogue/PUB13115/nati-chil-meas-prog-eng-2012-2013-rep. pdf
Hedrick VE, Dietrich AM, Estabrooks PA, Savla J, Serrano E & Davy BM (2012) Dietary biomarkers: advances, limitations and future directions. Nutr J 11, 109.
Heijnen ML, van Amelsvoort JM, Deurenberg P & Beynen AC (1996) Neither raw nor retrograded resistant starch lowers fasting serum cholesterol concentrations in healthy normolipidemic subjects. American Journal of Clinical Nutrition 64, 312-318.
Heijnen MLA, Van Amelsvoort JMM, Deurenberg P & Beynen AC (1998) Limited effect of consumption of uncooked (RS2) or retrograded (RS3) resistant starch on putative risk factors for colon cancer in healthy men. American Journal of Clinical Nutrition 67, 322-331.
Heini AF, Lara-Castro C, Schneider H, Kirk KA, Considine RV & Weinsier RL (1998) Effect of hydrolyzed guar fiber on fasting and postprandial satiety and satiety hormones: a double-blind, placebo-controlled trial during controlled weight loss. International Journal of Obesity 22, 906-909.
Helge JW (2002) Prolonged adaptation to fat-rich diet and training; effects on body fat stores and insulin resistance in man. International Journal of Obesity 26, 1118-1124.
Henderson L, Gregory J, Irving K & Swan G (2003) The National Diet and Nutrition Survey: adults aged 19 to 64 years. volume 2: energy, protein, carbohydrate, fat and alcohol intake. London: TSO.
Hengst C, Ptok S, Roessler A, Fechner A & Jahreis G (2008) Effects of polydextrose supplementation on different faecal parameters in healthy volunteers. Int J Food Sci Nutr 23, 1-10.
Herrmann TS, Bean ML, Black TM, Wang P & Coleman RA (2001) High glycemic index carbohydrate diet alters the diurnal rhythm of leptin but not insulin concentrations. Exp Biol Med 226, 1037-1044.
Hetherington MM, Cunningham K, Dye L, Gibson EL, Gregersen NT, Halford JC, Lawton CL, Lluch A, Mela DJ & Van Trijp HC (2013) Potential benefits of satiety to the consumer: scientific considerations. Nutr Res Rev 26, 22-38.
Higginbotham S, Zhang ZF, Lee IM, Cook NR, Giovannucci E, Buring JE & Liu S (2004) Dietary glycemic load and risk of colorectal cancer in the Women's Health Study. J Natl Cancer Inst 96, 229-233.
Higgins PDR & Johanson JF (2004) Epidemiology of Constipation in North America: A Systematic Review. Am J Gastroenterol 99, 750-759.
327
Hillman L, Peters S, Fisher A & Pomare EW (1983) Differing effects of pectin, cellulose and lignin on stool pH, transit time and weight. British Journal of Nutrition 50, 189-195.
Hodge AM, English DR, O'Dea K & Giles GG (2004) Glycemic index and dietary fiber and the risk of type 2 diabetes. Diabetes Care 27, 2701-2706.
Holbrook WP (1993) Dental caries and cariogenic factors in pre-school urban Icelandic children. Caries Res 27, 431-437.
Holbrook WP, Arnadottir IB, Takazoe I, Birkhed D & Frostell G (1995) Longitudinal study of caries, cariogenic bacteria and diet in children just before and after starting school. Eur J Oral Sci 103, 42-45.
Holloway L, Moynihan S, Abrams SA, Kent K, Hsu AR & Friedlander AL (2007) Effects of oligofructose-enriched inulin on intestinal absorption of calcium and magnesium and bone turnover markers in postmenopausal women. British Journal of Nutrition 97, 365-372.
Holma R, Hongisto SM, Saxelin M & Korpela R (2010) Constipation is relieved more by rye bread than wheat bread or laxatives without increased adverse gastrointestinal effects. Journal of Nutrition 140, 534-541.
Hongisto SM, Paajanen L, Saxelin M & Korpela R (2006) A combination of fibre-rich rye bread and yoghurt containing Lactobacillus GG improves bowel function in women with self-reported constipation. European Journal of Clinical Nutrition 60, 319-324.
Hooper S, West NX, Sharif N, Smith S, North M, De'Ath J, Parker DM, Roedig-Penman A & Addy M (2004) A comparison of enamel erosion by a new sports drink compared to two proprietary products: a controlled, crossover study in situ. J Dent 32, 541-545.
Hooper SM, Hughes JA, Newcombe RG, Addy M & West NX (2005) A methodology for testing the erosive potential of sports drinks. J Dent 33, 343-348.
Hopping BN, Erber E, Grandinetti A, Verheus M, Kolonel LN & Maskarinec G (2010) Dietary fiber, magnesium, and glycemic load alter risk of type 2 diabetes in a multiethnic cohort in Hawaii. Journal of Nutrition 140, 68-74.
Howard BV, Curb JD, Eaton CB, et al. (2010) Low-fat dietary pattern and lipoprotein risk factors: the Women's Health Initiative Dietary Modification Trial. American Journal of Clinical Nutrition 91, 860-874.
Howard BV, Manson JE, Stefanick ML, et al. (2006a) Low-fat dietary pattern and weight change over 7 years: the Women's Health Initiative Dietary Modification Trial. JAMA 295, 39-49.
Howard BV, Van HL, Hsia J, et al. (2006b) Low-fat dietary pattern and risk of cardiovascular disease: the Women's Health Initiative Randomized Controlled Dietary Modification Trial. JAMA 295, 655-666.
Howard LV, West D & Ossip-Klein DJ (2000) Chronic constipation management for institutionalized older adults. [erratum appears in GERIATR NURS 2000 May-Jun; 21(3): 119]. Geriatric Nursing 21, 78-84.
328
Howarth NC, Murphy SP, Wilkens LR, Henderson BE & Kolonel LN (2008) The association of glycemic load and carbohydrate intake with colorectal cancer risk in the Multiethnic Cohort Study. American Journal of Clinical Nutrition 88, 1074-1083.
Hu EA, Pan A, Malik VS & Sun Q (2012) White rice consumption and risk of type 2 diabetes: meta-analysis and systematic review. BMJ 344, e1454.
Hughes JA, Jandt KD, Baker N, Parker D, Newcombe RG, Eisenburger M & Addy M (2002) Further modification to soft drinks to minimise erosion: a study in situ. Caries Res 36, 70-75.
Hughes JA, West NX, Parker DM, Newcombe RG & Addy M (1999a) Development and evaluation of a low erosive blackcurrant juice drink in vitro and in situ. 1. Comparison with orange juice. J Dent 27, 285-289.
Hughes JA, West NX, Parker DM, Newcombe RG & Addy M (1999b) Development and evaluation of a low erosive blackcurrant juice drink. 3. Final drink and concentrate, formulae comparisons in situ and overview of the concept. J Dent 27, 345-350.
Hunninghake DB, Miller VT, LaRosa JC, Kinosian B, Brown V, Howard WJ, DiSerio FJ & O'Connor RR (1994) Hypocholesterolemic effects of a dietary fiber supplement. American Journal of Clinical Nutrition 59, 1050-1054.
Institute of Medicine (2005) Dietary reference intakes for energy, carbohydrate, fiber, fat, fatty acids, cholesterol, protein, and amino acids. Washington DC: National Academies Press.
Iqbal SI, Helge JW & Heitmann BL (2006) Do energy density and dietary fiber influence subsequent 5-year weight changes in adult men and women? Obesity 14, 106-114.
Ishikawa H, Akedo I, Otani T, Suzuki T, Nakamura T, Takeyama I, Ishiguro S, Miyaoka E, Sobue T & Kakizoe T (2005) Randomized trial of dietary fiber and Lactobacillus casei administration for prevention of colorectal tumors. Int J Cancer 116, 762-767.
Ismail AI, Lim S, Sohn W & Willem JM (2008) Determinants of early childhood caries in low-income African American young children. Pediatr Dent 30, 289-296.
Ismail AI, Sohn W, Lim S & Willem JM (2009) Predictors of dental caries progression in primary teeth. J Dent Res 88, 270-275.
Ito M, Deguchi Y, Miyamori A, Matsumoto K, Kikuchi H, Kobayashi Y, Yajima T & Kan T (1990) Effects of Administration of Galactooligosaccharides on the Human Faecal Microflora, Stool Weight and Abdominal Sensation. Microbial Ecology in Health and Disease 3, 285-292.
Jackson KG, Taylor GR, Clohessy AM & Williams CM (1999) The effect of the daily intake of inulin on fasting lipid, insulin and glucose concentrations in middle-aged men and women. British Journal of Nutrition 82, 23-30.
Jacobs DR, Jr., Andersen LF & Blomhoff R (2007) Whole-grain consumption is associated with a reduced risk of noncardiovascular, noncancer death attributed to inflammatory diseases in the Iowa Women's Health Study. American Journal of Clinical Nutrition 85, 1606-1614.
329
Jacobs DR, Jr., Meyer HE & Solvoll K (2001) Reduced mortality among whole grain bread eaters in men and women in the Norwegian County Study. European Journal of Clinical Nutrition 55, 137-143.
Jacobs DR, Jr., Meyer KA, Kushi LH & Folsom AR (1998) Whole-grain intake may reduce the risk of ischemic heart disease death in postmenopausal women: the Iowa Women's Health Study. American Journal of Clinical Nutrition 68, 248-257.
Jacobs ET, Lanza E, Alberts DS, Hsu CH, Jiang R, Schatzkin A, Thompson PA & Martinez ME (2006) Fiber, sex, and colorectal adenoma: results of a pooled analysis. Am J Clin Nutr 83, 343-349.
Jahren AH, Bostic JN & Davy BM (2014) The potential for a carbon stable isotope biomarker of dietary sugar intake. J Anal At Spectrom 29, 795-816.
James J, Thomas P, Cavan D & Kerr D (2004) Preventing childhood obesity by reducing consumption of carbonated drinks: cluster randomised controlled trial. [erratum appears in BMJ. 2004 May 22;328(7450):1236]. British Medical Journal 328, 1237.
James J, Thomas P & Kerr D (2007) Preventing childhood obesity: two year follow-up results from the Christchurch obesity prevention programme in schools (CHOPPS). BMJ 335, 762.
Janket SJ, Manson JE, Sesso H, Buring JE & Liu S (2003) A prospective study of sugar intake and risk of type 2 diabetes in women. Diabetes Care 26, 1008-1015.
Janner JH, Godtfredsen NS, Ladelund S, Vestbo J & Prescott E (2012) The association between aortic augmentation index and cardiovascular risk factors in a large unselected population. J Hum Hypertens 26, 476-484.
Jebb SA, Lovegrove JA, Griffin BA, Frost GS, Moore CS, Chatfield MD, Bluck LJ, Williams CM, Sanders TA & RISCK RISC (2010) Effect of changing the amount and type of fat and carbohydrate on insulin sensitivity and cardiovascular risk: the RISCK (Reading, Imperial, Surrey, Cambridge, and Kings) trial. American Journal of Clinical Nutrition 92, 748-758.
Jenkins DJ, Hill MS & Cummings JH (1975) Effect of wheat fiber on blood lipids, fecal steroid excretion and serum iron. American Journal of Clinical Nutrition 28, 1408-1411.
Jenkins DJ, Kendall CW, Vuksan V, et al. (1999a) The effect of wheat bran particle size on laxation and colonic fermentation. Journal of the American College of Nutrition 18, 339-345.
Jenkins DJ, Kendall CW, Vuksan V, et al. (1999b) Effect of wheat bran on serum lipids: influence of particle size and wheat protein. Journal of the American College of Nutrition 18, 159-165.
Jenkins DJ, Kendall CW, Vuksan V, Vidgen E, Wong E, Augustin LS & Fulgoni V, III (2000) Effect of cocoa bran on low-density lipoprotein oxidation and fecal bulking. Archives of Internal Medicine 160, 2374-2379.
330
Jenkins DJ, Vuksan V, Kendall CW, Wursch P, Jeffcoat R, Waring S, Mehling CC, Vidgen E, Augustin LS & Wong E (1998) Physiological effects of resistant starches on fecal bulk, short chain fatty acids, blood lipids and glycemic index. Journal of the American College of Nutrition 17, 609-616.
Jenkins DJ, Vuksan V, Rao AV, Vidgen E, Kendall CW, Tariq N, Wursch P, Koellreutter B, Shiwnarain N & Jeffcoat R (1999c) Colonic bacterial activity and serum lipid risk factors for cardiovascular disease. Metabolism: Clinical & Experimental 48, 264-268.
Jensen CD, Haskell W & Whittam JH (1997) Long-term effects of water-soluble dietary fiber in the management of hypercholesterolemia in healthy men and women. Am J Cardiol 79, 34-37.
Jensen L, Sloth B, Krog-Mikkelsen I, Flint A, Raben A, Tholstrup T, Brunner N & Astrup A (2008) A low-glycemic-index diet reduces plasma plasminogen activator inhibitor-1 activity, but not tissue inhibitor of proteinases-1 or plasminogen activator inhibitor-1 protein, in overweight women. American Journal of Clinical Nutrition 87, 97-105.
Jensen MK, Koh-Banerjee P, Hu FB, Franz M, Sampson L, Gronbaek M & Rimm EB (2004) Intakes of whole grains, bran, and germ and the risk of coronary heart disease in men. American Journal of Clinical Nutrition 80, 1492-1499.
Johnson L, Mander AP, Jones LR, Emmett PM & Jebb SA (2007) Is sugar-sweetened beverage consumption associated with increased fatness in children? Nutrition 23, 557-563.
Johnson L, Mander AP, Jones LR, Emmett PM & Jebb SA (2008) A prospective analysis of dietary energy density at age 5 and 7 years and fatness at 9 years among UK children. International Journal of Obesity 32, 586-593.
Johnson SK, Chua V, Hall RS & Baxter AL (2006) Lupin kernel fibre foods improve bowel function and beneficially modify some putative faecal risk factors for colon cancer in men. British Journal of Nutrition 95, 372-378.
Johnston CS, Tjonn SL & Swan PD (2004) High-protein, low-fat diets are effective for weight loss and favorably alter biomarkers in healthy adults. Journal of Nutrition 134, 586-591.
Johnston CS, Tjonn SL, Swan PD, White A, Hutchins H & Sears B (2006) Ketogenic low-carbohydrate diets have no metabolic advantage over nonketogenic low-carbohydrate diets. American Journal of Clinical Nutrition 83, 1055-1061.
Johnston L (1998) Cholesterol lowering benefits of a whole grain oat ready to eat cereal. Nutrition in Clinical Care 1, 6-12.
Johnston RD, Stephenson MC, Crossland H, Cordon SM, Palcidi E, Cox EF, Taylor MA, Aithal GP & Macdonald IA (2013) No Difference Between High-Fructose and High-Glucose Diets on Liver Triacylglycerol or Biochemistry in Healthy Overweight Men. Gastroenterology 145, 1016-1025.
331
Johnstone AM, Shannon E, Whybrow S, Reid CA & Stubbs RJ (2000) Altering the temporal distribution of energy intake with isoenergetically dense foods given as snacks does not affect total daily energy intake in normal-weight men. British Journal of Nutrition 83, 7-14.
Joosen AM, Kuhnle GG, Runswick SA & Bingham SA (2008) Urinary sucrose and fructose as biomarkers of sugar consumption: comparison of normal weight and obese volunteers. Int J Obes (Lond) 32, 1736-1740.
Joshipura KJ, Ascherio A, Manson JE, Stampfer MJ, Rimm EB, Speizer FE, Hennekens CH, Spiegelman D & Willett WC (1999) Fruit and vegetable intake in relation to risk of ischemic stroke. JAMA 282, 1233-1239.
Joshipura KJ, Hung HC, Li TY, Hu FB, Rimm EB, Stampfer MJ, Colditz G & Willett WC (2009) Intakes of fruits, vegetables and carbohydrate and the risk of CVD. Public Health Nutrition 12, 115-121.
Kallestal C & Fjelddahl A (2007) A four-year cohort study of caries and its risk factors in adolescents with high and low risk at baseline. Swed Dent J 31, 11-25.
Kalliomaki M, Kirjavainen P, Eerola E, Kero P, Salminen S & Isolauri E (2001) Distinct patterns of neonatal gut microflora in infants in whom atopy was and was not developing. J Allergy Clin Immunol 107, 129-134.
Kalliomaki M, Carmen Collado M, Salminen S & Isolauri E (2008) Early differences in fecal microbiota composition in children may predict overweight. Am J Clin Nutr 87, 534-538.
Kato I, Akhmedkhanov A, Koenig K, Toniolo PG, Shore RE & Riboli E (1997) Prospective study of diet and female colorectal cancer: the New York University Women's Health Study. Nutr Cancer 28, 276-281.
Kaushik S, Wang JJ, Wong TY, Flood V, Barclay A, Brand-Miller J & Mitchell P (2009) Glycemic index, retinal vascular caliber, and stroke mortality. Stroke 40, 206-212.
Keenan JM, Goulson M, Shamliyan T, Knutson N, Kolberg L & Curry L (2007) The effects of concentrated barley beta-glucan on blood lipids in a population of hypercholesterolaemic men and women. [erratum appears in Br J Nutr. 2007 Aug;98(2):445]. British Journal of Nutrition 97, 1162-1168.
Kelm M (2002) Flow-mediated dilatation in human circulation: diagnostic and therapeutic aspects. American Journal of Physiology - Heart and Circulatory Physiology 282, H1-H5.
Kelsay JL, Behall KM & Prather ES (1978) Effect of fiber from fruits and vegetables on metabolic responses of human subjects I. Bowel transit time, number of defecations, fecal weight, urinary excretions of energy and nitrogen and apparent digestibilities of energy, nitrogen, and fat. American Journal of Clinical Nutrition 31, 1149-1153.
Keogh JB, Brinkworth GD & Clifton PM (2007) Effects of weight loss on a low-carbohydrate diet on flow-mediated dilatation, adhesion molecules and adiponectin. British Journal of Nutrition 98, 852-859.
332
Keogh JB, Brinkworth GD, Noakes M, Belobrajdic DP, Buckley JD & Clifton PM (2008) Effects of weight loss from a very-low-carbohydrate diet on endothelial function and markers of cardiovascular disease risk in subjects with abdominal obesity. American Journal of Clinical Nutrition 87, 567-576.
Kerckhoffs DA, Hornstra G & Mensink RP (2003) Cholesterol-lowering effect of beta-glucan from oat bran in mildly hypercholesterolemic subjects may decrease when beta-glucan is incorporated into bread and cookies. American Journal of Clinical Nutrition 78, 221-227.
Kesaniemi YA, Tarpila S & Miettinen TA (1990) Low vs high dietary fiber and serum, biliary, and fecal lipids in middle-aged men. Am J Clin Nutr 51, 1007-1012.
Key TJ, Thorogood M, Appleby PN & Burr ML (1996) Dietary habits and mortality in 11,000 vegetarians and health conscious people: results of a 17 year follow up. British Medical Journal 313, 775-779.
Kim JY, Kim JH, Lee dH, Kim SH & Lee SS (2008) Meal replacement with mixed rice is more effective than white rice in weight control, while improving antioxidant enzyme activity in obese women. Nutrition Research 28, 66-71.
Kim SH, Lee da H & Meyer D (2007) Supplementation of baby formula with native inulin has a prebiotic effect in formula-fed babies. Asia Pacific Journal of Clinical Nutrition 16, 172-177.
King DE, Mainous AG, III, Egan BM, Woolson RF & Geesey ME (2008) Effect of psyllium fiber supplementation on C-reactive protein: the trial to reduce inflammatory markers (TRIM). Annals of Family Medicine 6, 100-106.
Kinzler KW & Vogelstein B (1996) Lessons from hereditary colorectal cancer. Cell 87, 159-170.
Kirk E, Reeds DN, Finck BN, Mayurranjan MS, Patterson BW & Klein S (2009) Dietary fat and carbohydrates differentially alter insulin sensitivity during caloric restriction. Gastroenterology 136, 1552-1560.
Kirk TR, Burkill S & Cursiter M (1997) Dietary fat reduction achieved by increasing consumption of a starchy food--an intervention study. European Journal of Clinical Nutrition 51, 455-461.
Kirkwood L, Aldujaili E & Drummond S (2007) Effects of advice on dietary intake and/ or physical activity on body composition, blood lipids and insulin resistance following a low-fat, sucrose-containing, high-carbohydrate, energy-restricted diet. International Journal of Food Sciences and Nutrition 58, 383-397.
Kleemola P, Puska P, Vartiainen E, Roos E, Luoto R & Ehnholm C (1999) The effect of breakfast cereal on diet and serum cholesterol: a randomized trial in North Karelia, Finland. European Journal of Clinical Nutrition 53, 716-721.
Kleessen B, Schwarz S, Boehm A, Fuhrmann H, Richter A, Henle T & Krueger M (2007) Jerusalem artichoke and chicory inulin in bakery products affect faecal microbiota of healthy volunteers. British Journal of Nutrition 98, 540-549.
333
Klop B, Elte JW & Cabezas MC (2013) Dyslipidemia in obesity: mechanisms and potential targets. Nutrients 5, 1218-1240.
Klurfeld DM, Foreyt J, Angelopoulo TJ & Rippe JM (2013) Lack of evidence for high fructose corn syrup as the cause of the obesity epidemic. Int J Obes (Lond) 37, 771-773.
Knekt P, Reunanen A, Jarvinen R, Seppanen R, Heliovaara M & Aromaa A (1994) Antioxidant vitamin intake and coronary mortality in a longitudinal population study. Am J Epidemiol 139, 1180-1189.
Knol J, Scholtens P, Kafka C, Steenbakkers J, Gro S, Helm K, Klarczyk M, Schopfer H, Bockler HM & Wells J (2005) Colon microflora in infants fed formula with galacto- and fructo-oligosaccharides: more like breast-fed infants. Journal of Pediatric Gastroenterology & Nutrition 40, 36-42.
Knopp RH, Superko HR, Davidson M, Insull W, Dujovne CA, Kwiterovich PO, Zavoral JH, Graham K, O'Connor RR & Edelman DA (1999) Long-term blood cholesterol-lowering effects of a dietary fiber supplement. Am J Prev Med 17, 18-23.
Kochar J, Djousse L & Gaziano JM (2007) Breakfast cereals and risk of type 2 diabetes in the Physicians' Health Study I. Obesity 15, 3039-3044.
Kohl A, Gogebakan O, Mohlig M, Osterhoff M, Isken F, Pfeiffer AF & Weickert MO (2009) Increased interleukin-10 but unchanged insulin sensitivity after 4 weeks of (1, 3) (1, 6)-beta-glycan consumption in overweight humans. Nutrition Research 29, 248-254.
Kokubo Y, Iso H, Saito I, Yamagishi K, Ishihara J, Inoue M, Tsugane S & JPHC JPHC (2011) Dietary fiber intake and risk of cardiovascular disease in the Japanese population: the Japan Public Health Center-based study cohort. European Journal of Clinical Nutrition 65, 1233-1241.
Kolb H & Mandrup-Poulsen T (2005) An immune origin of type 2 diabetes? Diabetologia 48, 1038-1050.
Krauss RM, Blanche PJ, Rawlings RS, Fernstrom HS & Williams PT (2006) Separate effects of reduced carbohydrate intake and weight loss on atherogenic dyslipidemia[erratum appears in Am J Clin Nutr. 2006 Sep;84(3):668]. American Journal of Clinical Nutrition 83, 1025-1031.
Krishnan S, Rosenberg L, Singer M, Hu FB, Djousse L, Cupples LA & Palmer JR (2007) Glycemic index, glycemic load, and cereal fiber intake and risk of type 2 diabetes in US black women. Archives of Internal Medicine 167, 2304-2309.
Krog-Mikkelsen I, Sloth B, Dimitrov D, Tetens I, Bjorck I, Flint A, Holst JJ, Astrup A, Elmstahl H & Raben A (2011) A low glycemic index diet does not affect postprandial energy metabolism but decreases postprandial insulinemia and increases fullness ratings in healthy women. Journal of Nutrition 141, 1679-1684.
Kunz C, Rodriguez-Palmero M, Koletzko B & Jensen R (1999) Nutritional and biochemical properties of human milk, Part I: General aspects, proteins, and carbohydrates. Clin Perinatol 26, 307-333.
334
Kvaavik E, Andersen LF & Klepp KI (2005) The stability of soft drinks intake from adolescence to adult age and the association between long-term consumption of soft drinks and lifestyle factors and body weight. Public Health Nutrition 8, 149-157.
Laaksonen DE, Nyyssonen K, Niskanen L, Rissanen TH & Salonen JT (2005) Prediction of cardiovascular mortality in middle-aged men by dietary and serum linoleic and polyunsaturated fatty acids. Archives of Internal Medicine 165, 193-199.
Lader D, Chadwick B, Chestnutt I, Harker R, Morris J, Nuttall N, Pitts N, Steele J & White D (2003) Children's dental health in the United Kingdom.
Lagiou P, Tamimi RM, Mucci LA, Adami HO, Hsieh CC & Trichopoulos D (2004) Diet during pregnancy in relation to maternal weight gain and birth size. European Journal of Clinical Nutrition 58, 231-237.
Lampe JW, Slavin JL, Melcher EA & Potter JD (1992) Effects of cereal and vegetable fiber feeding on potential risk factors for colon cancer. Cancer Epidemiology, Biomarkers & Prevention 1, 207-211.
Landberg R, Kamal-Eldin A, Andersson A, Vessby B & Aman P (2008) Alkylresorcinols as biomarkers of whole-grain wheat and rye intake: plasma concentration and intake estimated from dietary records. The American Journal of Clinical Nutrition 87, 832-838.
Landin K, Holm G, Tengborn L & Smith U (1992) Guar gum improves insulin sensitivity, blood lipids, blood pressure, and fibrinolysis in healthy men. American Journal of Clinical Nutrition 56, 1061-1065.
Landry N, Bergeron N, Archer R, Samson P, Corneau L, Bergeron J & Deriaz O (2003) Whole-body fat oxidation rate and plasma triacylglycerol concentrations in men consuming an ad libitum high-carbohydrate or low-carbohydrate diet. American Journal of Clinical Nutrition 77, 580-586.
Lang R, Thane CW, Bolton-Smith C & Jebb SA (2003) Consumption of whole-grain foods by British adults: findings from further analysis of two national dietary surveys. Public Health Nutrition 6, 479-484.
Langley-Evans AJ & Langley-Evans SC (2003) Relationship between maternal nutrient intakes in early and late pregnancy and infants weight and proportions at birth: prospective cohort study. Journal of the Royal Society for the Promotion of Health 123, 210-216.
Larsson SC, Giovannucci E, Bergkvist L & Wolk A (2005) Whole grain consumption and risk of colorectal cancer: a population-based cohort of 60,000 women. Br J Cancer 92, 1803-1807.
Larsson SC, Giovannucci E & Wolk A (2007) Dietary carbohydrate, glycemic index, and glycemic load in relation to risk of colorectal cancer in women. Am J Epidemiol 165, 256-261.
Larsson SC, Mannisto S, Virtanen MJ, Kontto J, Albanes D & Virtamo J (2009) Dietary fiber and fiber-rich food intake in relation to risk of stroke in male smokers. European Journal of Clinical Nutrition 63, 1016-1024.
335
Lasker DA, Evans EM & Layman DK (2008) Moderate carbohydrate, moderate protein weight loss diet reduces cardiovascular disease risk compared to high carbohydrate, low protein diet in obese adults: A randomized clinical trial. Nutr Metab 5, 30.
Law V & Seow WK (2006) A longitudinal controlled study of factors associated with mutans streptococci infection and caries lesion initiation in children 21 to 72 months old. Pediatr Dent 28, 58-65.
Layman DK, Evans E, Baum JI, Seyler J, Erickson DJ & Boileau RA (2005) Dietary protein and exercise have additive effects on body composition during weight loss in adult women. Journal of Nutrition 135, 1903-1910.
Layman DK, Evans EM, Erickson D, Seyler J, Weber J, Bagshaw D, Griel A, Psota T & Kris-Etherton P (2009) A moderate-protein diet produces sustained weight loss and long-term changes in body composition and blood lipids in obese adults. Journal of Nutrition 139, 514-521.
Lee SC, Prosky L & De Vries JW (1992) Determination of total, soluble, and insoluble dietary fiber in foods: enzymatic-gravimetric method, MES-TRIS buffer: collaborative study. Journal of AOAC International (USA) 75, 395-416.
Lehtimaki T, Metso S, Ylitalo R, Rontu R, Nikkila M, Wuolijoki E & Ylitalo P (2005) Microcrystalline chitosan is ineffective to decrease plasma lipids in both apolipoprotein E epsilon 4 carriers and non-carriers: A long-term placebo-controlled trial in hypercholesterolaemic volunteers. Basic Clin Pharmacol Toxicol 97, 98-103.
Leidy HJ, Carnell NS, Mattes RD & Campbell WW (2007) Higher protein intake preserves lean mass and satiety with weight loss in pre-obese and obese women. Obesity 15, 421-429.
Lenders CM, Hediger ML, Scholl TO, Khoo C-S, Slap GB & Stallings VA (1997) Gestational age and infant size at birth are associated with dietary sugar intake among pregnant adolescents. J Nutr 127, 1113-1117.
Lennox A, Somerville J, Ong K, Henderson H & Allen R (2011) Diet and Nutrition Survey of Infants and Young Children. https://www.gov.uk/government/publications/diet-and-nutrition-survey-of-infants-and-young-children-2011.
Leonetti DL, Tsunehara CH, Wahl PW & Fujimoto WY (1996) Baseline dietary intake and physical activity of Japanese American men in relation to glucose tolerance at 5-year follow-up. American Journal of Human Biology 8, 55-67.
Leroy R, Bogaerts K, Lesaffre E & Declerck D (2005) Multivariate survival analysis for the identification of factors associated with cavity formation in permanent first molars. Eur J Oral Sci 113, 145-152.
Leslie A, Carey FA, Pratt NR & Steele RJ (2002) The colorectal adenoma-carcinoma sequence. Br J Surg 89, 845-860.
Letexier D, Diraison F & Beylot M (2003) Addition of inulin to a moderately high-carbohydrate diet reduces hepatic lipogenesis and plasma triacylglycerol concentrations in humans. American Journal of Clinical Nutrition 77, 559-564.
336
Levine RS, Nugent ZJ, Rudolf MC & Sahota P (2007) Dietary patterns, toothbrushing habits and caries experience of schoolchildren in West Yorkshire, England. Community Dent Health 24, 82-87.
Levitan EB, Mittleman MA, Hakansson N & Wolk A (2007) Dietary glycemic index, dietary glycemic load, and cardiovascular disease in middle-aged and older Swedish men. American Journal of Clinical Nutrition 85, 1521-1526.
Levitan EB, Mittleman MA & Wolk A (2010) Dietary glycaemic index, dietary glycaemic load and incidence of myocardial infarction in women. British Journal of Nutrition 103, 1049-1055.
Levy SM, Warren JJ, Broffitt B, Hillis SL & Kanellis MJ (2003) Fluoride, beverages and dental caries in the primary dentition. Caries Res 37, 157-165.
Lewington S, Clarke R, Qizilbash N, Peto R & Collins R (2002) Age-specific relevance of usual blood pressure to vascular mortality: a meta-analysis of individual data for one million adults in 61 prospective studies. Lancet 360, 1903-1913.
Lewington S, Whitlock G, Clarke R, Sherliker P, Emberson J, Halsey J, Qizilbash N, Peto R & Collins R (2007) Blood cholesterol and vascular mortality by age, sex, and blood pressure: a meta-analysis of individual data from 61 prospective studies with 55,000 vascular deaths. Lancet 370, 1829-1839.
Lewis SJ & Heaton KW (1999) The metabolic consequences of slow colonic transit. Am J Gastroenterol 94, 2010-2016.
Ley SH, Hanley AJ, Retnakaran R, Sermer M, Zinman B & O'Connor DL (2011) Effect of macronutrient intake during the second trimester on glucose metabolism later in pregnancy. Am J Clin Nutr 94, 1232-1240.
Ley SJ, Metcalf PA, Scragg RKR & Swinburn BA (2004) Long-term effects of a reduced fat diet intervention on cardiovascular disease risk factors in individuals with glucose intolerance. Diabetes Res Clin Pract 63, 103-112.
Li HL, Yang G, Shu XO, et al. (2011) Dietary glycemic load and risk of colorectal cancer in Chinese women. American Journal of Clinical Nutrition 93, 101-107.
Libby P, Ridker PM & Maseri A (2002) Inflammation and atherosclerosis. Circulation 105, 1135-1143.
Libuda L, Alexy U, Sichert-Hellert W, Stehle P, Karaolis-Danckert N, Buyken AE & Kersting M (2008) Pattern of beverage consumption and long-term association with body-weight status in German adolescents – results from the DONALD study. British Journal of Nutrition 99, 1370-1379.
Liljeberg Elmstahl H (2002) Resistant starch content in a selection of starchy foods on the Swedish market. European Journal of Clinical Nutrition 56, 500-505.
Lim S, Sohn W, Burt BA, Sandretto AM, Kolker JL, Marshall TA & Ismail AI (2008) Cariogenicity of soft drinks, milk and fruit juice in low-income african-american children: a longitudinal study. J Am Dent Assoc 139, 959-967.
337
Lim SS, Noakes M, Keogh JB & Clifton PM (2010) Long-term effects of a low carbohydrate, low fat or high unsaturated fat diet compared to a no-intervention control. Nutrition Metabolism & Cardiovascular Diseases 20, 599-607.
Lin J, Zhang SM, Cook NR, Rexrode KM, Liu S, Manson JE, Lee IM & Buring JE (2005) Dietary intakes of fruit, vegetables, and fiber, and risk of colorectal cancer in a prospective cohort of women (United States). Cancer Causes Control 16, 225-233.
Lindstrom J, Peltonen M, Eriksson JG, Louheranta A, Fogelholm M, Uusitupa M & Tuomilehto J (2006) High-fibre, low-fat diet predicts long-term weight loss and decreased type 2 diabetes risk: the Finnish Diabetes Prevention Study. Diabetologia 49, 912-920.
Lingstrom P, Birkhed D, Ruben J & Arends J (1994) Effect of frequent consumption of starchy food items on enamel and dentin demineralization and on plaque pH in situ. J Dent Res 73, 652-660.
Liu J, Zeng FF, Liu ZM, Zhang CX, Ling WH & Chen YM (2013) Effects of blood triglycerides on cardiovascular and all-cause mortality: a systematic review and meta-analysis of 61 prospective studies. Lipids Health Dis 12, 159.
Liu S, Buring JE, Sesso HD, Rimm EB, Willett WC & Manson JE (2002) A prospective study of dietary fiber intake and risk of cardiovascular disease among women. J Am Coll Cardiol 39, 49-56.
Liu S, Manson JE, Stampfer MJ, Hu FB, Giovannucci E, Colditz GA, Hennekens CH & Willett WC (2000a) A prospective study of whole-grain intake and risk of type 2 diabetes mellitus in US women. Am J Public Health 90, 1409-1415.
Liu S, Manson JE, Stampfer MJ, Rexrode KM, Hu FB, Rimm EB & Willett WC (2000b) Whole grain consumption and risk of ischemic stroke in women: A prospective study. JAMA 284, 1534-1540.
Liu S, Stampfer MJ, Hu FB, Giovannucci E, Rimm E, Manson JE, Hennekens CH & Willett WC (1999) Whole-grain consumption and risk of coronary heart disease: results from the Nurses' Health Study. American Journal of Clinical Nutrition 70, 412-419.
Liu S, Willett WC, Stampfer MJ, Hu FB, Franz M, Sampson L, Hennekens CH & Manson JE (2000c) A prospective study of dietary glycemic load, carbohydrate intake, and risk of coronary heart disease in US women. American Journal of Clinical Nutrition 71, 1455-1461.
Liu S, Sesso HD, Manson JE, Willett WC & Buring JE (2003) Is intake of breakfast cereals related to total and cause-specific mortality in men? American Journal of Clinical Nutrition 77, 594-599.
Livesey G, Taylor R, Livesey H & Liu S (2013) Is there a dose-response relation of dietary glycemic load to risk of type 2 diabetes? Meta-analysis of prospective cohort studies. Am J Clin Nutr 97, 584-596.
Livesey G & Taylor R (2008) Fructose consumption and consequences for glycation, plasma triacylglycerol, and body weight: meta-analyses and meta-regression models of intervention studies. The American Journal of Clinical Nutrition 88, 1419-1437.
338
Livesey G (2003) Health potential of polyols as sugar replacers, with emphasis on low glycaemic properties. Nutrition Research Reviews 16, 163-192.
Lofgren P, Andersson I, Wahrenberg H & Hoffstedt J (2005) No difference in lipolysis or glucose transport of subcutaneous fat cells between moderate-fat and low-fat hypocaloric diets in obese women. Horm Metab Res 37, 734-740.
Lovejoy JC, Bray GA, Lefevre M, et al. (2003) Consumption of a controlled low-fat diet containing olestra for 9 months improves health risk factors in conjunction with weight loss in obese men: the Ole' Study. International Journal of Obesity 27, 1242-1249.
Lowndes J, Kawiecki D, Pardo S, Nguyen V, Melanson KJ, Yu Z & Rippe JM (2012) The effects of four hypocaloric diets containing different levels of sucrose or high fructose corn syrup on weight loss and related parameters. Nutr J 11, 55.
Ludwig DS, Pereira MA, Kroenke CH, Hilner JE, Van HL, Slattery ML & Jacobs DR, Jr. (1999) Dietary fiber, weight gain, and cardiovascular disease risk factors in young adults. JAMA 282, 1539-1546.
Lumley J, Chamberlain C, Dowswell T, Oliver S, Oakley L & Watson L (2009) Interventions for promoting smoking cessation during pregnancy. Cochrane Database Syst Rev, CD001055.
Luo J, Rizkalla SW, Alamowitch C, Boussairi A, Blayo A, Barry JL, Laffitte A, Guyon F, Bornet FR & Slama G (1996) Chronic consumption of short-chain fructooligosaccharides by healthy subjects decreased basal hepatic glucose production but had no effect on insulin-stimulated glucose metabolism. American Journal of Clinical Nutrition 63, 939-945.
Lussi A (1996) Dental erosion clinical diagnosis and case history taking. Eur J Oral Sci 104, 191-198.
Lussi A & Jaeggi T (2008) Erosion – diagnosis and risk factors. Clin Oral Investig 12 Suppl 1, S5-13.
Lussi A, Jaeggi T & Zero D (2004) The role of diet in the aetiology of dental erosion. Caries Res 38 Suppl 1, 34-44.
Lussi A & Schaffner M (2000) Progression of and risk factors for dental erosion and wedge-shaped defects over a 6-year period. Caries Res 34, 182-187.
Machiulskiene V, Nyvad B & Baelum V (2001) Caries preventive effect of sugar-substituted chewing gum. Community Dentistry & Oral Epidemiology 29, 278-288.
MacLennan R, Macrae F, Bain C, et al. (1995) Randomized Trial of Intake of Fat, Fiber, and Beta Carotene to Prevent Colorectal Adenomas. J Natl Cancer Inst 87, 1760-1766.
MacMahon S, Peto R, Cutler J, Collins R, Sorlie P, Neaton J, Abbott R, Godwin J, Dyer A & Stamler J (1990) Blood pressure, stroke, and coronary heart disease. Part 1, Prolonged differences in blood pressure: prospective observational studies corrected for the regression dilution bias. Lancet 335, 765-774.
339
Magarey AM, Daniels LA, Boulton TJ & Cockington RA (2001) Does fat intake predict adiposity in healthy children and adolescents aged 2--15 y? A longitudinal analysis. European Journal of Clinical Nutrition 55, 471-481.
Magne F, Hachelaf W, Suau A, Boudraa G, Bouziane-Nedjadi K, Rigottier-Gois L, Touhami M, Desjeux JF & Pochart P (2008) Effects on faecal microbiota of dietary and acidic oligosaccharides in children during partial formula feeding. Journal of Pediatric Gastroenterology & Nutrition 46, 580-588.
Mahon AK, Flynn MG, Stewart LK, McFarlin BK, Iglay HB, Mattes RD, Lyle RM, Considine RV & Campbell WW (2007) Protein intake during energy restriction: effects on body composition and markers of metabolic and cardiovascular health in postmenopausal women. Journal of the American College of Nutrition 26, 182-189.
Mai V, Flood A, Peters U, Lacey JV, Jr., Schairer C & Schatzkin A (2003) Dietary fibre and risk of colorectal cancer in the Breast Cancer Detection Demonstration Project (BCDDP) follow-up cohort. Int J Epidemiol 32, 234-239.
Maki KC, Galant R, Samuel P, Tesser J, Witchger MS, Ribaya-Mercado JD, Blumberg JB & Geohas J (2007a) Effects of consuming foods containing oat beta-glucan on blood pressure, carbohydrate metabolism and biomarkers of oxidative stress in men and women with elevated blood pressure. European Journal of Clinical Nutrition 61, 786-795.
Maki KC, Rains TM, Kaden VN, Raneri KR & Davidson MH (2007b) Effects of a reduced-glycemic-load diet on body weight, body composition, and cardiovascular disease risk markers in overweight and obese adults. American Journal of Clinical Nutrition 85, 724-734.
Maki KC, Gibson GR, Dickmann RS, et al. (2012) Digestive and physiologic effects of a wheat bran extract, arabino-xylan-oligosaccharide, in breakfast cereal. Nutrition 28, 1115-1121.
Mann J, Cummings JH, Englyst HN, et al. (2007) FAO/WHO Scientific Update on carbohydrates in human nutrition: conclusions. Eur J Clin Nutr 61, S132-S137.
Mantle J (1992) Research and serendipitous secondary findings. Canadian Nurse 88, 15-18.
Marett R & Slavin JL (2004) No long-term benefits of supplementation with arabinogalactan on serum lipids and glucose. Journal of the American Dietetic Association 104, 636-639.
Mariri BP, Levy SM, Warren JJ, Bergus GR, Marshall TA & Broffitt B (2003) Medically administered antibiotics, dietary habits, fluoride intake and dental caries experience in the primary dentition. Community Dentistry & Oral Epidemiology 31, 40-51.
Marlett JA, Kajs TM & Fischer MH (2000) An unfermented gel component of psyllium seed husk promotes laxation as a lubricant in humans. American Journal of Clinical Nutrition 72, 784-789.
340
Marteau P, Flourie B, Cherbut C, Correze JL, Pellier P, Seylaz J & Rambaud JC (1994) Digestibility and bulking effect of ispaghula husks in healthy humans. Gut 35, 1747-1752.
Mathews F, Yudkin P & Neil A (1999) Influence of maternal nutrition on outcome of pregnancy: prospective cohort study. BMJ 319, 339.
Mattace-Raso FU, van der Cammen TJ, Hofman A, et al. (2006) Arterial stiffness and risk of coronary heart disease and stroke: the Rotterdam Study. Circulation 113, 657-663.
Mattes RD (2002) Ready-to-eat cereal used as a meal replacement promotes weight loss in humans. Journal of the American College of Nutrition 21, 570-577.
Mattes RD (2007) Effects of a combination fiber system on appetite and energy intake in overweight humans. Physiology & Behavior 90, 705-711.
Mattila ML, Rautava P, Aromaa M, Ojanlatva A, Paunio P, Hyssala L, Helenius H & Sillanpaa M (2005) Behavioural and demographic factors during early childhood and poor dental health at 10 years of age. Caries Res 39, 85-91.
Mattila ML, Rautava P, Paunio P, Ojanlatva A, Hyssala L, Helenius H & Sillanpaa M (2001) Caries experience and caries increments at 10 years of age. Caries Res 35, 435-441.
Mayer-Davis EJ, Dhawan A, Liese AD, Teff K & Schulz M (2006) Towards understanding of glycaemic index and glycaemic load in habitual diet: Associations with measures of glycaemia in the insulin resistance atherosclerosis study. British Journal of Nutrition 95, 397-405.
Mazlan N, Horgan G, Whybrow S & Stubbs J (2006) Effects of increasing increments of fat- and sugar-rich snacks in the diet on energy and macronutrient intake in lean and overweight men. British Journal of Nutrition 96, 596-606.
McCarl M, Harnack L, Limburg PJ, Anderson KE & Folsom AR (2006) Incidence of colorectal cancer in relation to glycemic index and load in a cohort of women. Cancer Epidemiol Biomarkers Prev 15, 892-896.
McCleary BV, DeVries JW, Rader JI, Cohen G, Prosky L, Mugford DC, Champ M & Okuma K (2010) Determination of total dietary fiber (CODEX definition) by enzymatic-gravimetric method and liquid chromatography: collaborative study. J AOAC Int 93, 221-233.
McCleary BV, DeVries JW, Rader JI, Cohen G, Prosky L, Mugford DC & Okuma K (2012) Determination of insoluble, soluble, and total dietary fiber (CODEX definition) by enzymatic-gravimetric method and liquid chromatography: collaborative study. J AOAC Int 95, 824-844.
McCullough ML, Robertson AS, Chao A, Jacobs EJ, Stampfer MJ, Jacobs DR, Diver WR, Calle EE & Thun MJ (2003) A prospective study of whole grains, fruits, vegetables and colon cancer risk. Cancer Causes Control 14, 959-970.
McIntosh GH, Noakes M, Royle PJ & Foster PR (2003) Whole-grain rye and wheat foods and markers of bowel health in overweight middle-aged men. American Journal of Clinical Nutrition 77, 967-974.
341
McManus K, Antinoro L & Sacks F (2001) A randomized controlled trial of a moderate-fat, low-energy diet compared with a low fat, low-energy diet for weight loss in overweight adults. International Journal of Obesity 25, 1503-1511.
McMillan-Price J, Petocz P, Atkinson F, O'neill K, Samman S, Steinbeck K, Caterson I & Brand-Miller J (2006) Comparison of 4 diets of varying glycemic load on weight loss and cardiovascular risk reduction in overweight and obese young adults: a randomized controlled trial. Archives of Internal Medicine 166, 1466-1475.
McNaught AD (1997) Nomenclature of carbohydrates (recommendations 1996). Adv Carbohydr Chem Biochem 52, 43-177.
McRorie J, Kesler J, Bishop L, Filloon T, Allgood G, Sutton M, Hunt T, Laurent A & Rudolph C (2000) Effects of wheat bran and Olestra on objective measures of stool and subjective reports of GI symptoms. American Journal of Gastroenterology 95, 1244-1252.
Meckling KA, O'Sullivan C & Saari D (2004) Comparison of a low-fat diet to a low-carbohydrate diet on weight loss, body composition, and risk factors for diabetes and cardiovascular disease in free-living, overweight men and women. J Clin Endocrinol Metab 89, 2717-2723.
Meckling KA & Sherfey R (2007) A randomized trial of a hypocaloric high-protein diet, with and without exercise, on weight loss, fitness, and markers of the Metabolic Syndrome in overweight and obese women. Appl Physiol Nutr Metab 32, 743-752.
Mee KA & Gee DL (1997) Apple fiber and gum arabic lowers total and low-density lipoprotein cholesterol levels in men with mild hypercholesterolemia. Journal of the American Dietetic Association 97, 422-424.
Mekary RA, Rimm EB, Giovannucci E, Stampfer MJ, Willett WC, Ludwig DS & Hu FB (2011) Joint association of glycemic load and alcohol intake with type 2 diabetes incidence in women. American Journal of Clinical Nutrition 94, 1525-1532.
Mensink RP, Zock PL, Kester AD & Katan MB (2003) Effects of dietary fatty acids and carbohydrates on the ratio of serum total to HDL cholesterol and on serum lipids and apolipoproteins: a meta-analysis of 60 controlled trials. The American Journal of Clinical Nutrition 77, 1146-1155.
Meyer KA, Kushi LH, Jacobs DR, Jr., Slavin J, Sellers TA & Folsom AR (2000) Carbohydrates, dietary fiber, and incident type 2 diabetes in older women. American Journal of Clinical Nutrition 71, 921-930.
Michaud DS, Fuchs CS, Liu S, Willett WC, Colditz GA & Giovannucci E (2005) Dietary glycemic load, carbohydrate, sugar, and colorectal cancer risk in men and women. Cancer Epidemiol Biomarkers Prev 14, 138-147.
Michels KB, Fuchs CS, Giovannucci E, Colditz GA, Hunter DJ, Stampfer MJ & Willett WC (2005) Fiber Intake and Incidence of Colorectal Cancer among 76,947 Women and 47,279 Men. Cancer Epidemiology Biomarkers Prevention 14, 842-849.
342
Miller M, Stone NJ, Ballantyne C, et al. (2011) Triglycerides and Cardiovascular Disease. Circulation 123, 2292-2333.
Moore VM, Davies MJ, Willson KJ, Worsley A & Robinson JS (2004) Dietary composition of pregnant women is related to size of the baby at birth. J Nutr 134, 1820-1826.
Monterrosa AE, Haffner SM, Stern MP & Hazuda HP (1995) Sex difference in lifestyle factors predictive of diabetes in Mexican-Americans. Diabetes Care 18, 448-456.
Montonen J, Jarvinen R, Heliovaara M, Reunanen A, Aromaa A & Knekt P (2005) Food consumption and the incidence of type II diabetes mellitus. European Journal of Clinical Nutrition 59, 441-448.
Montonen J, Jarvinen R, Knekt P, Heliovaara M & Reunanen A (2007) Consumption of sweetened beverages and intakes of fructose and glucose predict type 2 diabetes occurrence. Journal of Nutrition 137, 1447-1454.
Montonen J, Knekt P, Jarvinen R, Aromaa A & Reunanen A (2003) Whole-grain and fiber intake and the incidence of type 2 diabetes. American Journal of Clinical Nutrition 77, 622-629.
Morgan LM, Griffin BA, Millward DJ, et al. (2009) Comparison of the effects of four commercially available weight-loss programmes on lipid-based cardiovascular risk factors. Public Health Nutrition 12, 799-807.
Moro G, Minoli I, Mosca M, Fanaro S, Jelinek J, Stahl B & Boehm G (2002) Dosage-related bifidogenic effects of galacto- and fructooligosaccharides in formula-fed term infants. Journal of Pediatric Gastroenterology & Nutrition 34, 291-295.
Mosdol A, Witte DR, Frost G, Marmot MG & Brunner EJ (2007) Dietary glycemic index and glycemic load are associated with high-density-lipoprotein cholesterol at baseline but not with increased risk of diabetes in the Whitehall II study. American Journal of Clinical Nutrition 86, 988-994.
Moynihan PJ & Kelly SA (2014) Effect on Caries of Restricting Sugars Intake: Systematic Review to Inform WHO Guidelines. J Dent Res 93, 8-18.
Mozaffarian D, Kumanyika SK, Lemaitre RN, Olson JL, Burke GL & Siscovick DS (2003) Cereal, fruit, and vegetable fiber intake and the risk of cardiovascular disease in elderly individuals. JAMA 289, 1659-1666.
Muir JG, Yeow EG, Keogh J, Pizzey C, Bird AR, Sharpe K, O'Dea K & Macrae FA (2004) Combining wheat bran with resistant starch has more beneficial effects on fecal indexes than does wheat bran alone. American Journal of Clinical Nutrition 79, 1020-1028.
Mundt CA, Baxter-Jones AD, Whiting SJ, Bailey DA, Faulkner RA & Mirwald RL (2006) Relationships of activity and sugar drink intake on fat mass development in youths. Medicine & Science in Sports & Exercise 38, 1245-1254.
Murphy MM, Douglass JS & Birkett A (2008) Resistant Starch Intakes in the United States. Journal of the American Dietetic Association 108, 67-78.
343
Murphy N, Norat T, Ferrari P, et al. (2012) Dietary fibre intake and risks of cancers of the colon and rectum in the European prospective investigation into cancer and nutrition (EPIC). PLoS ONE 7, e39361.
Nagura J, Iso H, Watanabe Y, et al. (2009) Fruit, vegetable and bean intake and mortality from cardiovascular disease among Japanese men and women: the JACC Study. British Journal of Nutrition 102, 285-292.
Nakamura N, Gaskins HR, Collier CT, et al. (2009) Molecular ecological analysis of fecal bacterial populations from term infants fed formula supplemented with selected blends of prebiotics. Applied & Environmental Microbiology 75, 1121-1128.
Nanri A, Mizoue T, Noda M, Takahashi Y, Kato M, Inoue M, Tsugane S & Japan PG (2010) Rice intake and type 2 diabetes in Japanese men and women: the Japan Public Health Center-based Prospective Study. American Journal of Clinical Nutrition 92, 1468-1477.
National Obesity Observatory (2011) A simple guide to classifying body mass index in children. http://www.noo.org.uk/uploads/doc/vid_11601_A_simple_guide_to_classifying_BMI_ in_children.pdf
Nelson GJ, Schmidt PC & Kelley DS (1995) Low-fat diets do not lower plasma cholesterol levels in healthy men compared to high-fat diets with similar fatty acid composition at constant caloric intake. Lipids 30, 969-976.
Nelson M, Erens B, Bates B, Church S & Boshier T (2007) Low income diet and nutrition survey. http://tna.europarchive.org/20110116113217/ http://www.food.gov.uk/science/dietarysurveys/lidnsbranch/
Nettleton JA, Lutsey PL, Wang Y, Lima JA, Michos ED & Jacobs J (2009) Diet soda intake and risk of incident metabolic syndrome and type 2 diabetes in the multi-ethnic study of atherosclerosis (MESA). Diabetes Care 32, 688-694.
Nettleton JA, Steffen LM, Loehr LR, Rosamond WD & Folsom AR (2008) Incident heart failure is associated with lower whole-grain intake and greater high-fat dairy and egg intake in the Atherosclerosis Risk in Communities (ARIC) study. Journal of the American Dietetic Association 108, 1881-1887.
Nickols-Richardson SM, Coleman MD, Volpe JJ & Hosig KW (2005) Perceived hunger is lower and weight loss is greater in overweight premenopausal women consuming a low-carbohydrate/high-protein vs high-carbohydrate/low-fat diet. Journal of the American Dietetic Association 105, 1433-1437.
Nilsson LM, Winkvist A, Eliasson M, Jansson JH, Hallmans G, Johansson I, Lindahl B, Lenner P & van B (2012) Low-carbohydrate, high-protein score and mortality in a northern Swedish population-based cohort. European Journal of Clinical Nutrition 66, 694-700.
Ninonuevo MR & Lebrilla CB (2009) Mass spectrometric methods for analysis of oligosaccharides in human milk. Nutr Rev 67 Suppl 2, S216-S226.
344
Nissinen K, Mikkila V, Mannisto S, Lahti-Koski M, Rasanen L, Viikari J & Raitakari O (2009) Sweets and sugar-sweetened soft drink intake in childhood in relation to adult BMI and overweight. The Cardiovascular Risk in Young Finns Study. Public Health Nutrition 12, 2018-2026.
Njike VY, Faridi Z, Shuval K, Dutta S, Kay CD, West SG, Kris-Etherton PM & Katz DL (2011) Effects of sugar-sweetened and sugar-free cocoa on endothelial function in overweight adults. Int J Cardiol 149, 83-88.
Noakes M, Clifton PM, Nestel PJ, Le Leu R & McIntosh G (1996) Effect of high-amylose starch and oat bran on metabolic variables and bowel function in subjects with hypertriglyceridemia. American Journal of Clinical Nutrition 64, 944-951.
Noakes M, Foster PR, Keogh JB, James AP, Mamo JC & Clifton PM (2006) Comparison of isocaloric very low carbohydrate/high saturated fat and high carbohydrate/low saturated fat diets on body composition and cardiovascular risk. Nutr Metab 3, 7.
Noakes M, Keogh JB, Foster PR & Clifton PM (2005) Effect of an energy-restricted, high-protein, low-fat diet relative to a conventional high-carbohydrate, low-fat diet on weight loss, body composition, nutritional status, and markers of cardiovascular health in obese women. American Journal of Clinical Nutrition 81, 1298-1306.
Nomura AM, Hankin JH, Henderson BE, Wilkens LR, Murphy SP, Pike MC, Marchand LL, Stram DO, Monroe KR & Kolonel LN (2007) Dietary fiber and colorectal cancer risk: the multiethnic cohort study. Cancer Causes Control 18, 753-764.
O'Brien KD, Brehm BJ, Seeley RJ, Bean J, Wener MH, Daniels S & D'Alessio DA (2005) Diet-induced weight loss is associated with decreases in plasma serum amyloid a and C-reactive protein independent of dietary macronutrient composition in obese subjects. J Clin Endocrinol Metab 90, 2244-2249.
Oba S, Nagata C, Nakamura K, Fujii K, Kawachi T, Takatsuka N & Shimizu H (2010a) Dietary glycemic index, glycemic load, and intake of carbohydrate and rice in relation to risk of mortality from stroke and its subtypes in Japanese men and women. Metabolism: Clinical & Experimental 59, 1574-1582.
Oba S, Nagata C, Nakamura K, Fujii K, Kawachi T, Takatsuka N & Shimizu H (2010b) Dietary glycemic index, glycemic load, and intake of carbohydrate and rice in relation to risk of mortality from stroke and its subtypes in Japanese men and women. Metabolism: Clinical & Experimental 59, 1574-1582.
Odegaard AO, Koh WP, Arakawa K, Yu MC & Pereira MA (2010) Soft Drink and Juice Consumption and Risk of Physician-diagnosed Incident Type 2 Diabetes: The Singapore Chinese Health Study. Am J Epidemiol 171, 701-708.
Ogawa K, Ben RA, Pons S, Paolo MI & Fernandez LB (1992) Volatile Fatty Acids, Lactic Acid, and pH in the Stools of Breast-Fed and Bottle-Fed Infants. Journal of Pediatric Gastroenterology and Nutrition 15, 248-252.
Oh K, Hu FB, Cho E, Rexrode KM, Stampfer MJ, Manson JE, Liu S & Willett WC (2005) Carbohydrate intake, glycemic index, glycemic load, and dietary fiber in relation to risk of stroke in women. Am J Epidemiol 161, 161-169.
345
Olendzki BC, Ma Y, Schneider KL, Merriam P, Culver AL, Ockene IS & Pagoto S (2009) A simple dietary message to improve dietary quality: Results from a pilot investigation. Nutrition 25, 736-744.
Ollila P & Larmas M (2007) A seven-year survival analysis of caries onset in primary second molars and permanent first molars in different caries risk groups determined at age two years. Acta Odontol Scand 65, 29-35.
Otani T, Iwasaki M, Ishihara J, Sasazuki S, Inoue M & Tsugane S (2006) Dietary fiber intake and subsequent risk of colorectal cancer: the Japan Public Health Center-based prospective study. Int J Cancer 119, 1475-1480.
Packey CD & Sartor RB (2009) Commensal bacteria, traditional and opportunistic pathogens, dysbiosis and bacterial killing in inflammatory bowel diseases. Curr Opin Infect Dis 22, 292-301.
Pal S, Khossousi A, Binns C, Dhaliwal S & Ellis V (2011) The effect of a fibre supplement compared to a healthy diet on body composition, lipids, glucose, insulin and other metabolic syndrome risk factors in overweight and obese individuals. British Journal of Nutrition 105, 90-100.
Palmer JR, Boggs DA, Krishnan S, Hu FB, Singer M & Rosenberg L (2008) Sugar-sweetened beverages and incidence of type 2 diabetes mellitus in African American women. Archives of Internal Medicine 168, 1487-1492.
Panagiotakos D, Pitsavos C, Chrysohoou C, Palliou K, Lentzas I, Skoumas I & Stefanadis C (2009) Dietary patterns and 5-year incidence of cardiovascular disease: a multivariate analysis of the ATTICA study. Nutrition Metabolism & Cardiovascular Diseases 19, 253-263.
Panlasigui LN, Baello OQ, Dimatangal JM & Dumelod BD (2003) Blood cholesterol and lipid-lowering effects of carrageenan on human volunteers. Asia Pacific Journal of Clinical Nutrition 12, 209-214.
Park MI, Camilleri M, O'Connor H, Oenning L, Burton D, Stephens D & Zinsmeister AR (2007) Effect of different macronutrients in excess on gastric sensory and motor functions and appetite in normal-weight, overweight, and obese humans. American Journal of Clinical Nutrition 85, 411-418.
Park Y, Subar AF, Hollenbeck A & Schatzkin A (2011) Dietary fiber intake and mortality in the NIH-AARP diet and health study. Archives of Internal Medicine 171, 1061-1068.
Park Y, Hunter DJ, Spiegelman D, et al. (2005) Dietary Fiber Intake and Risk of Colorectal Cancer: A Pooled Analysis of Prospective Cohort Studies. JAMA 294, 2849-2857.
Parker ED, Liu S, Van HL, Tinker LF, Shikany JM, Eaton CB & Margolis KL (2013) The association of whole grain consumption with incident type 2 diabetes: the Women's Health Initiative Observational Study. Ann Epidemiol 23, 321-327.
Parnell JA & Reimer RA (2009) Weight loss during oligofructose supplementation is associated with decreased ghrelin and increased peptide YY in overweight and obese adults. American Journal of Clinical Nutrition 89, 1751-1759.
346
Pasman W, Wils D, Saniez MH & Kardinaal A (2006) Long-term gastrointestinal tolerance of NUTRIOSEFB in healthy men. European Journal of Clinical Nutrition 60, 1024-1034.
Pasman WJ, Saris WHM, Wauters MAJ & WesterterpPlantenga MS (1997a) Effect of one week of fibre supplementation on hunger and satiety ratings and energy intake. Appetite 29, 77-87.
Pasman WJ, Westerterp-Plantenga MS, Muls E, Vansant G, van RJ & Saris WH (1997b) The effectiveness of long-term fibre supplementation on weight maintenance in weight-reduced women. International Journal of Obesity 21, 548-555.
Paxman JR, Richardson JC, Dettmar PW & Corfe BM (2008) Daily ingestion of alginate reduces energy intake in free-living subjects. Appetite 51, 713-719.
Paynter NP, Yeh HC, Voutilainen S, Schmidt MI, Heiss G, Folsom AR, Brancati FL & Kao WH (2006) Coffee and sweetened beverage consumption and the risk of type 2 diabetes mellitus: the atherosclerosis risk in communities study. Am J Epidemiol 164, 1075-1084.
Pedersen A, Sandstrom B & van Amelsvoort JM (1997) The effect of ingestion of inulin on blood lipids and gastrointestinal symptoms in healthy females. British Journal of Nutrition 78, 215-222.
Pelkman CL, Fishell VK, Maddox DH, Pearson TA, Mauger DT & Kris-Etherton PM (2004) Effects of moderate-fat (from monounsaturated fat) and low-fat weight-loss diets on the serum lipid profile in overweight and obese men and women. American Journal of Clinical Nutrition 79, 204-212.
Pelkman CL, Navia JL, Miller AE & Pohle RJ (2007) Novel calcium-gelled, alginate-pectin beverage reduced energy intake in nondieting overweight and obese women: interactions with dietary restraint status. American Journal of Clinical Nutrition 86, 1595-1602.
Penders J, Stobberingh EE, van den Brandt PA & Thijs C (2007) The role of the intestinal microbiota in the development of atopic disorders. Allergy 62, 1223-1236.
Penders J, Thijs C, Vink C, Stelma FF, Snijders B, Kummeling I, van den Brandt PA & Stobberingh EE (2006) Factors Influencing the Composition of the Intestinal Microbiota in Early Infancy. Pediatrics 118, 511-521.
Pereira MA, Swain J, Goldfine AB, Rifai N & Ludwig DS (2004) Effects of a low-glycemic load diet on resting energy expenditure and heart disease risk factors during weight loss. JAMA 292, 2482-2490.
Persson LA, Holm AK, Arvidsson S & Samuelson G (1985) Infant feeding and dental caries – a longitudinal study of Swedish children. Swed Dent J 9, 201-206.
Petersen M, Taylor MA, Saris WH, et al. (2006) Randomized, multi-center trial of two hypo-energetic diets in obese subjects: high- versus low-fat content. International Journal of Obesity 30, 552-560.
347
Peterson CM & Jovanovic-Peterson L (1995) Randomized crossover study of 40% vs. 55% carbohydrate weight loss strategies in women with previous gestational diabetes mellitus and non-diabetic women of 130-200% ideal body weight. Journal of the American College of Nutrition 14, 369-375.
Petti S & Hausen HW (2000) Caries prediction by multiple salivary mutans streptococcal counts in caries-free children with different levels of fluoride exposure, oral hygiene and sucrose intake. Caries Res 34, 380-387.
Philippou E, Bovill-Taylor C, Rajkumar C, Vampa ML, Ntatsaki E, Brynes AE, Hickson M & Frost GS (2009a) Preliminary report: the effect of a 6-month dietary glycemic index manipulation in addition to healthy eating advice and weight loss on arterial compliance and 24-hour ambulatory blood pressure in men: a pilot study. Metabolism 58, 1703-1708.
Philippou E, McGowan BM, Brynes AE, Dornhorst A, Leeds AR & Frost GS (2008) The effect of a 12-week low glycaemic index diet on heart disease risk factors and 24 h glycaemic response in healthy middle-aged volunteers at risk of heart disease: a pilot study. European Journal of Clinical Nutrition 62, 145-149.
Philippou E, Neary NM, Chaudhri O, Brynes AE, Dornhorst A, Leeds AR, Hickson M & Frost GS (2009b) The effect of dietary glycemic index on weight maintenance in overweight subjects: a pilot study. Obesity 17, 396-401.
Phillips J, Muir JG, Birkett A, Lu ZX, Jones GP, O'Dea K & Young GP (1995) Effect of resistant starch on fecal bulk and fermentation-dependent events in humans. American Journal of Clinical Nutrition 62, 121-130.
Phillips SA, Jurva JW, Syed AQ, Syed AQ, Kulinski JP, Pleuss J, Hoffmann RG & Gutterman DD (2008) Benefit of low-fat over low-carbohydrate diet on endothelial health in obesity. Hypertension 51, 376-382.
Phillips SM, Bandini LG, Naumova EN, Cyr H, Colclough S, Dietz WH & Must A (2004) Energy-dense snack food intake in adolescence: longitudinal relationship to weight and fatness. Obes Res 12, 461-472.
Pi-Sunyer FX (2007) How effective are lifestyle changes in the prevention of type 2 diabetes mellitus? Nutr Rev 65, 101-110.
Pienihakkinen K, Jokela J & Alanen P (2004) Assessment of caries risk in preschool children. Caries Res 38, 156-162.
Pietinen P, Malila N, Virtanen M, Hartman TJ, Tangrea JA, Albanes D & Virtamo J (1999) Diet and risk of colorectal cancer in a cohort of Finnish men. Cancer Causes Control 10, 387-396.
Pietinen P, Rimm EB, Korhonen P, Hartman AM, Willett WC, Albanes D & Virtamo J (1996) Intake of dietary fiber and risk of coronary heart disease in a cohort of Finnish men. The Alpha-Tocopherol, Beta-Carotene Cancer Prevention Study. Circulation 94, 2720-2727.
Pittas AG, Roberts SB, Das SK, Gilhooly CH, Saltzman E, Golden J, Stark PC & Greenberg AS (2006) The effects of the dietary glycemic load on type 2 diabetes risk factors during weight loss. Obesity 14, 2200-2209.
348
Pitts NB, Chestnutt IG, Evans D, White D, Chadwick B & Steele JG (2006) 1 Verifiable CPD Paper: The dentinal caries experience of children in the United Kingdom, 2003. Br Dent J 200, 313-320.
Poobalan A, Aucott L, Smith WCS, Avenell A, Jung R, Broom J & Grant AM (2004) Effects of weight loss in overweight/obese individuals and long-term lipid outcomes − a systematic review. Obesity Reviews 5, 43-50.
Poppitt SD, Keogh GF, Prentice AM, Williams DE, Sonnemans HM, Valk EE, Robinson E & Wareham NJ (2002) Long-term effects of ad libitum low-fat, high-carbohydrate diets on body weight and serum lipids in overweight subjects with metabolic syndrome. American Journal of Clinical Nutrition 75, 11-20.
Prentice AM & Goldberg GR (2000) Energy adaptations in human pregnancy: limits and long-term consequences. Am J Clin Nutr 71, 1226S-1232S.
Prosky L, Asp NG, Schweizer TF, DeVries JW & Furda I (1988) Determination of insoluble, soluble, and total dietary fiber in foods and food products: interlaboratory study. Journal — Association of Official Analytical Chemists 71, 1017-1023.
Public Health England (2013) National Dental Epidemiology Programme for England: oral health survey of five-year-old children 2012. http://www.nwph.net/dentalhealth/Oral%20Health%205yr%20old%20children%20 2012%20final%20report%20gateway%20approved.pdf
Raatz SK, Torkelson CJ, Redmon JB, Reck KP, Kwong CA, Swanson JE, Liu C, Thomas W & Bantle JP (2005) Reduced glycemic index and glycemic load diets do not increase the effects of energy restriction on weight loss and insulin sensitivity in obese men and women. Journal of Nutrition 135, 2387-2391.
Raben A, Vasilaras TH, Moller AC & Astrup A (2002) Sucrose compared with artificial sweeteners: different effects on ad libitum food intake and body weight after 10 wk of supplementation in overweight subjects. American Journal of Clinical Nutrition 76, 721-729.
Racette SB, Schoeller DA, Kushner RF, Neil KM & Herling-Iaffaldano K (1995) Effects of aerobic exercise and dietary carbohydrate on energy expenditure and body composition during weight reduction in obese women. American Journal of Clinical Nutrition 61, 486-494.
Rader DJ, Davidson MH, Caplan RJ & Pears JS (2003) Lipid and apolipoprotein ratios: association with coronary artery disease and effects of rosuvastatin compared with atorvastatin, pravastatin, and simvastatin. Am J Cardiol 91, 20C-23C.
Radesky JS, Oken E, Rifas-Shiman SL, Kleinman KP, Rich-Edwards JW & Gillman MW (2008) Diet during early pregnancy and development of gestational diabetes. Paediatric and Perinatal Epidemiology 22, 47-59.
Ramnani P, Gaudier E, Bingham M, van Bruggen P, Tuohy KM & Gibson GR (2010) Prebiotic effect of fruit and vegetable shots containing Jerusalem artichoke inulin: a human intervention study. British Journal of Nutrition 104, 233-240.
349
Rankin JW & Turpyn AD (2007) Low carbohydrate, high fat diet increases C-reactive protein during weight loss. Journal of the American College of Nutrition 26, 163-169.
Rees G, Davies J, Thompson R, Parker M & Liepins P (2005) Randomised-controlled trial of a fibre supplement on the symptoms of irritable bowel syndrome. Journal of the Royal Society of Health 125, 30-34.
Reid M, Hammersley R, Hill AJ & Skidmore P (2007) Long-term dietary compensation for added sugar: effects of supplementary sucrose drinks over a 4-week period. British Journal of Nutrition 97, 193-203.
Reid M, Hammersley R & Duffy M (2010) Effects of sucrose drinks on macronutrient intake, body weight, and mood state in overweight women over 4 weeks. Appetite 55, 130-136.
Reid M, Hammersley R, Duffy M & Ballantyne C (2014) Effects on obese women of the sugar sucrose added to the diet over 28 d: a quasi-randomised, single-blind, controlled trial. Br J Nutr 111, 563-570.
Reppas C, Swidan SZ, Tobey SW, Turowski M & Dressman JB (2009) Hydroxypropylmethylcellulose significantly lowers blood cholesterol in mildly hypercholesterolemic human subjects. European Journal of Clinical Nutrition 63, 71-77.
Reynolds HRMR, Quiter EM & Hunninghake DBM (2000) Whole Grain Oat Cereal Lowers Serum Lipids. Topics in Clinical Nutrition, 15, 74-83.
Rigaud D, Ryttig KR, Angel LA & Apfelbaum M (1990) Overweight treated with energy restriction and a dietary fibre supplement: a 6-month randomized, double-blind, placebo-controlled trial. International Journal of Obesity 14, 763-769.
Rimm EB, Ascherio A, Giovannucci E, Spiegelman D, Stampfer MJ & Willett WC (1996) Vegetable, fruit, and cereal fiber intake and risk of coronary heart disease among men. JAMA 275, 447-451.
Roberfroid M (1993) Dietary fiber, inulin, and oligofructose: a review comparing their physiological effects. Crit Rev Food Sci Nutr 33, 103-148.
Roberts J, Jones GP, Rutishauser IHE, Birkett A & Gibbons C (2004) Resistant starch in the Australian diet. Nutr Diet 61, 98-104.
Robitaille J, Fontaine-Bisson B, Couture P, Tchernof A & Vohl MC (2005) Effect of an oat bran-rich supplement on the metabolic profile of overweight premenopausal women. Annals of Nutrition & Metabolism 49, 141-148.
Rodriguez-Rodriguez E, Lopez-Sobaler AM, Navarro AR, Bermejo LM, Ortega RM & Andres P (2008) Vitamin B6 status improves in overweight/obese women following a hypocaloric diet rich in breakfast cereals, and may help in maintaining fat-free mass. International Journal of Obesity 32, 1552-1558.
Romero AL, Romero JE, Galaviz S & Fernandez ML (1998) Cookies enriched with psyllium or oat bran lower plasma LDL cholesterol in normal and hypercholesterolemic men from Northern Mexico. Journal of the American College of Nutrition 17, 601-608.
350
Ross R (1999) Atherosclerosis--an inflammatory disease. N Engl J Med 340, 115-126.
Rugg-Gunn AJ, Hackett AF & Appleton DR (1987) Relative cariogenicity of starch and sugars in a 2-year longitudinal study of 405 English schoolchildren. Caries Res 21, 464-473.
Rugg-Gunn AJ, Hackett AF, Appleton DR, Jenkins GN & Eastoe JE (1984) Relationship between dietary habits and caries increment assessed over two years in 405 English adolescent school children. Arch Oral Biol 29, 983-992.
Rugg-Gunn AJ, Maguire A, Gordon PH, McCabe JF & Stephenson G (1998) Comparison of erosion of dental enamel by four drinks using an intra-oral applicance. Caries Res 32, 337-343.
Rumpler WV, Kramer M, Rhodes DG & Paul DR (2006) The impact of the covert manipulation of macronutrient intake on energy intake and the variability in daily food intake in nonobese men. International Journal of Obesity 30, 774-781.
Ruottinen S, Karjalainen S, Pienihakkinen K, Lagstrom H, Niinikoski H, Salminen M, Ronnemaa T & Simell O (2004) Sucrose intake since infancy and dental health in 10-year-old children. Caries Res 38, 142-148.
Ryle AJ, Davie S, Gould BJ & Yudkin JS (1990) A study of the effect of diet on glycosylated haemoglobin and albumin levels and glucose tolerance in normal subjects. Diabet Med 7, 865-870.
Sacks FM, Bray GA, Carey VJ, et al. (2009) Comparison of weight-loss diets with different compositions of fat, protein, and carbohydrates. N Engl J Med 360, 859-873.
SACN (2008) Draft SACN position statement on dietary fibre & health and the dietary fibre definition — August 2008. https://www.gov.uk/government/uploads/system/uploads/attachment_data/ file/339271/SACN_Narrative_Synthesis_Dietary_Fibre.pdf
SACN (2011) Dietary Reference Values for Energy. London: TSO.
SACN (2011) The influence of maternal,fetal and child nutrition on the developmentof chronic disease in later life. London: TSO.
SACN (2012) SACN Framework for evaluation of evidence. https://www.gov.uk/government/uploads/system/uploads/attachment_data/ file/338009/SACN_Framework_for_the_Evaluation_of_Evidence_May_2012.pdf
Sahyoun NR, Anderson AL, Tylavsky FA, Lee JS, Sellmeyer DE, Harris TB & Health AaBCS (2008) Dietary glycemic index and glycemic load and the risk of type 2 diabetes in older adults. American Journal of Clinical Nutrition 87, 126-131.
Sahyoun NR, Jacques PF, Zhang XL, Juan W & McKeown NM (2006) Whole-grain intake is inversely associated with the metabolic syndrome and mortality in older adults. American Journal of Clinical Nutrition 83, 124-131.
351
Sakuma S, Nakamura M & Miyazaki H (2007) Predictors of dental caries development in 1.5-year-old high-risk children in the Japanese public health service. J Public Health Dent 67, 14-19.
Sakurai M, Nakamura K, Miura K, et al. (2012) Dietary glycemic index and risk of type 2 diabetes mellitus in middle-aged Japanese men. Metabolism: Clinical & Experimental 61, 47-55.
Sakurai M, Nakamura K, Miura K, et al. (2014) Sugar-sweetened beverage and diet soda consumption and the 7-year risk for type 2 diabetes mellitus in middle-aged Japanese men. Eur J Nutr 53, 251-258.
Salas-Salvado J, Farres X, Luque X, et al. (2008) Effect of two doses of a mixture of soluble fibres on body weight and metabolic variables in overweight or obese patients: a randomised trial. British Journal of Nutrition 99, 1380-1387.
Saldana TM, Siega-Riz AM & Adair LS (2004) Effect of macronutrient intake on the development of glucose intolerance during pregnancy. Am J Clin Nutr 79, 479-486.
Salmeron J, Ascherio A, Rimm EB, Colditz GA, Spiegelman D, Jenkins DJ, Stampfer MJ, Wing AL & Willett WC (1997a) Dietary fiber, glycemic load, and risk of NIDDM in men. Diabetes Care 20, 545-550.
Salmeron J, Manson JE, Stampfer MJ, Colditz GA, Wing AL & Willett WC (1997b) Dietary fiber, glycemic load, and risk of non-insulin-dependent diabetes mellitus in women. JAMA 277, 472-477.
Saltzman E, Dallal GE & Roberts SB (1997) Effect of high-fat and low-fat diets on voluntary energy intake and substrate oxidation: studies in identical twins consuming diets matched for energy density, fiber, and palatability. American Journal of Clinical Nutrition 66, 1332-1339.
Saltzman E, Das SK, Lichtenstein AH, Dallal GE, Corrales A, Schaefer EJ, Greenberg AS & Roberts SB (2001) An oat-containing hypocaloric diet reduces systolic blood pressure and improves lipid profile beyond effects of weight loss in men and women. Journal of Nutrition 131, 1465-1470.
Salvini F, Riva E, Salvatici E, Boehm G, Jelinek J, Banderali G & Giovannini M (2011) A specific prebiotic mixture added to starting infant formula has long-lasting bifidogenic effects. Journal of Nutrition 141, 1335-1339.
Sanders TA & Reddy S (1992) The influence of rice bran on plasma lipids and lipoproteins in human volunteers. European Journal of Clinical Nutrition 46, 167-172.
Saris WH, Astrup A, Prentice AM, et al. (2000) Randomized controlled trial of changes in dietary carbohydrate/fat ratio and simple vs complex carbohydrates on body weight and blood lipids: the CARMEN study. The Carbohydrate Ratio Management in European National diets. International Journal of Obesity 24, 1310-1318.
352
Sarwar N, Gao P, Seshasai SR, et al. (2010) Diabetes mellitus, fasting blood glucose concentration, and risk of vascular disease: a collaborative meta-analysis of 102 prospective studies. Lancet 375, 2215-2222.
Schatzkin A & Gail M (2002) The promise and peril of surrogate end points in cancer research. Nat Rev Cancer 2, 19-27.
Schatzkin A, Lanza E, Corle D, et al. (2000) Lack of Effect of a Low-Fat, High-Fiber Diet on the Recurrence of Colorectal Adenomas. N Engl J Med 342, 1149-1155.
Schatzkin A, Mouw T, Park Y, Subar AF, Kipnis V, Hollenbeck A, Leitzmann MF & Thompson FE (2007) Dietary fiber and whole-grain consumption in relation to colorectal cancer in the NIH-AARP Diet and Health Study. American Journal of Clinical Nutrition 85, 1353-1360.
Schenk S, Davidson CJ, Zderic TW, Byerley LO & Coyle EF (2003) Different glycemic indexes of breakfast cereals are not due to glucose entry into blood but to glucose removal by tissue. The American Journal of Clinical Nutrition 78, 742-748.
Schlundt DG, Hill JO, Pope-Cordle J, Arnold D, Virts KL & Katahn M (1993) Randomized evaluation of a low fat ad libitum carbohydrate diet for weight reduction. International Journal of Obesity 17, 623-629.
Scholl TO, Chen X, Khoo CS & Lenders C (2004) The dietary glycemic index during pregnancy: influence on infant birth weight, fetal growth, and biomarkers of carbohydrate metabolism. American Journal of Epidemiology 159, 467-474.
Scholtens PA, Alles MS, Bindels JG, van der Linde EG, Tolboom JJ & Knol J (2006a) Bifidogenic effects of solid weaning foods with added prebiotic oligosaccharides: a randomised controlled clinical trial. Journal of Pediatric Gastroenterology & Nutrition 42, 553-559.
Scholtens PA, Alles MS, Willemsen LE, van den Braak C, Bindels JG, Boehm G & Govers MJ (2006b) Dietary fructo-oligosaccharides in healthy adults do not negatively affect faecal cytotoxicity: a randomised, double-blind, placebo-controlled crossover trial. British Journal of Nutrition 95, 1143-1149.
Scholtens PA, Alliet P, Raes M, Alles MS, Kroes H, Boehm G, Knippels LM, Knol J & Vandenplas Y (2008) Fecal secretory immunoglobulin A is increased in healthy infants who receive a formula with short-chain galacto-oligosaccharides and long-chain fructo-oligosaccharides. Journal of Nutrition 138, 1141-1147.
Schroeder TE, Hawkins SA, Hyslop D, Vallejo AF, Jensky NE & Wiswell RA (2007) Longitudinal change in coronary heart disease risk factors in older runners. Age Ageing 36, 57-62.
Schulz M, Liese AD, Fang F, Gilliard TS & Karter AJ (2006) Is the association between dietary glycemic index and type 2 diabetes modified by waist circumference? Diabetes Care 29, 1102-1104.
353
Schulze MB, Hoffmann K, Boeing H, et al. (2007a) An accurate risk score based on anthropometric, dietary, and lifestyle factors to predict the development of type 2 diabetes. Diabetes Care 30, 510-515.
Schulze MB, Liu S, Rimm EB, Manson JE, Willett WC & Hu FB (2004a) Glycemic index, glycemic load, and dietary fiber intake and incidence of type 2 diabetes in younger and middle-aged women. American Journal of Clinical Nutrition 80, 348-356.
Schulze MB, Manson JE, Ludwig DS, Colditz GA, Stampfer MJ, Willett WC & Hu FB (2004b) Sugar-sweetened beverages, weight gain, and incidence of type 2 diabetes in young and middle-aged women. JAMA 292, 927-934.
Schulze MB, Schulz M, Heidemann C, Schienkiewitz A, Hoffmann K & Boeing H (2007b) Fiber and magnesium intake and incidence of type 2 diabetes: a prospective study and meta-analysis. Archives of Internal Medicine 167, 956-965.
Schulze MB, Schulz M, Heidemann C, Schienkiewitz A, Hoffmann K & Boeing H (2008) Carbohydrate intake and incidence of type 2 diabetes in the European Prospective Investigation into Cancer and Nutrition (EPIC)-Potsdam Study. British Journal of Nutrition 99, 1107-1116.
Schwab U, Louheranta A, Torronen A & Uusitupa M (2006) Impact of sugar beet pectin and polydextrose on fasting and postprandial glycemia and fasting concentrations of serum total and lipoprotein lipids in middle-aged subjects with abnormal glucose metabolism. European Journal of Clinical Nutrition 60, 1073-1080.
Schwiertz A, Jacobi M, Frick JS, Richter M, Rusch Köhler H (2010) Microbiota in pediatric inflammatory bowel disease. Journal of Pediatrics 157, 240-244.
Sciarrone SE, Strahan MT, Beilin LJ, Burke V, Rogers P & Rouse IR (1993) Ambulatory blood pressure and heart rate responses to vegetarian meals. J Hypertens 11, 277-285.
Sculati O & Giampiccoli G (1984) Clinical trial of a new preparation with a high concentration of dietary fiber (fibraform). Current Therapeutic Research – Clinical and Experimental 36, 261-266.
Segal-Isaacson CJ, Johnson S, Tomuta V, Cowell B & Stein DT (2004) A randomized trial comparing low-fat and low-carbohydrate diets matched for energy and protein. Obes Res 12, Suppl-40S.
Seshadri P, Samaha FF, Stern L, Ahima RS, Daily D & Iqbal N (2005) Adipocytokine changes caused by low-carbohydrate compared to conventional diets in obesity. Metab Syndr Relat Disord 3, 66-74.
Shah M, Baxter JE, McGovern PG & Garg A (1996) Nutrient and food intake in obese women on a low-fat or low-calorie diet. Am J Health Promot 10, 179-182.
Shammas NW (2007) Epidemiology, classification, and modifiable risk factors of peripheral arterial disease. Vasc Health Risk Manag 3, 229-234.
354
Sharman MJ, Gomez AL, Kraemer WJ & Volek JS (2004) Very low-carbohydrate and low-fat diets affect fasting lipids and postprandial lipemia differently in overweight men. Journal of Nutrition 134, 880-885.
Sharman MJ & Volek JS (2004) Weight loss leads to reductions in inflammatory biomarkers after a very-low-carbohydrate diet and a low-fat diet in overweight men. Clinical Science 107, 365-369.
Sheppard L, Kristal AR & Kushi LH (1991) Weight loss in women participating in a randomized trial of low-fat diets. American Journal of Clinical Nutrition 54, 821-828.
Shikany JM, Margolis KL, Pettinger M, Jackson RD, Limacher MC, Liu S, Phillips LS & Tinker LF (2011) Effects of a low-fat dietary intervention on glucose, insulin, and insulin resistance in the Women's Health Initiative (WHI) Dietary Modification trial. American Journal of Clinical Nutrition 94, 75-85.
Shim JS, Oh K & Kim HC (2014) Dietary assessment methods in epidemiologic studies. Epidemiology and Health 36, e2014009.
Shin A, Li H, Shu XO, Yang G, Gao YT & Zheng W (2006) Dietary intake of calcium, fiber and other micronutrients in relation to colorectal cancer risk: Results from the Shanghai Women's Health Study. Int J Cancer 119, 2938-2942.
Sichieri R, Moura AS, Genelhu V, Hu F & Willett WC (2007) An 18-mo randomized trial of a low-glycemic-index diet and weight change in Brazilian women. Am J Clin Nutr 86, 707-713.
Sieri S, Krogh V, Berrino F, et al. (2010) Dietary glycemic load and index and risk of coronary heart disease in a large italian cohort: the EPICOR study. Archives of Internal Medicine 170, 640-647.
Sieri S, Krogh V, Muti P, Micheli A, Pala V, Crosignani P & Berrino F (2002) Fat and protein intake and subsequent breast cancer risk in postmenopausal women. Nutr Cancer 42, 10-17.
Sievenpiper JL, de Souza RJ, Mirrahimi A, et al. (2012) Effect of fructose on body weight in controlled feeding trials: a systematic review and meta-analysis. Ann Intern Med 156, 291-304.
Sievenpiper JL, Chiavaroli L, de Souza RJ, et al. (2012) 'Catalytic' doses of fructose may benefit glycaemic control without harming cardiometabolic risk factors: a small meta-analysis of randomised controlled feeding trials. Br J Nutr 108, 418-423.
Silvester KR, Bingham SA, Pollock JR, Cummings JH & O'Neill IK (1997) Effect of meat and resistant starch on fecal excretion of apparent N-nitroso compounds and ammonia from the human large bowel. Nutrition & Cancer 29, 13-23.
Simila ME, Kontto JP, Valsta LM, Mannisto S, Albanes D & Virtamo J (2012) Carbohydrate substitution for fat or protein and risk of type 2 diabetes in male smokers. European Journal of Clinical Nutrition 66, 716-721.
355
Simila ME, Valsta LM, Kontto JP, Albanes D & Virtamo J (2011) Low-, medium- and high-glycaemic index carbohydrates and risk of type 2 diabetes in men. British Journal of Nutrition 105, 1258-1264.
Simmons RK, Harding AH, Wareham NJ, Griffin SJ & EPIC-Norfolk Project Team (2007) Do simple questions about diet and physical activity help to identify those at risk of Type 2 diabetes? Diabet Med 24, 830-835.
Sinaud S, Montaurier C, Wils D, Vernet J, Brandolini M, Bouteloup-Demange C & Vermorel M (2002) Net energy value of two low-digestible carbohydrates, LycasinHBC and the hydrogenated polysaccharide fraction of LycasinHBC in healthy human subjects and their impact on nutrient digestive utilization. British Journal of Nutrition 87, 131-139.
Slavin J & Feirtag J (2011) Chicory inulin does not increase stool weight or speed up intestinal transit time in healthy male subjects. Food & Function 2, 72-77.
Sloth B, Due A, Larsen TM, Holst JJ, Heding A & Astrup A (2009) The effect of a high-MUFA, low-glycaemic index diet and a low-fat diet on appetite and glucose metabolism during a 6-month weight maintenance period. British Journal of Nutrition 101, 1846-1858.
Sloth B, Krog-Mikkelsen I, Flint A, Tetens I, Bjorck I, Vinoy S, Elmstahl H, Astrup A, Lang V & Raben A (2004) No difference in body weight decrease between a low-glycemic-index and a high-glycemic-index diet but reduced LDL cholesterol after 10-wk ad libitum intake of the low-glycemic-index diet. American Journal of Clinical Nutrition 80, 337-347.
Sluijs I, van YT, van ADL, Spijkerman AM, Hu FB, Grobbee DE & Beulens JW (2010) Carbohydrate quantity and quality and risk of type 2 diabetes in the European Prospective Investigation into Cancer and Nutrition-Netherlands (EPIC-NL) study. American Journal of Clinical Nutrition 92, 905-911.
Smith BG & Knight JK (1984) An index for measuring the wear of teeth. Br Dent J 156, 435-438.
Smith KN, Queenan KM, Thomas W, Fulcher RG & Slavin JL (2008) Physiological effects of concentrated barley beta-glucan in mildly hypercholesterolemic adults. Journal of the American College of Nutrition 27, 434-440.
Söderholm PP, Koskela AH, Lundin JE, Tikkanen MJ & Adlercreutz HC (2009) Plasma pharmacokinetics of alkylresorcinol metabolites: new candidate biomarkers for whole-grain rye and wheat intake. The American Journal of Clinical Nutrition 90, 1167-1171.
Sondike SB, Copperman N & Jacobson MS (2003) Effects of a low-carbohydrate diet on weight loss and cardiovascular risk factor in overweight adolescents. Journal of Pediatrics 142, 253-258.
Sorensen LB, Raben A, Stender S & Astrup A (2005) Effect of sucrose on inflammatory markers in overweight humans. American Journal of Clinical Nutrition 82, 421-427.
356
Sorensen LB, Vasilaras TH, Astrup A & Raben A (2014) Sucrose compared with artificial sweeteners: a clinical intervention study of effects on energy intake, appetite, and energy expenditure after 10 wk of supplementation in overweight subjects. Am J Clin Nutr 100, 36-45.
Southgate DA, Branch WJ, Hill MJ, Drasar BS, Walters RL, Davies PS & Baird IM (1976) Metabolic responses to dietary supplements of bran. Metabolism: Clinical & Experimental 25, 1129-1135.
Spiller GA, Chernoff MC & Hill RA (1980) Effect of purified cellulose, pectin, and a low-residue diet on fecal volatile fatty acids, transit time, and fecal weight in humans. American Journal of Clinical Nutrition 33, 754-759.
Spiller GA, Shipley EA, Chernoff MC & Cooper WC (1979) Bulk laxative efficacy of a psyllium seed hydrocolloid and of a mixture of cellulose and pectin. Journal of Clinical Pharmacology 19, 313-320.
Spiller GA, Story JA, Wong LG, Nunes JD, Alton M, Petro MS, Furumoto EJ, Whittam JH & Scala J (1986) Effect of Increasing Levels of Hard Wheat Fiber on Fecal Weight, Minerals and Steroids and Gastrointestinal Transit Time in Healthy Young Women. J Nutr 116, 778-785.
Spiller RC & Thompson WG (2010) Bowel Disorders. American Journal of Gastroenterology 105, 775-785.
Stamler J, Stamler R & Neaton JD (1993) Blood pressure, systolic and diastolic, and cardiovascular risks. US population data. Arch Intern Med 153, 598-615.
Stanhope KL, Bremer AA, Medici V, et al. (2011a) Consumption of fructose and high fructose corn syrup increase postprandial triglycerides, LDL-cholesterol, and apolipoprotein-B in young men and women. J Clin Endocrinol Metab 96, E1596-E1605.
Stanhope KL, Griffen SC, Bremer AA, et al. (2011b) Metabolic responses to prolonged consumption of glucose- and fructose-sweetened beverages are not associated with postprandial or 24-h glucose and insulin excursions. Am J Clin Nutr 94, 112-119.
Stanhope KL, Schwarz JM, Keim NL, et al. (2009) Consuming fructose-sweetened, not glucose-sweetened, beverages increases visceral adiposity and lipids and decreases insulin sensitivity in overweight/obese humans. J Clin Invest 119, 1322-1334.
Stasse-Wolthuis M, Albers HF, van Jeveren JG, Wil de Jong J, Hautvast JG, Hermus RJ, Katan MB, Brydon WG & Eastwood MA (1980) Influence of dietary fiber from vegetables and fruits, bran or citrus pectin on serum lipids, fecal lipids, and colonic function. American Journal of Clinical Nutrition 33, 1745-1756.
Stasse-Wolthuis M, Hautvast JG, Hermus RJ, Katan MB, Bausch JE, Rietberg-Brussaard JH, Velema JP, Zondervan JH, Eastwood MA & Brydon WG (1979) The effect of a natural high-fiber diet on serum lipids, fecal lipids, and colonic function. American Journal of Clinical Nutrition 32, 1881-1888.
357
Steele J & Lader D (2004) Social factors and oral health in children: Children's Dental Health in the United Kingdom, 2003. http://www.ons.gov.uk/ons/guide-method/method-quality/specific/health-methodology/dental-health/dental-health-of-children/cdh7-social-faactors-2003.pdf.
Steele J & O’ Sullivan I (2011) Adult dental health survey 2009: The Health and Social Care Information Centre.
Steffen LM, Jacobs DR, Jr., Stevens J, Shahar E, Carithers T & Folsom AR (2003) Associations of whole-grain, refined-grain, and fruit and vegetable consumption with risks of all-cause mortality and incident coronary artery disease and ischemic stroke: the Atherosclerosis Risk in Communities (ARIC) Study. American Journal of Clinical Nutrition 78, 383-390.
Steffen LM, Kroenke CH, Yu X, Pereira MA, Slattery ML, Van HL, Gross MD & Jacobs DR, Jr. (2005) Associations of plant food, dairy product, and meat intakes with 15-y incidence of elevated blood pressure in young black and white adults: the Coronary Artery Risk Development in Young Adults (CARDIA) Study. American Journal of Clinical Nutrition 82, 1169-1177.
Stephen AM, Dahl WJ, Sieber GM, van Blaricom JA & Morgan DR (1995) Effect of green lentils on colonic function, nitrogen balance, and serum lipids in healthy human subjects. American Journal of Clinical Nutrition 62, 1261-1267.
Stevens J, Ahn K, Juhaeri, Houston D, Steffan L & Couper D (2002) Dietary fiber intake and glycemic index and incidence of diabetes in African-American and white adults: The ARIC study. Diabetes Care 25, 1715-1721.
Stevens J, VanSoest PJ, Robertson JB & Levitsky DA (1988) Comparison of the effect of psyllium and wheat bran on gastrointestinal transit time and stool characteristics. Journal of the American Dietetic Association 88, 323-326.
Stewart ML, Nikhanj SD, Timm DA, Thomas W & Slavin JL (2010) Evaluation of the effect of four fibers on laxation, gastrointestinal tolerance and serum markers in healthy humans. Annals of Nutrition & Metabolism 56, 91-98.
Stoernell CK, Tangney CC & Rockway SW (2008) Short-term changes in lipoprotein subclasses and C-reactive protein levels of hypertriglyceridemic adults on low-carbohydrate and low-fat diets. Nutrition Research 28, 443-449.
Strayer L, Jacobs DR, Jr., Schairer C, Schatzkin A & Flood A (2007) Dietary carbohydrate, glycemic index, and glycemic load and the risk of colorectal cancer in the BCDDP cohort. Cancer Causes Control 18, 853-863.
Streppel MT, Ocke MC, Boshuizen HC, Kok FJ & Kromhout D (2008) Dietary fiber intake in relation to coronary heart disease and all-cause mortality over 40 y: the Zutphen Study. American Journal of Clinical Nutrition 88, 1119-1125.
358
Striegel-Moore RH, Thompson D, Affenito SG, Franko DL, Obarzanek E, Barton BA, Schreiber GB, Daniels SR, Schmidt M & Crawford PB (2006) Correlates of beverage intake in adolescent girls: the National Heart, Lung, and Blood Institute Growth and Health Study. Journal of Pediatrics 148, 183-187.
Stubbs RJ, Harbron CG & Prentice AM (1996) Covert manipulation of the dietary fat to carbohydrate ratio of isoenergetically dense diets: Effect on food intake in feeding men ad libitum. International Journal of Obesity 20, 651-660.
Sun Q, Spiegelman D, van RM, Holmes MD, Malik VS, Willett WC & Hu FB (2010) White rice, brown rice, and risk of type 2 diabetes in US men and women. Archives of Internal Medicine 170, 961-969.
Sundberg B (2008) Cholesterol lowering effects of a barley fibre flake product. Agro Food Industry Hi-Tech 19, 14-17.
Surwit RS, Feinglos MN, McCaskill CC, Clay SL, Babyak MA, Brownlow BS, Plaisted CS & Lin PH (1997) Metabolic and behavioral effects of a high-sucrose diet during weight loss. American Journal of Clinical Nutrition 65, 908-915.
Swain JF, Rouse IL, Curley CB & Sacks FM (1990) Comparison of the effects of oat bran and low-fiber wheat on serum lipoprotein levels and blood pressure. N Engl J Med 322, 147-152.
Swanson KS, Grieshop CM, Flickinger EA, Bauer LL, Wolf BW, Chow J, Garleb KA, Williams JA & Fahey Jr GC (2002) Fructooligosaccharides and Lactobacillus acidophilus modify bowel function and protein catabolites excreted by healthy humans. Journal of Nutrition 132, 3042-3050.
Swarbrick MM, Stanhope KL, Elliott SS, Graham JL, Krauss RM, Christiansen MP, Griffen SC, Keim NL & Havel PJ (2008) Consumption of fructose-sweetened beverages for 10 weeks increases postprandial triacylglycerol and apolipoprotein-B concentrations in overweight and obese women. Br J Nutr 100, 947-952.
Swinburn BA, Metcalf PA & Ley SJ (2001) Long-term (5-year) effects of a reduced-fat diet intervention in individuals with glucose intolerance. Diabetes Care 24, 619-624.
Szoke J, Banoczy J & Proskin HM (2001) Effect of after-meal sucrose-free gum-chewing on clinical caries. J Dent Res 80, 1725-1729.
Szpunar SM, Eklund SA & Burt BA (1995) Sugar consumption and caries risk in schoolchildren with low caries experience. Community Dentistry & Oral Epidemiology 23, 142-146.
Tada A, Ando Y & Hanada N (1999) Caries risk factors among three-year old children in Chiba, Japan. Asia Pac J Public Health 11, 109-112.
Tahiri M, Tressol JC, Arnaud J, et al. (2001) Five-week intake of short-chain fructo-oligosaccharides increases intestinal absorption and status of magnesium in postmenopausal women. Journal of Bone & Mineral Research 16, 2152-2160.
359
Tahiri M, Tressol JC, Arnaud J, et al. (2003) Effect of short-chain fructooligosaccharides on intestinal calcium absorption and calcium status in postmenopausal women: A stable-isotope study. American Journal of Clinical Nutrition 77, 449-457.
Takaishi H, Matsuki T, Nakazawa A, et al. (2008) Imbalance in intestinal microflora constitution could be involved in the pathogenesis of inflammatory bowel disease. Int J Med Microbiol 298, 463-472.
Tamaki Y, Nomura Y, Katsumura S, Okada A, Yamada H, Tsuge S, Kadoma Y & Hanada N (2009) Construction of a dental caries prediction model by data mining. J Oral Sci 51, 61-68.
Tannock GW, Munro K, Bibiloni R, Simon MA, Hargreaves P, Gopal P, Harmsen H & Welling G (2004) Impact of consumption of oligosaccharide-containing biscuits on the fecal microbiota of humans. Applied & Environmental Microbiology 70, 2129-2136.
Tasevska N, Midthune D, Potischman N, Subar AF, Cross AJ, Bingham SA, Schatzkin A & Kipnis V (2011) Use of the predictive sugars biomarker to evaluate self-reported total sugars intake in the Observing Protein and Energy Nutrition (OPEN) study. Cancer Epidemiol Biomarkers Prev 20, 490-500.
Tasevska N, Runswick SA, McTaggart A & Bingham SA (2005) Urinary sucrose and fructose as biomarkers for sugar consumption. Cancer Epidemiol Biomarkers Prev 14, 1287-1294.
Tasevska N, Runswick SA, Welch AA, McTaggart A & Bingham SA (2009) Urinary sugars biomarker relates better to extrinsic than to intrinsic sugars intake in a metabolic study with volunteers consuming their normal diet. Eur J Clin Nutr 63, 653-659.
Te Morenga LA, Howatson AJ, Jones RM & Mann J (2014) Dietary sugars and cardiometabolic risk: systematic review and meta-analyses of randomized controlled trials of the effects on blood pressure and lipids. Am J Clin Nutr 100, 65-79.
Te Morenga L, Mallard S & Mann J (2013) Dietary sugars and body weight: systematic review and meta-analyses of randomised controlled trials and cohort studies. BMJ 346, e7492.
Te Morenga L, Williams S, Brown R & Mann J (2010) Effect of a relatively high-protein, high-fiber diet on body composition and metabolic risk factors in overweight women. Eur J Clin Nutr 64, 1323-1331.
Teff KL, Elliott SS, Tschop M, Kieffer TJ, Rader D, Heiman M, Townsend RR, Keim NL, D'Alessio D & Havel PJ (2004) Dietary fructose reduces circulating insulin and leptin, attenuates postprandial suppression of ghrelin, and increases triglycerides in women. J Clin Endocrinol Metab 89, 2963-2972.
Teff KL, Grudziak J, Townsend RR, Dunn TN, Grant RW, Adams SH, Keim NL, Cummings BP, Stanhope KL & Havel PJ (2009) Endocrine and metabolic effects of consuming fructose- and glucose-sweetened beverages with meals in obese men and women: influence of insulin resistance on plasma triglyceride responses. J Clin Endocrinol Metab 94, 1562-1569.
360
Terry P, Giovannucci E, Michels KB, Bergkvist L, Hansen H, Holmberg L & Wolk A (2001) Fruit, vegetables, dietary fiber, and risk of colorectal cancer. J Natl Cancer Inst 93, 525-533.
Terry P, Jain M, Miller AB, Howe GR & Rohan TE (2002) Dietary intake of folic acid and colorectal cancer risk in a cohort of women. Int J Cancer 97, 864-867.
Terry PD, Jain M, Miller AB, Howe GR & Rohan TE (2003) Glycemic load, carbohydrate intake, and risk of colorectal cancer in women: a prospective cohort study. J Natl Cancer Inst 95, 914-916.
Thane CW, Jones AR, Stephen AM, Seal CJ & Jebb SA (2007) Comparative whole-grain intake of British adults in 1986-7 and 2000-1. Br J Nutr 97, 987-992.
The InterAct Consortium (2013) Consumption of sweet beverages and type 2 diabetes incidence in European adults: results from EPIC-InterAct. Diabetologia 56, 1520-1530.
Theuwissen E & Mensink RP (2007) Simultaneous intake of beta-glucan and plant stanol esters affects lipid metabolism in slightly hypercholesterolemic subjects. Journal of Nutrition 137, 583-588.
Thompson WG, Rostad HN, Janzow DJ, Slezak JM, Morris KL & Zemel MB (2005) Effect of energy-reduced diets high in dairy products and fiber on weight loss in obese adults. Obes Res 13, 1344-1353.
Thorens B & Mueckler M (2010) Glucose transporters in the 21st Century. Am J Physiol Endocrinol Metab 298, E141-E145.
Threapleton DE, Greenwood DC, Burley VJ, Aldwairji M & Cade JE (2013a) Dietary fibre and cardiovascular disease mortality in the UK Women's Cohort Study. Eur J Epidemiol 28, 335-346.
Threapleton DE, Greenwood DC, Evans C, Cleghorn CL, Nykjaer C, Woodhead C & Burley VJ (2013b) Dietary fibre intake and diabetes risk: a systematic review and meta-analysis of prospective studies. Proceedings of the Nutrition Society 72, E253.
Threapleton DE, Greenwood DC, Evans CE, Cleghorn CL, Nykjaer C, Woodhead C, Cade JE, Gale CP & Burley VJ (2013c) Dietary fiber intake and risk of first stroke: a systematic review and meta-analysis. Stroke 44, 1360-1368.
Threapleton DE, Greenwood DC, Evans CE, Cleghorn CL, Nykjaer C, Woodhead C, Cade JE, Gale CP & Burley VJ (2013d) Dietary fibre intake and risk of cardiovascular disease: systematic review and meta-analysis. BMJ 347, f6879.
Tighe P, Duthie G, Vaughan N, Brittenden J, Simpson WG, Duthie S, Mutch W, Wahle K, Horgan G & Thies F (2010) Effect of increased consumption of whole-grain foods on blood pressure and other cardiovascular risk markers in healthy middle-aged persons: a randomized controlled trial. American Journal of Clinical Nutrition 92, 733-740.
Timm DA, Thomas W, Boileau TW, Williamson-Hughes PS & Slavin JL (2013) Polydextrose and soluble corn fiber increase five-day fecal wet weight in healthy men and women. J Nutr 143, 473-478.
361
Tinker LF, Bonds DE, Margolis KL, et al. (2008) Low-fat dietary pattern and risk of treated diabetes mellitus in postmenopausal women: the Women's Health Initiative randomized controlled dietary modification trial. Archives of Internal Medicine 168, 1500-1511.
Tinker LF, Schneeman BO, Davis PA, Gallaher DD & Waggoner CR (1991) Consumption of prunes as a source of dietary fiber in men with mild hypercholesterolemia. American Journal of Clinical Nutrition 53, 1259-1265.
Todd S, Woodward M, Tunstall-Pedoe H & Bolton-Smith C (1999) Dietary antioxidant vitamins and fiber in the etiology of cardiovascular disease and all-causes mortality: results from the Scottish Heart Health Study. Am J Epidemiol 150, 1073-1080.
Tomlin J & Read NW (1988) Comparison of the effects on colonic function caused by feeding rice bran and wheat bran. European Journal of Clinical Nutrition 42, 857-861.
Tomlin J & Read NW (1990) The effect of resistant starch on colon function in humans. British Journal of Nutrition 64, 589-595.
Toscani MK, Mario FM, Radavelli-Bagatini S, Wiltgen D, Matos MC & Spritzer PM (2011) Effect of high-protein or normal-protein diet on weight loss, body composition, hormone, and metabolic profile in southern Brazilian women with polycystic ovary syndrome: a randomized study. Gynecol Endocrinol 27, 925-930.
Tovar A, Must A, Bermudez OI, Hyatt RR & Chasan-Taber L (2009) The impact of gestational weight gain and diet on abnormal glucose tolerance during pregnancy in Hispanic women. Maternal & Child Health Journal 13, 520-530.
Tredger JA, Morgan LM, Travis J & Marks V (1991) The effects of guar gum, sugar beet fibre and wheat bran supplementation on serum lipoprotein levels in normocholesterolaemic volunteers. Journal of Human Nutrition and Dietetics 4, 375-384.
Trinidad TP, Wolever TM & Thompson LU (1996) Effect of acetate and propionate on calcium absorption from the rectum and distal colon of humans. Am J Clin Nutr 63, 574-578.
Trinidad TP, Wolever TM & Thompson LU (1997) Effect of short chain fatty acids on calcium absorption in humans. Adv Exp Med Biol 427, 183-189.
Trinidad TP, Wolever TM & Thompson LU (1999) Effects of calcium concentration, acetate, and propionate on calcium absorption in the human distal colon. Nutrition 15, 529-533.
Truesdale KP, Stevens J & Cai J (2008) Effect of 3-year weight history on blood pressure: the atherosclerosis risk in communities study. Obesity (Silver Spring) 16, 1112-1119.
Tsai AC, Mott EL, Owen GM, Bennick MR, Lo GS & Steinke FH (1983) Effects of soy polysaccharide on gastrointestinal functions, nutrient balance, steroid excretions, glucose tolerance, serum lipids, and other parameters in humans. American Journal of Clinical Nutrition 38, 504-511.
362
Tuohy KM, Kolida S, Lustenberger AM & Gibson GR (2001) The prebiotic effects of biscuits containing partially hydrolysed guar gum and fructo-oligosaccharides – A human volunteer study. British Journal of Nutrition 86, 341-348.
Turley ML, Skeaff CM, Mann JI & Cox B (1998) The effect of a low-fat, high-carbohydrate diet on serum high density lipoprotein cholesterol and triglyceride. European Journal of Clinical Nutrition 52, 728-732.
Turpeinen AM, Juntunen K, Mutanen M & Mykkanen H (2000) Similar responses in hemostatic factors after consumption of wholemeal rye bread and low-fiber wheat bread. European Journal of Clinical Nutrition 54, 418-423.
Twisk JW, Kemper HC, van MW, Post GB & Van Lenthe FJ (1998) Body fatness: longitudinal relationship of body mass index and the sum of skinfolds with other risk factors for coronary heart disease. International Journal of Obesity 22, 915-922.
Vale GC, Tabchoury CP, Arthur RA, Del Bel Cury AA, Paes Leme AF & Cury JA (2007) Temporal relationship between sucrose-associated changes in dental biofilm composition and enamel demineralization. Caries Res 41, 406-412.
van Bakel MM, Slimani N, Feskens EJ, et al. (2009) Methodological challenges in the application of the glycemic index in epidemiological studies using data from the European Prospective Investigation into Cancer and Nutrition. J Nutr 139, 568-575.
van Dam RM, Hu FB, Rosenberg L, Krishnan S & Palmer JR (2006) Dietary calcium and magnesium, major food sources, and risk of type 2 diabetes in U.S. black women. [erratum appears in Diabetes Care. 2008 Oct;31(10):2077]. Diabetes Care 29, 2238-2243.
van Dam RM, Visscher AW, Feskens EJ, Verhoef P & Kromhout D (2000) Dietary glycemic index in relation to metabolic risk factors and incidence of coronary heart disease: the Zutphen Elderly Study. European Journal of Clinical Nutrition 54, 726-731.
van den Brandt PA, Goldbohm RA, van 't Veer P, Volovics A, Hermus RJ & Sturmans F (1990) A large-scale prospective cohort study on diet and cancer in The Netherlands. J Clin Epidemiol 43, 285-295.
van den Heuvel EG, Muijs T, Brouns F & Hendriks HF (2009) Short-chain fructo-oligosaccharides improve magnesium absorption in adolescent girls with a low calcium intake. Nutrition Research 29, 229-237.
van den Heuvel EGHM, Schaafsma G, Muys T & Van Dokkum W (1998) Nondigestible oligosaccharides do not interfere with calcium and nonheme-iron absorption in young, healthy men. American Journal of Clinical Nutrition 67, 445-451.
van den Heuvel EGHM, Wils D, Pasman WJ, Bakker M, Saniez MH & Kardinaal AFM (2004) Short-term digestive tolerance of different doses of NUTRIOSEFB, a food dextrin, in adult men. European Journal of Clinical Nutrition 58, 1046-1055.
van den Heuvel EGHM, Muys T, van Dokkum W & Schaafsma G (1999) Oligofructose stimulates calcium absorption in adolescents. Am J Clin Nutr 69, 544-548.
363
van den Heuvel EGHM, Schoterman MHC & Muijs T (2000) Transgalactooligosaccharides Stimulate Calcium Absorption in Postmenopausal Women. J Nutr 130, 2938-2942.
van der Kamp JW, Poutanen K, Seal CJ & Richardson DP (2014) The HEALTHGRAIN definition of 'whole grain'. Food Nutr Res 58.
van Dokkum W, Wezendonk B, Srikumar TS & van den Heuvel EG (1999) Effect of nondigestible oligosaccharides on large-bowel functions, blood lipid concentrations and glucose absorption in young healthy male subjects. European Journal of Clinical Nutrition 53, 1-7.
van Es AJ, De Groot L & Vogt JE (1986) Energy balances of eight volunteers fed on diets supplemented with either lactitol or saccharose. British Journal of Nutrition 56, 545-554.
van Loo J, Coussement P, de Leenheer L, Hoebregs H & Smits G (1995) On the presence of inulin and oligofructose as natural ingredients in the western diet. Crit Rev Food Sci Nutr 35, 525-552.
van Rijkom HM, Truin GJ, Frencken JE, Konig KG, Van 't Hof MA, Bronkhorst EM & Roeters FJ (2002) Prevalence, distribution and background variables of smooth-bordered tooth wear in teenagers in the hague, the Netherlands. Caries Res 36, 147-154.
van Woudenbergh GJ, Kuijsten A, Sijbrands EJ, Hofman A, Witteman JC & Feskens EJ (2011) Glycemic index and glycemic load and their association with C-reactive protein and incident type 2 diabetes. J Nutr Metab 2011, 623076.
Vasilaras TH, Raben A & Astrup A (2001) Twenty-four hour energy expenditure and substrate oxidation before and after 6 months' ad libitum intake of a diet rich in simple or complex carbohydrates or a habitual diet. International Journal of Obesity 25, 954-965.
Veereman-Wauters G, Staelens S, Van H, Plaskie K, Wesling F, Roger LC, McCartney AL & Assam P (2011) Physiological and bifidogenic effects of prebiotic supplements in infant formulae. Journal of Pediatric Gastroenterology & Nutrition 52, 763-771.
Venables MC, Shaw L, Jeukendrup AE, Roedig-Penman A, Finke M, Newcombe RG, Parry J & Smith AJ (2005) Erosive effect of a new sports drink on dental enamel during exercise. Medicine & Science in Sports & Exercise 37, 39-44.
Venn BJ & Green TJ (2007) Glycemic index and glycemic load: measurement issues and their effect on diet-disease relationships. Eur J Clin Nutr 61 Suppl 1, S122-S131.
Venn BJ, Perry T, Green TJ, et al. (2010) The effect of increasing consumption of pulses and wholegrains in obese people: a randomized controlled trial. Journal of the American College of Nutrition 29, 365-372.
Vermorel M, Coudray C, Wils D, Sinaud S, Tressol JC, Montaurier C, Vernet J, Brandolini M, Bouteloup-Demange C & Rayssiguier Y (2004) Energy value of a low-digestible carbohydrate, NUTRIOSE FB, and its impact on magnesium, calcium and zinc apparent absorption and retention in healthy young men. European Journal of Nutrition 43, 344-352.
364
Vester Boler BM, Serao MC, Bauer LL, Staeger MA, Boileau TW, Swanson KS & Fahey GC, Jr. (2011) Digestive physiological outcomes related to polydextrose and soluble maize fibre consumption by healthy adult men. British Journal of Nutrition 106, 1864-1871.
Vido L, Facchin P, Antonello I, Gobber D & Rigon F (1993) Childhood obesity treatment: double blinded trial on dietary fibres (glucomannan) versus placebo. Padiatr Padol 28, 133-136.
Villegas R, Liu S, Gao YT, Yang G, Li H, Zheng W & Shu XO (2007) Prospective study of dietary carbohydrates, glycemic index, glycemic load, and incidence of type 2 diabetes mellitus in middle-aged Chinese women. Archives of Internal Medicine 167, 2310-2316.
Volek JS, Sharman MJ, Gomez AL, Judelson DA, Rubin MR, Watson G, Sokmen B, Silvestre R, French DN & Kraemer WJ (2004) Comparison of energy-restricted very low-carbohydrate and low-fat diets on weight loss and body composition in overweight men and women. Nutr Metab, 1, 13.
Volp ACP, Hermsdorff HHM & Bressan J (2008) Glycemia and insulinemia evaluation after high-sucrose and high-fat diets in lean and overweight/obese women. J Physiol Biochem 64, 103-114.
Vuksan V, Jenkins AL, Jenkins DJ, Rogovik AL, Sievenpiper JL & Jovanovski E (2008) Using cereal to increase dietary fiber intake to the recommended level and the effect of fiber on bowel function in healthy persons consuming North American diets. American Journal of Clinical Nutrition 88, 1256-1262.
Vuksan V, Jenkins DJ, Vidgen E, Ransom TP, Ng MK, Culhane CT & O'Connor D (1999) A novel source of wheat fiber and protein: effects on fecal bulk and serum lipids. American Journal of Clinical Nutrition 69, 226-230.
Vulevic J, Drakoularakou A, Yaqoob P, Tzortzis G & Gibson GR (2008) Modulation of the fecal microflora profile and immune function by a novel trans-galactooligosaccharide mixture (B-GOS) in healthy elderly volunteers. American Journal of Clinical Nutrition 88, 1438-1446.
Wakai K, Date C, Fukui M, et al. (2007) Dietary Fiber and Risk of Colorectal Cancer in the Japan Collaborative Cohort Study. Cancer Epidemiology Biomarkers Prevention 16, 668-675.
Waligora-Dupriet AJ, Campeotto F, Nicolis I, Bonet A, Soulaines P, Dupont C & Butel MJ (2007) Effect of oligofructose supplementation on gut microflora and well-being in young children attending a day care centre. International Journal of Food Microbiology 113, 108-113.
Waller SM, Vander Wal JS, Klurfeld DM, McBurney MI, Cho S, Bijlani S & Dhurandhar NV (2004) Evening ready-to-eat cereal consumption contributes to weight management. Journal of the American College of Nutrition 23, 316-321.
365
Wallstrom P, Sonestedt E, Hlebowicz J, Ericson U, Drake I, Persson M, Gullberg B, Hedblad B & Wirfalt E (2012) Dietary fiber and saturated fat intake associations with cardiovascular disease differ by sex in the Malmo Diet and Cancer Cohort: a prospective study. PLoS ONE 7, e31637.
Walton GE, Rastall RA, Martini MC, Williams CE, Jeffries RL & Gibson GR (2010) A double-blind, placebo controlled human study investigating the effects of coffee derived manno-oligosaccharides on the faecal microbiota of a healthy adult population. International Journal of Probiotics and Prebiotics 5, 75-83.
Walton GE, van EG, Kosters MH, Rastall RA, Tuohy KM & Gibson GR (2012) A randomised crossover study investigating the effects of galacto-oligosaccharides on the faecal microbiota in men and women over 50 years of age. British Journal of Nutrition 107, 1466-1475.
Walton GE, Lu C, Trogh I, Arnaut F & Gibson GR (2012) A randomised, double-blind, placebo controlled cross-over study to determine the gastrointestinal effects of consumption of arabinoxylan-oligosaccharides enriched bread in healthy volunteers. Nutrition Journal 11, 36.
Wang L, Gaziano JM, Liu S, Manson JE, Buring JE & Sesso HD (2007) Whole- and refined-grain intakes and the risk of hypertension in women. American Journal of Clinical Nutrition 86, 472-479.
Wang X, Bao W, Liu J, et al. (2013) Inflammatory markers and risk of type 2 diabetes: a systematic review and meta-analysis. Diabetes Care 36, 166-175.
Wannamethee SG, Thomas MC, Whincup PH & Sattar N (2009) Associations Between Dietary Fiber and Inflammation, Hepatic Function, and Risk of Type 2 Diabetes in Older Men Potential mechanisms for the benefits of fiber on diabetes risk. Diabetes Care 32, 1823-1825.
Ward RE, Ninonuevo M, Mills DA, Lebrilla CB & German JB (2006) In vitro fermentation of breast milk oligosaccharides by Bifidobacterium infantis and Lactobacillus gasseri. Appl Environ Microbiol 72, 4497-4499.
Warren JJ, Weber-Gasparoni K, Marshall TA, Drake DR, Dehkordi-Vakil F, Kolker JL & Dawson DV (2008) Factors associated with dental caries experience in 1-year-old children. J Public Health Dent 68, 70-75.
Watson PE & McDonald BW (2010) The association of maternal diet and dietary supplement intake in pregnant New Zealand women with infant birth weight. European Journal of Clinical Nutrition 64, 184-193.
Weaver LT (1988) Bowel habit from birth to old age. J Pediatr Gastroenterol Nutr 7, 637-640.
Weijenberg MP, Mullie PF, Brants HA, Heinen MM, Goldbohm RA & van den Brandt PA (2008) Dietary glycemic load, glycemic index and colorectal cancer risk: results from the Netherlands Cohort Study. Int J Cancer 122, 620-629.
366
West NX, Hughes JA, Parker D, Weaver LJ, Moohan M, De'Ath J & Addy M (2004) Modification of soft drinks with xanthan gum to minimise erosion: a study in situ. Br Dent J 196, 478-481.
West NX, Hughes JA, Parker DM, Moohan M & Addy M (2003) Development of low erosive carbonated fruit drinks 2. Evaluation of an experimental carbonated blackcurrant drink compared to a conventional carbonated drink. J Dent 31, 361-365.
West NX, Hughes JA, Parker DM, Newcombe RG & Addy M (1999) Development and evaluation of a low erosive blackcurrant juice drink. 2. Comparison with a conventional blackcurrant juice drink and orange juice. J Dent 27, 341-344.
West NX, Maxwell A, Hughes JA, Parker DM, Newcombe RG & Addy M (1998) A method to measure clinical erosion: the effect of orange juice consumption on erosion of enamel. J Dent 26, 329-335.
Weyer C, Hanson K, Bogardus C & Pratley RE (2000) Long-term changes in insulin action and insulin secretion associated with gain, loss, regain and maintenance of body weight. Diabetologia 43, 36-46.
Whelton PK (1994) Epidemiology of hypertension. The Lancet 344, 101-106.
White D, Pitts N, Steele J, Sadler K & Chadwick B (2011) Disease and related disorders – a report from the Adult Dental Health Survey 2009. http://www.hscic.gov.uk/catalogue/PUB01086/adul-dent-heal-surv-summ-them-the2-2009-rep4.pdf
WHO (2003) Joint WHO/FAO Expert Consultation. Diet, nutrition and the prevention of chronic diseases. Geneva: World Health Organization.
WHO (2006) Definition and diagnosis of diabetes mellitus and intermediate hyperglycemia: report of a WHO/IDF consultation. Geneva: World Health Organization.
WHO (2007a) Prevention of CVD: guidelines for assessment and management of total cardiovascular risk. Geneva: World Health Organization.
WHO (2007b) The challenge of obesity in the WHO European region and the strategies for response. Geneva: World Health Organization.
WHO (2011) Use of Glycated Haemoglobin (HbA1c) in the Diagnosis of Diabetes Mellitus. Geneva: World Health Organization.
WHO (2015) Guideline: Sugars intake for adults and children. Geneva: World Health Organization.
Whyte JL, McArthur R, Topping D & Nestel P (1992) Oat bran lowers plasma cholesterol levels in mildly hypercholesterolemic men. Journal of the American Dietetic Association 92, 446-449.
Willett WC & Hu FB (2007) The Food Frequency Questionnaire. Cancer Epidemiology Biomarkers & Prevention 16, 182-183.
367
Wilson PWF, Kauppila LI, O'Donnell CJ, Kiel DP, Hannan M, Polak JM & Cupples LA (2001) Abdominal Aortic Calcific Deposits Are an Important Predictor of Vascular Morbidity and Mortality. Circulation 103, 1529-1534.
Wilson RF & Ashley FP (1989) Identification of caries risk in schoolchildren: salivary buffering capacity and bacterial counts, sugar intake and caries experience as predictors of 2-year and 3-year caries increment. Br Dent J 167, 99-102.
Wirstrom T, Hilding A, Gu HF, Ostenson CG & Bjorklund A (2013) Consumption of whole grain reduces risk of deteriorating glucose tolerance, including progression to prediabetes. Am J Clin Nutr 97, 179-187.
Wisker E, Daniel M & Feldheim W (1994a) Effects of a fiber concentrate from citrus fruits in humans. Nutrition Research 14, 361-372.
Wisker E, Schweizer TF, Daniel M & Feldheim W (1994b) Fibre-mediated physiological effects of raw and processed carrots in humans. British Journal of Nutrition 72, 579-599.
Witte DR, Westerink J, de Koning EJ, van der Graaf Y, Grobbee DE & Bots ML (2005) Is the Association Between Flow-Mediated Dilation and Cardiovascular Risk Limited to Low-Risk Populations? J Am Coll Cardiol 45, 1987-1993.
Wolever TM & Mehling C (2002) High-carbohydrate-low-glycaemic index dietary advice improves glucose disposition index in subjects with impaired glucose tolerance. British Journal of Nutrition 87, 477-487.
Wolever TM & Mehling C (2003) Long-term effect of varying the source or amount of dietary carbohydrate on postprandial plasma glucose, insulin, triacylglycerol, and free fatty acid concentrations in subjects with impaired glucose tolerance. American Journal of Clinical Nutrition 77, 612-621.
Wolk A, Manson JE, Stampfer MJ, Colditz GA, Hu FB, Speizer FE, Hennekens CH & Willett WC (1999) Long-term intake of dietary fiber and decreased risk of coronary heart disease among women. JAMA 281, 1998-2004.
Wood RJ, Fernandez ML, Sharman MJ, et al. (2007) Effects of a carbohydrate-restricted diet with and without supplemental soluble fiber on plasma low-density lipoprotein cholesterol and other clinical markers of cardiovascular risk. Metabolism 56, 58-67.
Wood RJ, Gregory SM, Sawyer J, Milch CM, Matthews TD & Headley SA (2012) Preservation of fat-free mass after two distinct weight loss diets with and without progressive resistance exercise. Metabolic Syndrome & Related Disorders 10, 167-174.
Wood RJ, Volek JS, Davis SR, Dell'Ova C & Fernandez ML (2006) Effects of a carbohydrate-restricted diet on emerging plasma markers for cardiovascular disease. Nutr Metab 3, 19.
World Cancer Research Fund & American Institute for Cancer Research (2007) Food, Nutrition, Physical Activity, and the Prevention of Cancer: a Global Perspective. Washington DC: AICR.
368
Wycherley TP, Brinkworth GD, Keogh JB, Noakes M, Buckley JD & Clifton PM (2010) Long-term effects of weight loss with a very low carbohydrate and low fat diet on vascular function in overweight and obese patients. J Intern Med 267, 452-461.
Wilcox AJ (2001) On the importance--and the unimportance--of birth weight. Int J Epidemiol 30, 1233-1241.
Wyman JB, Heaton KW, Manning AP & Wicks AC (1976) The effect on intestinal transit and the feces of raw and cooked bran in different doses. American Journal of Clinical Nutrition 29, 1474-1479.
Yang Q, Zhang Z, Gregg EW, Flanders W, Merritt R & Hu FB (2014) Added sugar intake and cardiovascular diseases mortality among us adults. JAMA Internal Medicine. 174, 516-524
Yeboah J, Crouse JR, Hsu FC, Burke GL & Herrington DM (2007) Brachial Flow-Mediated Dilation Predicts Incident Cardiovascular Events in Older Adults: The Cardiovascular Health Study. Circulation 115, 2390-2397.
Yu R, Woo J, Chan R, Sham A, Ho S, Tso A, Cheung B, Lam TH & Lam K (2011) Relationship between dietary intake and the development of type 2 diabetes in a Chinese population: the Hong Kong Dietary Survey. Public Health Nutrition 14, 1133-1141.
Zambon A, Sartore G, Passera D, Francini-Pesenti F, Bassi A, Basso C, Zambon S, Manzato E & Crepaldi G (1999) Effects of hypocaloric dietary treatment enriched in oleic acid on LDL and HDL subclass distribution in mildly obese women. J Intern Med 246, 191-201.
Zaveri S & Drummond S (2009) The effect of including a conventional snack (cereal bar) and a nonconventional snack (almonds) on hunger, eating frequency, dietary intake and body weight. Journal of Human Nutrition and Dietetics 22, 461-468.
Zhang C, Liu S, Solomon CG & Hu FB (2006) Dietary fiber intake, dietary glycemic load, and the risk for gestational diabetes mellitus. Diabetes Care 29, 2223-2230.
Zhang X, Albanes D, Beeson WL, et al. (2010) Risk of colon cancer and coffee, tea, and sugar-sweetened soft drink intake: pooled analysis of prospective cohort studies. Journal of the National Cancer Institute 102, 771-783.
Zhang YH, An T, Zhang RC, Zhou Q, Huang Y & Zhang J (2013) Very high fructose intake increases serum LDL-cholesterol and total cholesterol: a meta-analysis of controlled feeding trials. J Nutr 143, 1391-1398.
Zhong J, Luo BY, Xiang MJ, Liu HW, Zhai ZK, Wang TS & Craig SAS (2000) Studies on the effects of polydextrose intake on physiologic funtions in Chinese people. American Journal of Clinical Nutrition 72, 1503-1509.
369