Embed Size (px)
Citation preview
THISEXIT
MARKET
In Today’s Global Food & Beverage Environment
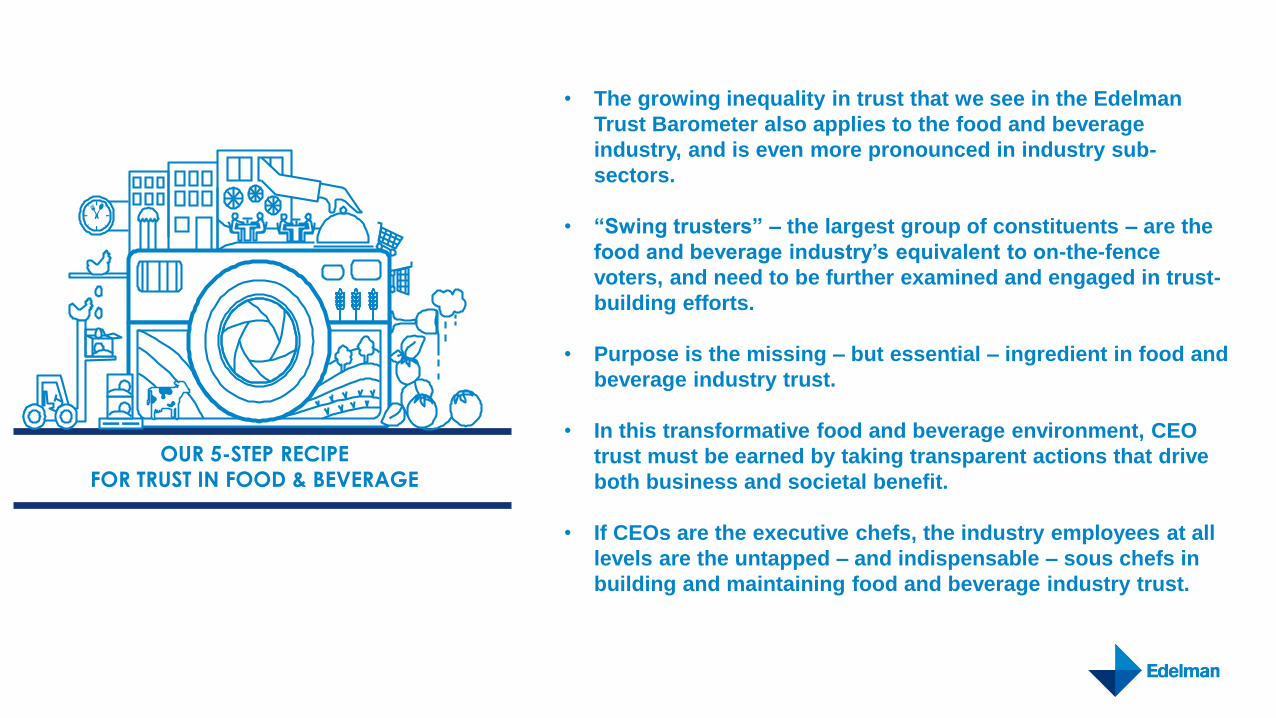
OUR 5-STEP RECIPE
FOR TRUST IN FOOD & BEVERAGE
• The growing inequality in trust that we see in the Edelman
Trust Barometer also applies to the food and beverage
industry, and is even more pronounced in industry sub-
sectors.
• “Swing trusters” – the largest group of constituents – are the
food and beverage industry’s equivalent to on-the-fence
voters, and need to be further examined and engaged in trust-
building efforts.
• Purpose is the missing – but essential – ingredient in food and
beverage industry trust.
• In this transformative food and beverage environment, CEO
trust must be earned by taking transparent actions that drive
both business and societal benefit.
• If CEOs are the executive chefs, the industry employees at all
levels are the untapped – and indispensable – sous chefs in
building and maintaining food and beverage industry trust.
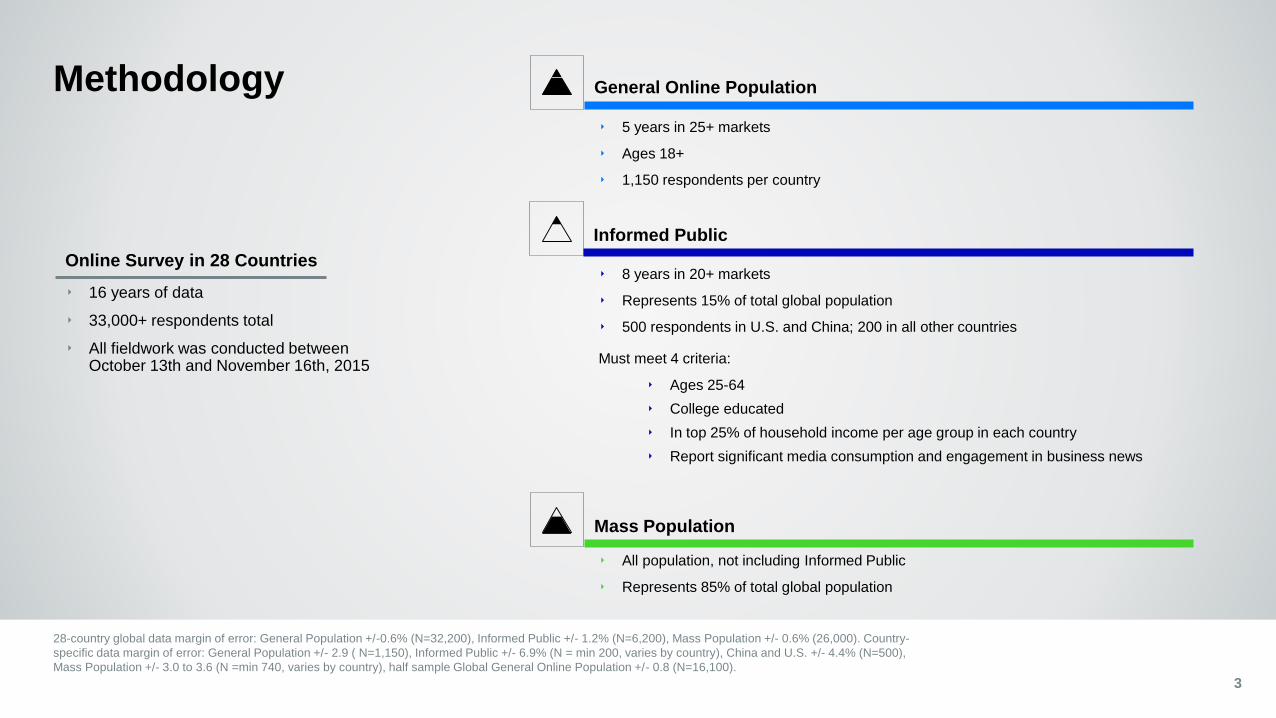
Informed Public
‣ 8 years in 20+ markets
‣ Represents 15% of total global population
‣ 500 respondents in U.S. and China; 200 in all other countries
Must meet 4 criteria:
‣ Ages 25-64
‣ College educated
‣ In top 25% of household income per age group in each country
‣ Report significant media consumption and engagement in business news
General Online Population
‣ 5 years in 25+ markets
‣ Ages 18+
‣ 1,150 respondents per country
Methodology
28-country global data margin of error: General Population +/-0.6% (N=32,200), Informed Public +/- 1.2% (N=6,200), Mass Population +/- 0.6% (26,000). Country-
specific data margin of error: General Population +/- 2.9 ( N=1,150), Informed Public +/- 6.9% (N = min 200, varies by country), China and U.S. +/- 4.4% (N=500),
Mass Population +/- 3.0 to 3.6 (N =min 740, varies by country), half sample Global General Online Population +/- 0.8 (N=16,100).
‣ 16 years of data
‣ 33,000+ respondents total
‣ All fieldwork was conducted between October 13th and November 16th, 2015
Online Survey in 28 Countries
Mass Population
‣ All population, not including Informed Public
‣ Represents 85% of total global population
3
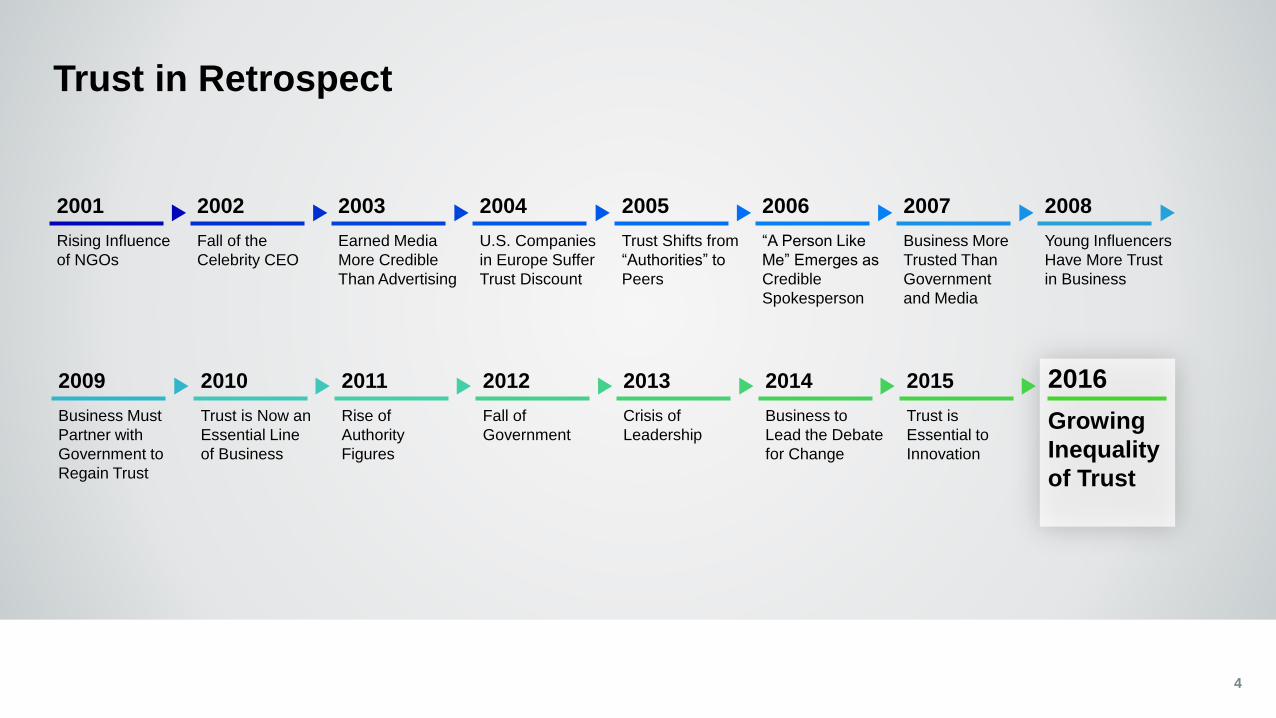
Trust in Retrospect
4
Rising Influence
of NGOs
2001
Business Must
Partner with
Government to
Regain Trust
2009
Fall of the
Celebrity CEO
2002
Earned Media
More Credible
Than Advertising
2003
U.S. Companies
in Europe Suffer
Trust Discount
2004
Trust Shifts from
“Authorities” to
Peers
2005
“A Person Like
Me” Emerges as
Credible
Spokesperson
2006
Business More
Trusted Than
Government
and Media
2007
Young Influencers
Have More Trust
in Business
2008
Trust is Now an
Essential Line
of Business
2010
Rise of
Authority
Figures
2011
Fall of
Government
2012
Crisis of
Leadership
2013
Business to
Lead the Debate
for Change
2014
Trust is
Essential to
Innovation
2015
Growing
Inequality
of Trust
2016
60
64 6563
66
5053 54
51
55
4648
45
48
51
38
4139
42 43
2012 2013 2014 2015 2016
54
58 5856
62
4750 49 49
53
2012 2013 2014 2015 2016
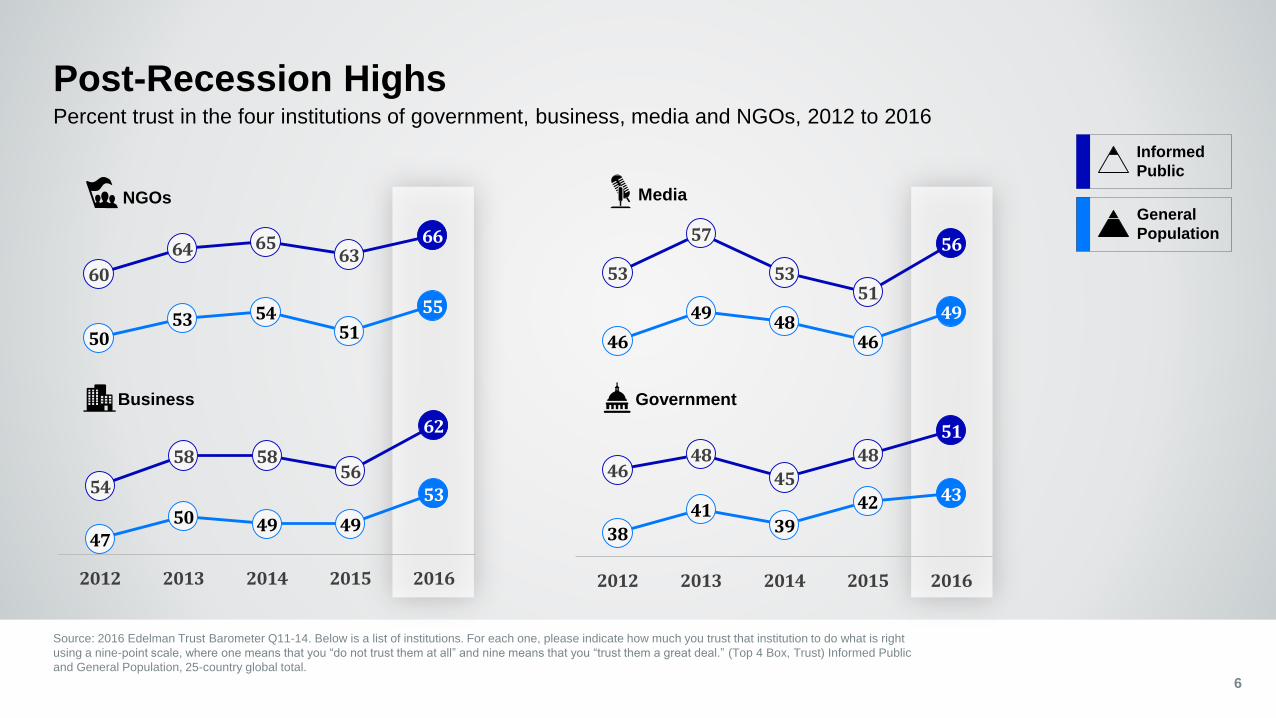
Source: 2016 Edelman Trust Barometer Q11-14. Below is a list of institutions. For each one, please indicate how much you trust that institution to do what is right
using a nine-point scale, where one means that you “do not trust them at all” and nine means that you “trust them a great deal.” (Top 4 Box, Trust) Informed Public
and General Population, 25-country global total.
6
Percent trust in the four institutions of government, business, media and NGOs, 2012 to 2016
53
57
5351
56
46
4948
46
49
NGOs
Government
Media
Business
Post-Recession Highs
Informed
Public
General
Population
55 G lobal 60 G lobal
82 China
78 India
74 UAE
72 Mexico
72 Singapore
70 Indonesia
64 U.S.
63 Australia
63 Canada
62 Netherlands
61 Colombia
84 UAE
79 India
78 Indonesia
75 China
65 Singapore
64 Netherlands
49 Ireland
47 Turkey
46 Sweden
42 Poland
42 Russia
41 Japan
48 Italy
48 S. Africa
47 Hong Kong
47 S. Korea
46 U.K.
45 Argentina
45 Poland
45 Russia
45 Spain
45 Sweden
40 Turkey
37 Ireland
37 Japan
58 Brazil
58 Italy
58 Malaysia
57 U.K.
55 France
54 S. Africa
53 Argentina
53 Spain
52 Hong Kong
51 Germany
50 S. Korea
59 Brazil
59 Mexico
56 Malaysia53 Canada
52 Australia
52 France
52 U.S.
50 Germany
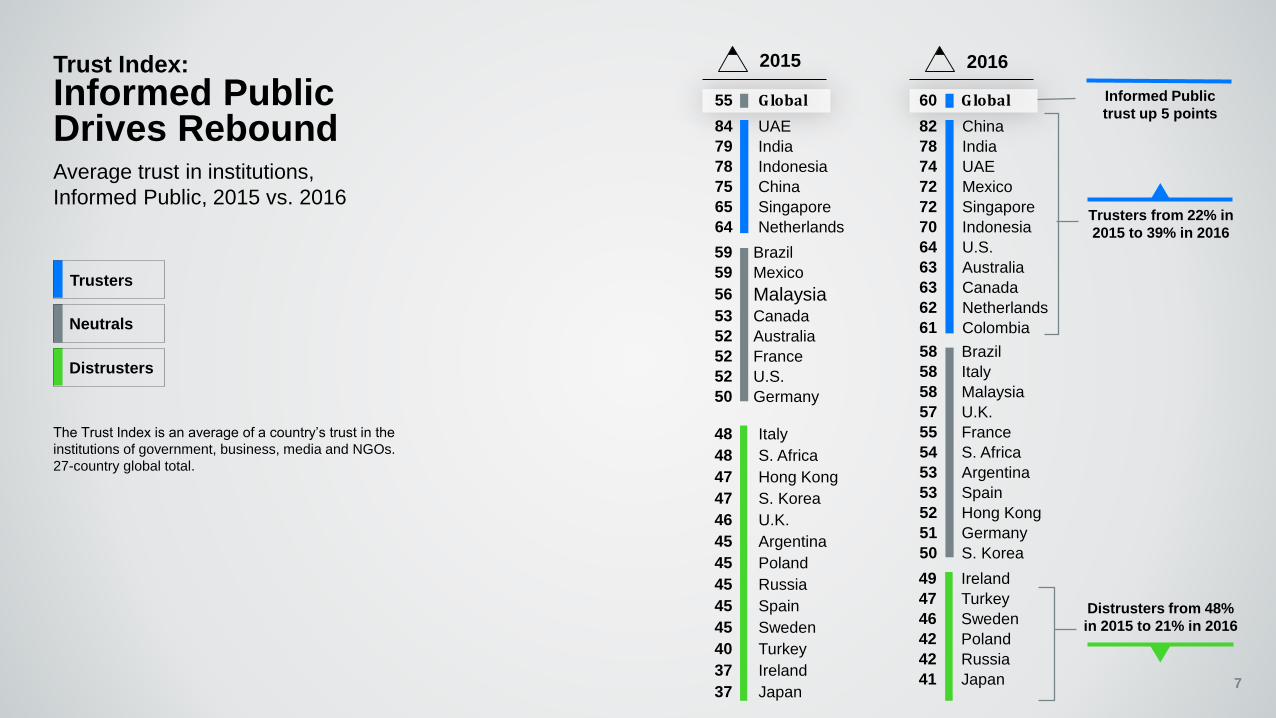
Trust Index:
Informed Public Drives ReboundAverage trust in institutions,
Informed Public, 2015 vs. 2016
2015 2016
Informed Public
trust up 5 points
Trusters from 22% in
2015 to 39% in 2016
Distrusters from 48%
in 2015 to 21% in 2016
Trusters
Neutrals
Distrusters
7
The Trust Index is an average of a country’s trust in the
institutions of government, business, media and NGOs.
27-country global total.
49 Ireland
47 Turkey
46 Sweden
42 Poland
42 Russia
41 Japan
49 Australia
49 Italy
49 U.S.
47 Hong Kong
46 Spain
45 S. Africa
42 Germany
42 S. Korea
42 U.K.
41 France
41 Ireland
41 Turkey
39 Russia
38 Japan
37 Sweden
35 Poland
73 China
66 UAE
65 India
64 Singapore
62 Indonesia
60 Mexico
82 China
78 India
74 UAE
72 Mexico
72 Singapore
70 Indonesia
64 U.S.
63 Australia
63 Canada
62 Netherlands
61 Colombia
56 Canada
55 Colombia
52 Netherlands
51 Argentina
51 Malaysia
50 Brazil58 Brazil
58 Italy
58 Malaysia
57 U.K.
55 France
54 S. Africa
53 Argentina
53 Spain
52 Hong Kong
51 Germany
50 S. Korea
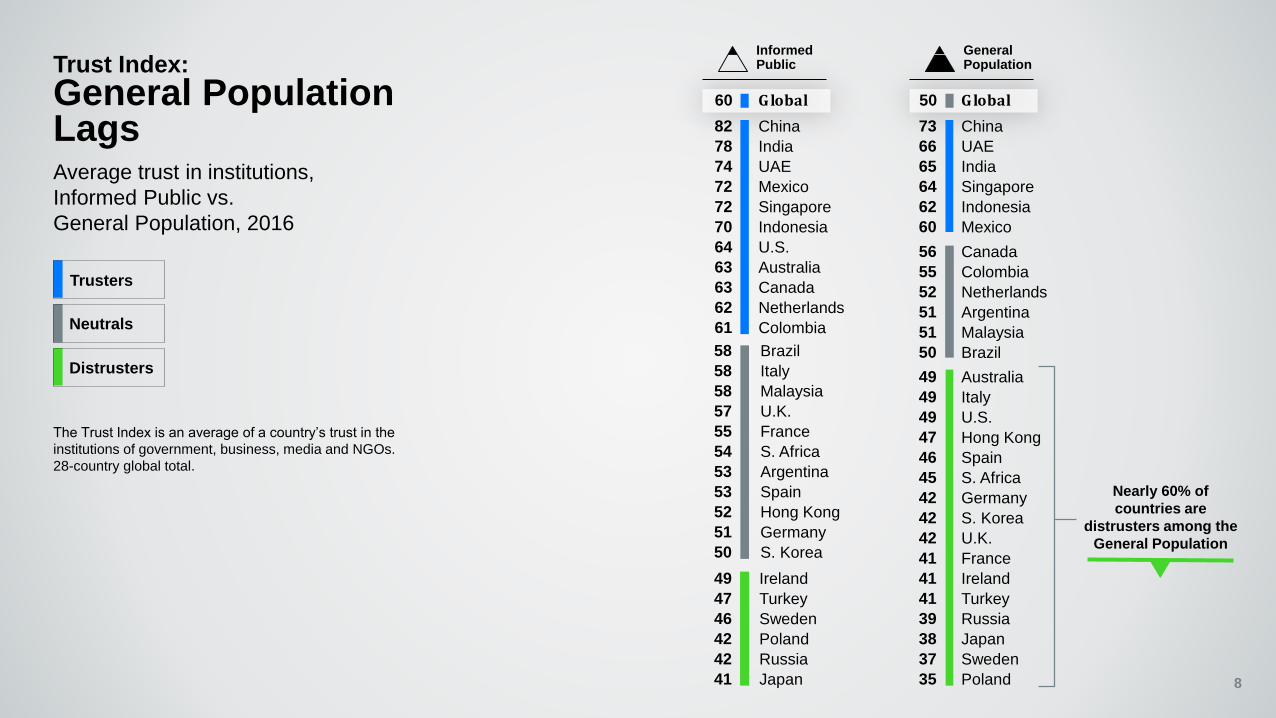
Trust Index:
General Population LagsAverage trust in institutions,
Informed Public vs.
General Population, 2016
Nearly 60% of
countries are
distrusters among the
General Population
The Trust Index is an average of a country’s trust in the
institutions of government, business, media and NGOs.
28-country global total.
InformedPublic
GeneralPopulation
60 G lobal 50 G lobal
8
Trusters
Neutrals
Distrusters
53
58
56 56
60
44
4746 46
48
2012 2013 2014 2015 2016
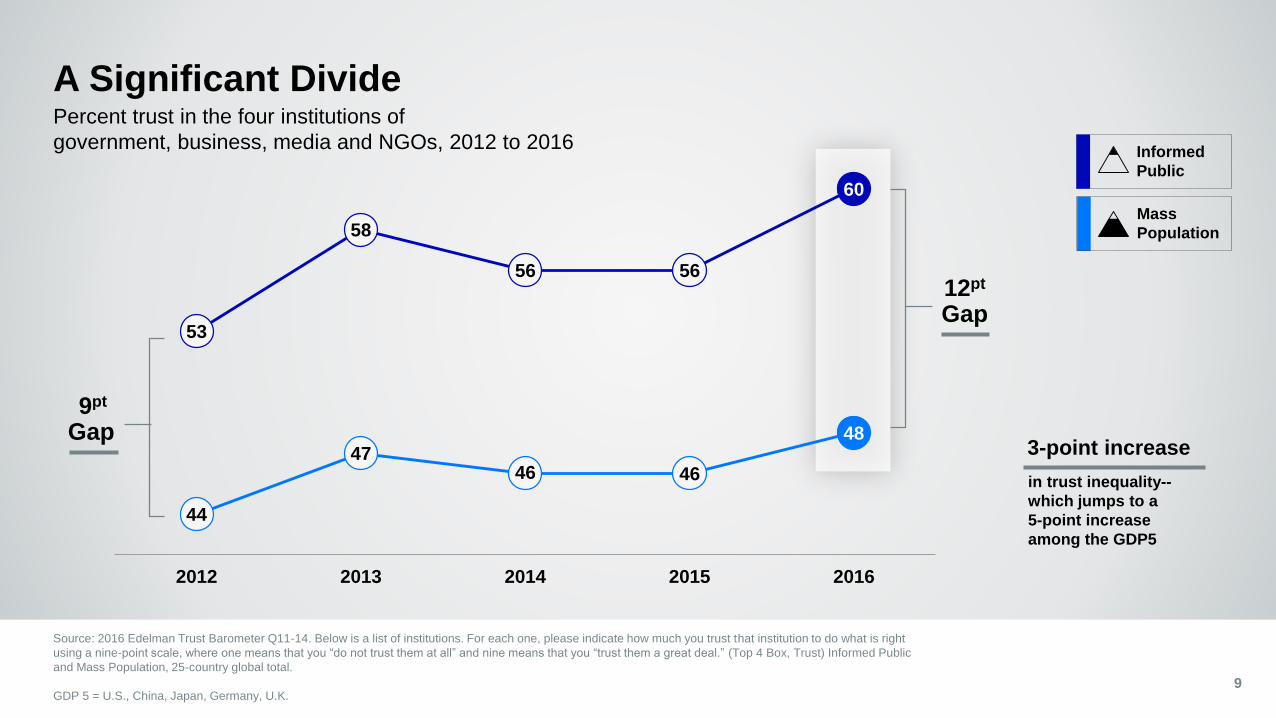
A Significant Divide
Source: 2016 Edelman Trust Barometer Q11-14. Below is a list of institutions. For each one, please indicate how much you trust that institution to do what is right
using a nine-point scale, where one means that you “do not trust them at all” and nine means that you “trust them a great deal.” (Top 4 Box, Trust) Informed Public
and Mass Population, 25-country global total.
GDP 5 = U.S., China, Japan, Germany, U.K. 9
Percent trust in the four institutions of
government, business, media and NGOs, 2012 to 2016Informed
Public
Mass
Population
12pt
Gap
9pt
Gap
in trust inequality--
which jumps to a
5-point increase
among the GDP5
3-point increase
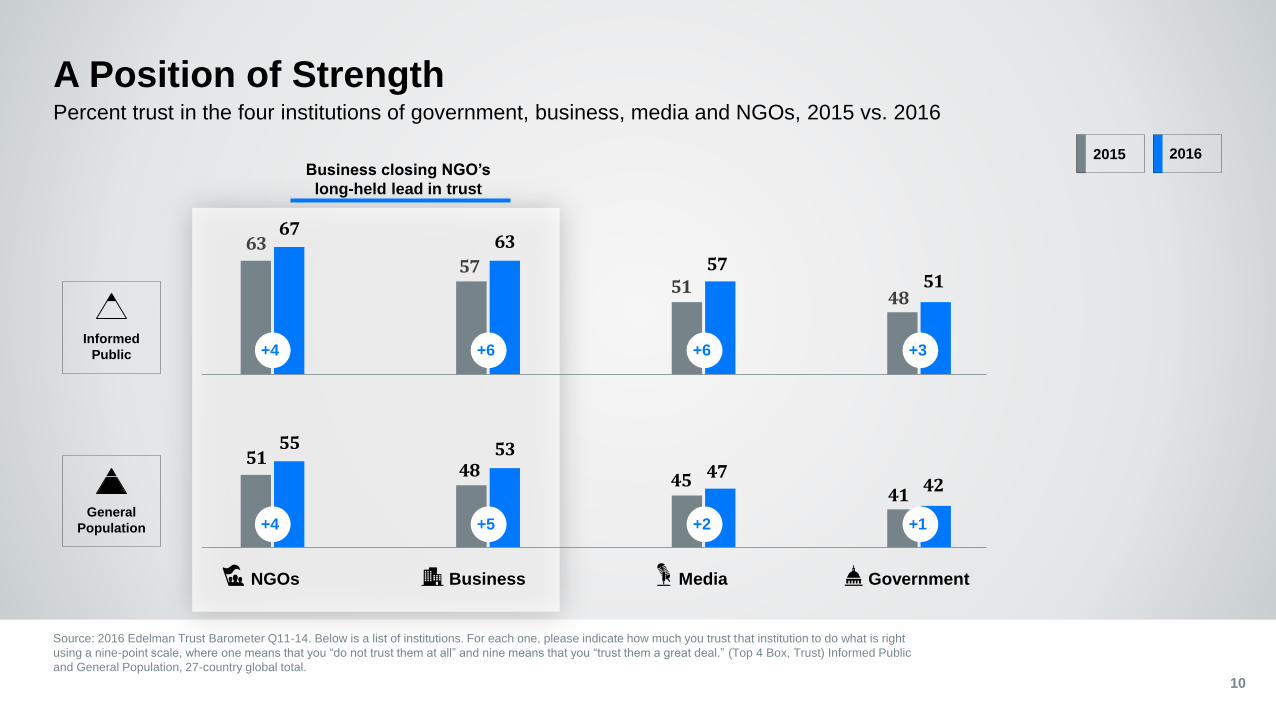
A Position of Strength
Source: 2016 Edelman Trust Barometer Q11-14. Below is a list of institutions. For each one, please indicate how much you trust that institution to do what is right
using a nine-point scale, where one means that you “do not trust them at all” and nine means that you “trust them a great deal.” (Top 4 Box, Trust) Informed Public
and General Population, 27-country global total.
10
Percent trust in the four institutions of government, business, media and NGOs, 2015 vs. 2016
5148
4541
55 5347
42
6357
5148
6763
5751
NGOs Business Media Government
+4 +6 +6 +3
+4 +5 +2 +1
Informed
Public
General
Population
2015 2016Business closing NGO’s
long-held lead in trust
50%
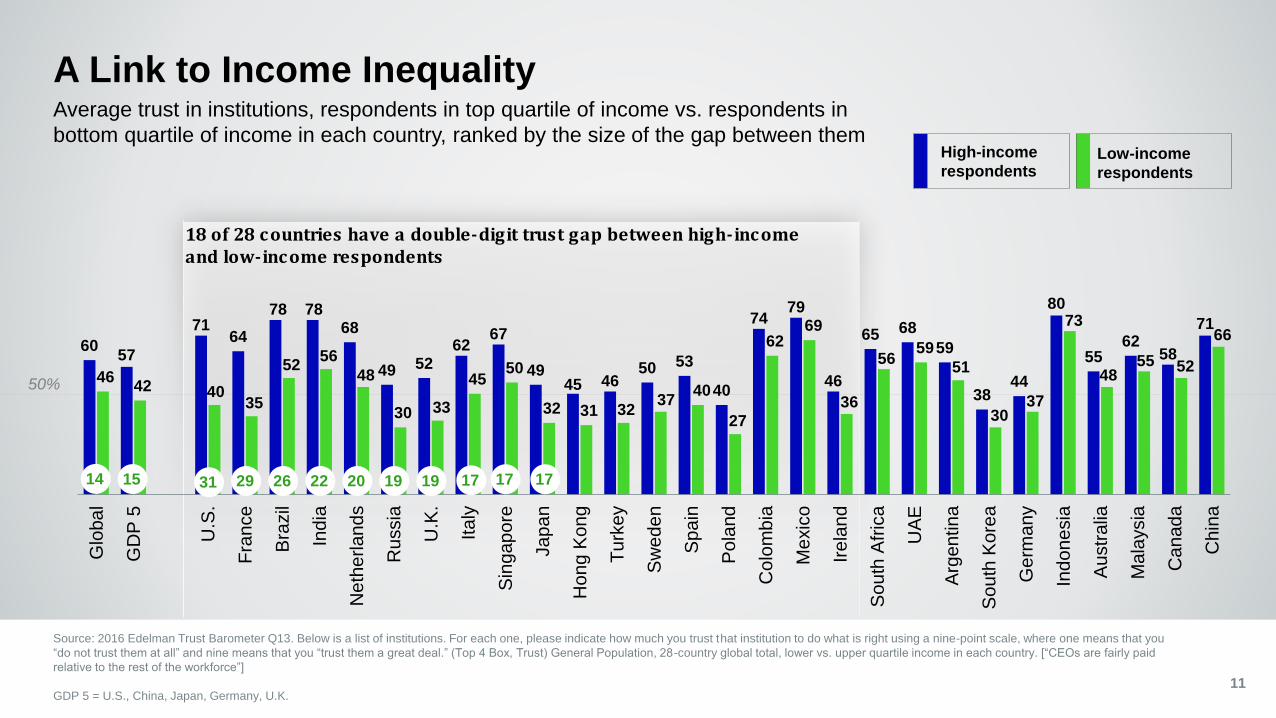
18 of 28 countries have a double-digit trust gap between high-income and low-income respondents
A Link to Income Inequality
Source: 2016 Edelman Trust Barometer Q13. Below is a list of institutions. For each one, please indicate how much you trust that institution to do what is right using a nine-point scale, where one means that you
“do not trust them at all” and nine means that you “trust them a great deal.” (Top 4 Box, Trust) General Population, 28-country global total, lower vs. upper quartile income in each country. [“CEOs are fairly paid
relative to the rest of the workforce”]
GDP 5 = U.S., China, Japan, Germany, U.K. 11
Average trust in institutions, respondents in top quartile of income vs. respondents in
bottom quartile of income in each country, ranked by the size of the gap between them
6057
7164
78 7868
49 5262
67
4945 46
50 53
40
7479
46
65 68
59
3844
80
5562
58
71
4642 40
35
5256
48
30 33
4550
32 31 3237
40
27
6269
36
5659
51
3037
73
4855 52
66
Glo
ba
l
GD
P 5
U.S
.
Fra
nce
Bra
zil
Ind
ia
Neth
erlands
Ru
ssia
U.K
.
Ita
ly
Sin
gap
ore
Ja
pa
n
Ho
ng
Ko
ng
Tu
rke
y
Sw
ed
en
Spain
Po
land
Colo
mbia
Me
xic
o
Ire
lan
d
So
uth
Afr
ica
UA
E
Arg
en
tin
a
So
uth
Ko
rea
Ge
rma
ny
Ind
on
esia
Au
str
alia
Ma
laysia
Canada
Ch
ina
14 19192022262931
Low-income
respondents
High-income
respondents
17 171715
50%55
46
19 2128
4841
45 4247
44
57
4650
46
63
5249
58 55 5551
6962 64
73 7379 81
87
47
37
1520
24
31 31 33 33 34 34 36 36 3739
45 46 47 49 49 49
5764 64 65
69 7074
81 83
Glo
ba
l
GD
P 5
Ja
pa
n
Fra
nc
e
Ge
rma
ny
U.K
.
Au
str
alia
Ita
ly
S.
Ko
rea
Ne
the
rla
nd
s
Sw
ed
en
Po
lan
d
Ho
ng
Ko
ng
Ca
na
da
Ru
ssia
U.S
.
Sin
ga
po
re
Tu
rke
y
Ire
lan
d
S.
Afr
ica
Sp
ain
Ma
lays
ia
Me
xic
o
Arg
en
tin
a
Bra
zil
Ch
ina
UA
E
Ind
on
esi
a
Co
lom
bia
Ind
ia
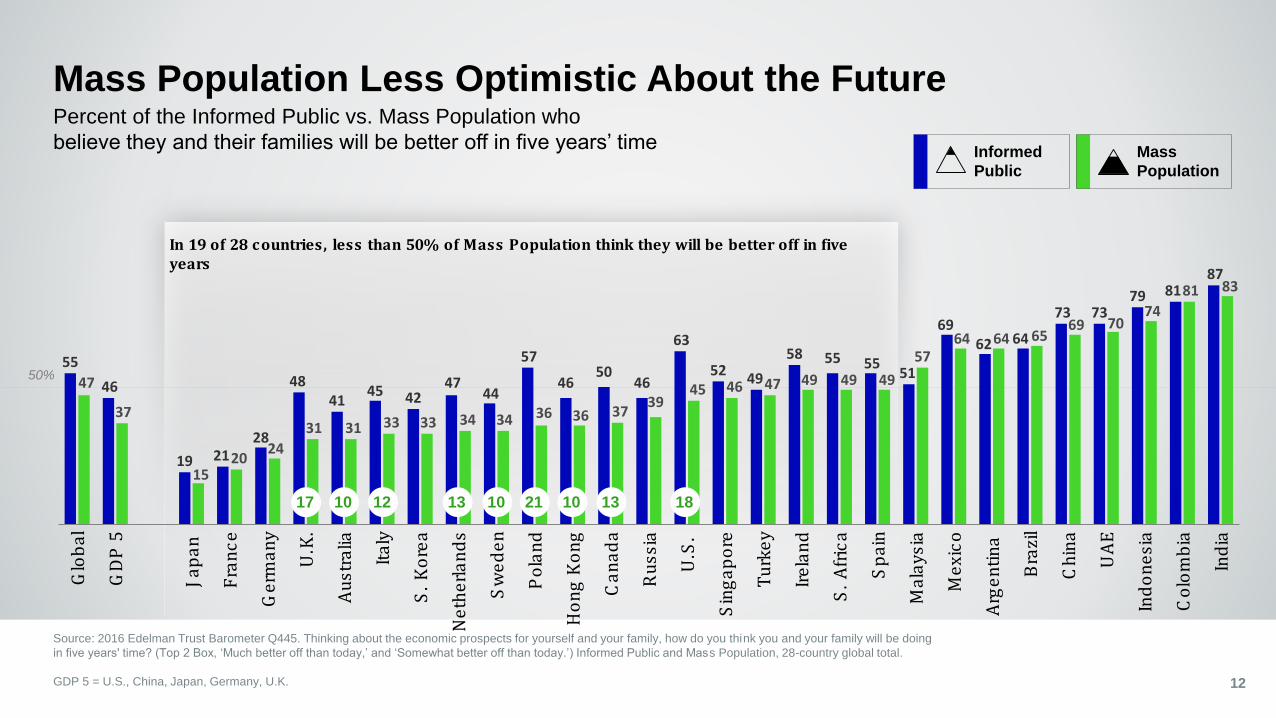
In 19 of 28 countries, less than 50% of Mass Population think they will be better off in five years
Mass Population Less Optimistic About the Future
Source: 2016 Edelman Trust Barometer Q445. Thinking about the economic prospects for yourself and your family, how do you think you and your family will be doing
in five years' time? (Top 2 Box, ‘Much better off than today,’ and ‘Somewhat better off than today.’) Informed Public and Mass Population, 28-country global total.
GDP 5 = U.S., China, Japan, Germany, U.K. 12
Percent of the Informed Public vs. Mass Population who
believe they and their families will be better off in five years’ time Informed
Public
Mass
Population
17 10 12 13 10 21 10 13 18
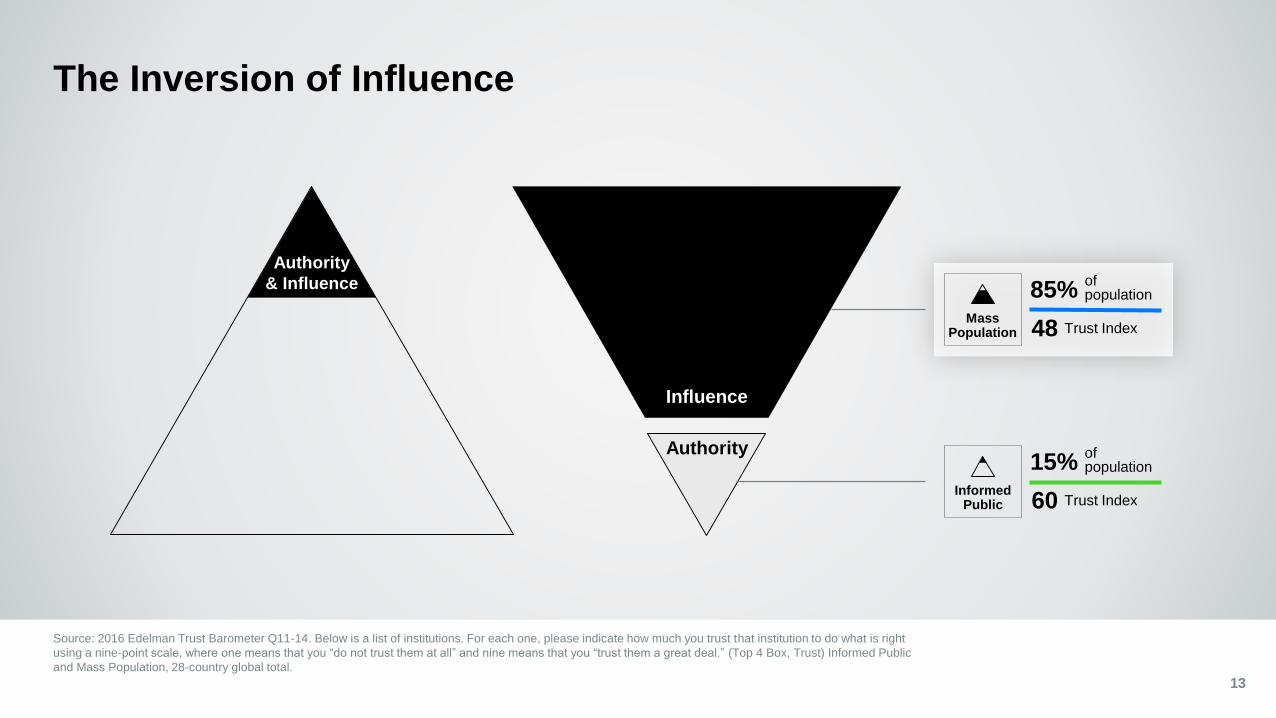
MassPopulation
The Inversion of Influence
13
Authority
& Influence
Influence
Authority
Source: 2016 Edelman Trust Barometer Q11-14. Below is a list of institutions. For each one, please indicate how much you trust that institution to do what is right
using a nine-point scale, where one means that you “do not trust them at all” and nine means that you “trust them a great deal.” (Top 4 Box, Trust) Informed Public
and Mass Population, 28-country global total.
85%of population
48 Trust Index
15%of population
60 Trust IndexInformed
Public
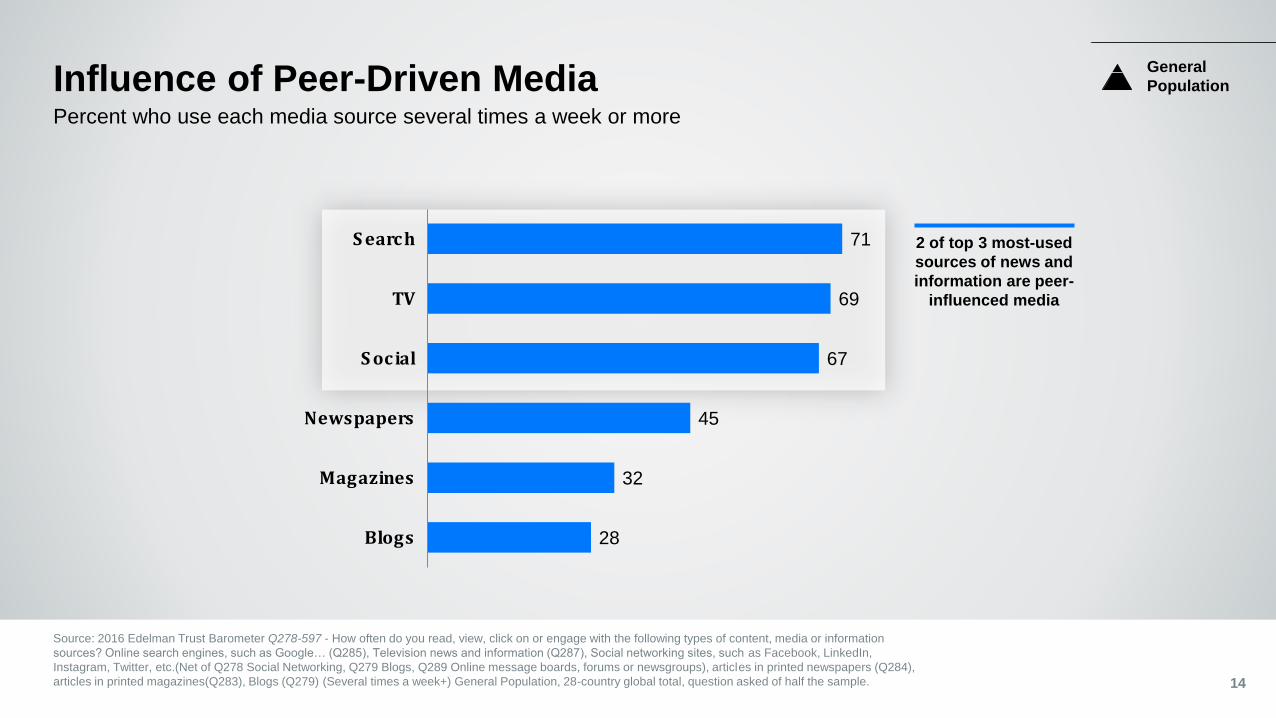
71
69
67
45
32
28
S earch
TV
S ocial
Newspapers
Magazines
Blogs
Influence of Peer-Driven Media
Source: 2016 Edelman Trust Barometer Q278-597 - How often do you read, view, click on or engage with the following types of content, media or information
sources? Online search engines, such as Google… (Q285), Television news and information (Q287), Social networking sites, such as Facebook, LinkedIn,
Instagram, Twitter, etc.(Net of Q278 Social Networking, Q279 Blogs, Q289 Online message boards, forums or newsgroups), articles in printed newspapers (Q284),
articles in printed magazines(Q283), Blogs (Q279) (Several times a week+) General Population, 28-country global total, question asked of half the sample. 14
Percent who use each media source several times a week or more
2 of top 3 most-used
sources of news and
information are peer-
influenced media
General
Population
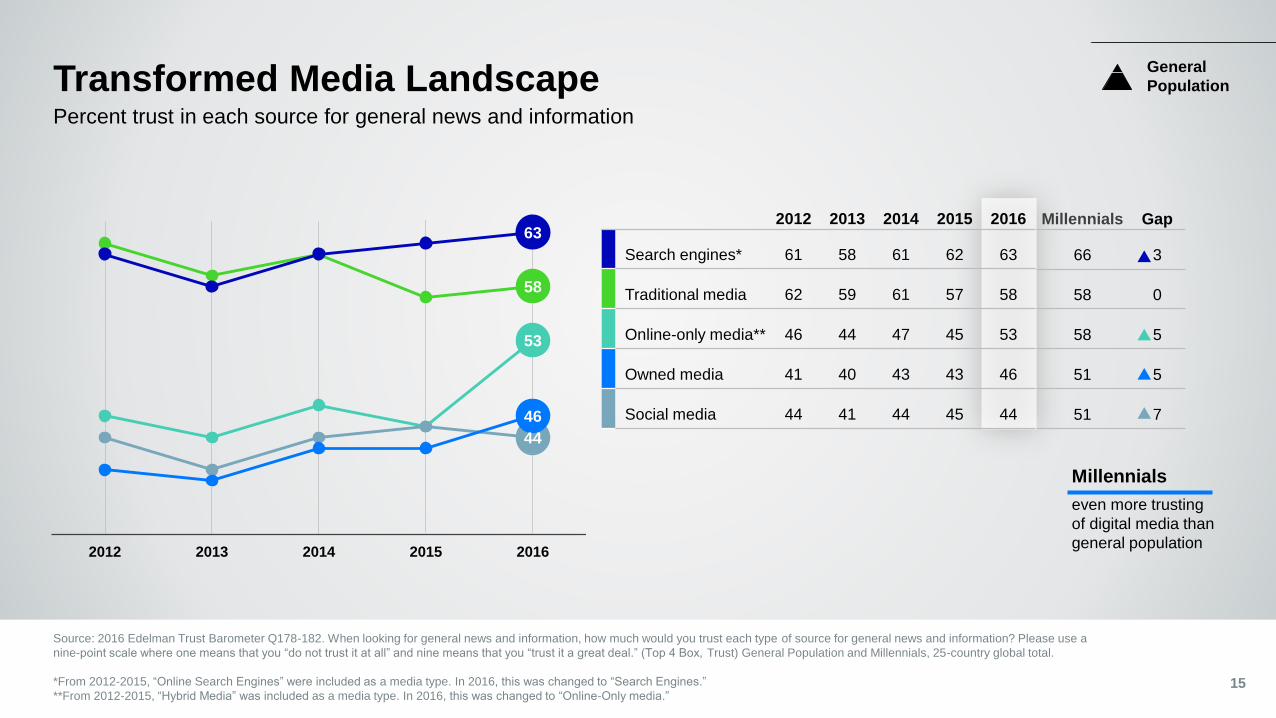
58
53
44
63
46
2012 2013 2014 2015 2016
Transformed Media Landscape
Source: 2016 Edelman Trust Barometer Q178-182. When looking for general news and information, how much would you trust each type of source for general news and information? Please use a
nine-point scale where one means that you “do not trust it at all” and nine means that you “trust it a great deal.” (Top 4 Box, Trust) General Population and Millennials, 25-country global total.
*From 2012-2015, “Online Search Engines” were included as a media type. In 2016, this was changed to “Search Engines.”
**From 2012-2015, “Hybrid Media” was included as a media type. In 2016, this was changed to “Online-Only media.”
Percent trust in each source for general news and information
Millennials
even more trusting
of digital media than
general population
2012 2013 2014 2015 2016
Search engines* 61 58 61 62 63
Traditional media 62 59 61 57 58
Online-only media** 46 44 47 45 53
Owned media 41 40 43 43 46
Social media 44 41 44 45 44
General
Population
15
Millennials Gap
66 3
58 0
58 5
51 5
51 7
50%
6761
53
46
39
4640
3430
26
78
6562
5549
44 4237
32 31
My friendsand family
An academicexpert
C ompaniesthat I use
Employees ofa company
A companyC EO
A journalist A well-knownonline
personality
Electedoffic ials
C elebrities Companies I don’t use*
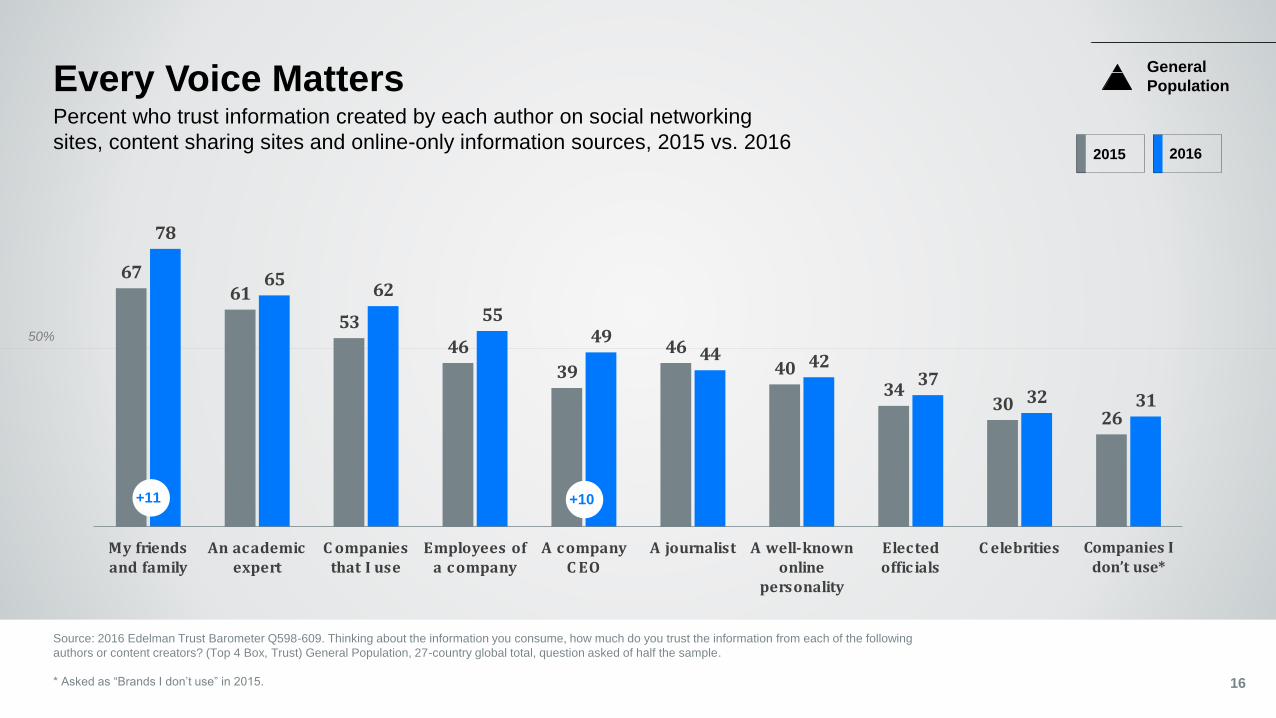
Every Voice Matters
Source: 2016 Edelman Trust Barometer Q598-609. Thinking about the information you consume, how much do you trust the information from each of the following
authors or content creators? (Top 4 Box, Trust) General Population, 27-country global total, question asked of half the sample.
* Asked as “Brands I don’t use” in 2015. 16
+11
General
Population
+10
2015 2016
Percent who trust information created by each author on social networking
sites, content sharing sites and online-only information sources, 2015 vs. 2016
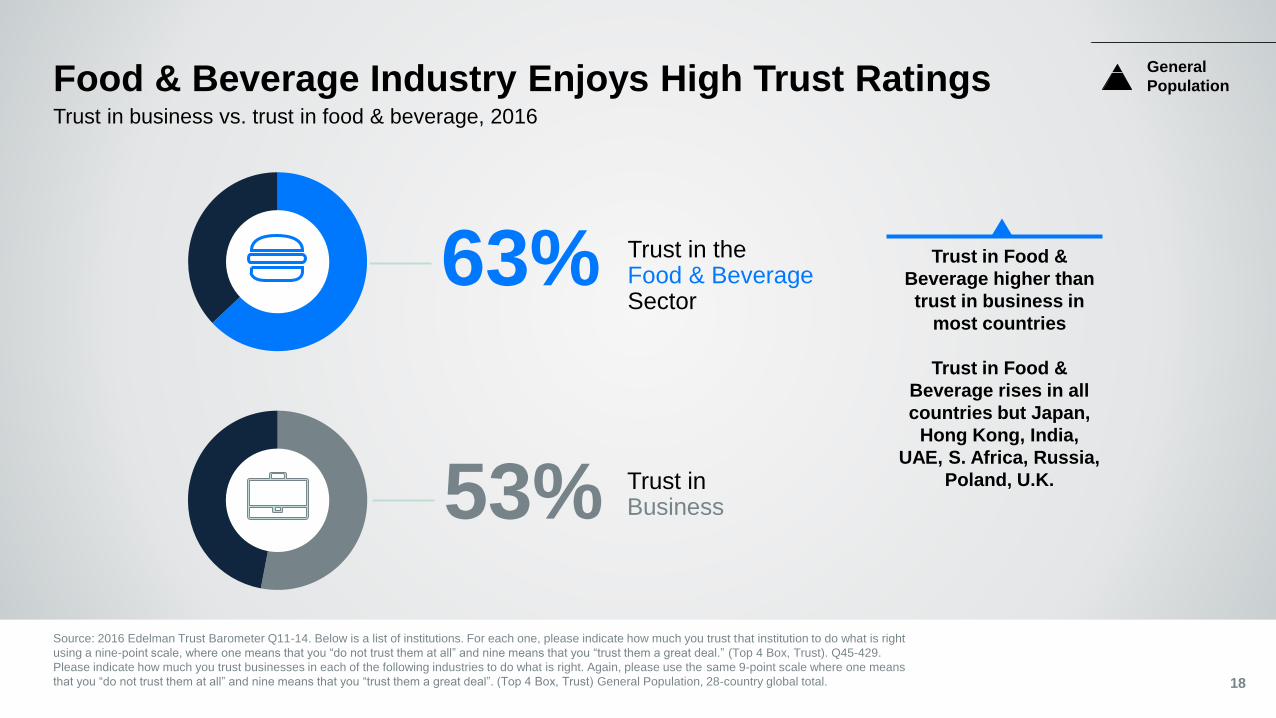
Food & Beverage Industry Enjoys High Trust Ratings
18
Trust in business vs. trust in food & beverage, 2016
General
Population
Trust in Business
Trust in the Food & Beverage Sector
53%
63% Trust in Food &
Beverage higher than
trust in business in
most countries
Trust in Food &
Beverage rises in all
countries but Japan,
Hong Kong, India,
UAE, S. Africa, Russia,
Poland, U.K.
Source: 2016 Edelman Trust Barometer Q11-14. Below is a list of institutions. For each one, please indicate how much you trust that institution to do what is right
using a nine-point scale, where one means that you “do not trust them at all” and nine means that you “trust them a great deal.” (Top 4 Box, Trust). Q45-429.
Please indicate how much you trust businesses in each of the following industries to do what is right. Again, please use the same 9-point scale where one means
that you “do not trust them at all” and nine means that you “trust them a great deal”. (Top 4 Box, Trust) General Population, 28-country global total.
50%
6360
60
70
8481
75
5551
60
46
62
47
59 59
68
51 5246
7573
87
80
4337
45
67 68
80
6569 68 66
79
8882 81
6662
71
5661
5359
7368
5249
45
7572
8281
62
53 54
76 7380 77
Glo
ba
l 2
8
GD
P5
Ca
na
da
U.S
.
Me
xic
o
Co
lom
bia
Bra
zil
Arg
en
tin
a
Ire
lan
d
U.K
.
Sw
ed
en
Ne
the
rla
nd
s
Ge
rma
ny
Fra
nc
e
Sp
ain
Ita
ly
Tu
rke
y
Po
lan
d
Ru
ssi
a
S.
Afr
ica
UA
E
Ind
ia
Ch
ina
Ho
ng
Ko
ng
S.
Ko
rea
Ja
pa
n
Ma
lays
ia
Sin
ga
po
re
Ind
on
esi
a
Au
str
alia
-5
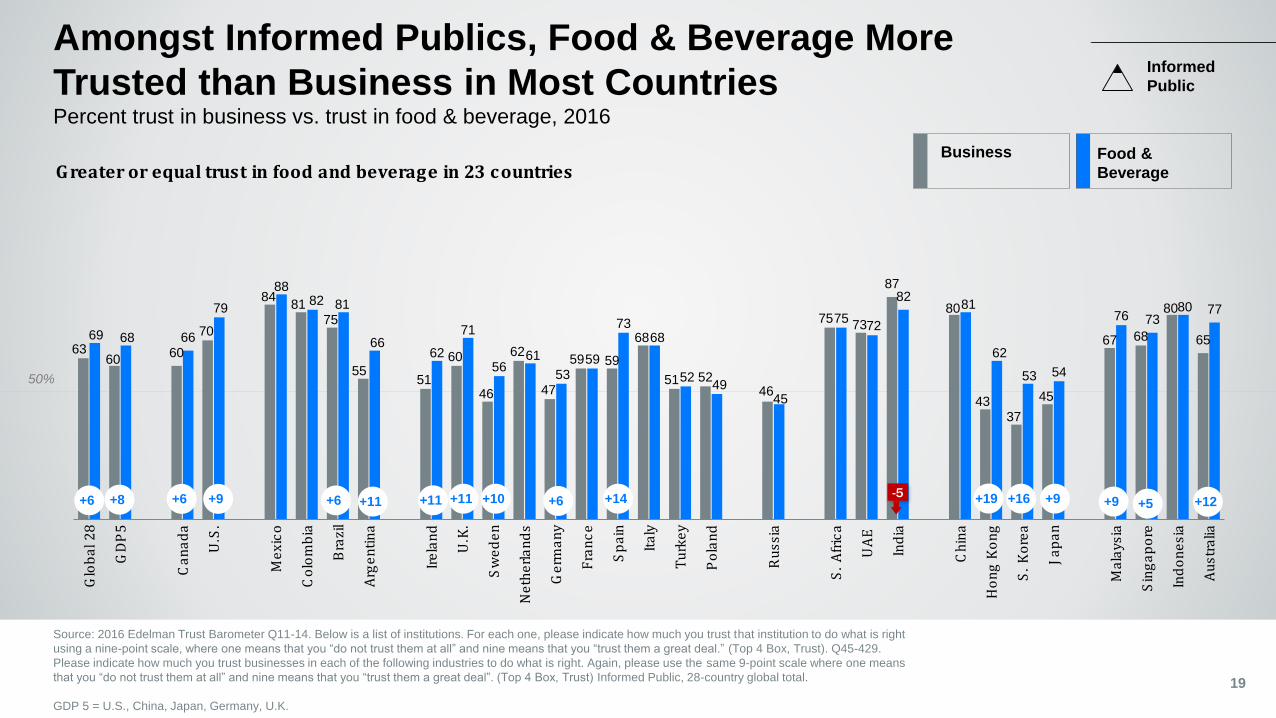
Amongst Informed Publics, Food & Beverage More
Trusted than Business in Most Countries
19
Percent trust in business vs. trust in food & beverage, 2016
G reater or equal trust in food and beverage in 23 countriesFood &
Beverage
Business
Informed
Public
Source: 2016 Edelman Trust Barometer Q11-14. Below is a list of institutions. For each one, please indicate how much you trust that institution to do what is right
using a nine-point scale, where one means that you “do not trust them at all” and nine means that you “trust them a great deal.” (Top 4 Box, Trust). Q45-429.
Please indicate how much you trust businesses in each of the following industries to do what is right. Again, please use the same 9-point scale where one means
that you “do not trust them at all” and nine means that you “trust them a great deal”. (Top 4 Box, Trust) Informed Public, 28-country global total.
GDP 5 = U.S., China, Japan, Germany, U.K.
+19+11+11 +11 +14 +12+16+10+6 +9 +6 +6 +9 +9 +5+8+6
50% 5350
5651
7670
64
53
4346 46
56
4246 48
57
4238 38
6067
69 70
3933
43
58 60
71
52
63 6366
70
7976
73
67
6064
51
6257 58
6764
4550
43
67
7475
70
59
4852
68 68
7568
Glo
ba
l 2
8
GD
P5
Ca
na
da
U.S
.
Me
xic
o
Co
lom
bia
Bra
zil
Arg
en
tin
a
Ire
lan
d
U.K
.
Sw
ed
en
Ne
the
rla
nd
s
Ge
rma
ny
Fra
nc
e
Sp
ain
Ita
ly
Tu
rke
y
Po
lan
d
Ru
ssi
a
S.
Afr
ica
UA
E
Ind
ia
Ch
ina
Ho
ng
Ko
ng
S.
Ko
rea
Ja
pa
n
Ma
lays
ia
Sin
ga
po
re
Ind
on
esi
a
Au
str
alia
+8
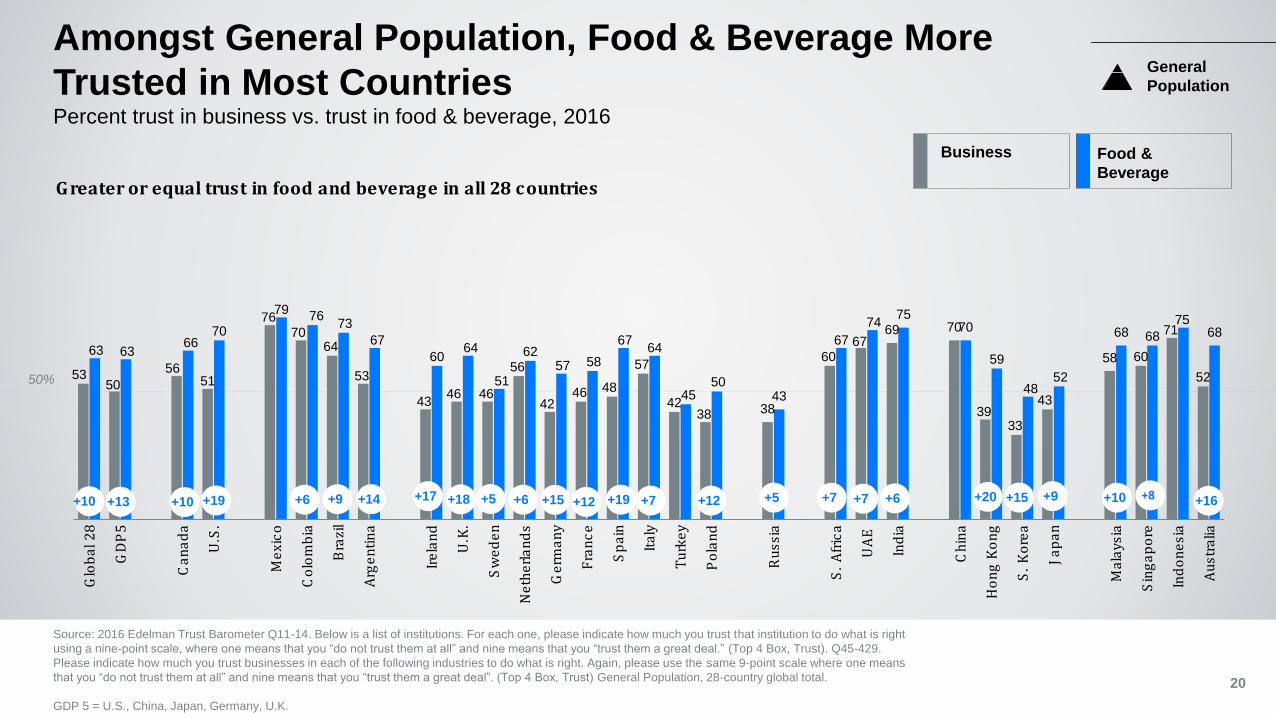
Amongst General Population, Food & Beverage More
Trusted in Most Countries
20
Percent trust in business vs. trust in food & beverage, 2016
G reater or equal trust in food and beverage in all 28 countries
+10+14+10 +16+19 +19
General
Population
Food &
Beverage
Business
Source: 2016 Edelman Trust Barometer Q11-14. Below is a list of institutions. For each one, please indicate how much you trust that institution to do what is right
using a nine-point scale, where one means that you “do not trust them at all” and nine means that you “trust them a great deal.” (Top 4 Box, Trust). Q45-429.
Please indicate how much you trust businesses in each of the following industries to do what is right. Again, please use the same 9-point scale where one means
that you “do not trust them at all” and nine means that you “trust them a great deal”. (Top 4 Box, Trust) General Population, 28-country global total.
GDP 5 = U.S., China, Japan, Germany, U.K.
+18 +12+15 +12 +20 +15+17+6 +9 +5+10 +13 +6 +7 +5 +7 +9+7 +6
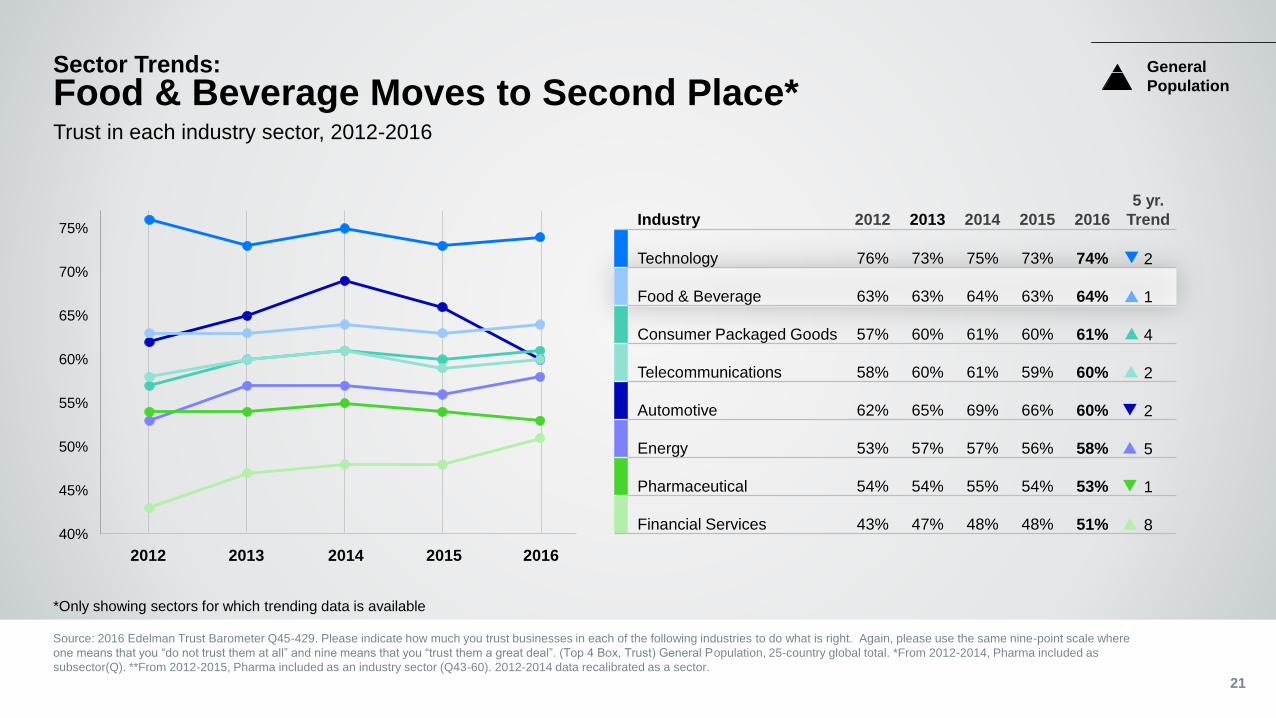
Industry 2012 2013 2014 2015 2016
5 yr.
Trend
Technology 76% 73% 75% 73% 74% 2
Food & Beverage 63% 63% 64% 63% 64% 1
Consumer Packaged Goods 57% 60% 61% 60% 61% 4
Telecommunications 58% 60% 61% 59% 60% 2
Automotive 62% 65% 69% 66% 60% 2
Energy 53% 57% 57% 56% 58% 5
Pharmaceutical 54% 54% 55% 54% 53% 1
Financial Services 43% 47% 48% 48% 51% 840%
45%
50%
55%
60%
65%
70%
75%
Sector Trends:
Food & Beverage Moves to Second Place*
Source: 2016 Edelman Trust Barometer Q45-429. Please indicate how much you trust businesses in each of the following industries to do what is right. Again, please use the same nine-point scale where
one means that you “do not trust them at all” and nine means that you “trust them a great deal”. (Top 4 Box, Trust) General Population, 25-country global total. *From 2012-2014, Pharma included as
subsector(Q). **From 2012-2015, Pharma included as an industry sector (Q43-60). 2012-2014 data recalibrated as a sector.
2012 2013 2014 2015 2016
General
Population
21
*Only showing sectors for which trending data is available
Trust in each industry sector, 2012-2016
50%
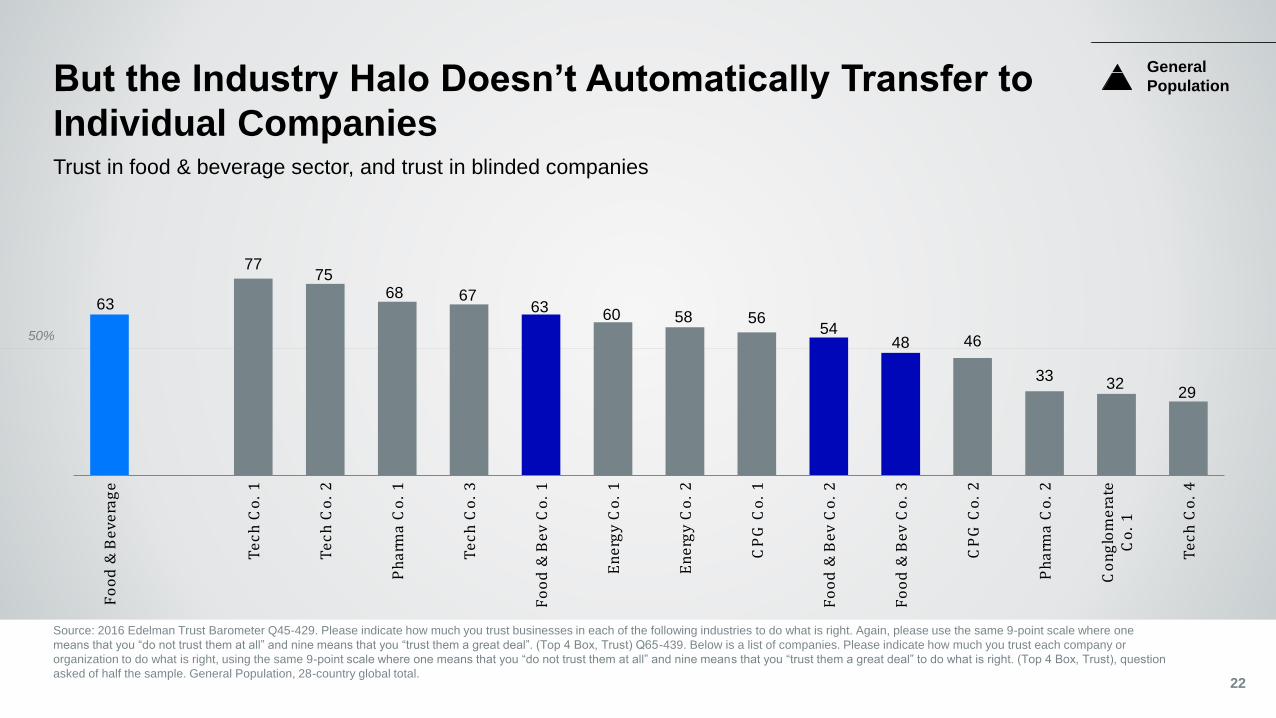
Source: 2016 Edelman Trust Barometer Q45-429. Please indicate how much you trust businesses in each of the following industries to do what is right. Again, please use the same 9-point scale where one
means that you “do not trust them at all” and nine means that you “trust them a great deal”. (Top 4 Box, Trust) Q65-439. Below is a list of companies. Please indicate how much you trust each company or
organization to do what is right, using the same 9-point scale where one means that you “do not trust them at all” and nine means that you “trust them a great deal” to do what is right. (Top 4 Box, Trust), question
asked of half the sample. General Population, 28-country global total.
But the Industry Halo Doesn’t Automatically Transfer to
Individual Companies
22
General
Population
63
7775
68 6763
60 58 5654
48 46
3332
29
Fo
od
& B
eve
rag
e
Te
ch
Co
. 1
Te
ch
Co
. 2
Ph
arm
a C
o.
1
Te
ch
Co
. 3
Fo
od
& B
ev
Co
. 1
En
erg
y C
o.
1
En
erg
y C
o.
2
CP
G C
o.
1
Fo
od
& B
ev
Co
. 2
Fo
od
& B
ev
Co
. 3
CP
G C
o.
2
Ph
arm
a C
o.
2
Co
ng
lom
era
teC
o.
1
Te
ch
Co
. 4
Trust in food & beverage sector, and trust in blinded companies
50%
6765 65
70
80 79
6559
67
48
62
51
59
6965
45
52 51
71
86 85
77
62
51
60
71 71
84
7268 68 66
79
8882
81
6662
71
5661
5359
7368
5249
45
7572
8281
62
53 54
7673
8077
Glo
ba
l 2
7
GD
P5
Ca
na
da
U.S
.
Me
xic
o
Co
lom
bia
(n/a
20
15
)
Bra
zil
Arg
en
tin
a
Ire
lan
d
U.K
.
Sw
ed
en
Ne
the
rla
nd
s
Ge
rma
ny
Fra
nc
e
Sp
ain
Ita
ly
Tu
rke
y
Po
lan
d
Ru
ssi
a
S.
Afr
ica
UA
E
Ind
ia
Ch
ina
Ho
ng
Ko
ng
S.
Ko
rea
Ja
pa
n
Ma
lays
ia
Sin
ga
po
re
Ind
on
esi
a
Au
str
alia
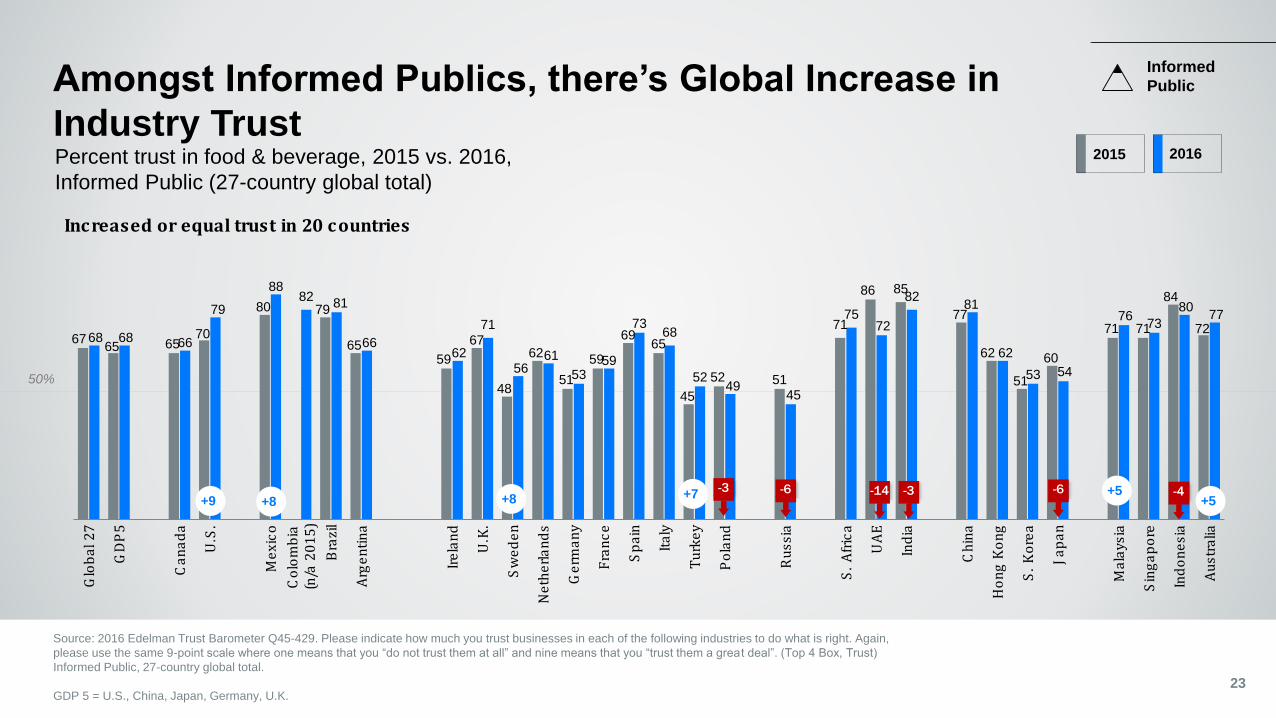
Amongst Informed Publics, there’s Global Increase in
Industry Trust
23
Increased or equal trust in 20 countries
2015 2016
Informed
Public
Source: 2016 Edelman Trust Barometer Q45-429. Please indicate how much you trust businesses in each of the following industries to do what is right. Again,
please use the same 9-point scale where one means that you “do not trust them at all” and nine means that you “trust them a great deal”. (Top 4 Box, Trust)
Informed Public, 27-country global total.
GDP 5 = U.S., China, Japan, Germany, U.K.
+9 +8 +8 +7 +5+5
-14 -6-6-3 -3 -4
Percent trust in food & beverage, 2015 vs. 2016,
Informed Public (27-country global total)
50%
Source: 2016 Edelman Trust Barometer Q45-429. Please indicate how much you trust businesses in each of the following industries to do what is right. Again,
please use the same 9-point scale where one means that you “do not trust them at all” and nine means that you “trust them a great deal”. (Top 4 Box, Trust)
General Population, 27-country global total.
GDP 5 = U.S., China, Japan, Germany, U.K.
62 6166 68
73 73
66
59
68
45
5955
5761
64
40
5145
7177
78
6264
45
54
69 6875
6763 63
6670
79 7673
67
6064
51
6257 58
67 64
4550
43
67
7475
70
59
4852
68 6875
68
Glo
ba
l 2
7
GD
P5
Ca
na
da
U.S
.
Me
xic
o
Co
lom
bia
(n/a
20
15
)
Bra
zil
Arg
en
tin
a
Ire
lan
d
U.K
.
Sw
ed
en
Ne
the
rla
nd
s
Ge
rma
ny
Fra
nc
e
Sp
ain
Ita
ly
Tu
rke
y
Po
lan
d
Ru
ssi
a
S.
Afr
ica
UA
E
Ind
ia
Ch
ina
Ho
ng
Ko
ng
S.
Ko
rea
Ja
pa
n
Ma
lays
ia
Sin
ga
po
re
Ind
on
esi
a
Au
str
alia
-4-4 -3
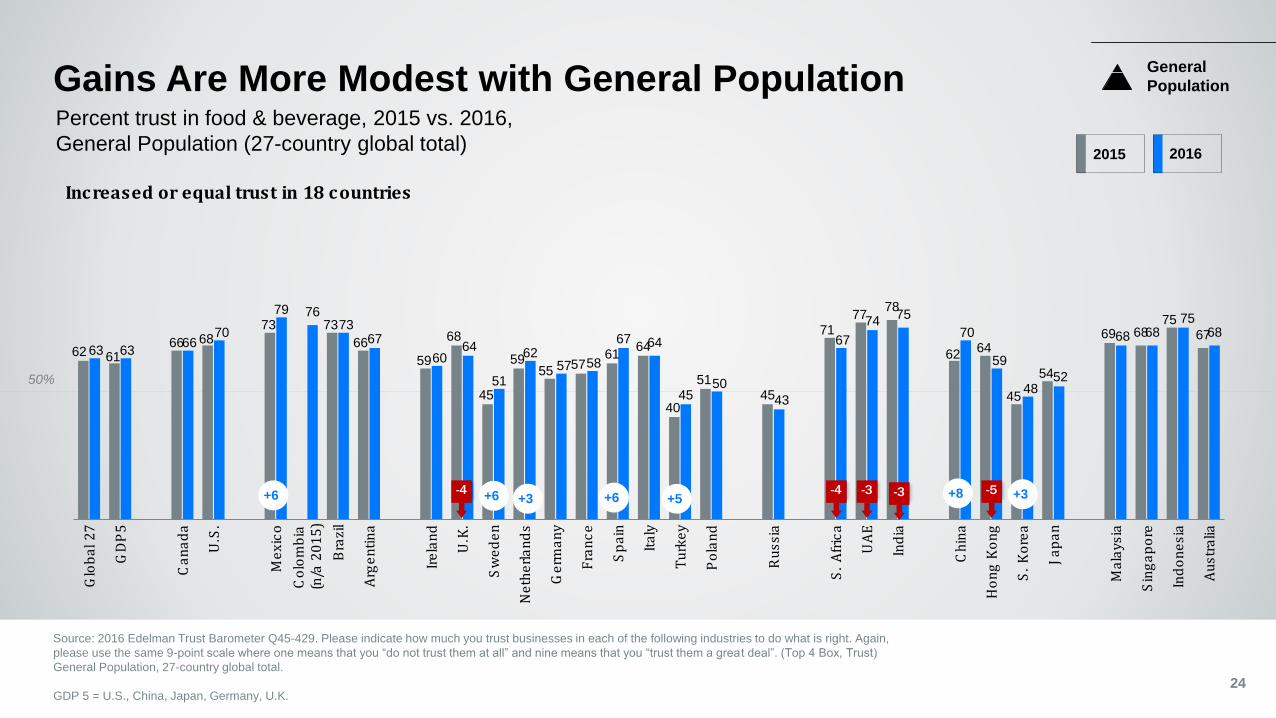
Gains Are More Modest with General Population
24
Increased or equal trust in 18 countries
General
Population
2015 2016
+6 +6 +6 +8 -5+5 +3-3
+3
Percent trust in food & beverage, 2015 vs. 2016,
General Population (27-country global total)
50%
Source: 2016 Edelman Trust Barometer Q45-429. Please indicate how much you trust businesses in each of the following industries to do what is right. Again, please use the same 9-point scale where one
means that you “do not trust them at all” and nine means that you “trust them a great deal”. (Top 4 Box, Trust) Informed Public and General Population, 28-country global total.
GDP 5 = U.S., China, Japan, Germany, U.K.
69 68 66
79
8882 81
66 62
71
5661
53
59
7368
5249
45
7572
8281
62
53 54
76 7380
77
63 6366 70
79 7673
6760
64
51
6257 58
67 64
4550
43
67
7475
70
59
4852
68 6875
68
Glo
ba
l 28
GD
P5
Ca
na
da
U.S
.
Me
xic
o
Co
lom
bia
Bra
zil
Arg
en
tin
a
Ire
lan
d
U.K
.
Sw
ed
en
Ne
the
rla
nd
s
Ge
rma
ny
Fra
nc
e
Sp
ain
Ita
ly
Tu
rke
y
Po
lan
d
Ru
ssi
a
S.
Afr
ica
UA
E
Ind
ia
Ch
ina
Ho
ng
Ko
ng
S.
Ko
rea
Ja
pa
n
Ma
lays
ia
Sin
ga
po
re
Ind
on
esi
a
Au
str
alia
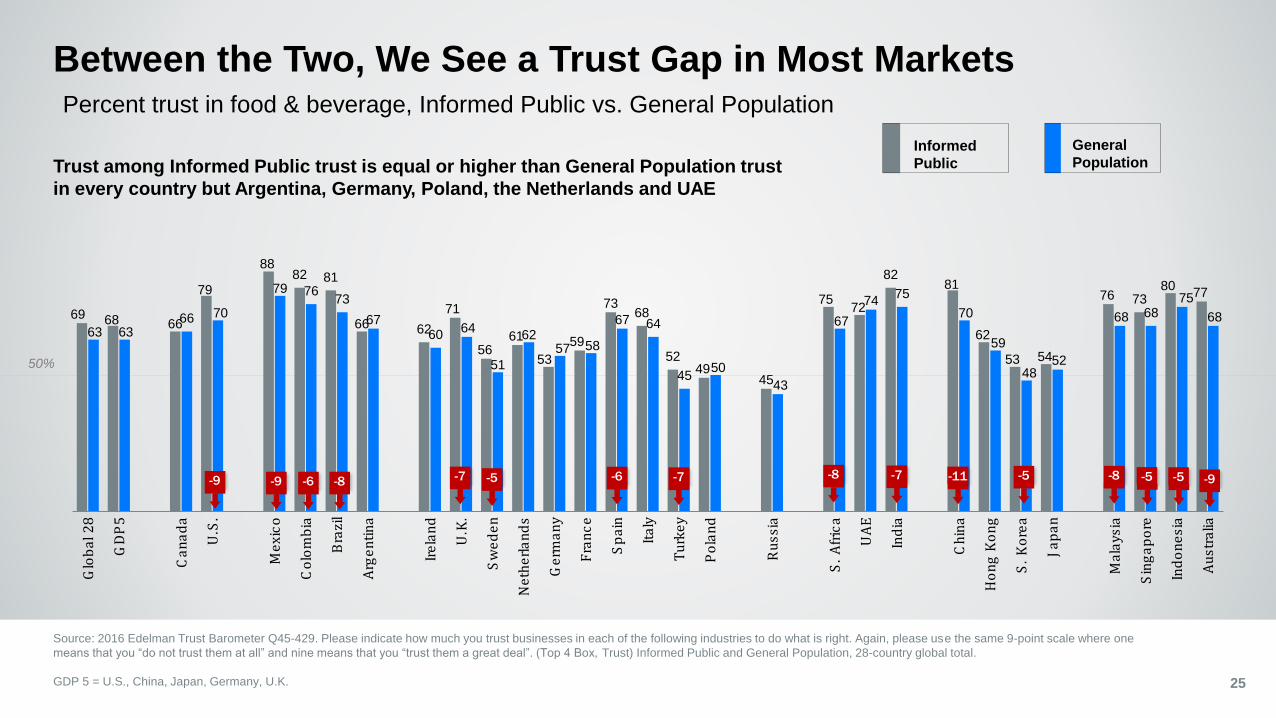
Between the Two, We See a Trust Gap in Most Markets
25
Informed
Public
General
PopulationTrust among Informed Public trust is equal or higher than General Population trust
in every country but Argentina, Germany, Poland, the Netherlands and UAE
-9 -9 -6 -8 -7 -5 -6 -8 -11 -5 -8-7 -5 -9-7 -5
Percent trust in food & beverage, Informed Public vs. General Population
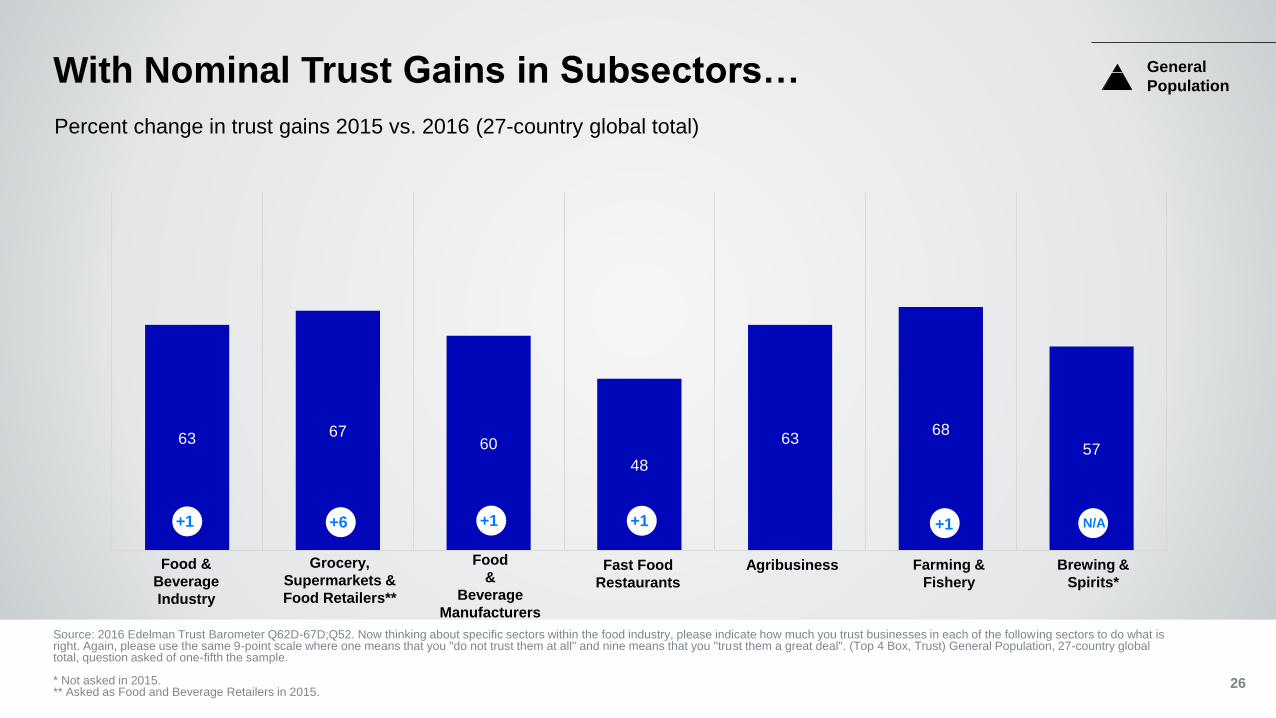
26
With Nominal Trust Gains in Subsectors…
Percent change in trust gains 2015 vs. 2016 (27-country global total)
Source: 2016 Edelman Trust Barometer Q62D-67D;Q52. Now thinking about specific sectors within the food industry, please indicate how much you trust businesses in each of the following sectors to do what is right. Again, please use the same 9-point scale where one means that you "do not trust them at all" and nine means that you "trust them a great deal". (Top 4 Box, Trust) General Population, 27-country global total, question asked of one-fifth the sample.
* Not asked in 2015.** Asked as Food and Beverage Retailers in 2015.
63 6760
48
6368
57
Food &
Beverage
Industry
Grocery,
Supermarkets &
Food Retailers**
Food
&
Beverage
Manufacturers
Fast Food
Restaurants
Agribusiness Farming &
Fishery
Brewing &
Spirits*
General
Population
+6 +1 +1 +1 N/A+1
6369
7470
56
7176
69
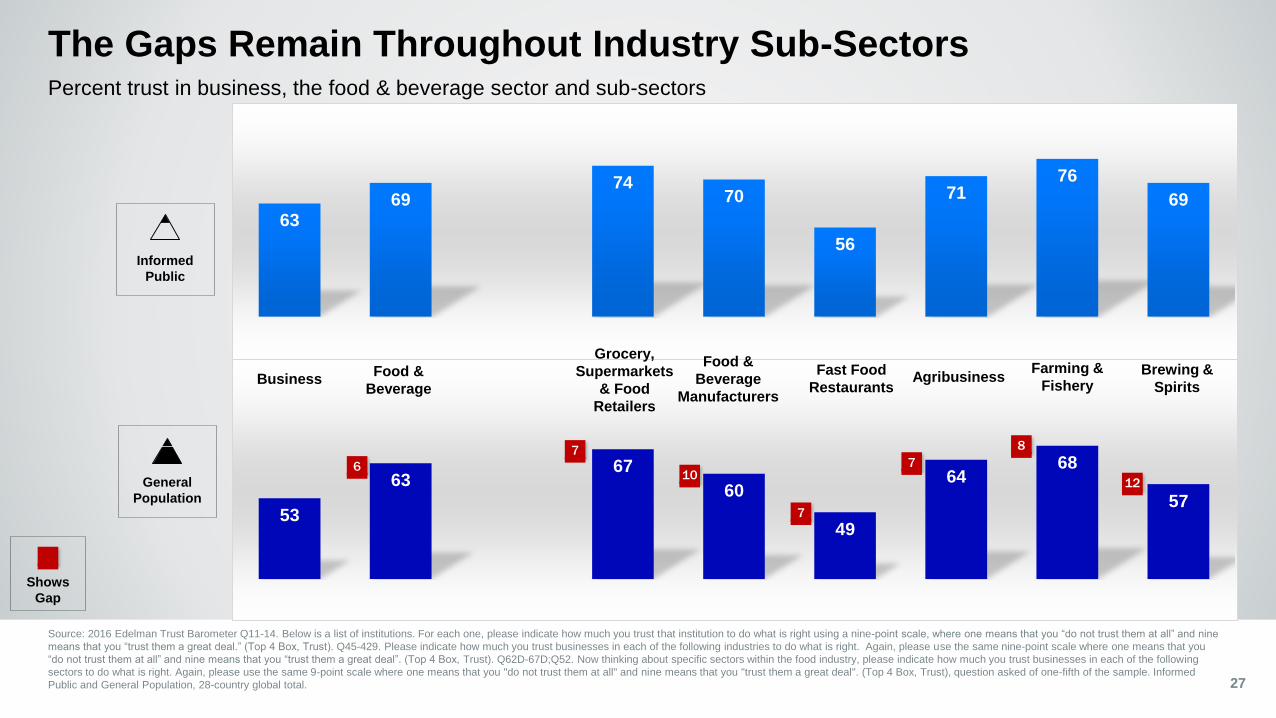
The Gaps Remain Throughout Industry Sub-Sectors
27
Informed
Public
General
Population
Source: 2016 Edelman Trust Barometer Q11-14. Below is a list of institutions. For each one, please indicate how much you trust that institution to do what is right using a nine-point scale, where one means that you “do not trust them at all” and nine
means that you “trust them a great deal.” (Top 4 Box, Trust). Q45-429. Please indicate how much you trust businesses in each of the following industries to do what is right. Again, please use the same nine-point scale where one means that you
“do not trust them at all” and nine means that you “trust them a great deal”. (Top 4 Box, Trust). Q62D-67D;Q52. Now thinking about specific sectors within the food industry, please indicate how much you trust businesses in each of the following
sectors to do what is right. Again, please use the same 9-point scale where one means that you "do not trust them at all" and nine means that you "trust them a great deal". (Top 4 Box, Trust), question asked of one-fifth of the sample. Informed
Public and General Population, 28-country global total.
53
6367
60
49
6468
57
6
7
10
7
7
12
8
BusinessFood &
Beverage
Grocery,
Supermarkets
& Food
Retailers
Food &
Beverage
Manufacturers
Fast Food
RestaurantsAgribusiness
Farming &
FisheryBrewing &
Spirits
Percent trust in business, the food & beverage sector and sub-sectors
Shows
Gap
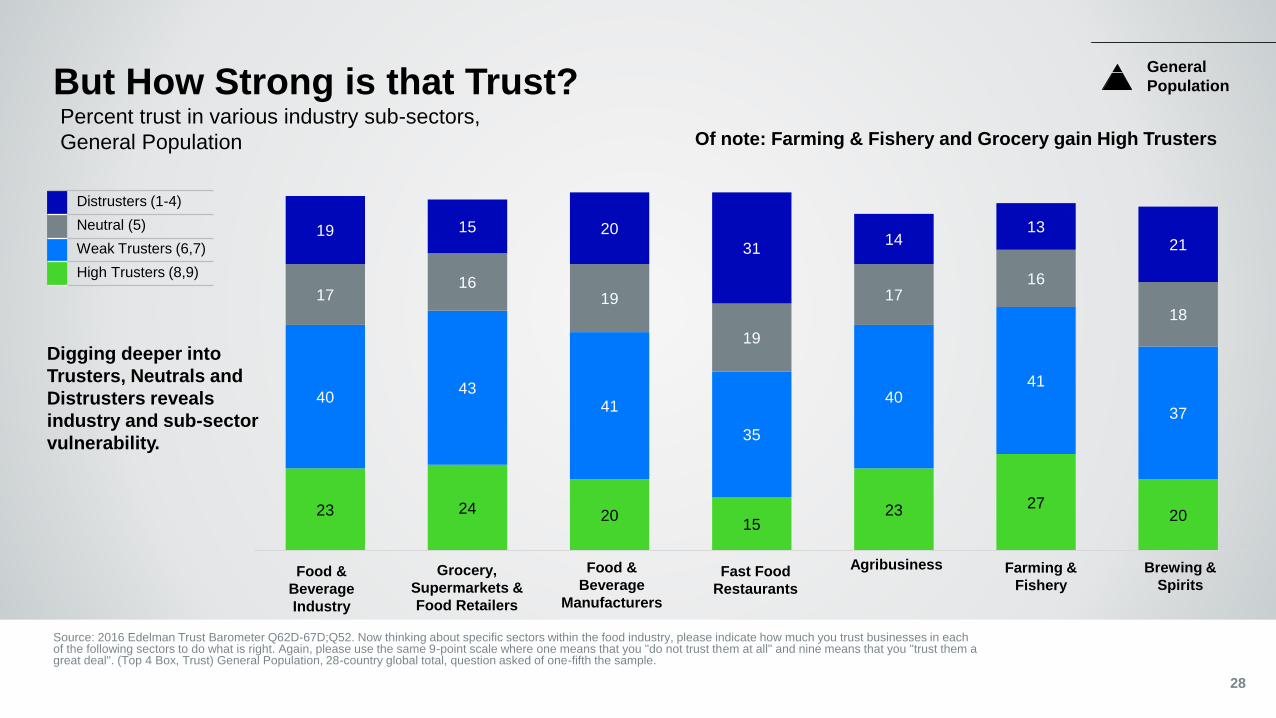
But How Strong is that Trust?
28
Digging deeper into
Trusters, Neutrals and
Distrusters reveals
industry and sub-sector
vulnerability.
Distrusters (1-4)
Neutral (5)
Weak Trusters (6,7)
High Trusters (8,9)
General
Population
Source: 2016 Edelman Trust Barometer Q62D-67D;Q52. Now thinking about specific sectors within the food industry, please indicate how much you trust businesses in each of the following sectors to do what is right. Again, please use the same 9-point scale where one means that you "do not trust them at all" and nine means that you "trust them a great deal". (Top 4 Box, Trust) General Population, 28-country global total, question asked of one-fifth the sample.
23 24 2015
23 2720
4043
41
35
4041
37
1716
19
19
1716
18
19 15 20
3114
1321
Food &
Beverage
Industry
Grocery,
Supermarkets &
Food Retailers
Food &
Beverage
Manufacturers
Fast Food
Restaurants
Agribusiness Farming &
Fishery
Brewing &
Spirits
Percent trust in various industry sub-sectors,
General Population Of note: Farming & Fishery and Grocery gain High Trusters
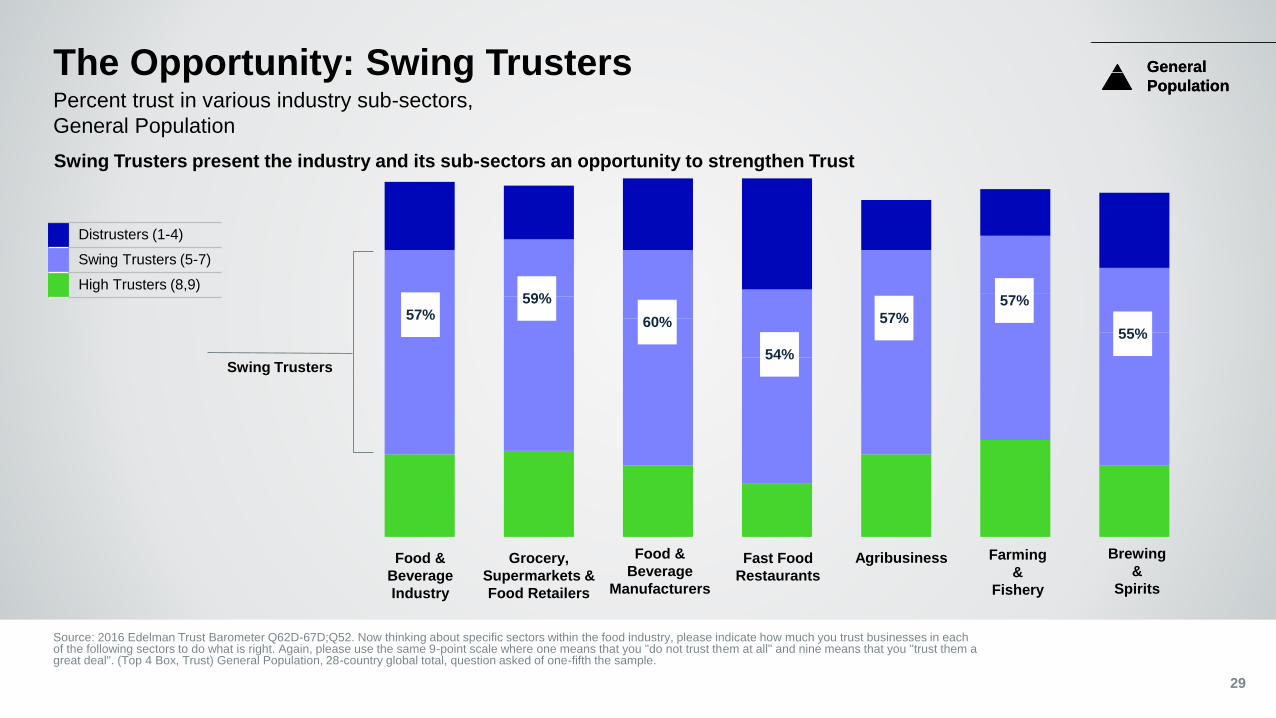
The Opportunity: Swing Trusters
29
Swing Trusters present the industry and its sub-sectors an opportunity to strengthen Trust
General
Population
Source: 2016 Edelman Trust Barometer Q62D-67D;Q52. Now thinking about specific sectors within the food industry, please indicate how much you trust businesses in each of the following sectors to do what is right. Again, please use the same 9-point scale where one means that you "do not trust them at all" and nine means that you "trust them a great deal". (Top 4 Box, Trust) General Population, 28-country global total, question asked of one-fifth the sample.
General
Population
Swing Trusters
57%59%
60%
54%
57%
57%
Food &
Beverage
Industry
Grocery,
Supermarkets &
Food Retailers
Food &
Beverage
Manufacturers
Fast Food
Restaurants
Agribusiness Farming
&
Fishery
Brewing
&
Spirits
55%
Distrusters (1-4)
Swing Trusters (5-7)
High Trusters (8,9)
Percent trust in various industry sub-sectors,
General Population
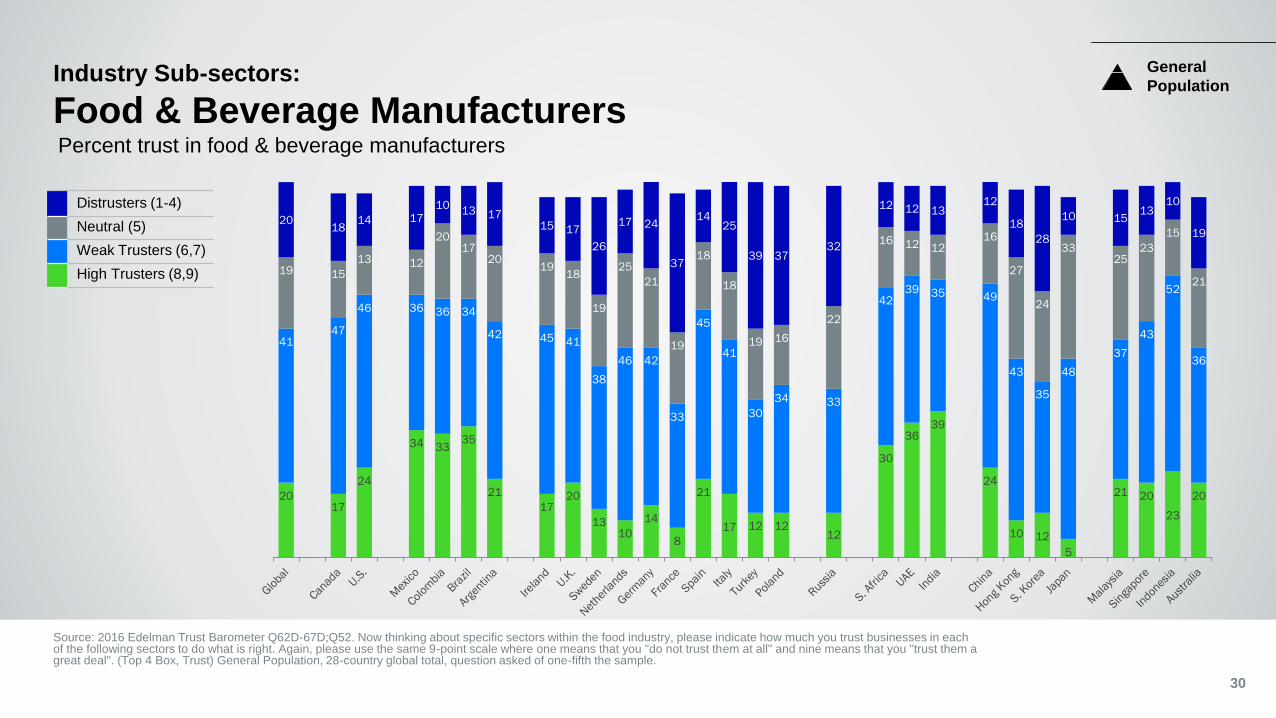
Industry Sub-sectors:
Food & Beverage Manufacturers
30
Percent trust in food & beverage manufacturers
General
Population
2017
24
34 3335
21
1720
1310
14
8
21
17 12 1212
30
3639
24
10 12
5
21 20
23
20
4147
46 36 36 34
42 45 41
38
46 42
33
45
41
30
34 33
4239 35 49
43
35
48
37
43
52
36
19 15
13 12
2017
2019
18
19
25
21
19
18
18
19 16
22
16 12 1216
27
24
3325
23
15
21
2018
14 1710
13 1715 17
26
17 24
37
1425
39 3732
12 12 1312
18
28
10 1513
10
19
Source: 2016 Edelman Trust Barometer Q62D-67D;Q52. Now thinking about specific sectors within the food industry, please indicate how much you trust businesses in each of the following sectors to do what is right. Again, please use the same 9-point scale where one means that you "do not trust them at all" and nine means that you "trust them a great deal". (Top 4 Box, Trust) General Population, 28-country global total, question asked of one-fifth the sample.
Distrusters (1-4)
Neutral (5)
Weak Trusters (6,7)
High Trusters (8,9)
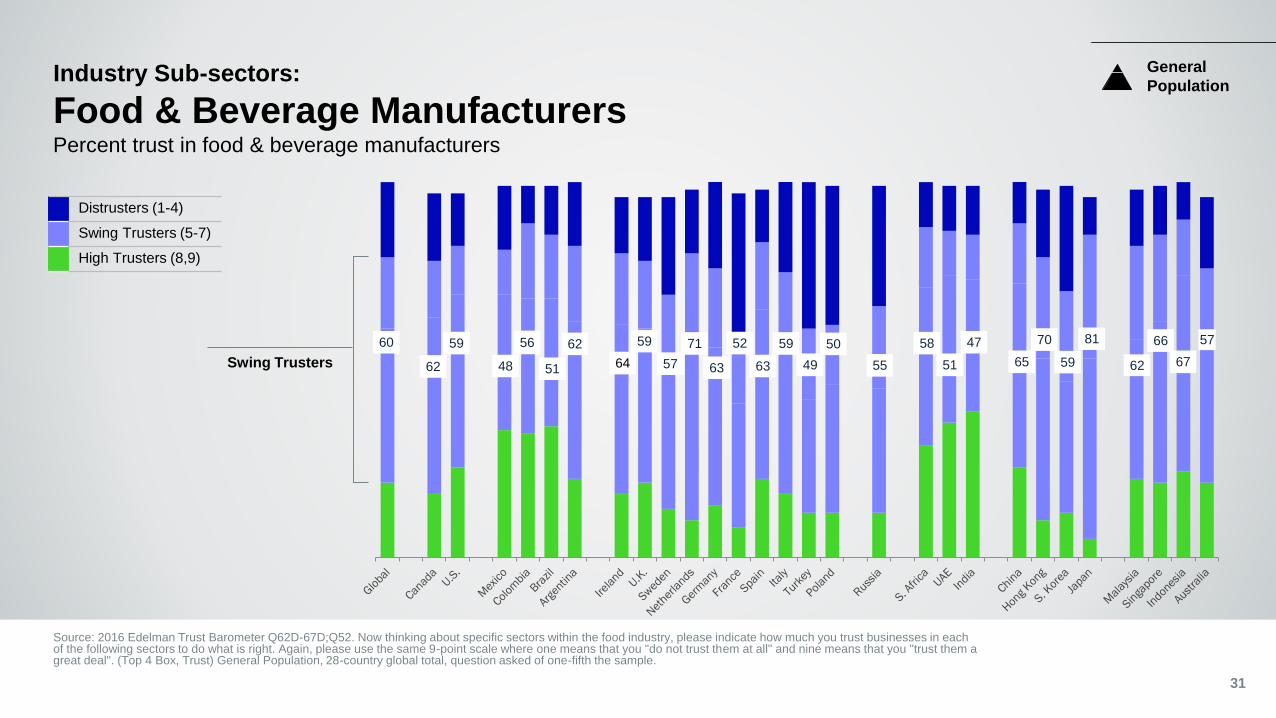
Industry Sub-sectors:
Food & Beverage Manufacturers
31
Percent trust in food & beverage manufacturers
General
Population
Swing Trusters
Source: 2016 Edelman Trust Barometer Q62D-67D;Q52. Now thinking about specific sectors within the food industry, please indicate how much you trust businesses in each of the following sectors to do what is right. Again, please use the same 9-point scale where one means that you "do not trust them at all" and nine means that you "trust them a great deal". (Top 4 Box, Trust) General Population, 28-country global total, question asked of one-fifth the sample.
60 59
62 48
56 62 59
6364
59
63
5271 50
57 55 51
58
49
47
65
81
59 67
576670
6251
Distrusters (1-4)
Swing Trusters (5-7)
High Trusters (8,9)
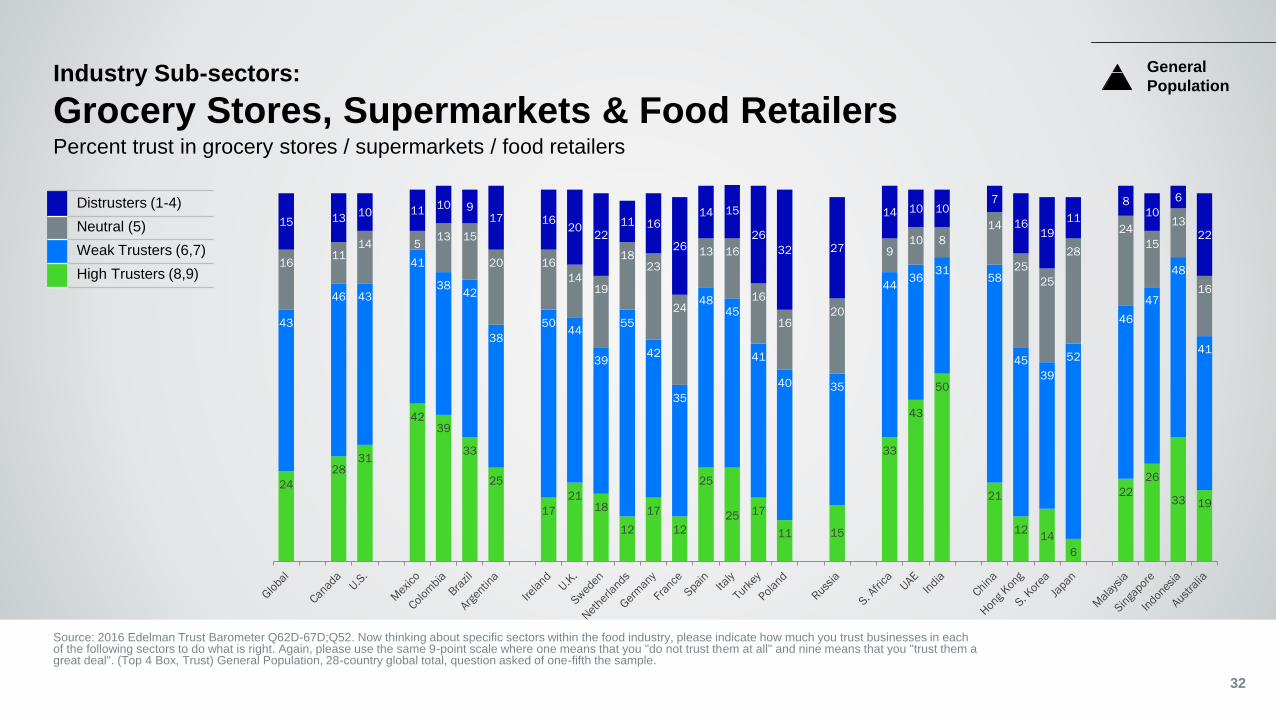
32
Percent trust in grocery stores / supermarkets / food retailers
General
Population
24
2831
4239
33
25
17
2118
12
17
12
25
25 17
11 15
33
43
50
21
1214
6
22
26
33 19
43
46 43
41
3842
38
5044
39
55
42
35
4845
41
40 35
4436
3158
45
39
52
46
47
48
41
1611
14 513 15
20 16
1419
1823
24
13 16
16
1620
910 8
14
25
25
28
24
15
13
16
15 1310 11
10 917 16
2022
11 16
26
14 15
26
32 27
14 10 107
1619
11
810
6
22
Source: 2016 Edelman Trust Barometer Q62D-67D;Q52. Now thinking about specific sectors within the food industry, please indicate how much you trust businesses in each of the following sectors to do what is right. Again, please use the same 9-point scale where one means that you "do not trust them at all" and nine means that you "trust them a great deal". (Top 4 Box, Trust) General Population, 28-country global total, question asked of one-fifth the sample.
Distrusters (1-4)
Neutral (5)
Weak Trusters (6,7)
High Trusters (8,9)
Industry Sub-sectors:
Grocery Stores, Supermarkets & Food Retailers
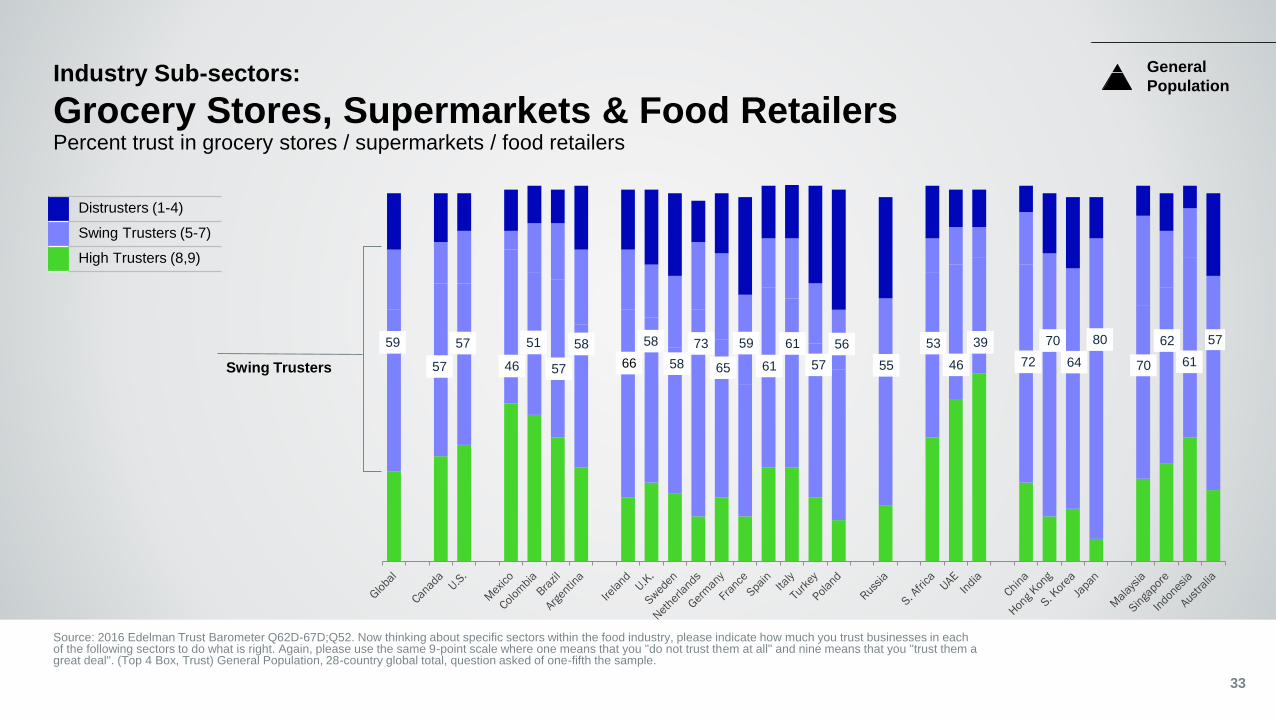
Industry Sub-sectors:
Grocery Stores, Supermarkets & Food Retailers
33
General
Population
Swing Trusters
Source: 2016 Edelman Trust Barometer Q62D-67D;Q52. Now thinking about specific sectors within the food industry, please indicate how much you trust businesses in each of the following sectors to do what is right. Again, please use the same 9-point scale where one means that you "do not trust them at all" and nine means that you "trust them a great deal". (Top 4 Box, Trust) General Population, 28-country global total, question asked of one-fifth the sample.
Percent trust in grocery stores / supermarkets / food retailers
59 57
57 46
51 58 58
6566
61
61
5973 56
58 55 46
53
57
39
72
80
64 61
576270
7057
Distrusters (1-4)
Swing Trusters (5-7)
High Trusters (8,9)
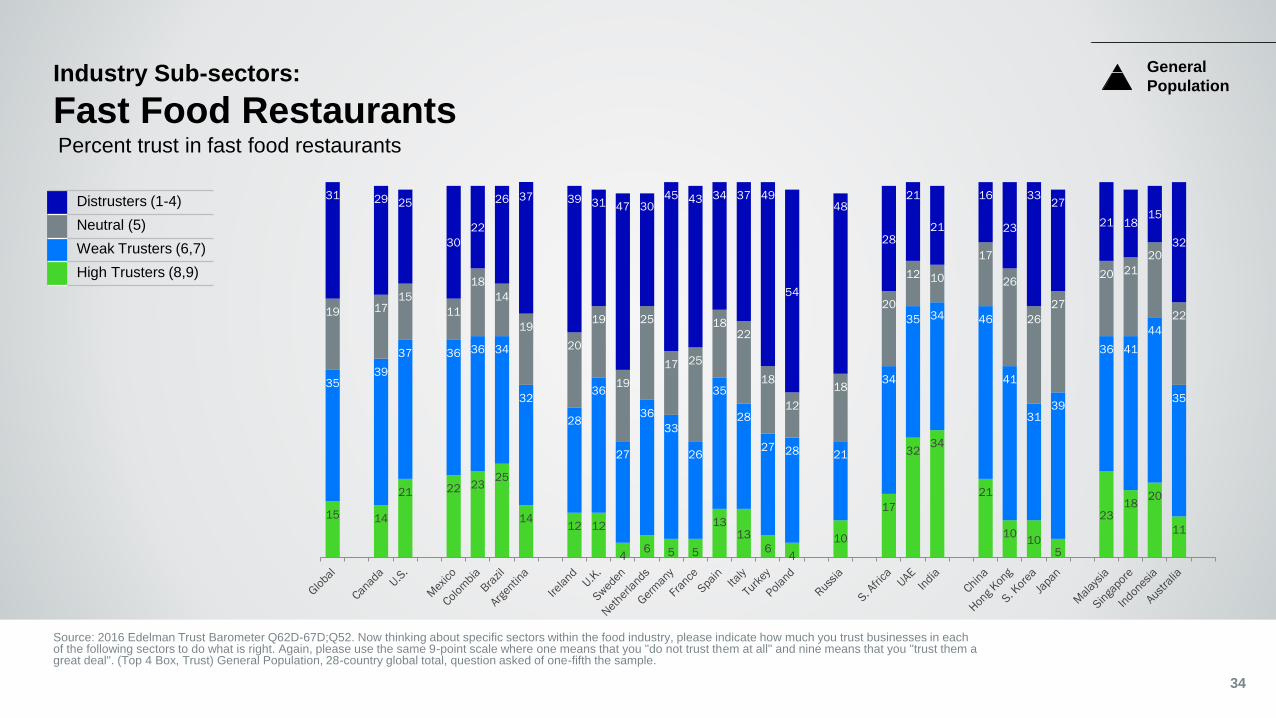
Industry Sub-sectors:
Fast Food Restaurants
34
Percent trust in fast food restaurants
General
Population
15 14
21 22 2325
1412 12
46 5 5
1313
64
10
17
3234
21
1010
5
2318
20
11
3539
37 36 36 34
32
28
36
27
36
33
26
35
28
27 28 21
34
35 34 46
41
3139
36 41
44
35
19 1715
11
18
14
19
20
19
19
25
17 25
1822
18
12
18
20
12 10
17
26
26
27
20 21
20
22
31 29 25
30
22
26 37 39 31 47 3045 43 34 37 49
54
48
28
21
21
16
23
3327
21 1815
32
Source: 2016 Edelman Trust Barometer Q62D-67D;Q52. Now thinking about specific sectors within the food industry, please indicate how much you trust businesses in each of the following sectors to do what is right. Again, please use the same 9-point scale where one means that you "do not trust them at all" and nine means that you "trust them a great deal". (Top 4 Box, Trust) General Population, 28-country global total, question asked of one-fifth the sample.
Distrusters (1-4)
Neutral (5)
Weak Trusters (6,7)
High Trusters (8,9)
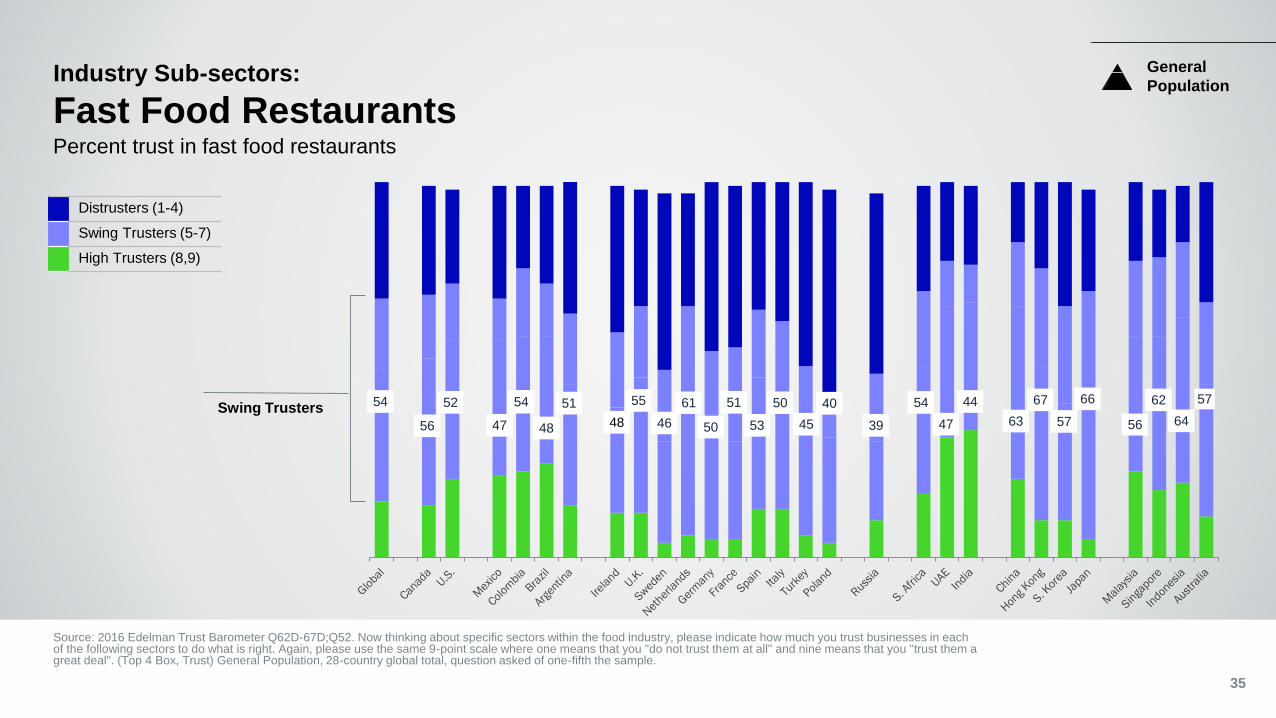
Industry Sub-sectors:
Fast Food Restaurants
35
Percent trust in fast food restaurants
General
Population
Swing Trusters
Source: 2016 Edelman Trust Barometer Q62D-67D;Q52. Now thinking about specific sectors within the food industry, please indicate how much you trust businesses in each of the following sectors to do what is right. Again, please use the same 9-point scale where one means that you "do not trust them at all" and nine means that you "trust them a great deal". (Top 4 Box, Trust) General Population, 28-country global total, question asked of one-fifth the sample.
54 52
56 47
54 51 55
5048
50
53
5161 40
46 39 47
54
45
44
63
66
57 64
576267
5648
Distrusters (1-4)
Swing Trusters (5-7)
High Trusters (8,9)
Industry Sub-sectors:
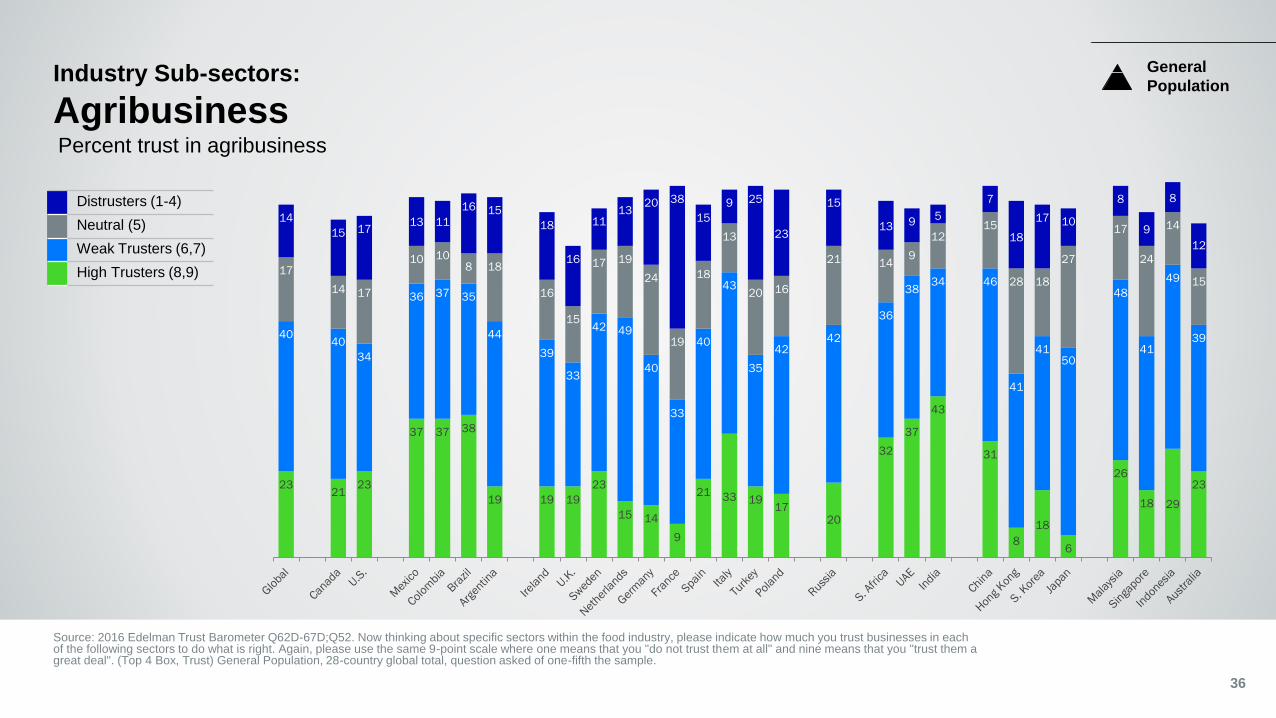
Agribusiness
36
Percent trust in agribusiness
General
Population
2321
23
37 37 38
19 19 19
23
15 14
9
21 33 1917
20
32
37
43
31
8
18
6
26
18 29
23
4040
34
36 37 35
44
39
33
42 49
40
33
40
43
35
4242
36
3834 46
41
4150
48
41
49
39
17
14 17
10 108 18
16
15
17 19
24
19
18
13
20 16
21 149
1215
28 18
27
17
24
14
15
14
15 1713 11
16 15
18
16
1113
20 38
15
9 25
23
15
13 95
7
18
17 10
8
9
8
12
Source: 2016 Edelman Trust Barometer Q62D-67D;Q52. Now thinking about specific sectors within the food industry, please indicate how much you trust businesses in each of the following sectors to do what is right. Again, please use the same 9-point scale where one means that you "do not trust them at all" and nine means that you "trust them a great deal". (Top 4 Box, Trust) General Population, 28-country global total, question asked of one-fifth the sample.
Distrusters (1-4)
Neutral (5)
Weak Trusters (6,7)
High Trusters (8,9)
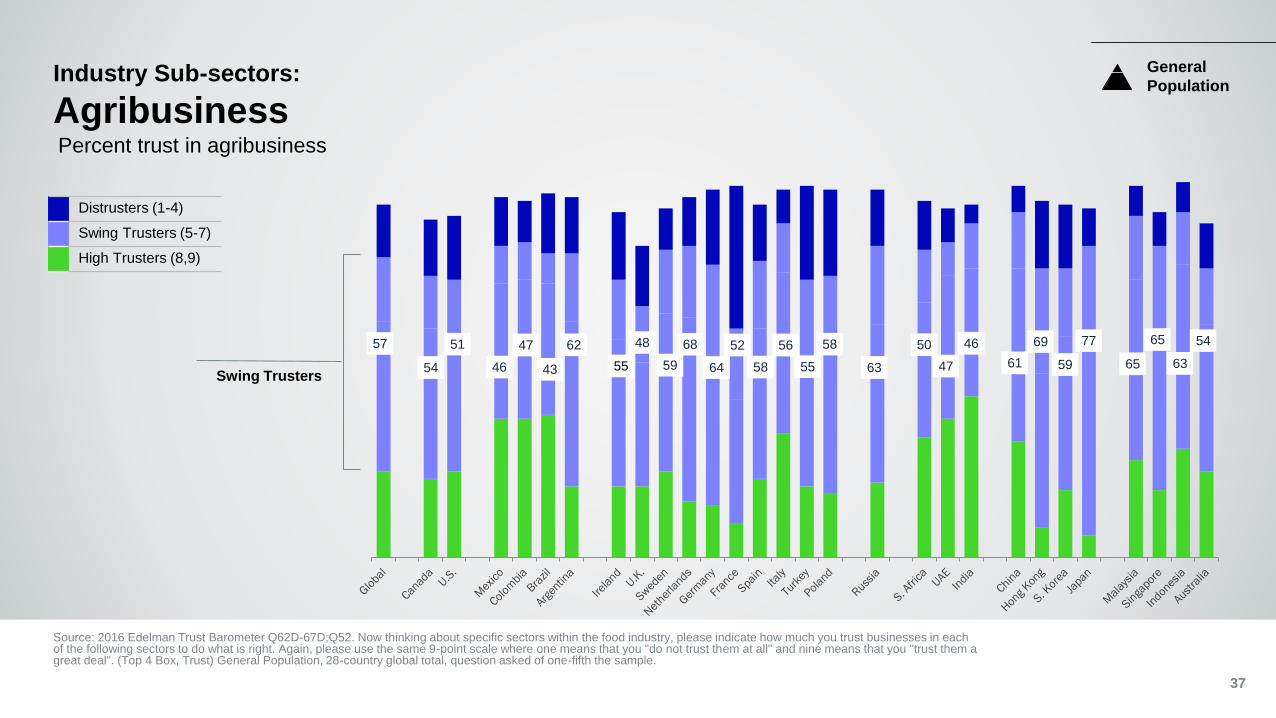
Industry Sub-sectors:
Agribusiness
37
Percent trust in agribusiness
General
Population
Swing Trusters
Source: 2016 Edelman Trust Barometer Q62D-67D;Q52. Now thinking about specific sectors within the food industry, please indicate how much you trust businesses in each of the following sectors to do what is right. Again, please use the same 9-point scale where one means that you "do not trust them at all" and nine means that you "trust them a great deal". (Top 4 Box, Trust) General Population, 28-country global total, question asked of one-fifth the sample.
57 51
54 46
47 62 48
6455
56
58
5268 58
59 63 47
50
55
46
61
77
59 63
546569
6543
Distrusters (1-4)
Swing Trusters (5-7)
High Trusters (8,9)
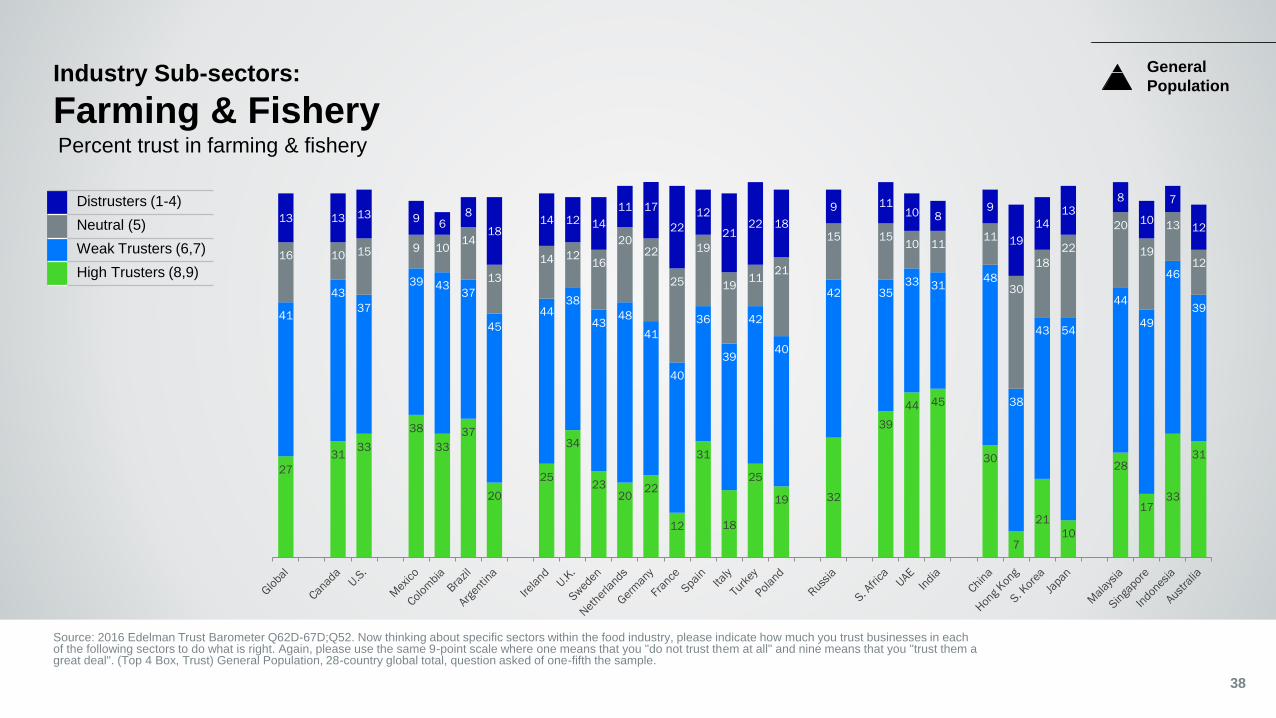
Industry Sub-sectors:
Farming & Fishery
38
Percent trust in farming & fishery
General
Population
27
3133
38
33
37
20
25
34
2320
22
12
31
18
25
19 32
39
44 45
30
7
21
10
28
1733
31
41
43
37
39 4337
45
4438
4348
41
40
36
39
42
40
42 3533 31
48
38
43 54
44
49
46
39
16 10 15 9 1014
13
14 1216
2022
25
19
1911
21
15 1510 11
11
30
18
22
20
19
13
12
13 13 13 96
8
1814 12 14
11 17
22
12
2122 18
9 1110 8
9
19
1413
8
10
7
12
Source: 2016 Edelman Trust Barometer Q62D-67D;Q52. Now thinking about specific sectors within the food industry, please indicate how much you trust businesses in each of the following sectors to do what is right. Again, please use the same 9-point scale where one means that you "do not trust them at all" and nine means that you "trust them a great deal". (Top 4 Box, Trust) General Population, 28-country global total, question asked of one-fifth the sample.
Distrusters (1-4)
Neutral (5)
Weak Trusters (6,7)
High Trusters (8,9)
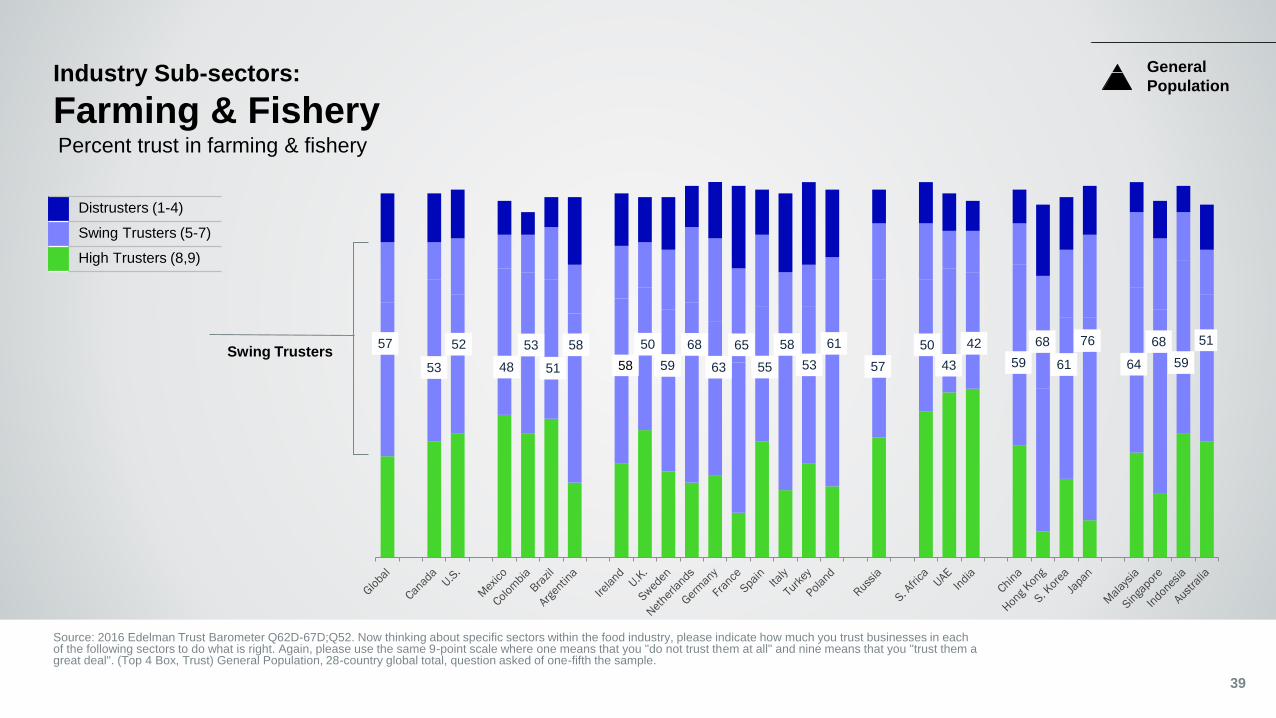
Industry Sub-sectors:
Farming & Fishery
39
Percent trust in farming & fishery
General
Population
Swing Trusters
Source: 2016 Edelman Trust Barometer Q62D-67D;Q52. Now thinking about specific sectors within the food industry, please indicate how much you trust businesses in each of the following sectors to do what is right. Again, please use the same 9-point scale where one means that you "do not trust them at all" and nine means that you "trust them a great deal". (Top 4 Box, Trust) General Population, 28-country global total, question asked of one-fifth the sample.
57 52
53 48
53 58 50
6358
58
55
6568 61
59 57 43
50
53
42
59
76
61 59
516868
6451
Distrusters (1-4)
Swing Trusters (5-7)
High Trusters (8,9)
Industry Sub-sectors:
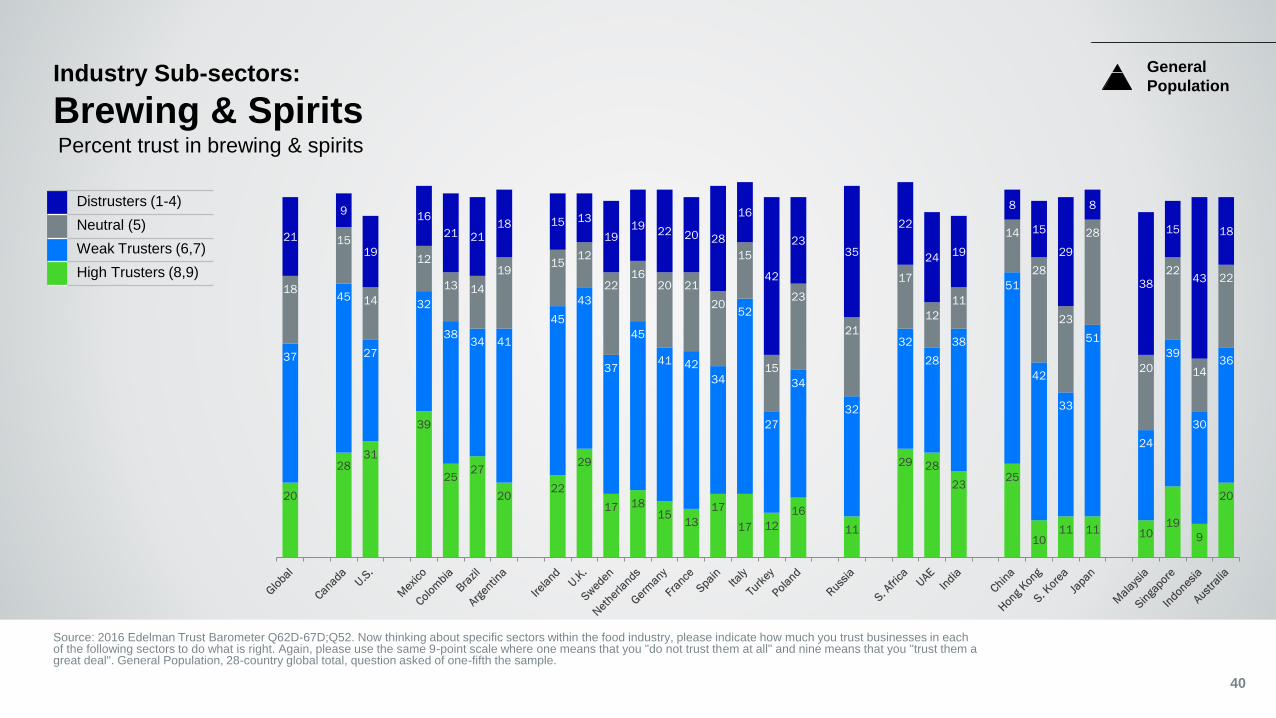
Brewing & Spirits
40
Percent trust in brewing & spirits
General
Population
20
2831
39
2527
2022
29
17 1815
13
17
17 12
16
11
29 28
2325
1011 11 10
19
9
20
37
45
27
32
3834 41
45
43
37
45
41 42
34
52
27
34
32
32
28
38
51
42
33
51
24
39
30
36
18
15
14
12
13 14
1915
12
2216
20 21
20
15
15
23
21
17
12
11
14
28
23
28
20
22
14
22
21
9
19
16
21 2118 15 13
1919
22 20 28
16
42
2335
22
2419
8
15
29
8
38
15
43
18
Source: 2016 Edelman Trust Barometer Q62D-67D;Q52. Now thinking about specific sectors within the food industry, please indicate how much you trust businesses in each of the following sectors to do what is right. Again, please use the same 9-point scale where one means that you "do not trust them at all" and nine means that you "trust them a great deal". General Population, 28-country global total, question asked of one-fifth the sample.
Distrusters (1-4)
Neutral (5)
Weak Trusters (6,7)
High Trusters (8,9)
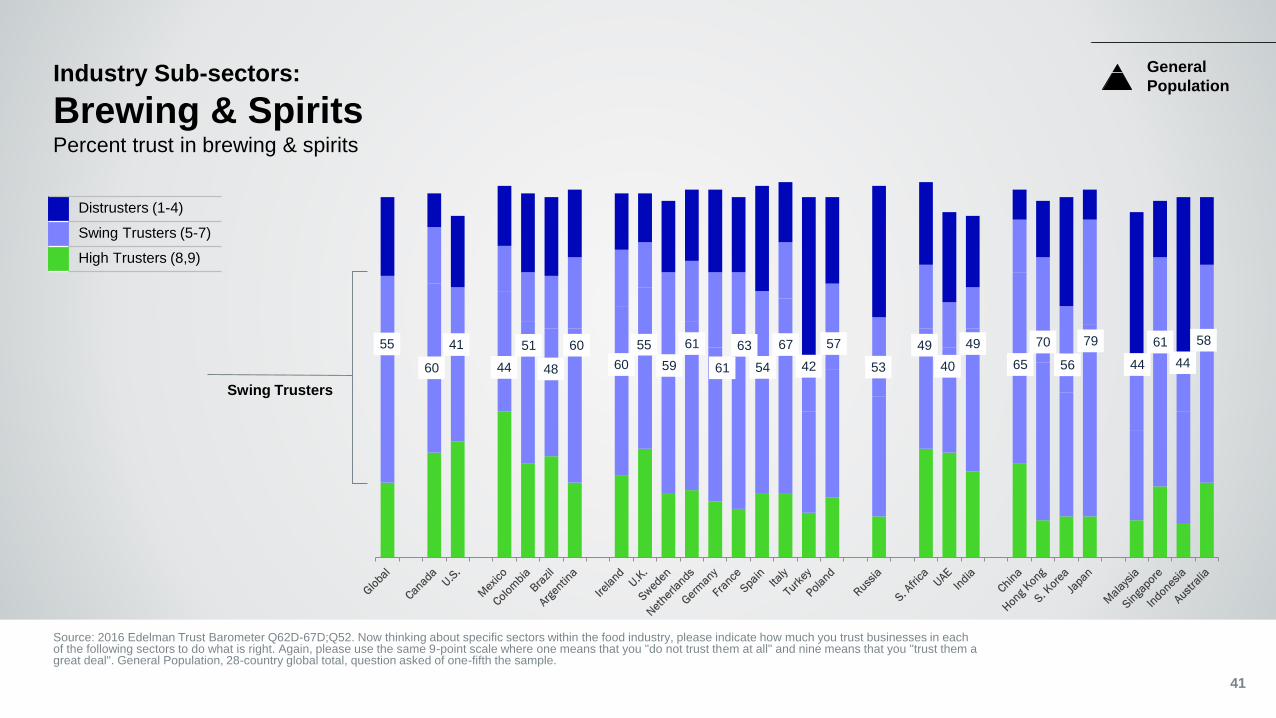
Industry Sub-sectors:
Brewing & Spirits
41
Percent trust in brewing & spirits
General
Population
Swing Trusters
Source: 2016 Edelman Trust Barometer Q62D-67D;Q52. Now thinking about specific sectors within the food industry, please indicate how much you trust businesses in each of the following sectors to do what is right. Again, please use the same 9-point scale where one means that you "do not trust them at all" and nine means that you "trust them a great deal". General Population, 28-country global total, question asked of one-fifth the sample.
55 41
60 44
51 60 55
6160
67
54
6361 57
59 53 40
49
42
49
65
79
56 44
586170
4448
Distrusters (1-4)
Swing Trusters (5-7)
High Trusters (8,9)
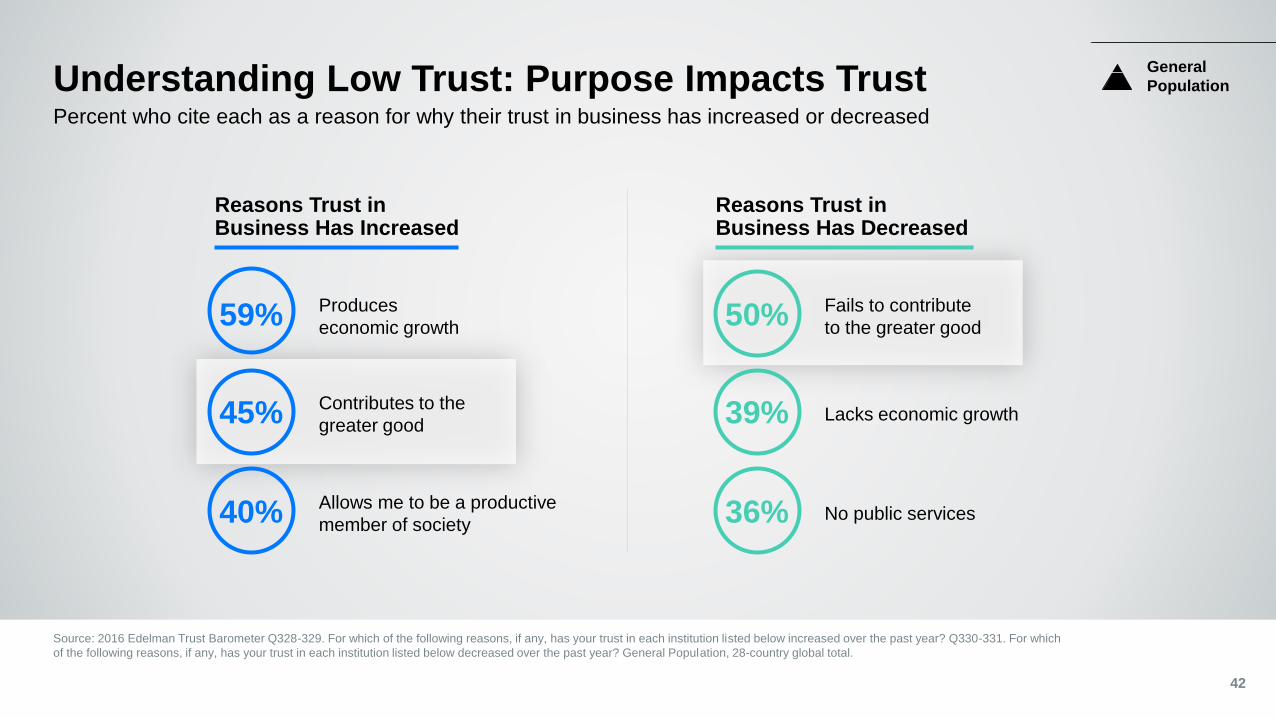
Understanding Low Trust: Purpose Impacts Trust
42
Percent who cite each as a reason for why their trust in business has increased or decreased
Source: 2016 Edelman Trust Barometer Q328-329. For which of the following reasons, if any, has your trust in each institution listed below increased over the past year? Q330-331. For which
of the following reasons, if any, has your trust in each institution listed below decreased over the past year? General Population, 28-country global total.
Reasons Trust in Business Has Increased
Reasons Trust in Business Has Decreased
Produces
economic growth
Contributes to the
greater good
Allows me to be a productive
member of society
Fails to contribute
to the greater good
Lacks economic growth
No public services
59%
45%
40%
50%
39%
36%
General
Population
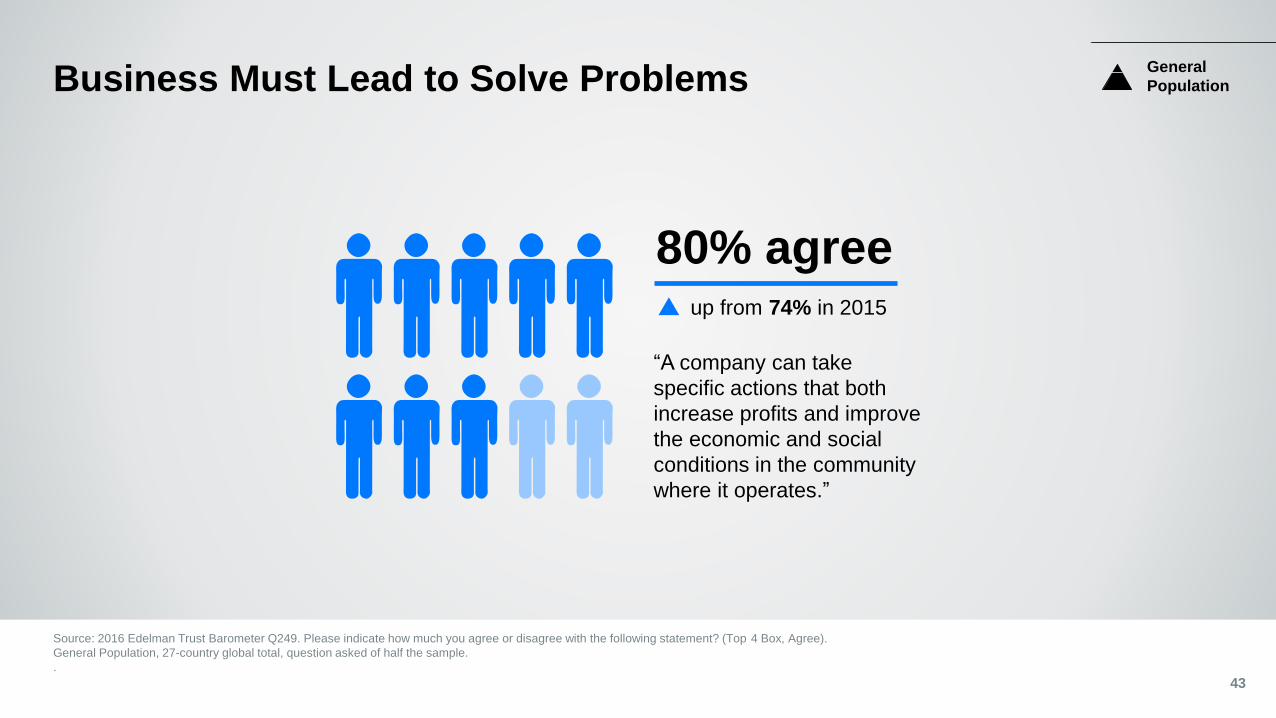
Business Must Lead to Solve Problems
Source: 2016 Edelman Trust Barometer Q249. Please indicate how much you agree or disagree with the following statement? (Top 4 Box, Agree).
General Population, 27-country global total, question asked of half the sample.
.
80% agree
“A company can take
specific actions that both
increase profits and improve
the economic and social
conditions in the community
where it operates.”
up from 74% in 2015
General
Population
43
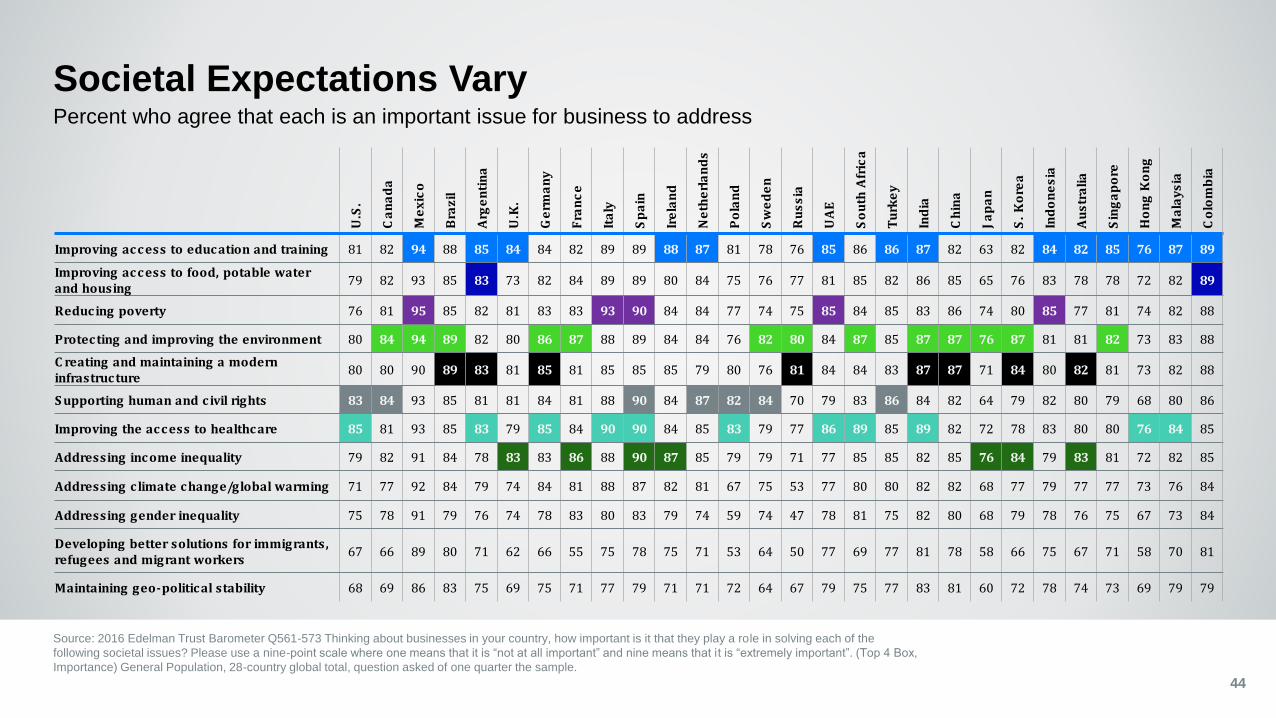
Societal Expectations Vary
Source: 2016 Edelman Trust Barometer Q561-573 Thinking about businesses in your country, how important is it that they play a role in solving each of the
following societal issues? Please use a nine-point scale where one means that it is “not at all important” and nine means that it is “extremely important”. (Top 4 Box,
Importance) General Population, 28-country global total, question asked of one quarter the sample.
44
Percent who agree that each is an important issue for business to address
U.S
.
Ca
na
da
Me
xic
o
Bra
zil
Arg
en
tin
a
U.K
.
Ge
rma
ny
Fra
nc
e
Ita
ly
Sp
ain
Ire
lan
d
Ne
the
rla
nd
s
Po
lan
d
Sw
ed
en
Ru
ss
ia
UA
E
So
uth
Afr
ica
Tu
rke
y
Ind
ia
Ch
ina
Ja
pa
n
S.
Ko
rea
Ind
on
es
ia
Au
str
ali
a
Sin
ga
po
re
Ho
ng
Ko
ng
Ma
lay
sia
Co
lom
bia
Improving access to education and training 81 82 94 88 85 84 84 82 89 89 88 87 81 78 76 85 86 86 87 82 63 82 84 82 85 76 87 89
Improving access to food, potable water and housing
79 82 93 85 83 73 82 84 89 89 80 84 75 76 77 81 85 82 86 85 65 76 83 78 78 72 82 89
Reducing poverty 76 81 95 85 82 81 83 83 93 90 84 84 77 74 75 85 84 85 83 86 74 80 85 77 81 74 82 88
Protecting and improving the environment 80 84 94 89 82 80 86 87 88 89 84 84 76 82 80 84 87 85 87 87 76 87 81 81 82 73 83 88
C reating and maintaining a modern infrastructure
80 80 90 89 83 81 85 81 85 85 85 79 80 76 81 84 84 83 87 87 71 84 80 82 81 73 82 88
S upporting human and civil rights 83 84 93 85 81 81 84 81 88 90 84 87 82 84 70 79 83 86 84 82 64 79 82 80 79 68 80 86
Improving the access to healthcare 85 81 93 85 83 79 85 84 90 90 84 85 83 79 77 86 89 85 89 82 72 78 83 80 80 76 84 85
Addressing income inequality 79 82 91 84 78 83 83 86 88 90 87 85 79 79 71 77 85 85 82 85 76 84 79 83 81 72 82 85
Addressing climate change/global warming 71 77 92 84 79 74 84 81 88 87 82 81 67 75 53 77 80 80 82 82 68 77 79 77 77 73 76 84
Addressing gender inequality 75 78 91 79 76 74 78 83 80 83 79 74 59 74 47 78 81 75 82 80 68 79 78 76 75 67 73 84
Developing better solutions for immigrants, refugees and migrant workers
67 66 89 80 71 62 66 55 75 78 75 71 53 64 50 77 69 77 81 78 58 66 75 67 71 58 70 81
Maintaining geo-political stability 68 69 86 83 75 69 75 71 77 79 71 71 72 64 67 79 75 77 83 81 60 72 78 74 73 69 79 79
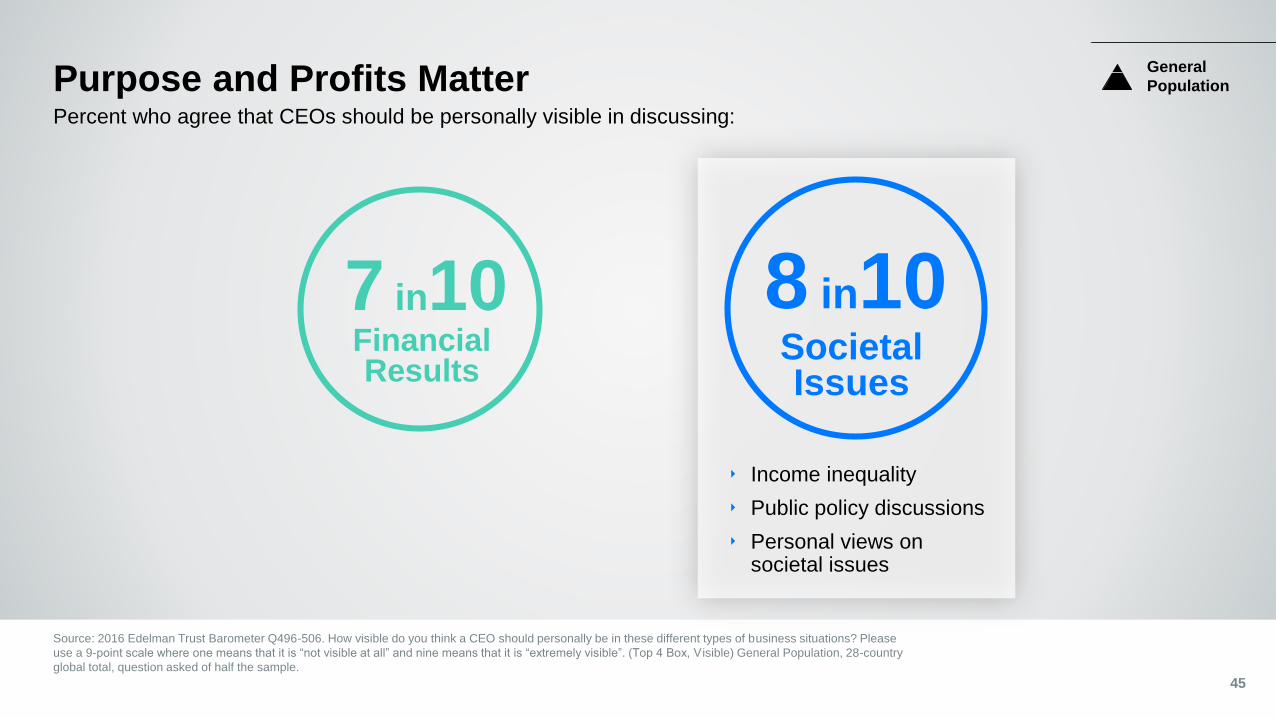
Purpose and Profits Matter
Source: 2016 Edelman Trust Barometer Q496-506. How visible do you think a CEO should personally be in these different types of business situations? Please
use a 9-point scale where one means that it is “not visible at all” and nine means that it is “extremely visible”. (Top 4 Box, V isible) General Population, 28-country
global total, question asked of half the sample.
45
Percent who agree that CEOs should be personally visible in discussing:
8 in10Societal Issues
‣ Income inequality
‣ Public policy discussions
‣ Personal views on societal issues
7 in10Financial Results
General
Population
5452 51
53
69
63
72
58
44
50
39
46 45
35
48
55
4650
35
64
7073 72
48
43
38
62 64
73
45
Glo
ba
l
GD
P 5
Ca
na
da
U.S
.
Me
xic
o
Co
lom
bia
Bra
zil
Arg
en
tin
a
Ire
lan
d
U.K
.
Sw
ed
en
Ne
the
rla
nd
s
Ge
rma
ny
Fra
nc
e
Sp
ain
Ita
ly
Tu
rke
y
Po
lan
d
Ru
ss
ia
S.
Afr
ica
UA
E
Ind
ia
Ch
ina
Ho
ng
Ko
ng
S.
Ko
rea
Ja
pa
n
Ma
lays
ia
Sin
ga
po
re
Ind
on
esi
a
Au
stra
lia
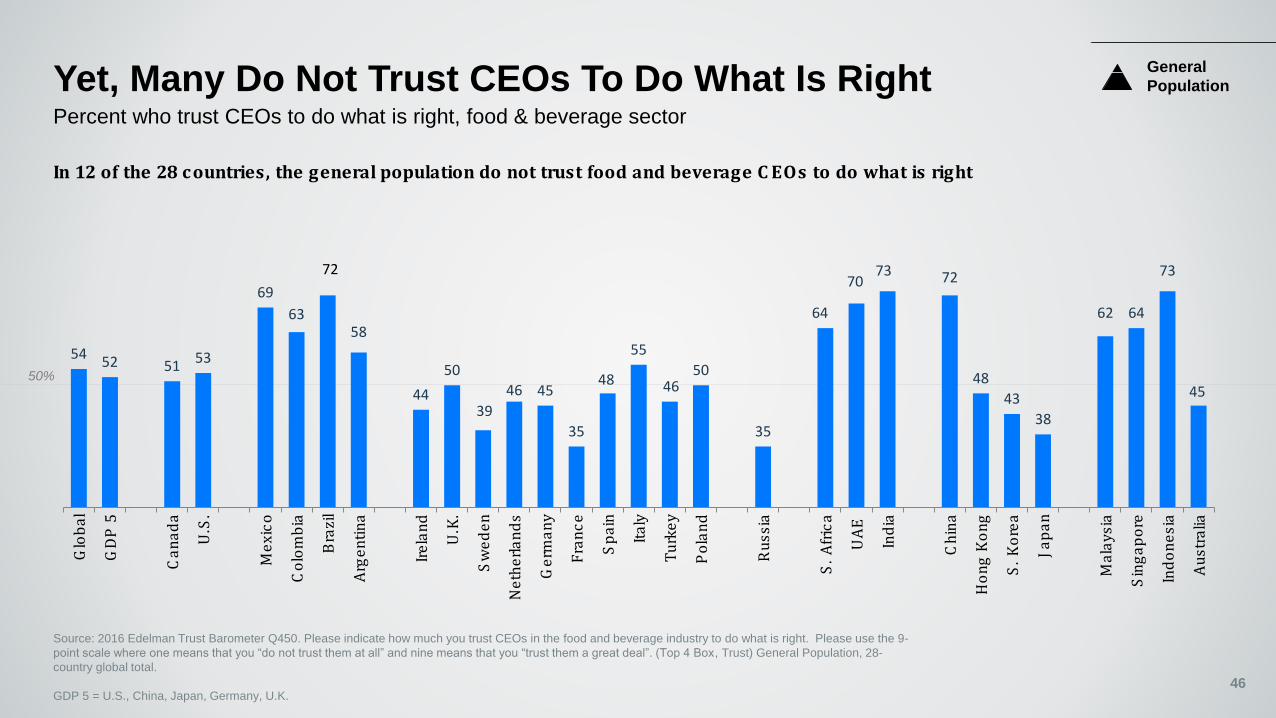
Yet, Many Do Not Trust CEOs To Do What Is Right
46
General
Population
50%
In 12 of the 28 countries, the general population do not trust food and beverage C EOs to do what is right
Source: 2016 Edelman Trust Barometer Q450. Please indicate how much you trust CEOs in the food and beverage industry to do what is right. Please use the 9-
point scale where one means that you “do not trust them at all” and nine means that you “trust them a great deal”. (Top 4 Box, Trust) General Population, 28-
country global total.
GDP 5 = U.S., China, Japan, Germany, U.K.
Percent who trust CEOs to do what is right, food & beverage sector
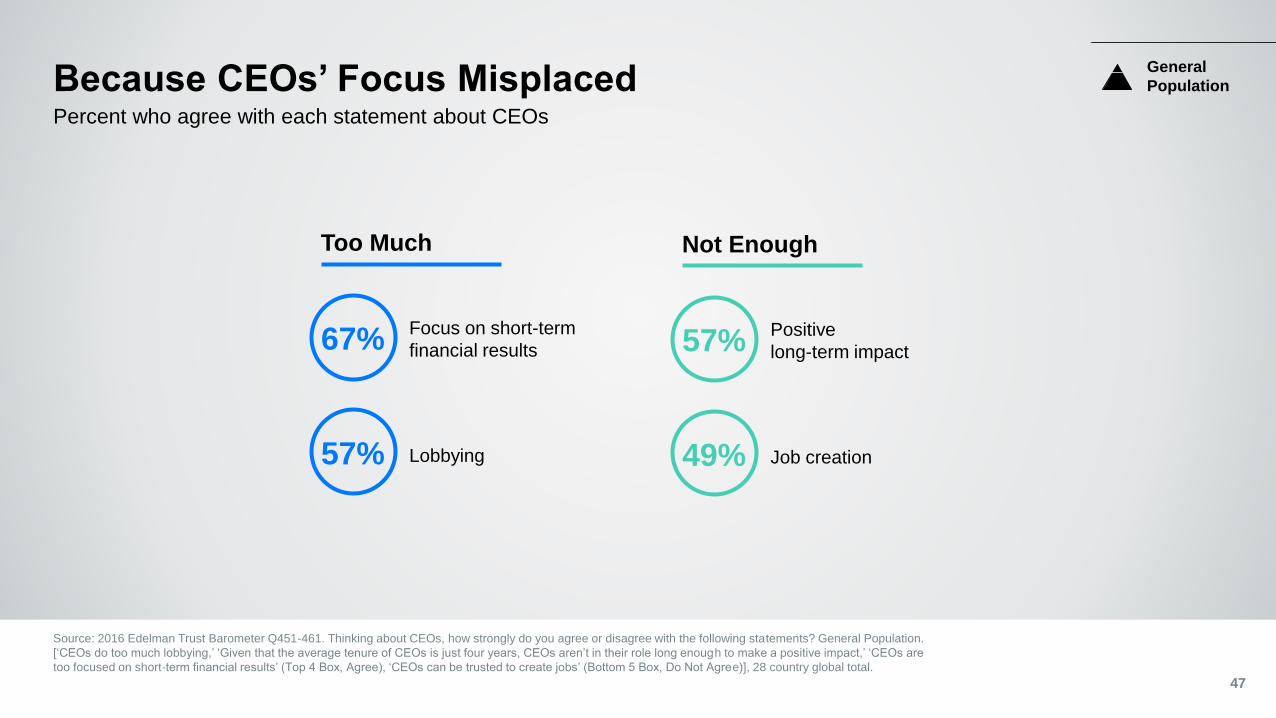
Because CEOs’ Focus Misplaced
Source: 2016 Edelman Trust Barometer Q451-461. Thinking about CEOs, how strongly do you agree or disagree with the following statements? General Population.
[‘CEOs do too much lobbying,’ ‘Given that the average tenure of CEOs is just four years, CEOs aren’t in their role long enough to make a positive impact,’ ‘CEOs are
too focused on short-term financial results’ (Top 4 Box, Agree), ‘CEOs can be trusted to create jobs’ (Bottom 5 Box, Do Not Agree)], 28 country global total.
47
Percent who agree with each statement about CEOs
Focus on short-term
financial results
Lobbying
Too Much
67%
57%
Positive
long-term impact
Job creation
Not Enough
57%
49%
General
Population
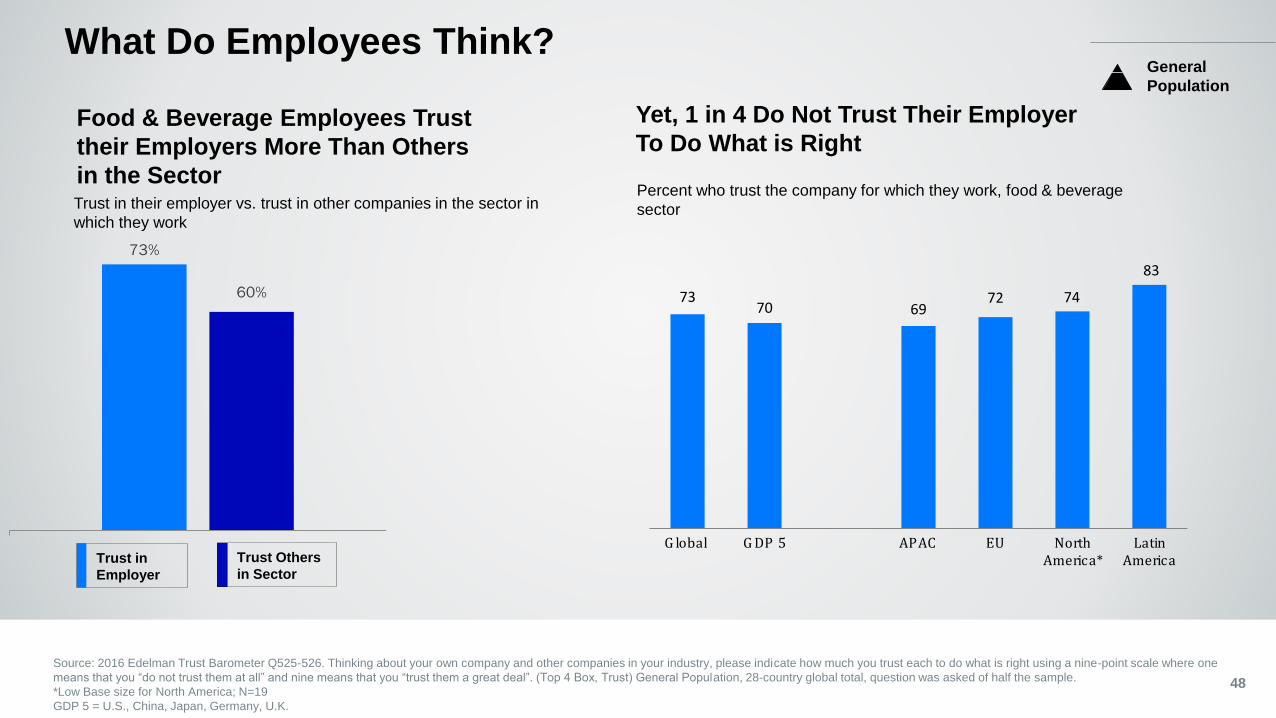
7370 69
72 74
83
G lobal G DP 5 APAC EU NorthAmerica*
LatinAmerica
Yet, 1 in 4 Do Not Trust Their Employer
To Do What is Right
Source: 2016 Edelman Trust Barometer Q525-526. Thinking about your own company and other companies in your industry, please indicate how much you trust each to do what is right using a nine-point scale where one
means that you “do not trust them at all” and nine means that you “trust them a great deal”. (Top 4 Box, Trust) General Population, 28-country global total, question was asked of half the sample.
*Low Base size for North America; N=19
GDP 5 = U.S., China, Japan, Germany, U.K.
48
Percent who trust the company for which they work, food & beverage
sector
General
Population
73%
60%
Food & Beverage Employees Trust
their Employers More Than Others
in the Sector
Trust Others
in SectorTrust in
Employer
What Do Employees Think?
Trust in their employer vs. trust in other companies in the sector in
which they work
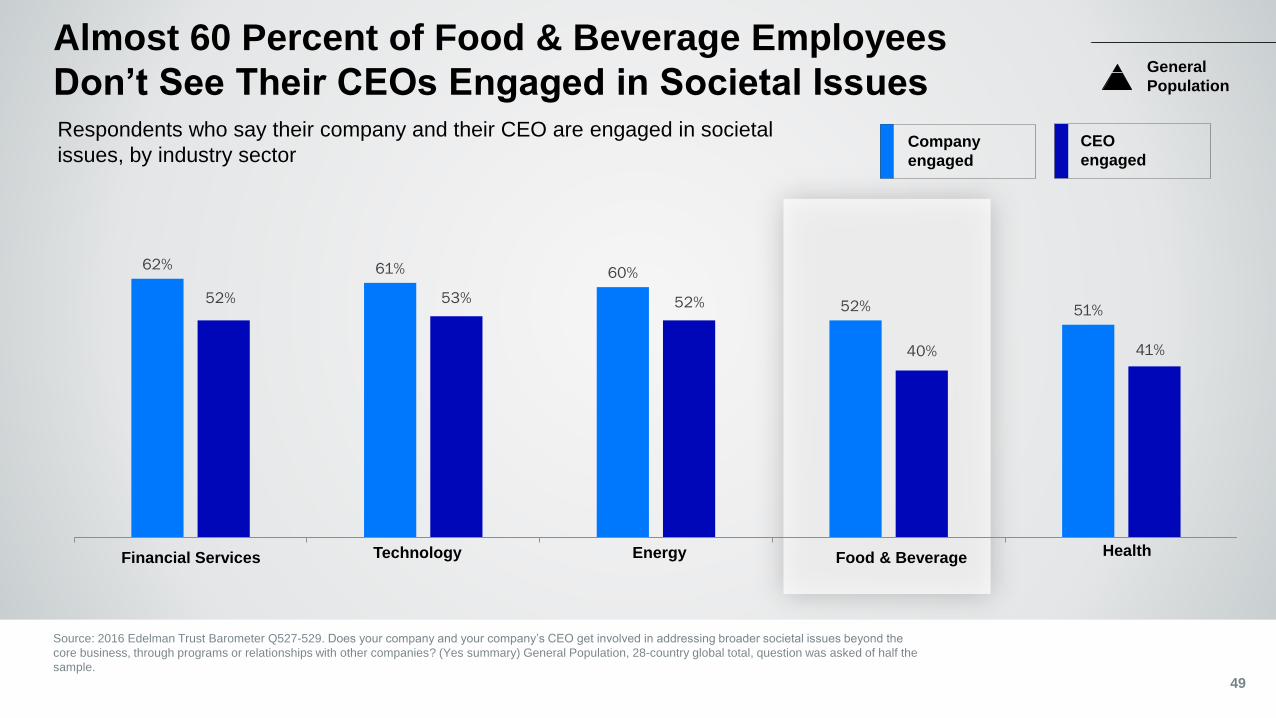
62% 61% 60%
52% 51%52% 53% 52%
40% 41%
Almost 60 Percent of Food & Beverage Employees
Don’t See Their CEOs Engaged in Societal Issues
Source: 2016 Edelman Trust Barometer Q527-529. Does your company and your company’s CEO get involved in addressing broader societal issues beyond the
core business, through programs or relationships with other companies? (Yes summary) General Population, 28-country global total, question was asked of half the
sample.
49
Respondents who say their company and their CEO are engaged in societal
issues, by industry sectorCEO
engagedCompany
engaged
Technology Food & Beverage HealthFinancial Services Energy
General
Population
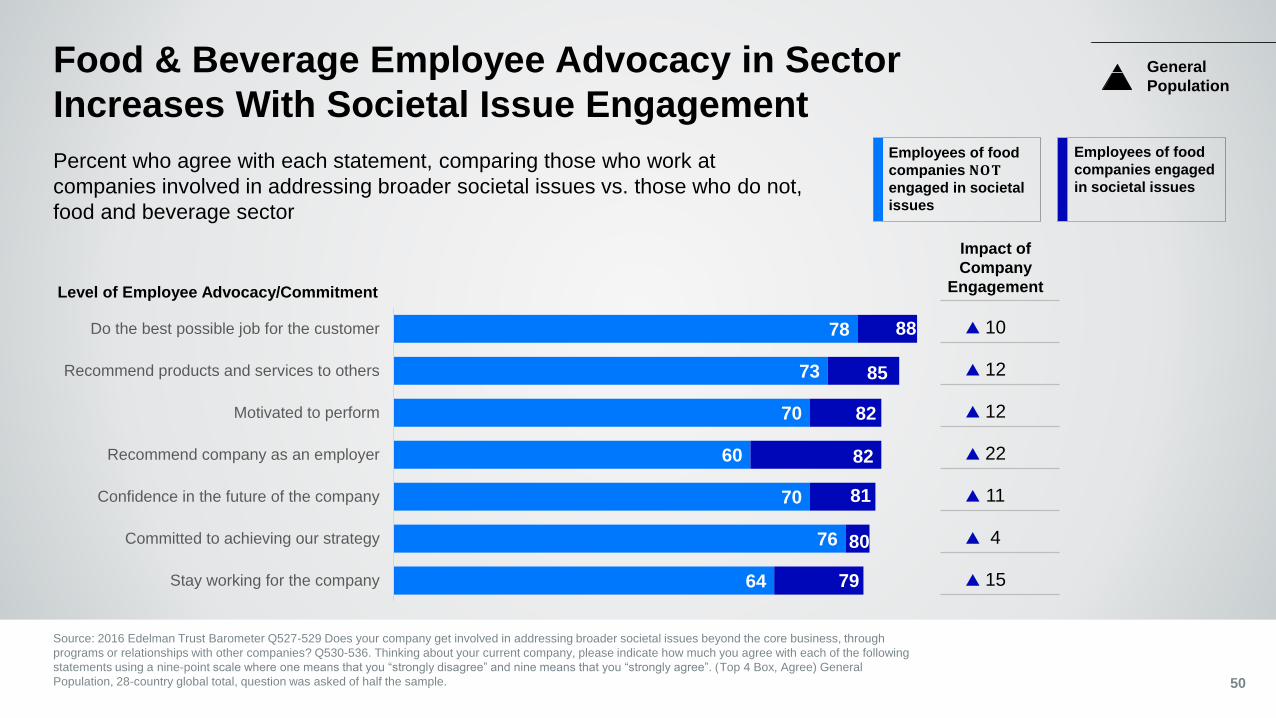
Employees of food
companies NOT engaged in societal
issues
Employees of food
companies engaged
in societal issues
Food & Beverage Employee Advocacy in Sector
Increases With Societal Issue Engagement
Source: 2016 Edelman Trust Barometer Q527-529 Does your company get involved in addressing broader societal issues beyond the core business, through
programs or relationships with other companies? Q530-536. Thinking about your current company, please indicate how much you agree with each of the following
statements using a nine-point scale where one means that you “strongly disagree” and nine means that you “strongly agree”. (Top 4 Box, Agree) General
Population, 28-country global total, question was asked of half the sample. 50
Percent who agree with each statement, comparing those who work at
companies involved in addressing broader societal issues vs. those who do not,
food and beverage sector
64
76
70
60
70
73
78
Stay working for the company
Committed to achieving our strategy
Confidence in the future of the company
Recommend company as an employer
Motivated to perform
Recommend products and services to others
Do the best possible job for the customer
Impact of
Company
Engagement
10
12
12
22
11
4
15
88
85
82
82
81
80
79
General
Population
Level of Employee Advocacy/Commitment
InternationalMarket
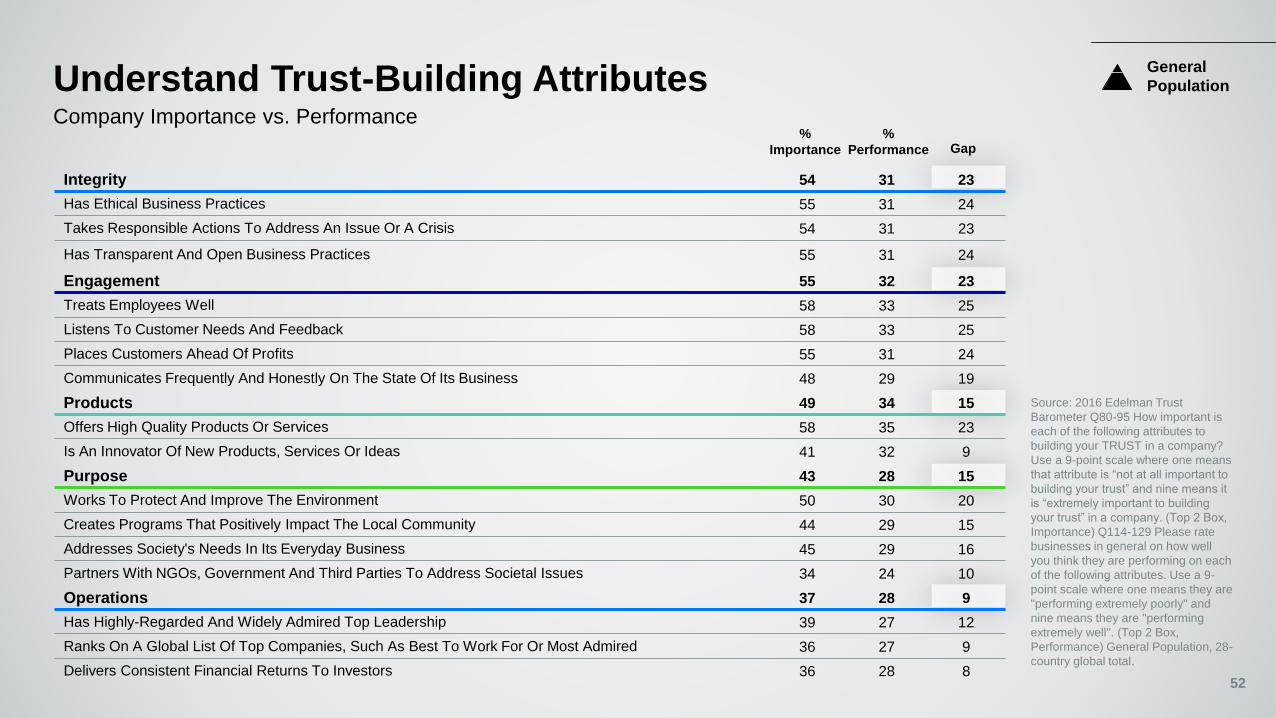
Integrity 54 31 23
Has Ethical Business Practices 55 31 24
Takes Responsible Actions To Address An Issue Or A Crisis 54 31 23
Has Transparent And Open Business Practices 55 31 24
Engagement 55 32 23
Treats Employees Well 58 33 25
Listens To Customer Needs And Feedback 58 33 25
Places Customers Ahead Of Profits 55 31 24
Communicates Frequently And Honestly On The State Of Its Business 48 29 19
Products 49 34 15
Offers High Quality Products Or Services 58 35 23
Is An Innovator Of New Products, Services Or Ideas 41 32 9
Purpose 43 28 15
Works To Protect And Improve The Environment 50 30 20
Creates Programs That Positively Impact The Local Community 44 29 15
Addresses Society's Needs In Its Everyday Business 45 29 16
Partners With NGOs, Government And Third Parties To Address Societal Issues 34 24 10
Operations 37 28 9
Has Highly-Regarded And Widely Admired Top Leadership 39 27 12
Ranks On A Global List Of Top Companies, Such As Best To Work For Or Most Admired 36 27 9
Delivers Consistent Financial Returns To Investors 36 28 8
Understand Trust-Building AttributesCompany Importance vs. Performance
%
Performance
%
Importance Gap
General
Population
52
Source: 2016 Edelman Trust
Barometer Q80-95 How important is
each of the following attributes to
building your TRUST in a company?
Use a 9-point scale where one means
that attribute is “not at all important to
building your trust” and nine means it
is “extremely important to building
your trust” in a company. (Top 2 Box,
Importance) Q114-129 Please rate
businesses in general on how well
you think they are performing on each
of the following attributes. Use a 9-
point scale where one means they are
"performing extremely poorly" and
nine means they are "performing
extremely well". (Top 2 Box,
Performance) General Population, 28-
country global total.
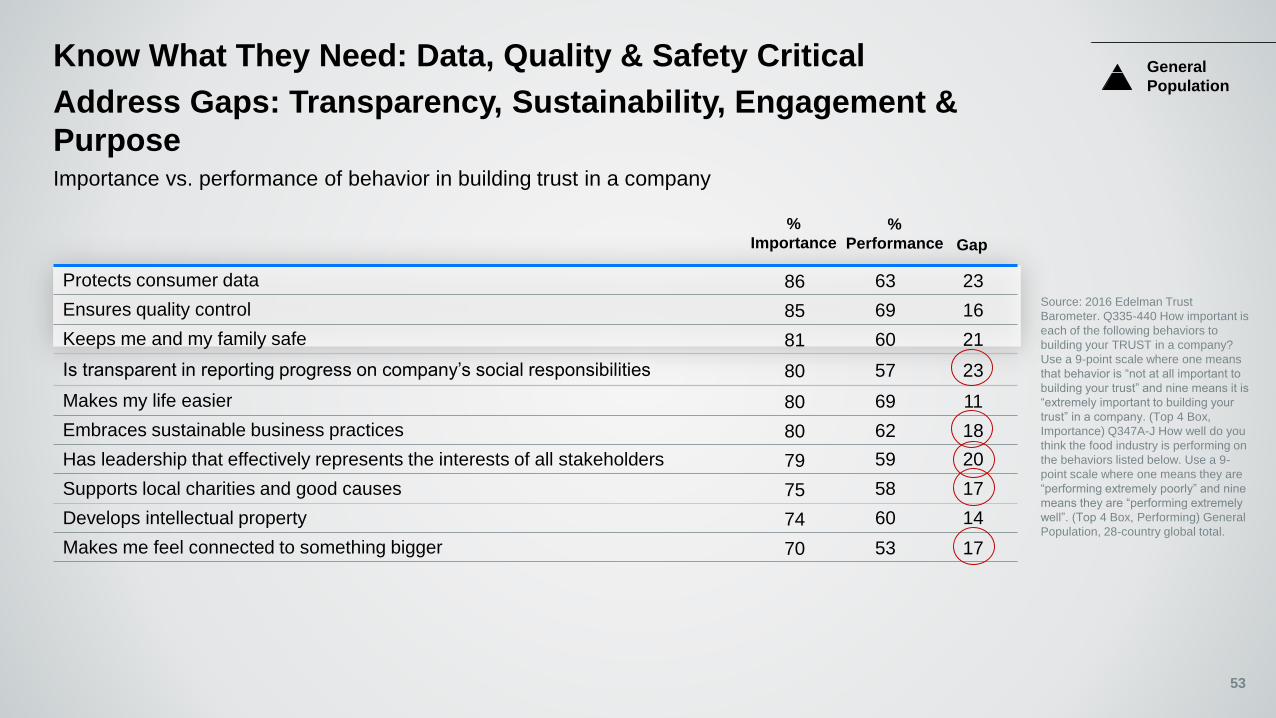
Know What They Need: Data, Quality & Safety Critical
Address Gaps: Transparency, Sustainability, Engagement &
Purpose
Protects consumer data 86 63 23
Ensures quality control 85 69 16
Keeps me and my family safe 81 60 21
Is transparent in reporting progress on company’s social responsibilities 80 57 23
Makes my life easier 80 69 11
Embraces sustainable business practices 80 62 18
Has leadership that effectively represents the interests of all stakeholders 79 59 20
Supports local charities and good causes 75 58 17
Develops intellectual property 74 60 14
Makes me feel connected to something bigger 70 53 17
Importance vs. performance of behavior in building trust in a company
%
Performance
%
Importance Gap
General
Population
53
Source: 2016 Edelman Trust
Barometer. Q335-440 How important is
each of the following behaviors to
building your TRUST in a company?
Use a 9-point scale where one means
that behavior is “not at all important to
building your trust” and nine means it is
“extremely important to building your
trust” in a company. (Top 4 Box,
Importance) Q347A-J How well do you
think the food industry is performing on
the behaviors listed below. Use a 9-
point scale where one means they are
“performing extremely poorly” and nine
means they are “performing extremely
well”. (Top 4 Box, Performing) General
Population, 28-country global total.
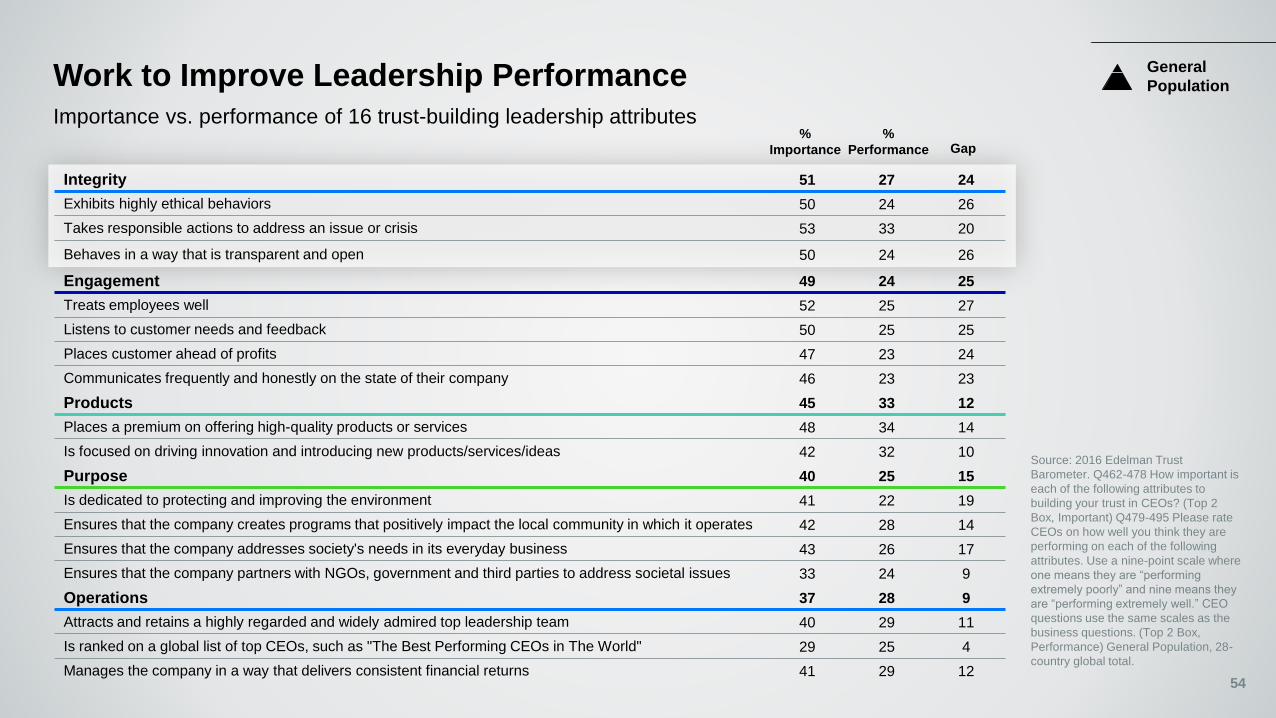
Integrity 51 27 24
Exhibits highly ethical behaviors 50 24 26
Takes responsible actions to address an issue or crisis 53 33 20
Behaves in a way that is transparent and open 50 24 26
Engagement 49 24 25
Treats employees well 52 25 27
Listens to customer needs and feedback 50 25 25
Places customer ahead of profits 47 23 24
Communicates frequently and honestly on the state of their company 46 23 23
Products 45 33 12
Places a premium on offering high-quality products or services 48 34 14
Is focused on driving innovation and introducing new products/services/ideas 42 32 10
Purpose 40 25 15
Is dedicated to protecting and improving the environment 41 22 19
Ensures that the company creates programs that positively impact the local community in which it operates 42 28 14
Ensures that the company addresses society's needs in its everyday business 43 26 17
Ensures that the company partners with NGOs, government and third parties to address societal issues 33 24 9
Operations 37 28 9
Attracts and retains a highly regarded and widely admired top leadership team 40 29 11
Is ranked on a global list of top CEOs, such as "The Best Performing CEOs in The World" 29 25 4
Manages the company in a way that delivers consistent financial returns 41 29 12
Work to Improve Leadership Performance
Importance vs. performance of 16 trust-building leadership attributes%
Performance
%
Importance Gap
General
Population
54
Source: 2016 Edelman Trust
Barometer. Q462-478 How important is
each of the following attributes to
building your trust in CEOs? (Top 2
Box, Important) Q479-495 Please rate
CEOs on how well you think they are
performing on each of the following
attributes. Use a nine-point scale where
one means they are “performing
extremely poorly” and nine means they
are “performing extremely well.” CEO
questions use the same scales as the
business questions. (Top 2 Box,
Performance) General Population, 28-
country global total.
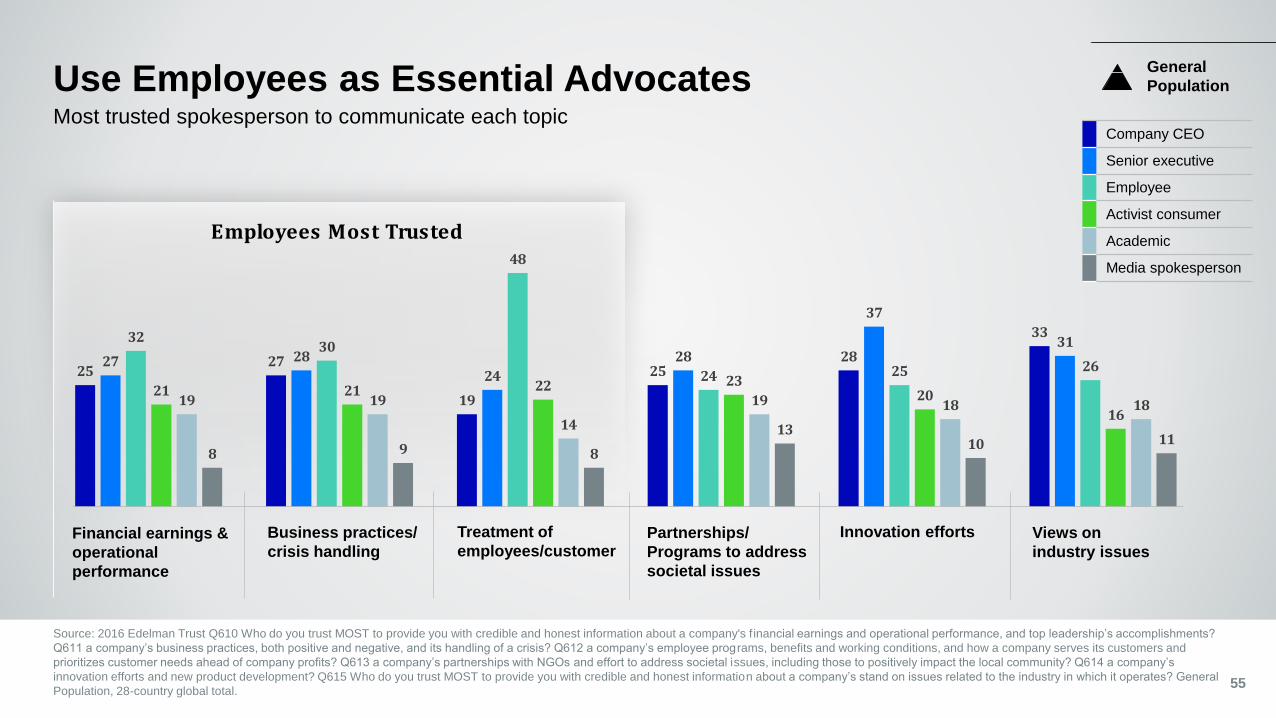
2527
19
2528
33
27 28
24
28
37
313230
48
24 25 26
21 21 22 2320
1619 19
14
19 18 18
8 9 8
1310 11
Use Employees as Essential Advocates
Source: 2016 Edelman Trust Q610 Who do you trust MOST to provide you with credible and honest information about a company's f inancial earnings and operational performance, and top leadership’s accomplishments?
Q611 a company’s business practices, both positive and negative, and its handling of a crisis? Q612 a company’s employee programs, benefits and working conditions, and how a company serves its customers and
prioritizes customer needs ahead of company profits? Q613 a company’s partnerships with NGOs and effort to address societal issues, including those to positively impact the local community? Q614 a company’s
innovation efforts and new product development? Q615 Who do you trust MOST to provide you with credible and honest information about a company’s stand on issues related to the industry in which it operates? General
Population, 28-country global total.55
Most trusted spokesperson to communicate each topic
Innovation effortsFinancial earnings &
operational
performance
Business practices/
crisis handling
Treatment of
employees/customerPartnerships/
Programs to address
societal issues
Views on
industry issues
Employees Most Trusted
General
Population
Company CEO
Senior executive
Employee
Activist consumer
Academic
Media spokesperson
56
General
Population
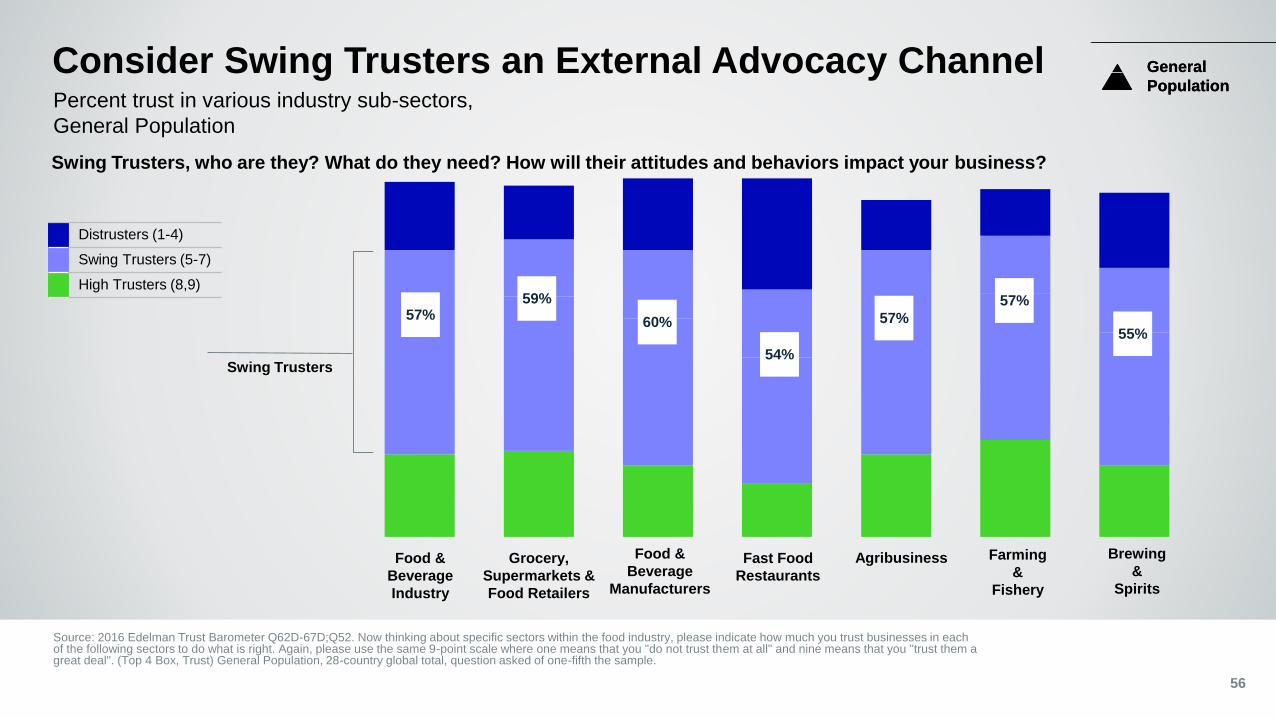
Source: 2016 Edelman Trust Barometer Q62D-67D;Q52. Now thinking about specific sectors within the food industry, please indicate how much you trust businesses in each of the following sectors to do what is right. Again, please use the same 9-point scale where one means that you "do not trust them at all" and nine means that you "trust them a great deal". (Top 4 Box, Trust) General Population, 28-country global total, question asked of one-fifth the sample.
General
Population
Swing Trusters
57%59%
60%
54%
57%
57%
Food &
Beverage
Industry
Grocery,
Supermarkets &
Food Retailers
Food &
Beverage
Manufacturers
Fast Food
Restaurants
Agribusiness Farming
&
Fishery
Brewing
&
Spirits
55%
Distrusters (1-4)
Swing Trusters (5-7)
High Trusters (8,9)
Percent trust in various industry sub-sectors,
General Population
Consider Swing Trusters an External Advocacy Channel
Swing Trusters, who are they? What do they need? How will their attitudes and behaviors impact your business?
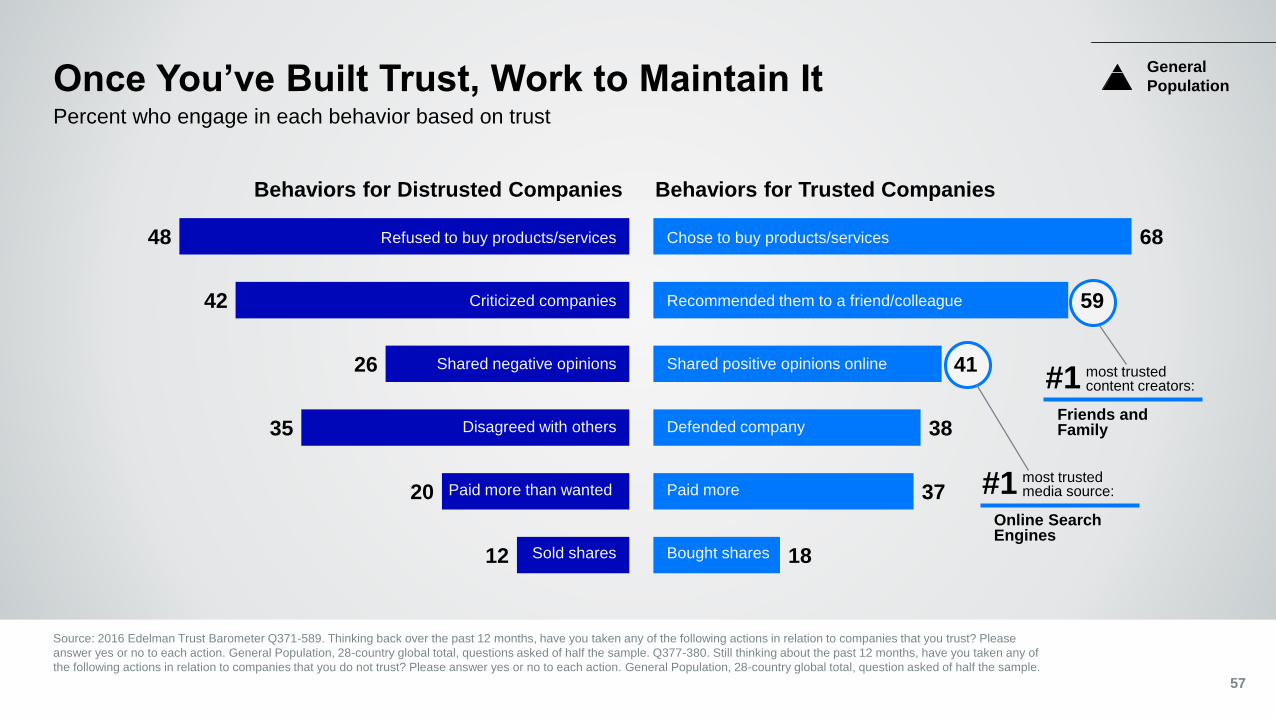
48
42
26
35
20
12
Once You’ve Built Trust, Work to Maintain It
57
Percent who engage in each behavior based on trust
68
59
41
38
37
18
Behaviors for Distrusted Companies Behaviors for Trusted Companies
Refused to buy products/services
Criticized companies
Shared negative opinions
Disagreed with others
Paid more than wanted
Sold shares
Chose to buy products/services
Recommended them to a friend/colleague
Shared positive opinions online
Defended company
Paid more
Bought shares
General
Population
Source: 2016 Edelman Trust Barometer Q371-589. Thinking back over the past 12 months, have you taken any of the following actions in relation to companies that you trust? Please
answer yes or no to each action. General Population, 28-country global total, questions asked of half the sample. Q377-380. Still thinking about the past 12 months, have you taken any of
the following actions in relation to companies that you do not trust? Please answer yes or no to each action. General Population, 28-country global total, question asked of half the sample.
most trusted content creators: #1
Friends and Family
most trusted media source: #1
Online Search Engines