Embed Size (px)
Citation preview

Theory of SettlementsOrigin and growth of settlements - A comparative study
The Effect of Social and Economic Development on Air Pollution in Indian Cities
Matthew J. Holian /Environment and urbanization Asia
Presented,Ahammed Aflah, Abhishek Bittu

- ABSTRACT- INTRODUCTION - LITERATURE
REVIEW - DATA &
METHODOLOGY- STUDY- CONCLUSION

ABSTRACT• This article presents new estimates of air
pollution production functions using data from Indian cities. This estimates help to test various hypothesis concerning the effect of :
Income Literacy Population
On four measures of air pollution : Sulphur dioxide
Nitrogen dioxide
And two measures of particulate matter
Relationship between social and economic development and pollution variesacross pollution types and developmentindicators
• Income and particulate matter
• Income and NO2 emissions

INTRODUCTION• The goal of this study is to understand the effects
of pollution levels among medium-sized and large Indian cities. Understanding
— How key variables relate to pollution. — How to measure these key variables.Contributes to the work of scholars in a variety of disciplines and of policymakers seeking to improve urban quality of life.-Economic growth is fuelled by urbanization and can lead to environmental degradation. Emissions from factories are a clear example.The relationship between social and economic development and pollution.
Pollution levels at first increase and eventually decrease with rising literacy.

LITERATURE REVIEWThree closely related economics literatures studies.
‘Green cities’- describes work that attempts to rank cities according to their level of pollution as well as to explain the determinants of varying pollution and their consequences.
-The first attempts to rank cities according to their level of pollution. -The hypothesis that pollution first rises and then falls with development.-Literature that relates to the first two, but that is specifically related to pollution in Indian cities.
United States (Glaeser and Kahn, 2010) China (Zheng et al., 2011)The present study most closely
relates to two recent papers.
Managi and Jena (2008) - regress an environmental efficiency index on gross state product and other variables and find that it has declined more in high-income states in India.

LITERATURE REVIEWGreenstone and Hanna (2011) also move beyond reduced form modelling and measure the causal impact of pollution regulations on infant mortality rates in IndiaThis study estimates reduced form air pollution production functions, it uses different, arguably superior income measures.Gupta and Kumar (2005) document trends in particulate matter in Delhi, Mumbai, Kolkata and Chennai and find that particulate matter levels have generally fallen over the period 1991–2003.Sridhar and kumar (2013)show particulate matter level falling by 17 percent and sulphur di oxide level falling by 37.6 percent from 1990 to 2007 but no change in nitrogen di oxide.Gurjar et al. (2007) present pollution data from 18 world cities with population over 10 million, including three from India.

Data and MethodologyMethodological approach to estimating air pollution production functions .
AVGPOLLUTION = b + b lnPOP + b lnRAIN + b PCTMANUF i 0 1 i 2 i 3 i
2 i + b4SOUTHi + b5DEVi + b6DEVi + u
AVGPOLLUTION : dependent variable and refers to one of the four measures of pollution for cityI & b’s : coefficients to be estimated u : an error term with the usual properties.This model is quite similar to one estimated by Zheng et al. (2010) using data from Chinese citiesFour measures of pollution & three measures of socioeconomic developmentThe third measure used to proxy for DEV is a measure of social development.The variable SOUTH is a dummy variable indicating whether or not city i is in the south
Data and Methodology Three sources to represent socio economic development and the income is the indicator for economic development.- The four air pollution measures were taken from the Environmental Data Bank of India’s Central Pollution Control Board (CPCB). SPM, RPM
- The income data is monthly per capita consumption expenditure (MPCE) is taken from NSSO(National sample survey organisation).- Chaudhuri and Gupta (2009) present district-level estimates of MPCE for urban and rural households using data from a recent NSSO survey.
Agricu
lture
Constructi
on
Railway
& Transp
ort
Manufac
turing-1
1
3
5
Avg SO2Avg NO2AvgGRSPMAvgGSPM
Correlation between category & pollution

Conclusion • Income and NO2
emissions
Air pollution production that have controlled for multiple factors .
• Income and SO2 emissions
Results do not indicate a Kuznets curve relationship between income and air pollution at the sub-national level for India.Kuznets curve-type relationshipbetween literacy and air pollution
Provide an estimate of themagnitude by which air pollution levels increasewith city size
Air
pollu
tion
Literacy rateDeveloping new technological options for reducing SO2 and NO2 may be needed
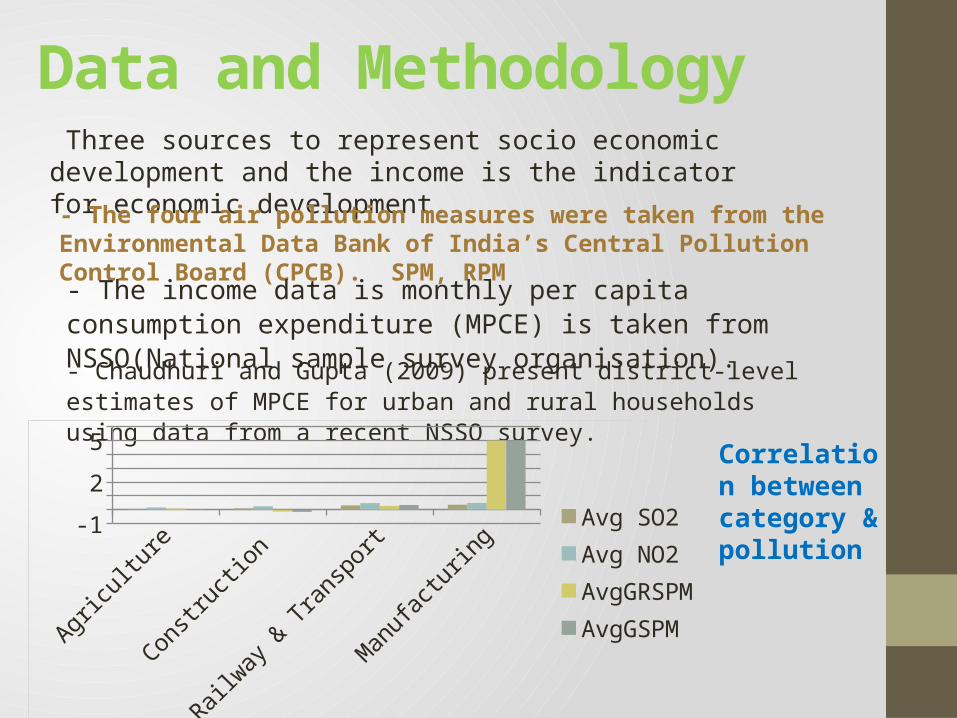
Average Pollution by CityDaily air pollution data at the monitoring station level were downloaded from the CPCB’s online Environmental Data BankMerged the pollution and town directory data to the literacy, MPCE and DDP data
Kozhikk
ode
Chennai
Banga
lore
Guwahati
Amritsar Kota
Allahab
adNoida
050
100150200250300350400450500
Avg SO2Avg NO2Avg GRSPMAvg SPM

Conclusion - Urbanization can also lead to environmental improvements.
- Both our literacy rate and population measures are from the year 2001. - The relation between Economic growth and Environment is vey complex!
- Giving space and information for further studies
THANK YOU…