Embed Size (px)
Citation preview

Joshua Apte, PhD [email protected] 21 November 2014
Air Pollution in Indian Cities Current Status and Prospectsfor a Cleaner Future!
!
Assistant Professor, University of Texas at Austin Fellow, Lawrence Berkeley National Laboratory
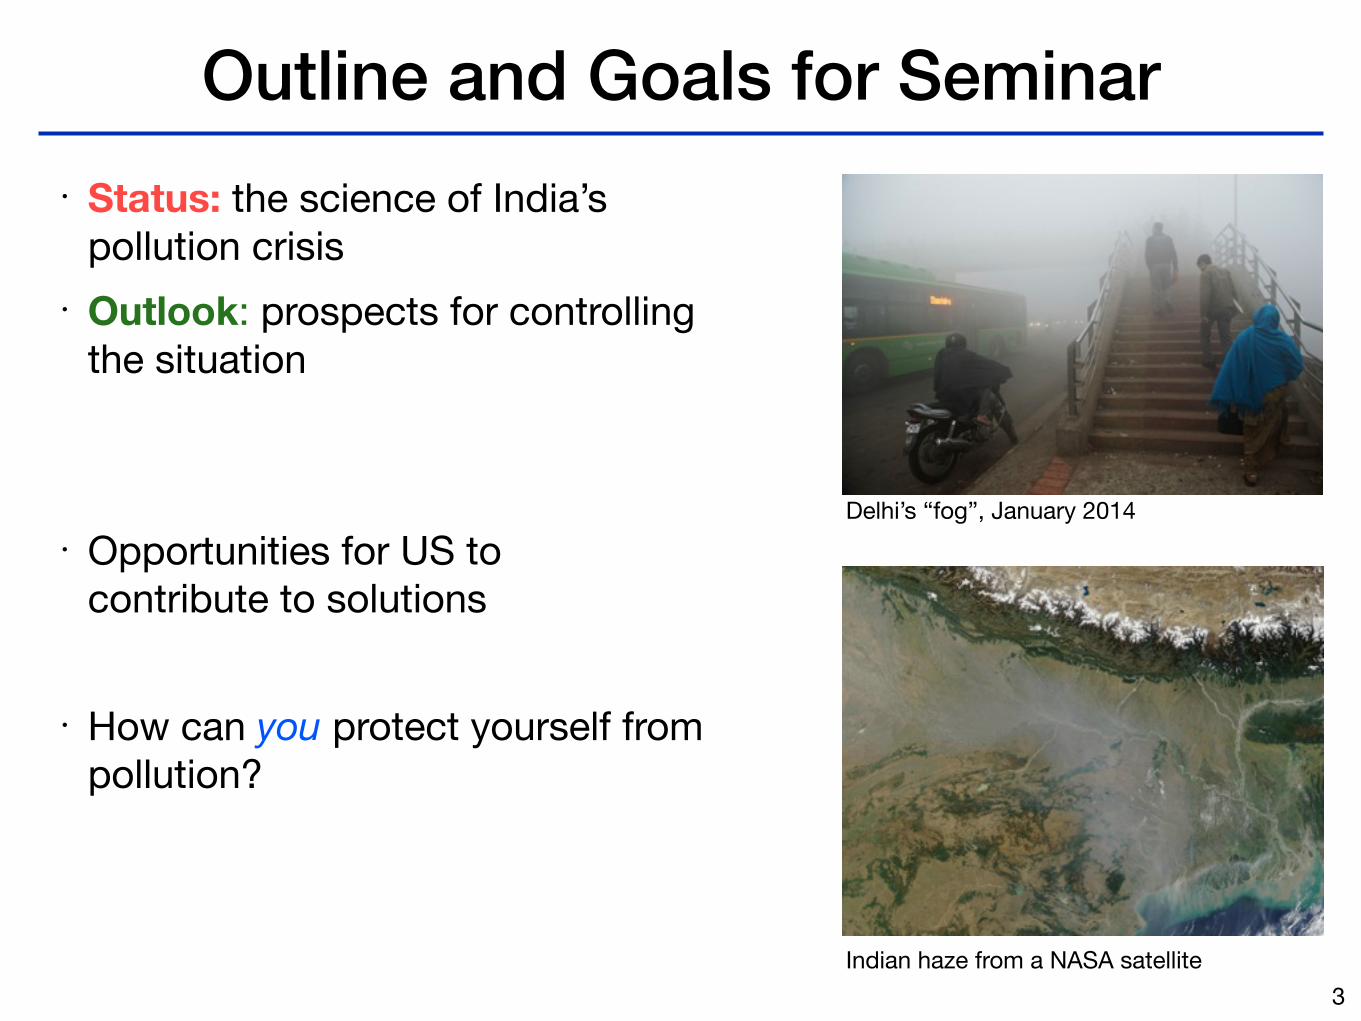
Outline and Goals for Seminar• Status: the science of India’s
pollution crisis• Outlook: prospects for controlling
the situation!
!• Opportunities for US to
contribute to solutions!
• How can you protect yourself from pollution?
3Indian haze from a NASA satellite
Delhi’s “fog”, January 2014
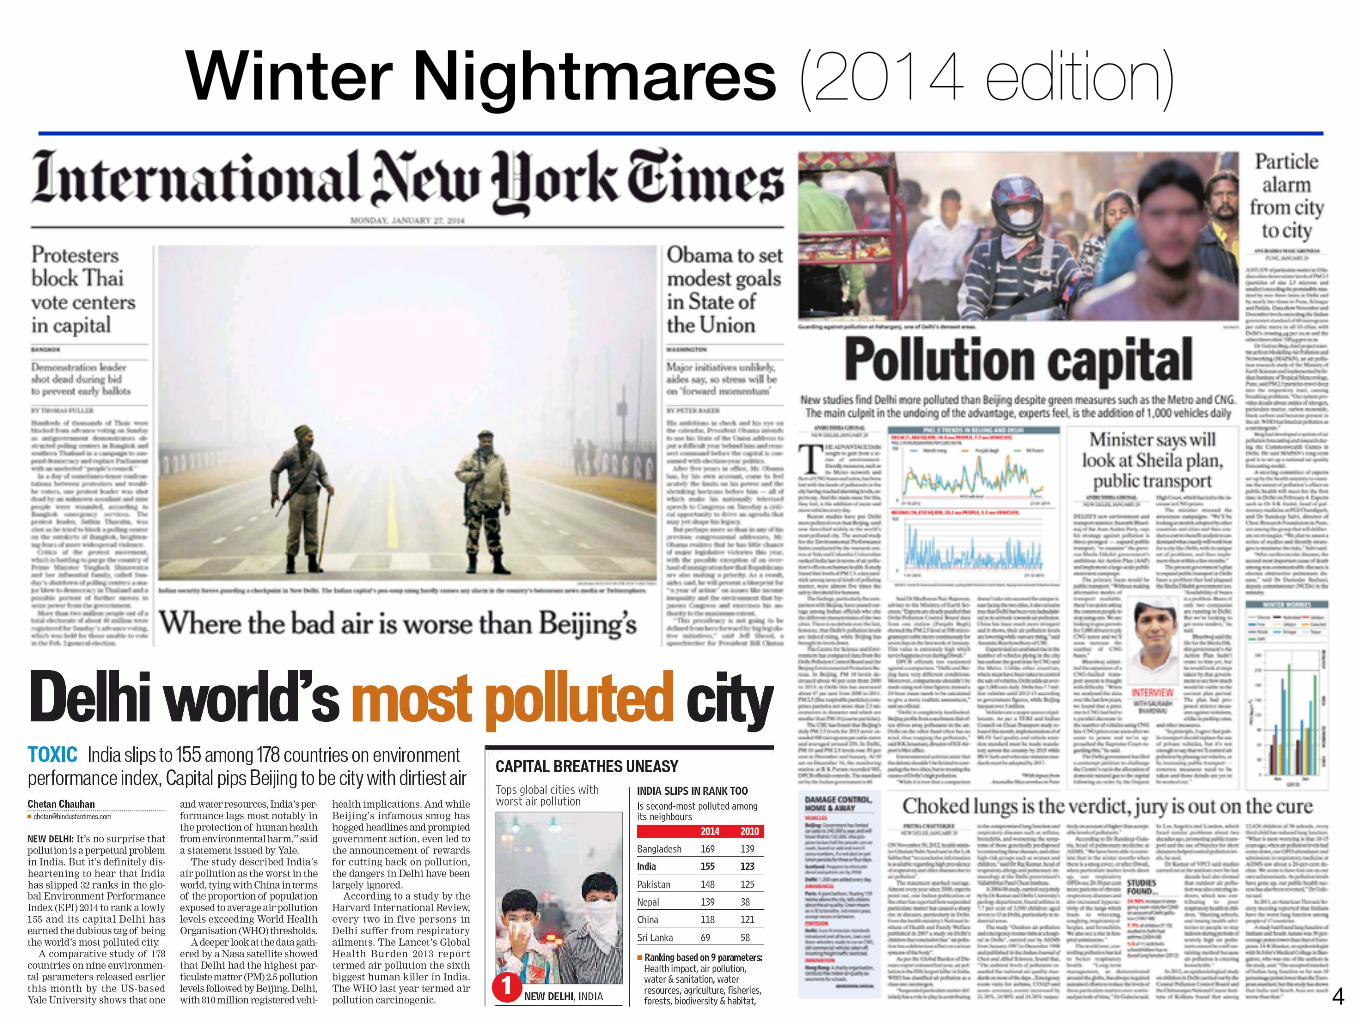
Winter Nightmares (2014 edition)
4
2/5/2014 Hindustan Times e-Paper
http://paper.hindustantimes.com/epaper/viewer.aspx 1/2
Air pollution is a global health issue
5
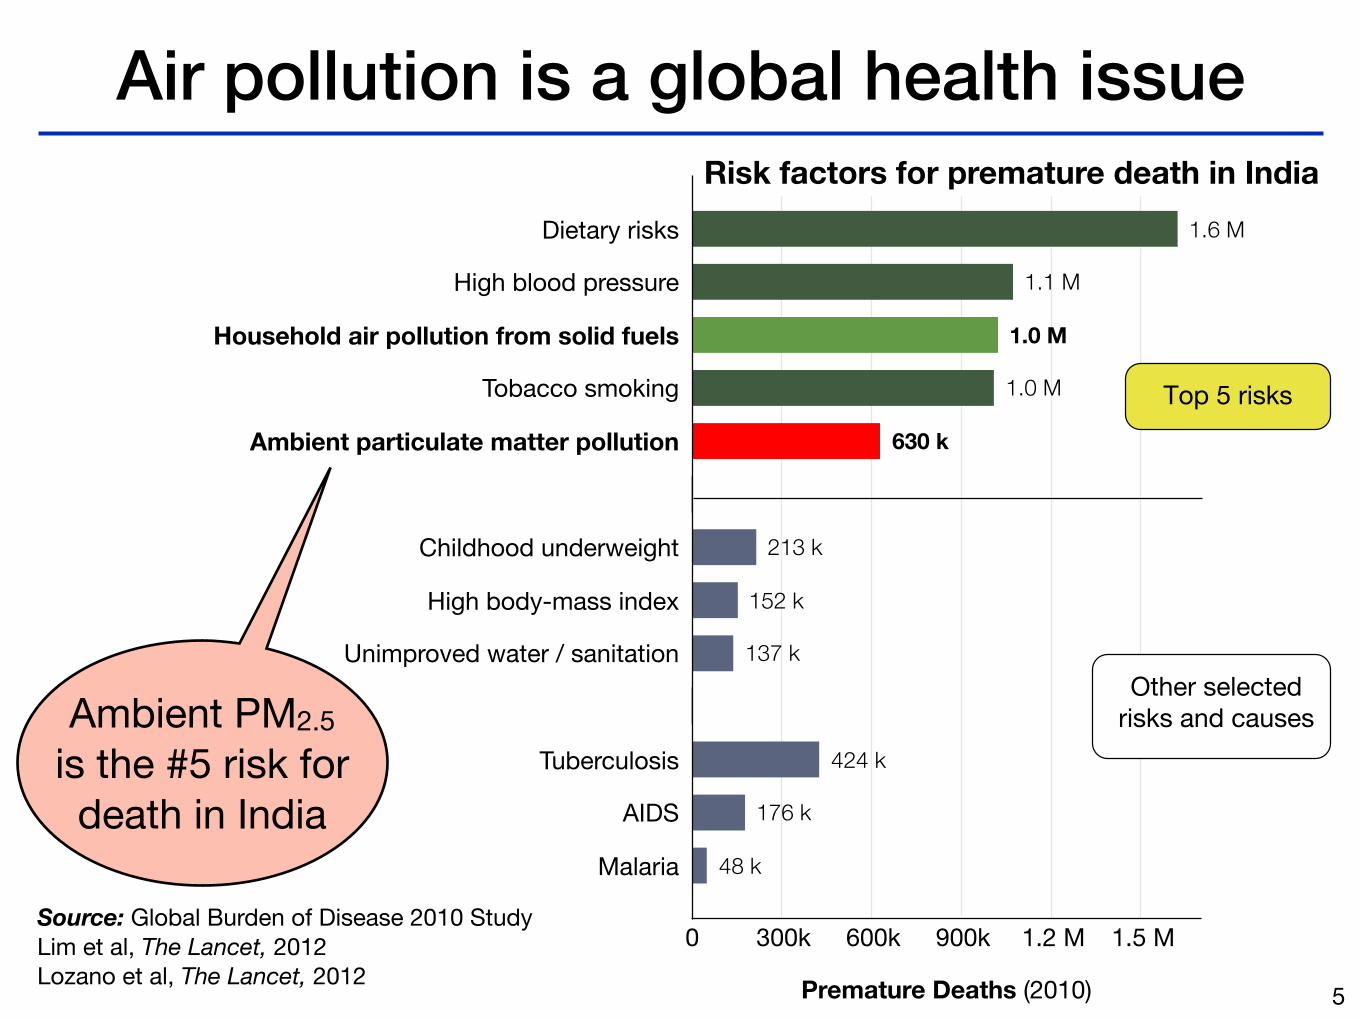
Source: Global Burden of Disease 2010 StudyLim et al, The Lancet, 2012Lozano et al, The Lancet, 2012
0 300k 600k 900k 1.2 M 1.5 M
Malaria
AIDS
Tuberculosis
Unimproved water / sanitation
High body-mass index
Childhood underweight
Ambient particulate matter pollution
Tobacco smoking
Household air pollution from solid fuels
High blood pressure
Dietary risks
Premature Deaths (2010)
1.6 M
1.1 M
1.0 M
1.0 M
630 k
213 k
152 k
137 k
424 k
176 k
48 k
Other selectedrisks and causes
Top 5 risks
Ambient PM2.5 is the #5 risk for death in India
Risk factors for premature death in India
Particulate matter pollution
6
3
10
30
�����
PM2.5�N�T-3
Modeled PM2.5, year 2005Satellite AOD + CTM, 10 km resolution
log scale
3
10
30
�����
PM2.5�N�T-3
Modeled PM2.5, year 2005Satellite AOD + CTM, 10 km resolution
log scale
Sustainability engineering challenge: reduce PM by 10×
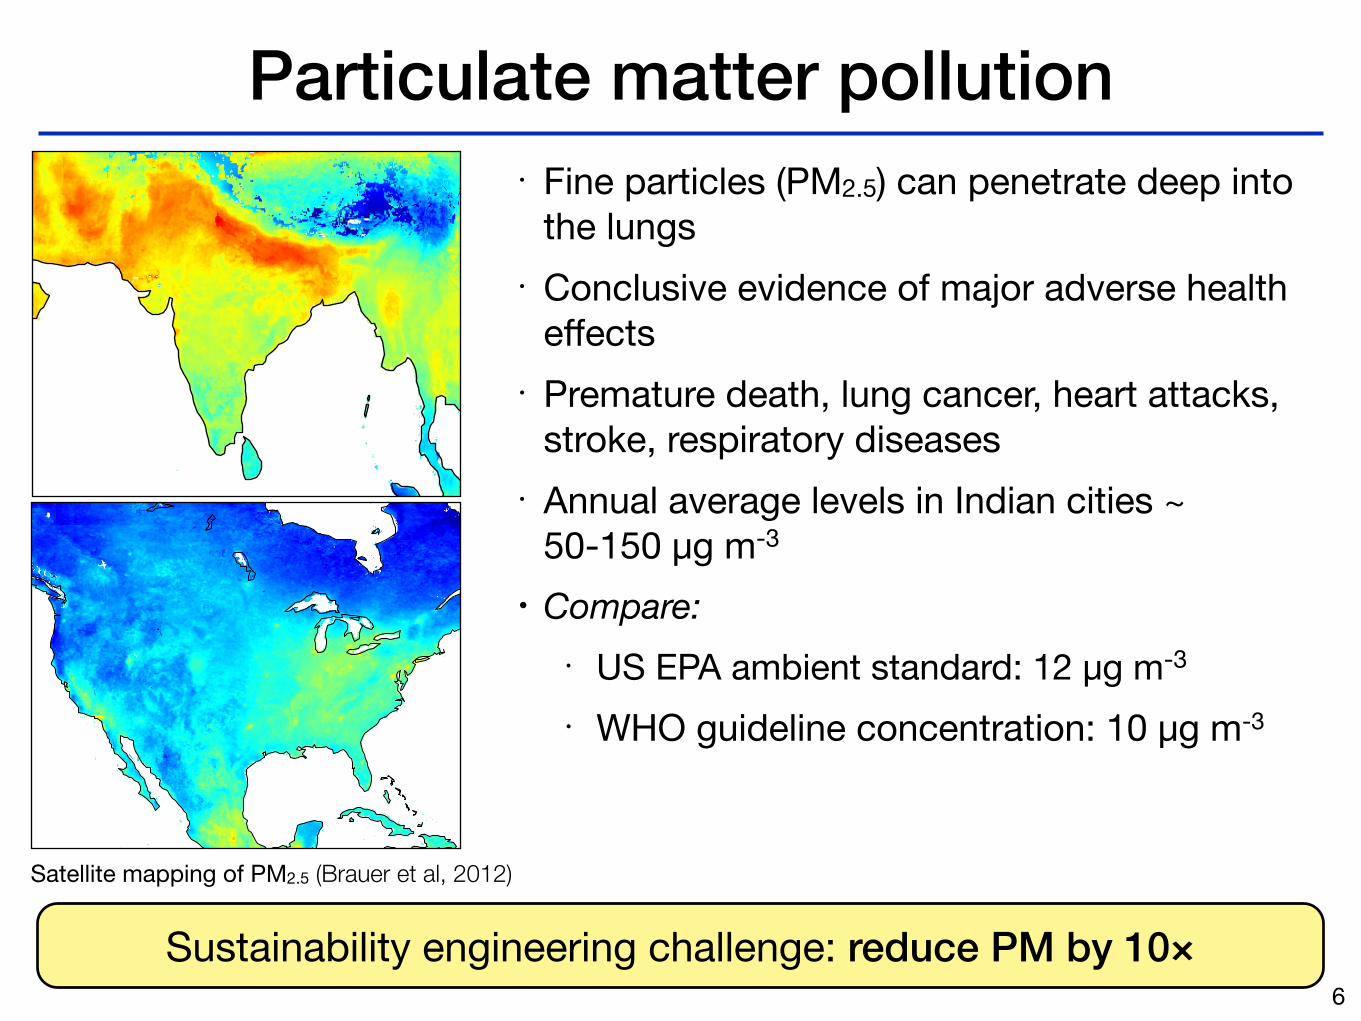
• Fine particles (PM2.5) can penetrate deep into the lungs
• Conclusive evidence of major adverse health effects
• Premature death, lung cancer, heart attacks, stroke, respiratory diseases
• Annual average levels in Indian cities ~ 50-150 µg m-3
• Compare: • US EPA ambient standard: 12 µg m-3• WHO guideline concentration: 10 µg m-3
Satellite mapping of PM2.5 (Brauer et al, 2012)
PM2.5 in India: sources & science
7
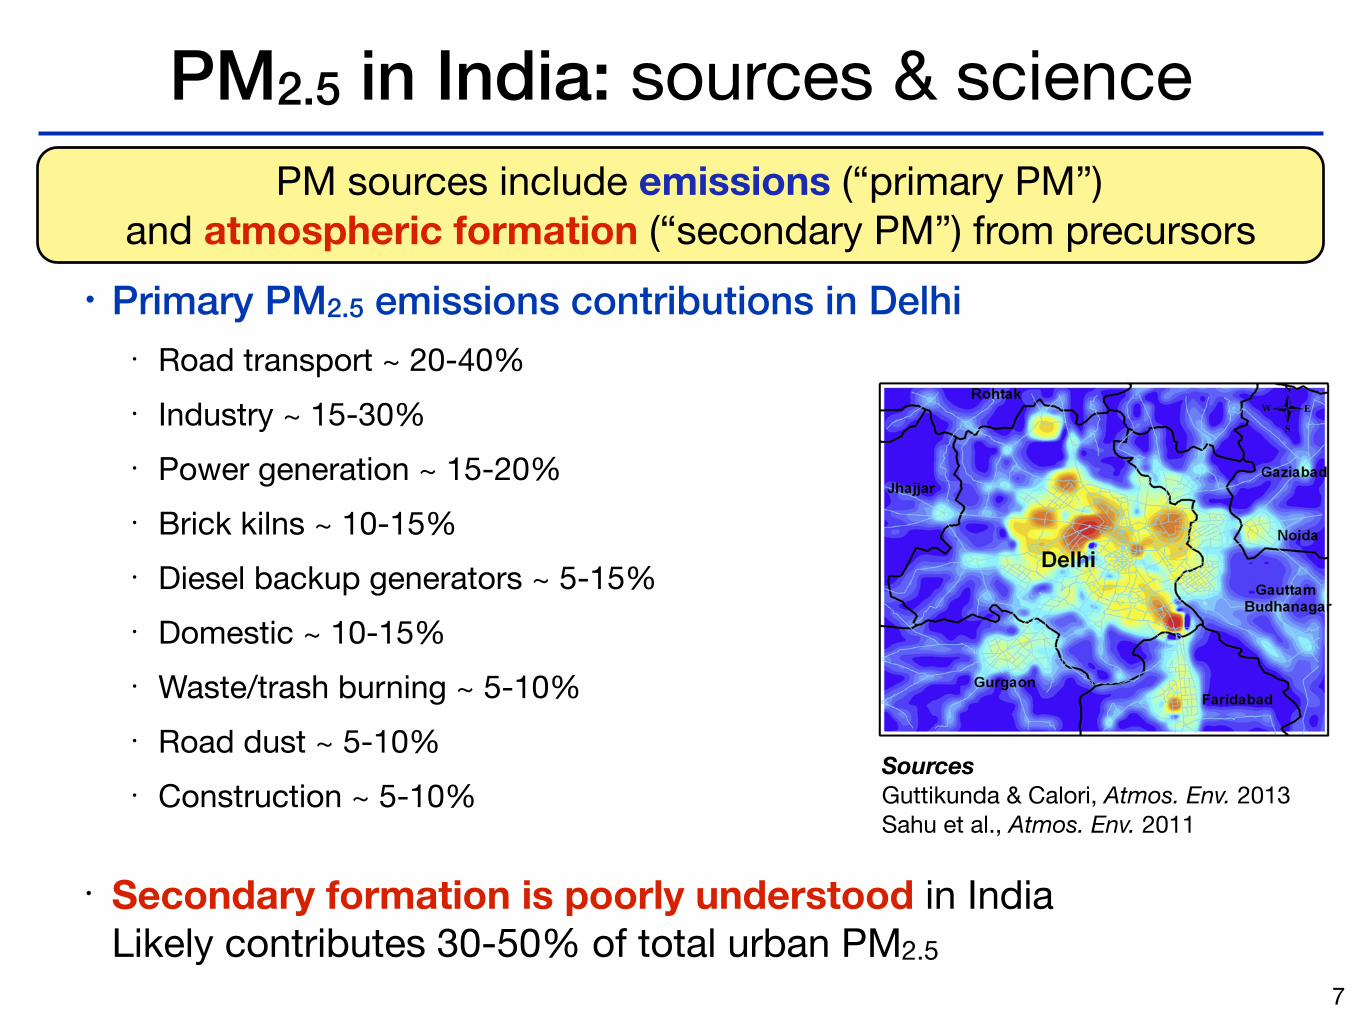
PM sources include emissions (“primary PM”) and atmospheric formation (“secondary PM”) from precursors
• Primary PM2.5 emissions contributions in Delhi • Road transport ~ 20-40%• Industry ~ 15-30%• Power generation ~ 15-20%• Brick kilns ~ 10-15%• Diesel backup generators ~ 5-15%• Domestic ~ 10-15%• Waste/trash burning ~ 5-10%• Road dust ~ 5-10%• Construction ~ 5-10%
• Secondary formation is poorly understood in India Likely contributes 30-50% of total urban PM2.5
Sources Guttikunda & Calori, Atmos. Env. 2013Sahu et al., Atmos. Env. 2011
transform large and irregularly shaped emission data to uniformdata using GIS tools. For the gridded data extraction, prepared geo-referenced grid cells of 1.67 km! 1.67 km resolution covering NCR-Delhi using GIS tool is superimposed over the spatially distributedemission from different sectors as well as from LPSs. The emissionvalue for the gridded cells based on the corresponding contributionfrom different sources lying inside the grid cells is calculated in GIS.The emission values from different sources are also organized as setof thematic layers so that they can be analyzed separately.
6. Results
6.1. PM2.5 emission from all anthropogenic sources except for roaddust
The spatial distribution of PM2.5 emission from all sourcesexcept the windblown dust from paved and unpaved road isdepicted in Fig. 7a. The total estimated emission of PM2.5 from these
sources together is calculated to be around 68.06 Gg yr"1 in 2010where contribution from power, vehicular sources, industrial andresidential source are estimated to be 2.87 Gg yr"1, 30.25 Gg yr"1,16.29 Gg yr"1 and 18.65 Gg yr"1 respectively. The relative contri-bution of these 4 sectors is shown in Fig. 7b.
It is observed from Fig. 7a that high PM2.5 emissions of the orderof 200e1000 ton yr"1 are found over eastern, central and some ofthe south-eastern part of Delhi. It has been found that CentralDelhi region (1100e2400 ton yr"1) is one of the most pollutedregions where industrial source contributes 250e900 ton yr"1
followed by transport (100e120 ton yr"1) and residential sector(60e250 ton yr"1). Eastern Delhi region (300e500 ton yr"1) iscontributed by industrial emission of the order of150e200 ton yr"1 followed by transport (90e100 ton yr"1) andresidential sector (50e60 ton yr"1). Southeastern region(500e2000 ton yr"1) is dominated by thermal power emission(order of 1930 ton yr"1) followed by industrial emission(200e250 ton yr"1) and transport (80e90 ton yr"1). However,
Fig. 7. PM2.5 Emission from different sources over NCRD. (a) Geographical distribution of PM2.5 emissions from all sources in NCRD (except for road dust). (b) Relative contributionof PM2.5 emission from different sectors. (c) Geographical distribution of PM2.5 emissions from transport sector. (d) Geographical distribution of PM2.5 emissions from residentialsector. (e) Geographical distribution of PM2.5 emissions from industrial sector.
S.K. Sahu et al. / Atmospheric Environment 45 (2011) 6180e61906186
What is a safe level?
11
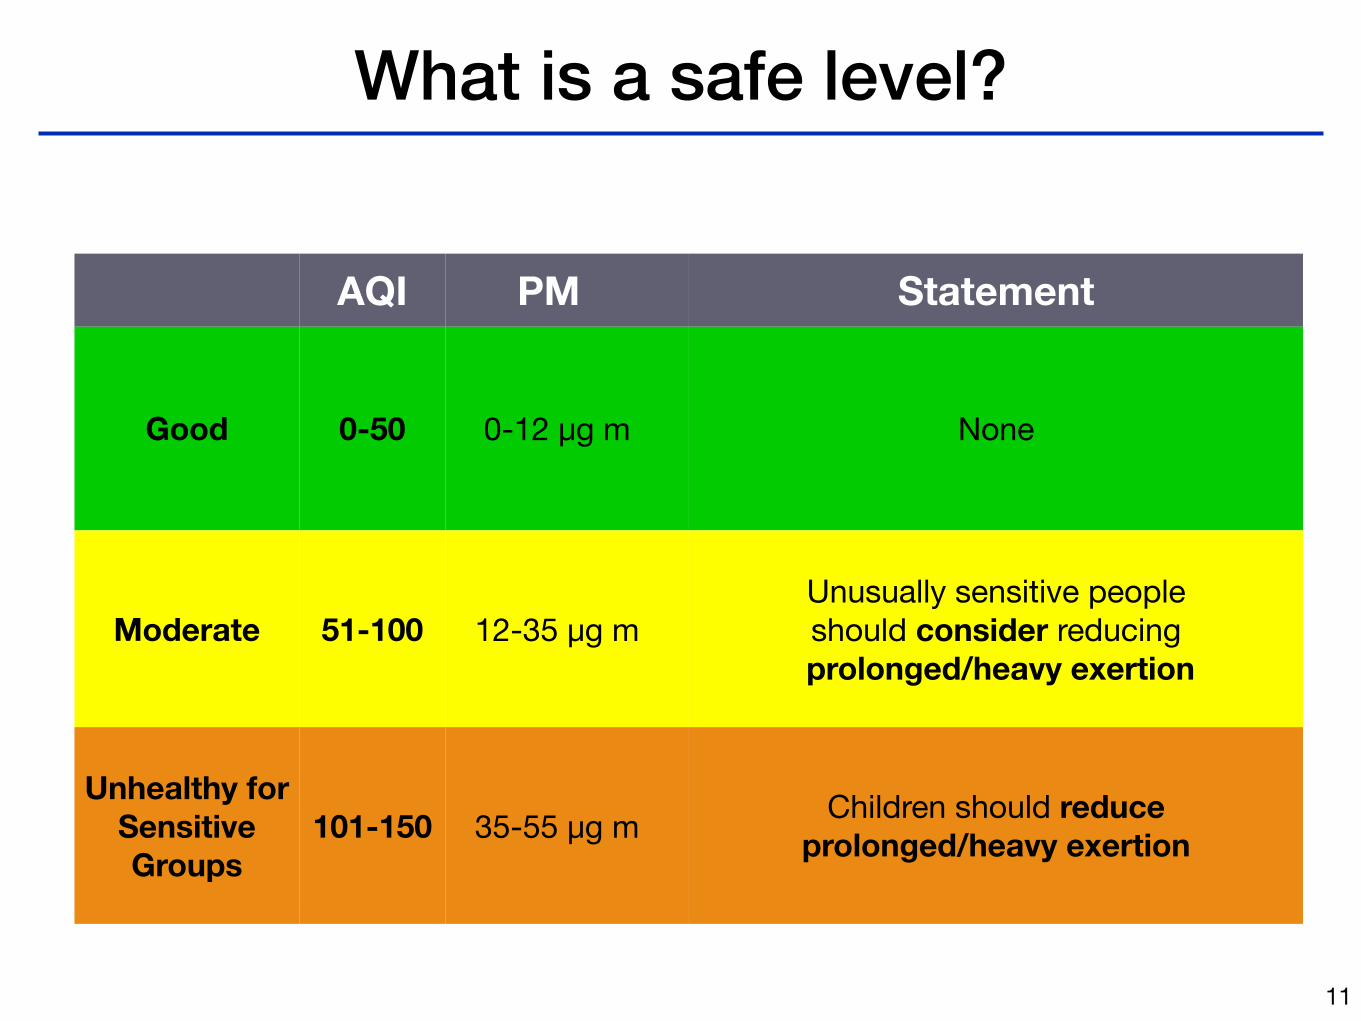
AQI PM Statement
Good 0-50 0-12 µg m None
Moderate 51-100 12-35 µg mUnusually sensitive people should consider reducing
prolonged/heavy exertion
Unhealthy for Sensitive Groups
101-150 35-55 µg m Children should reduce prolonged/heavy exertion
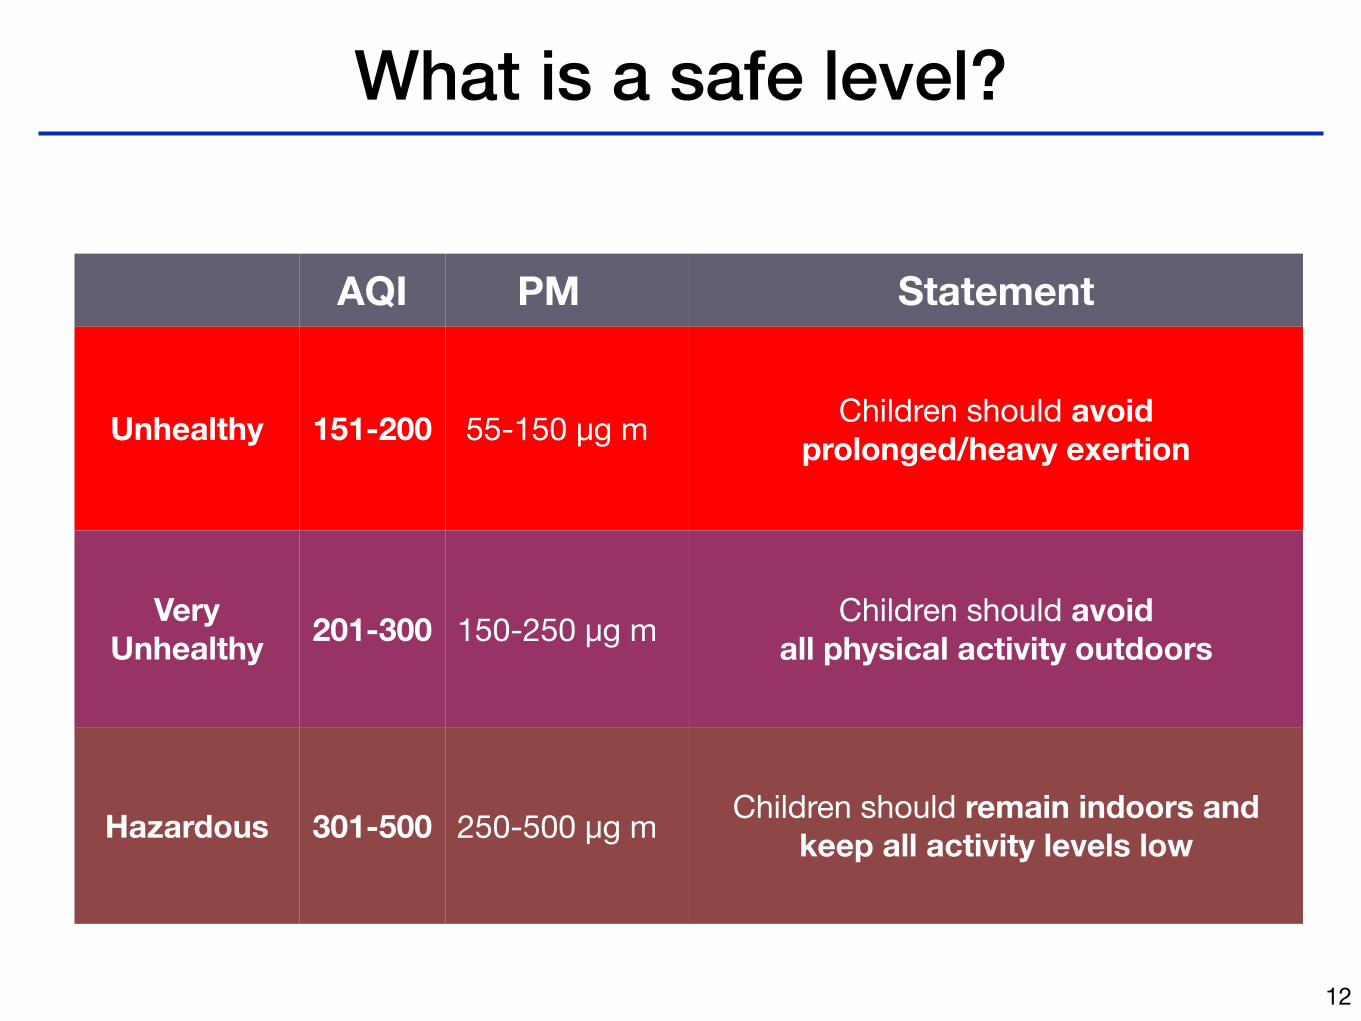
What is a safe level?
12
AQI PM Statement
Unhealthy 151-200 55-150 µg m Children should avoidprolonged/heavy exertion
Very Unhealthy 201-300 150-250 µg m Children should avoid
all physical activity outdoors
Hazardous 301-500 250-500 µg m Children should remain indoors and keep all activity levels low
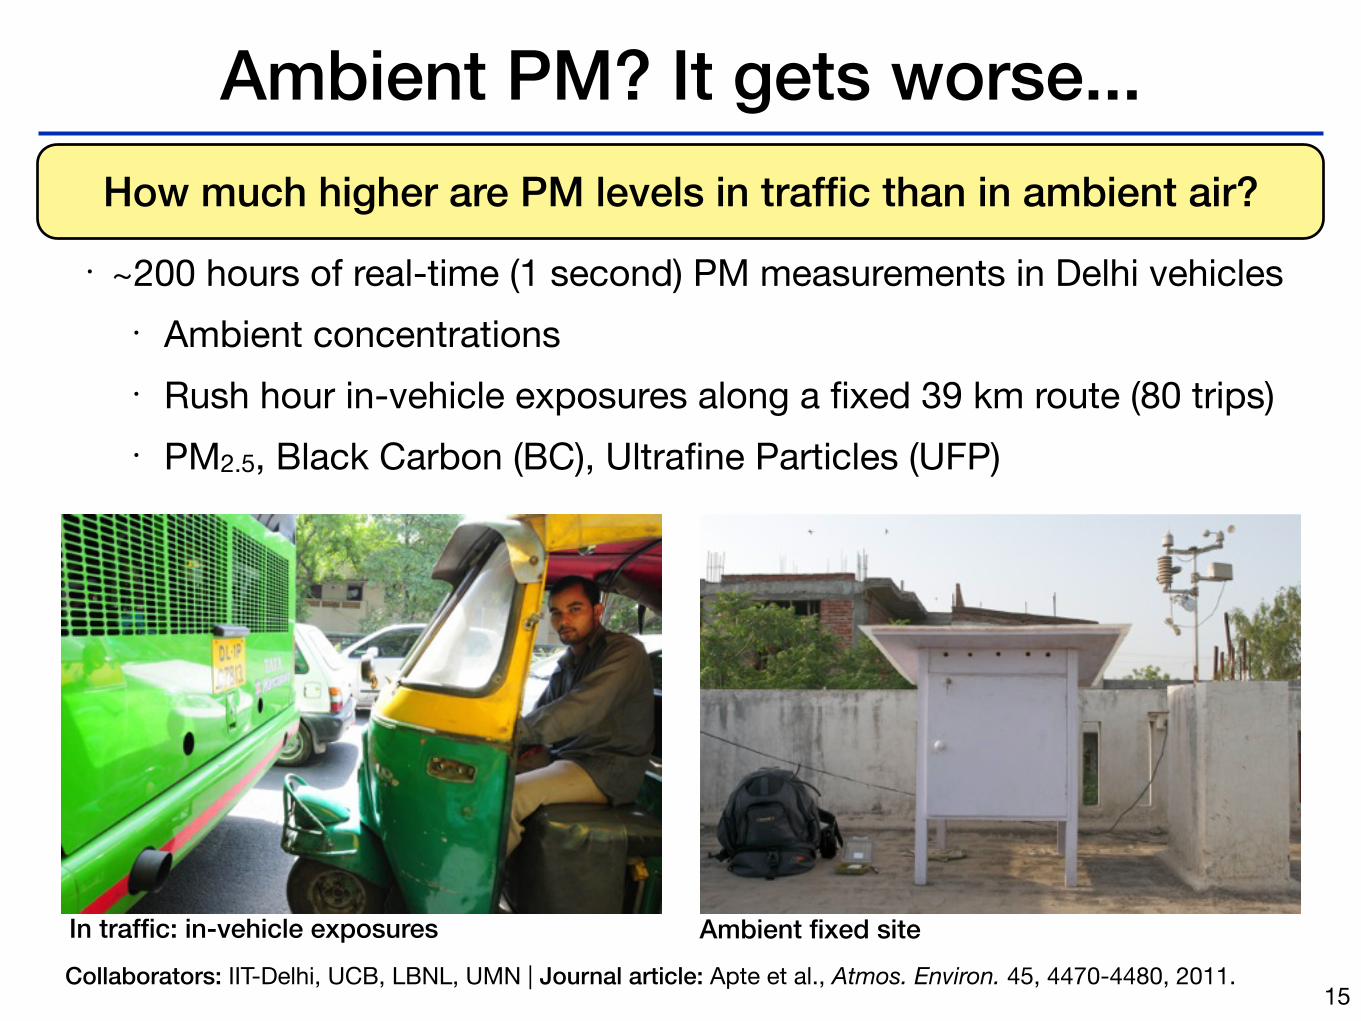
Ambient PM? It gets worse...
15
In traffic: in-vehicle exposures Ambient fixed site
How much higher are PM levels in traffic than in ambient air?• ~200 hours of real-time (1 second) PM measurements in Delhi vehicles
• Ambient concentrations• Rush hour in-vehicle exposures along a fixed 39 km route (80 trips)• PM2.5, Black Carbon (BC), Ultrafine Particles (UFP)
Collaborators: IIT-Delhi, UCB, LBNL, UMN | Journal article: Apte et al., Atmos. Environ. 45, 4470-4480, 2011.
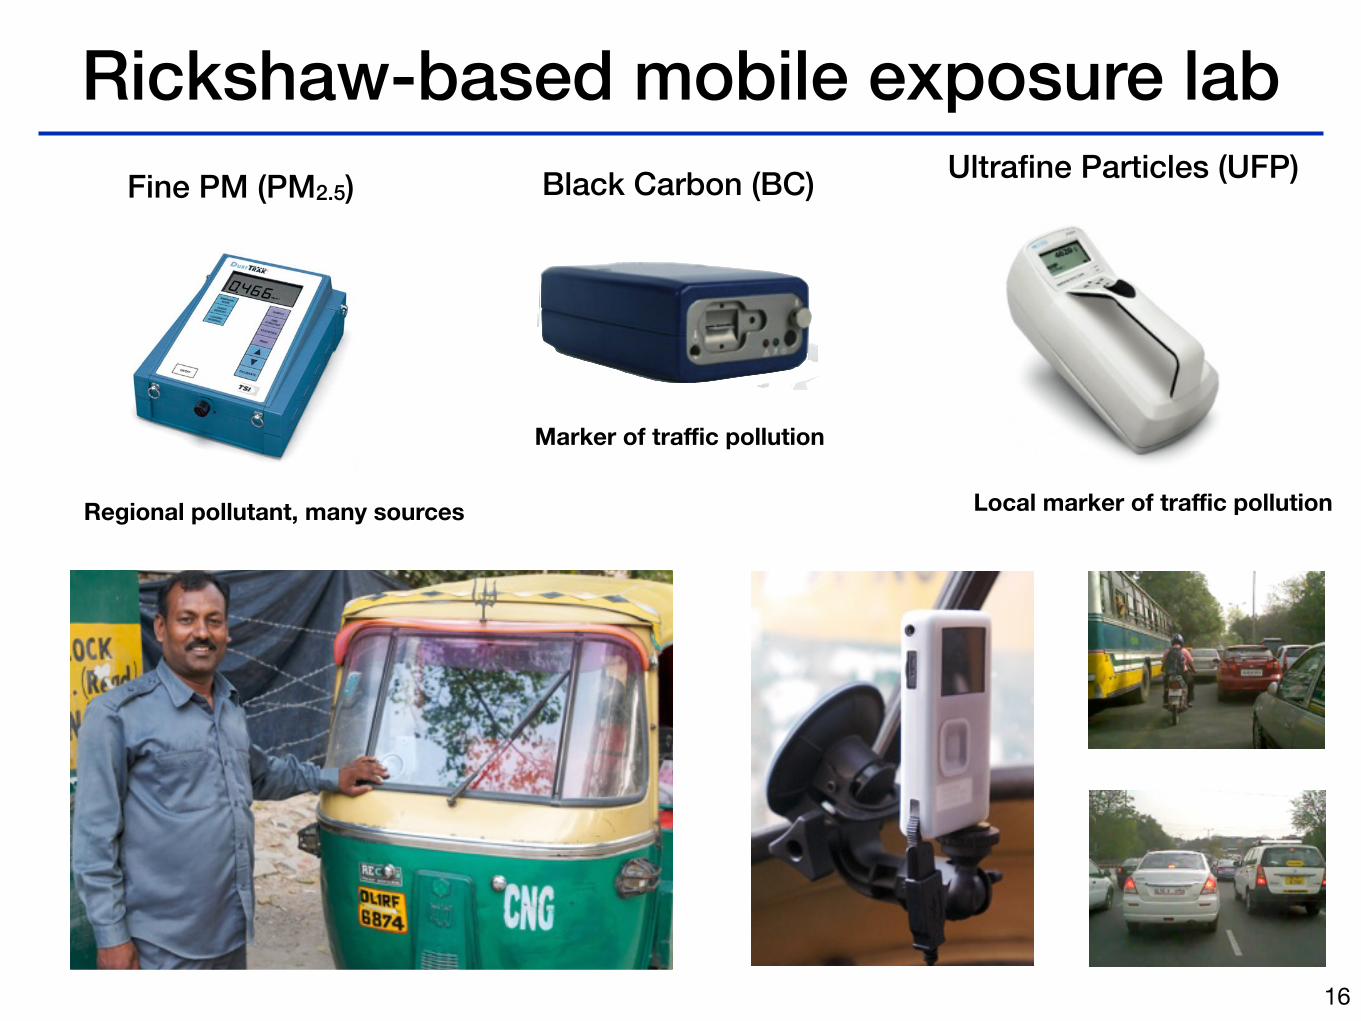
Rickshaw-based mobile exposure lab
16
Model 8520 DUSTTRAKTM Aerosol Monitor
TRAKPROTM Data Analysis Software enclosed
Operation and Service Manual
1980198, Revision R June 2006
E x p o s u r e M o n i t o r i n g
Ultrafine Particles (UFP) Fine PM (PM2.5) Black Carbon (BC)
Regional pollutant, many sources
Marker of traffic pollution
Local marker of traffic pollution
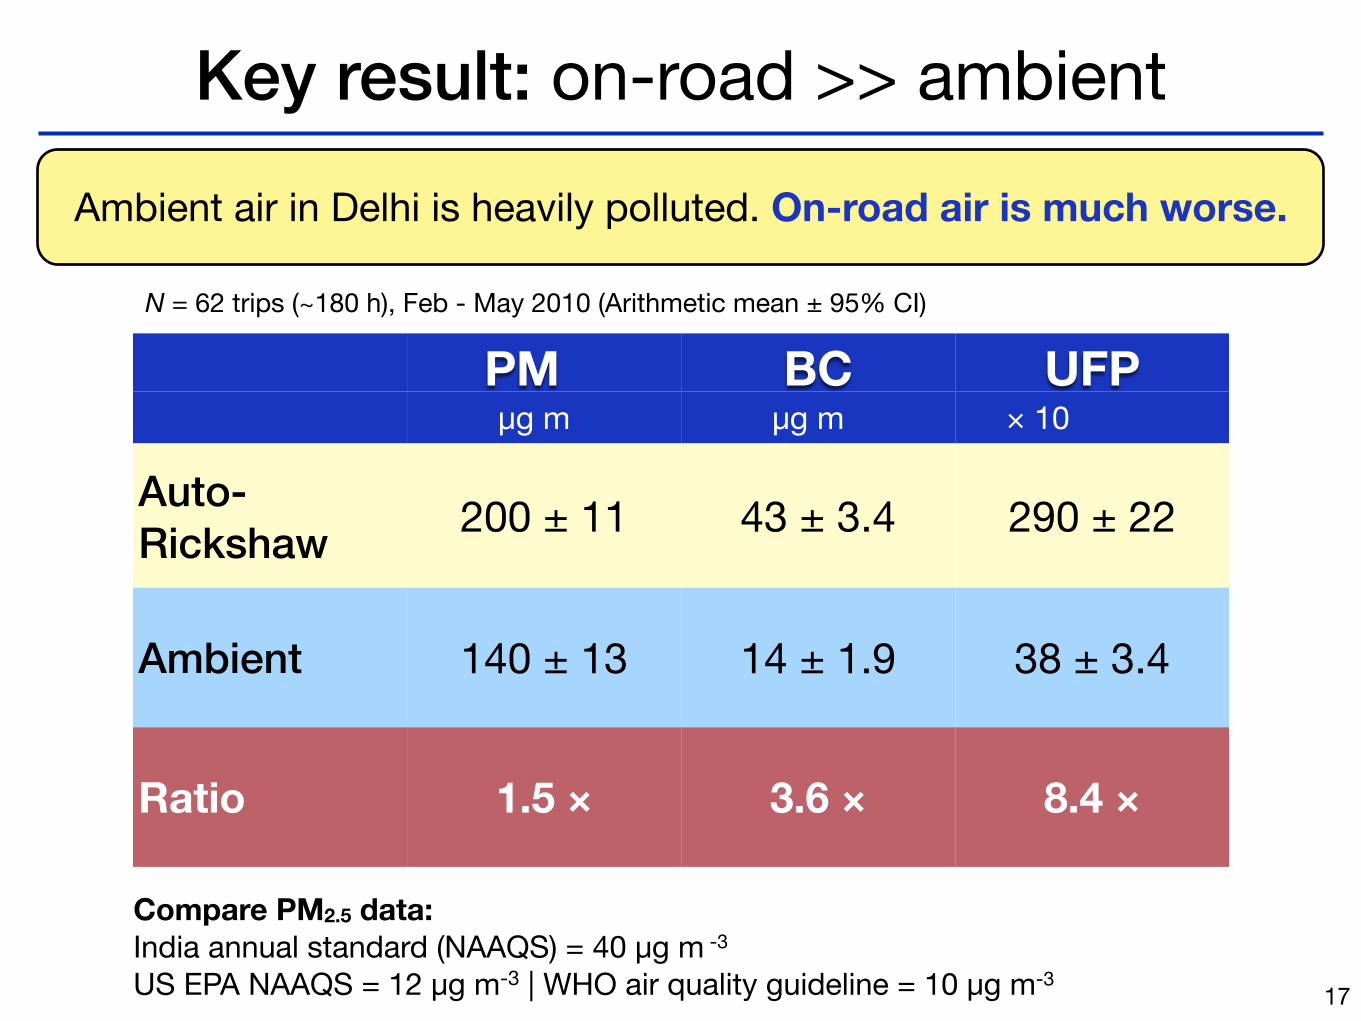
Key result: on-road >> ambient
17
PM BC UFPµg m µg m × 10
Auto-Rickshaw 200 ± 11 43 ± 3.4 290 ± 22
Ambient 140 ± 13 14 ± 1.9 38 ± 3.4
Ratio 1.5 × 3.6 × 8.4 ×
N = 62 trips (~180 h), Feb - May 2010 (Arithmetic mean ± 95% CI)
Ambient air in Delhi is heavily polluted. On-road air is much worse.
Compare PM2.5 data: India annual standard (NAAQS) = 40 µg m -3 US EPA NAAQS = 12 µg m-3 | WHO air quality guideline = 10 µg m-3
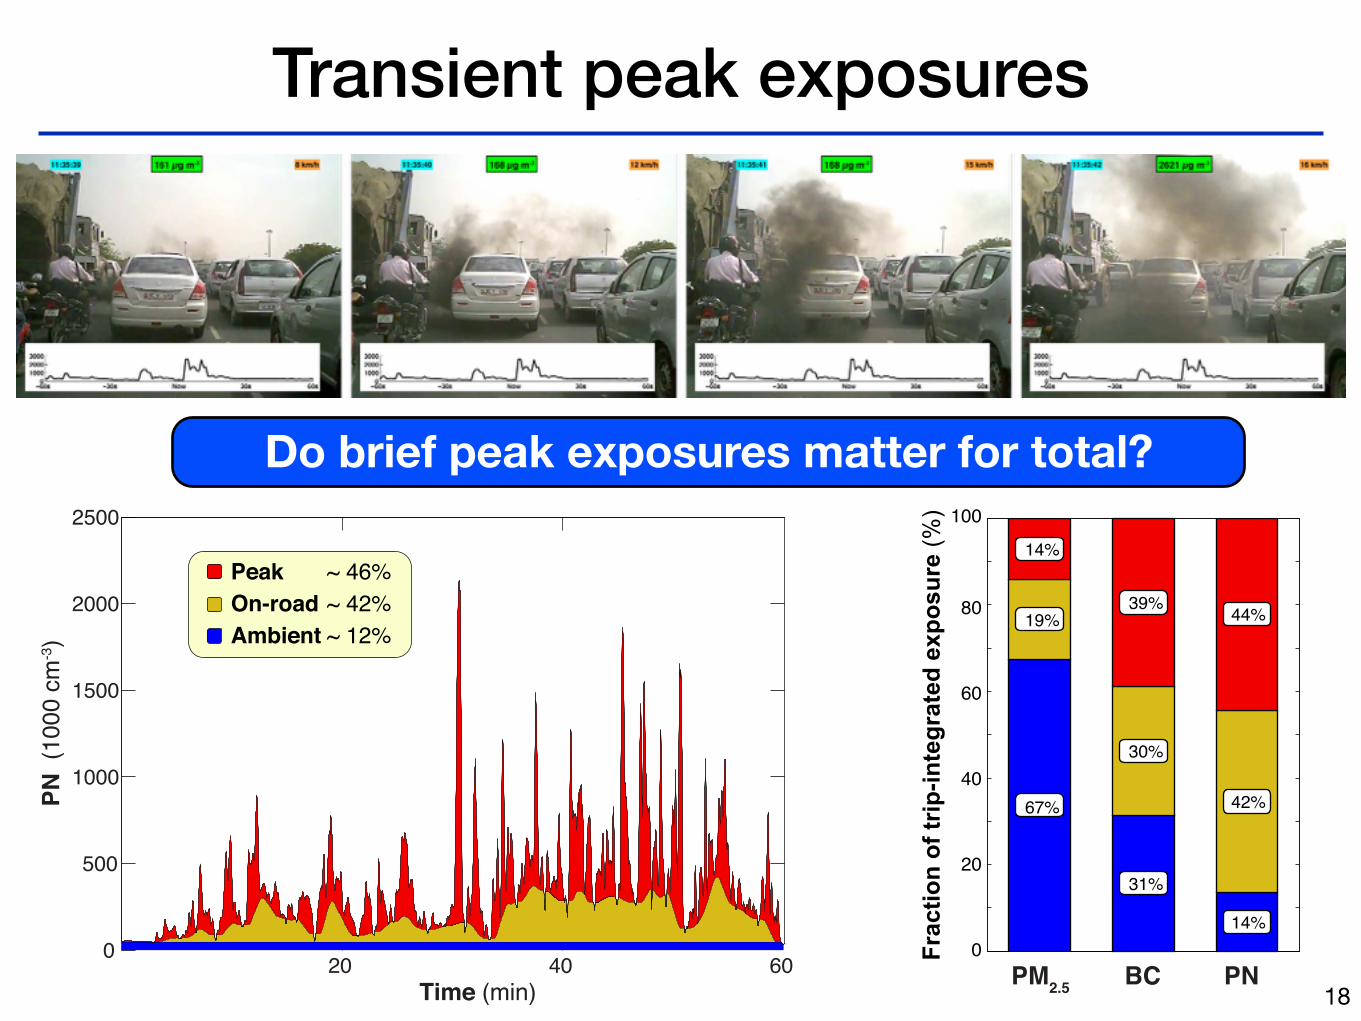
Transient peak exposures
1820 40 60
0
500
1000
1500
2000
2500
Time (min)
PN (
1000
cm
-3)
Peak ~ 46%On-road ~ 42%Ambient ~ 12%
20
40
60
80
100
0PM2.5 BC PN
67%
19%
14%
31%
30%
39%
42%
14%
44%
Frac
tion
of tr
ip-in
tegr
ated
exp
osur
e (%
)
Do brief peak exposures matter for total?
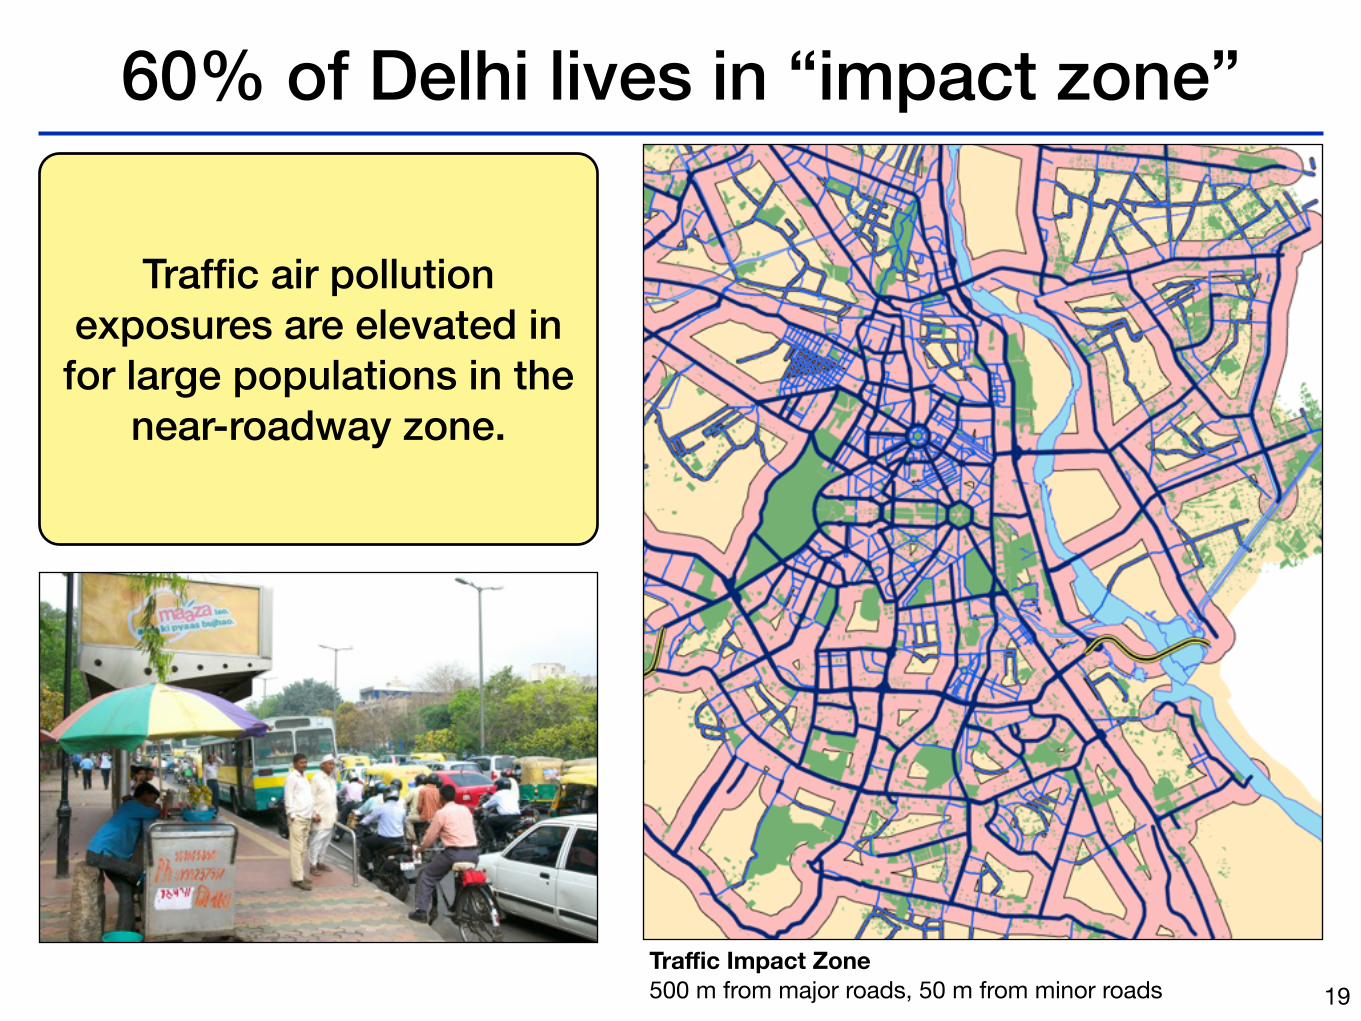
60% of Delhi lives in “impact zone”
19Traffic Impact Zone 500 m from major roads, 50 m from minor roads
Traffic air pollution exposures are elevated in
for large populations in the near-roadway zone.
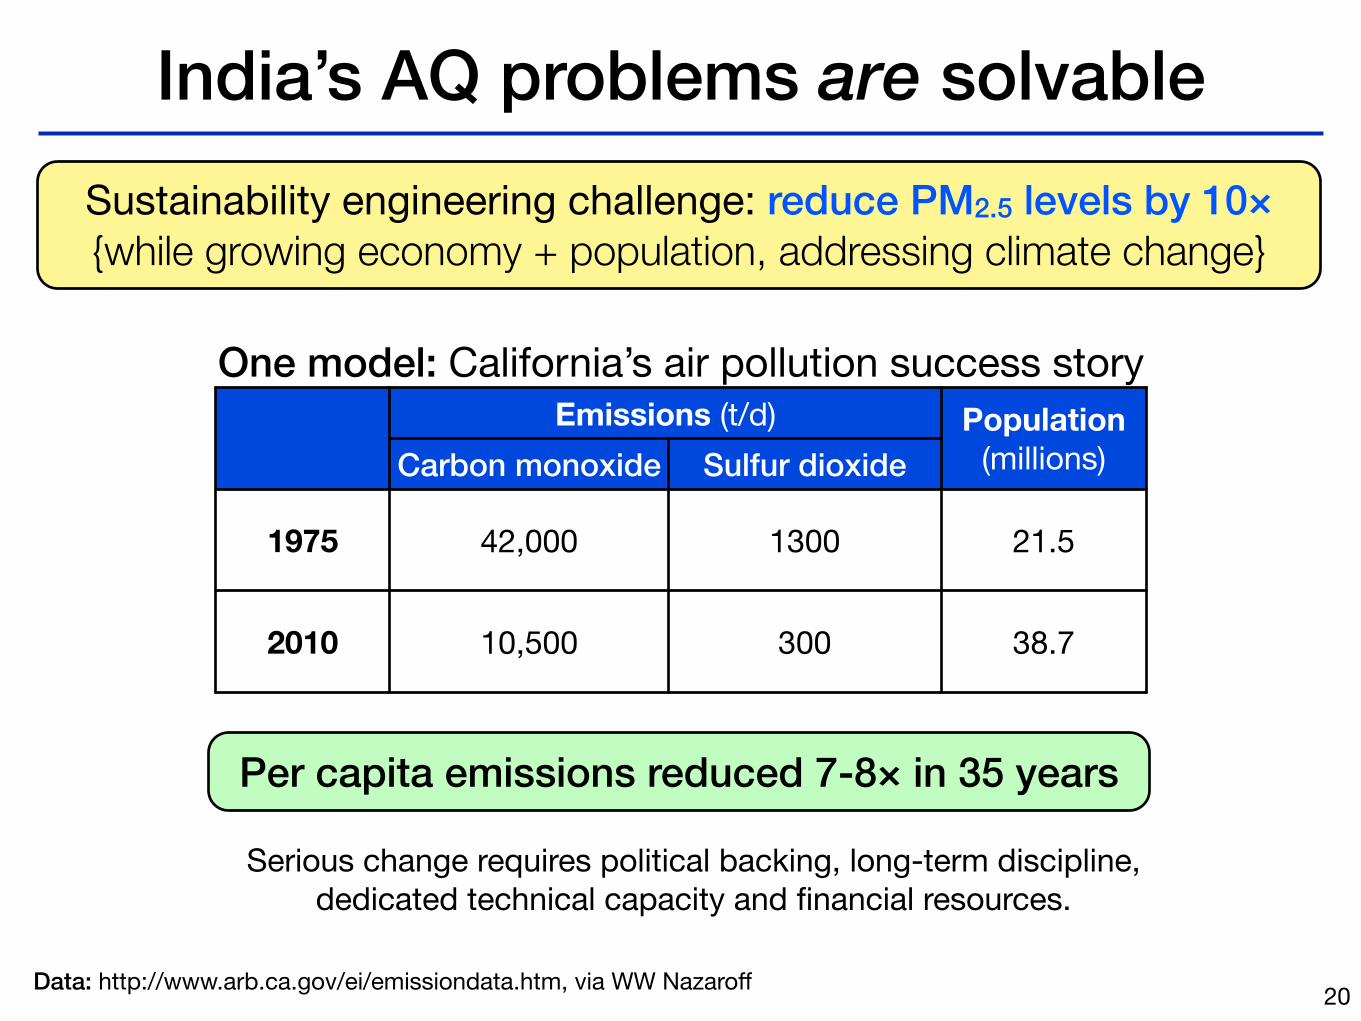
India’s AQ problems are solvable
20
Emissions (t/d) Population (millions)Carbon monoxide Sulfur dioxide
1975 42,000 1300 21.5
2010 10,500 300 38.7
Sustainability engineering challenge: reduce PM2.5 levels by 10× {while growing economy + population, addressing climate change}
One model: California’s air pollution success story
Data: http://www.arb.ca.gov/ei/emissiondata.htm, via WW Nazaroff
Per capita emissions reduced 7-8× in 35 years
Serious change requires political backing, long-term discipline, dedicated technical capacity and financial resources.
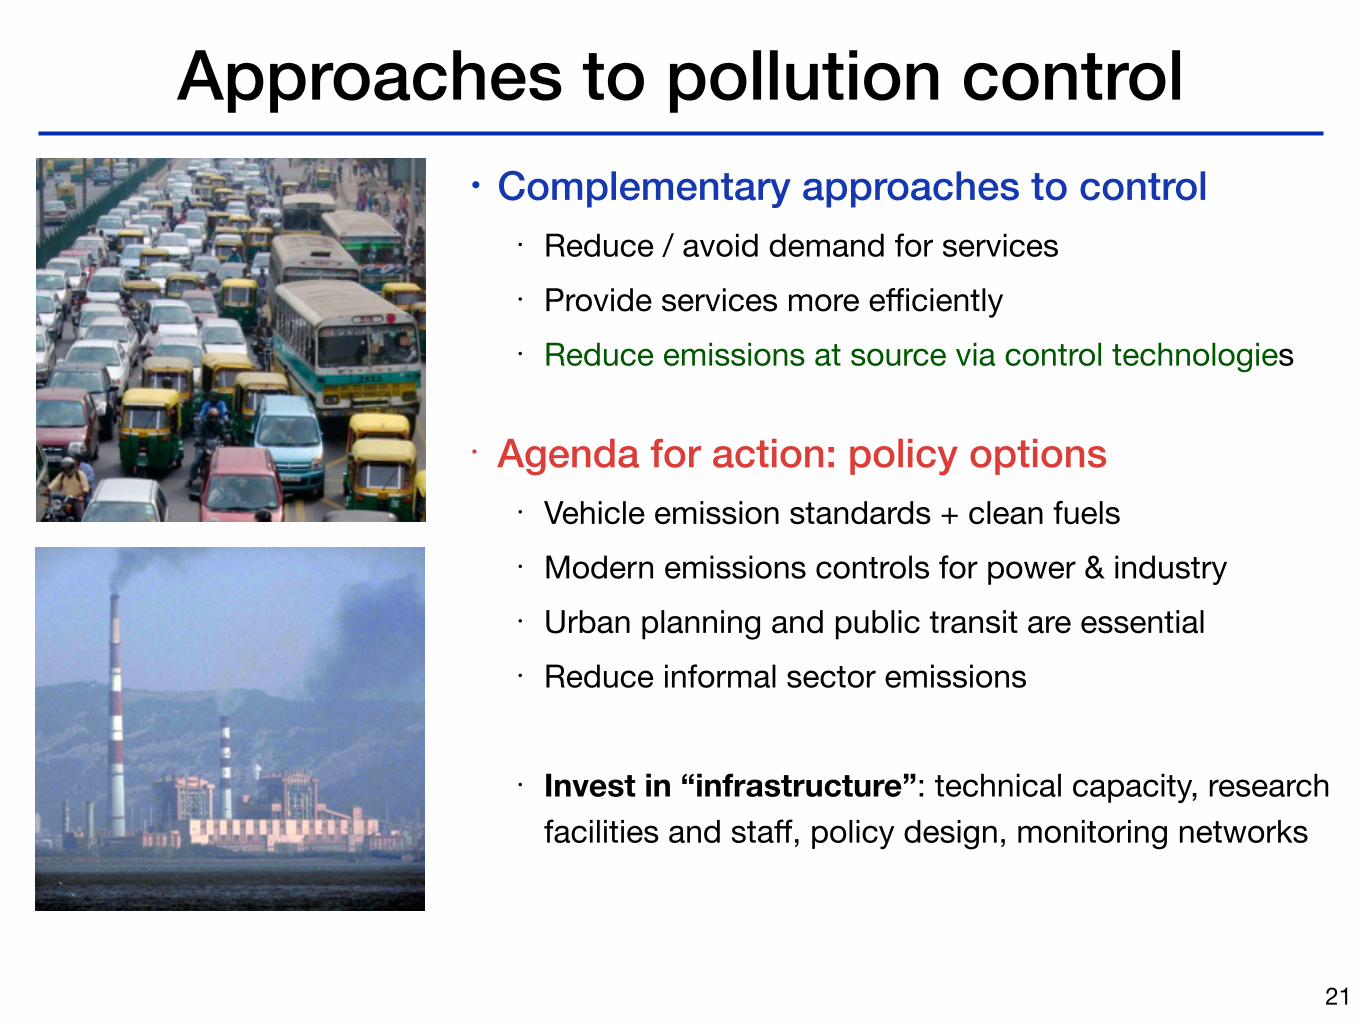
Approaches to pollution control• Complementary approaches to control
• Reduce / avoid demand for services• Provide services more efficiently• Reduce emissions at source via control technologies
• Agenda for action: policy options • Vehicle emission standards + clean fuels• Modern emissions controls for power & industry• Urban planning and public transit are essential• Reduce informal sector emissions!
• Invest in “infrastructure”: technical capacity, research facilities and staff, policy design, monitoring networks
21
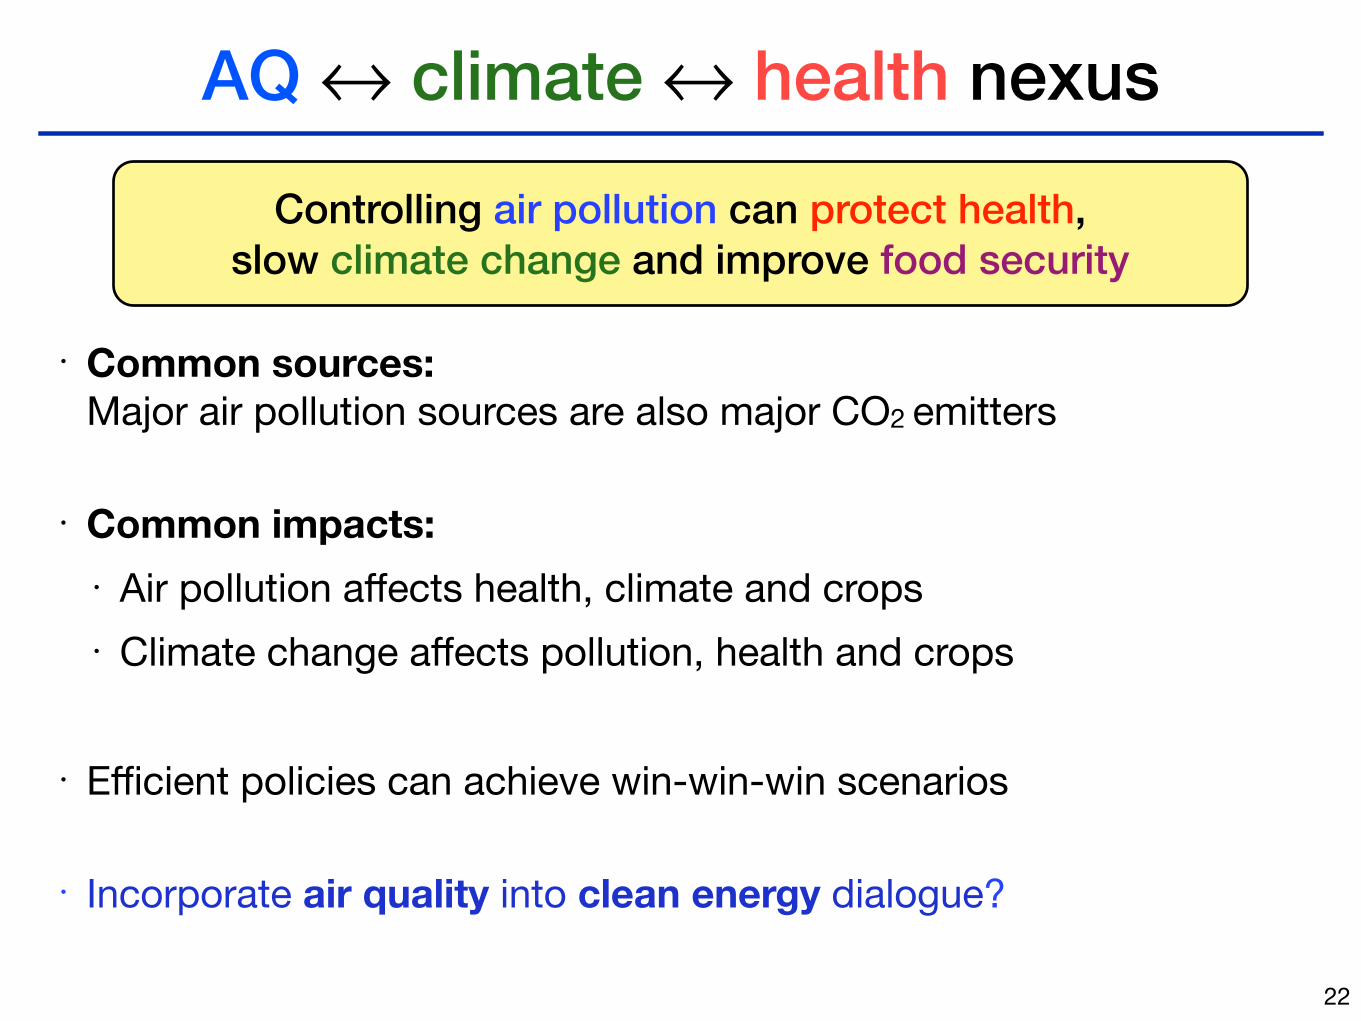
AQ ↔ climate ↔ health nexus
22
Controlling air pollution can protect health,slow climate change and improve food security
• Common sources:Major air pollution sources are also major CO2 emitters
• Common impacts: • Air pollution affects health, climate and crops• Climate change affects pollution, health and crops
!• Efficient policies can achieve win-win-win scenarios
• Incorporate air quality into clean energy dialogue?
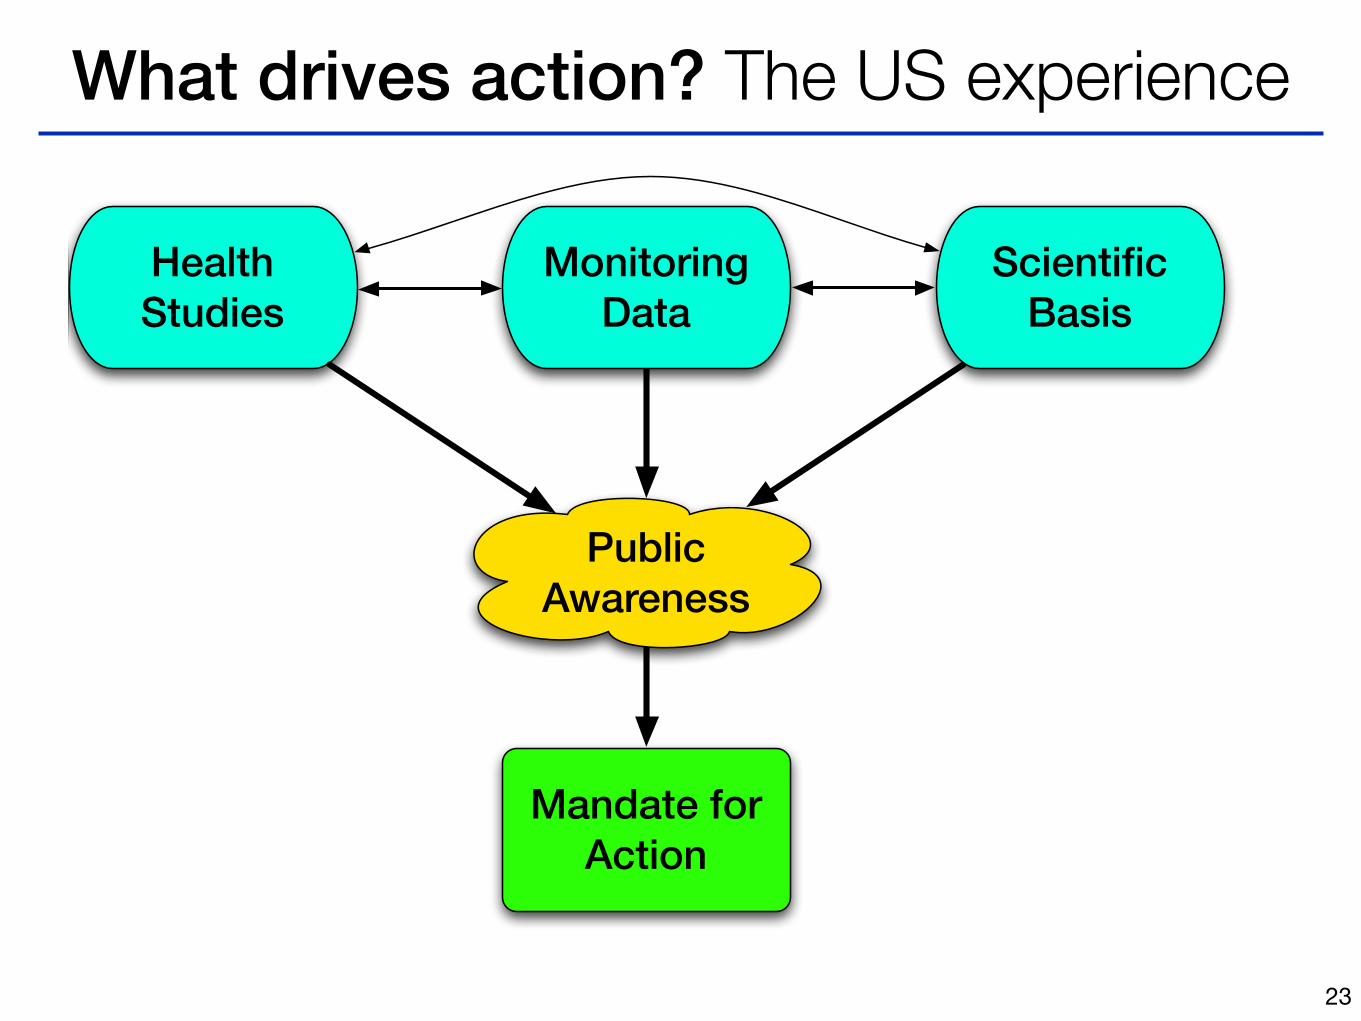
What drives action? The US experience
Mandate for Action
Health Studies
Monitoring Data
ScientificBasis
PublicAwareness
23
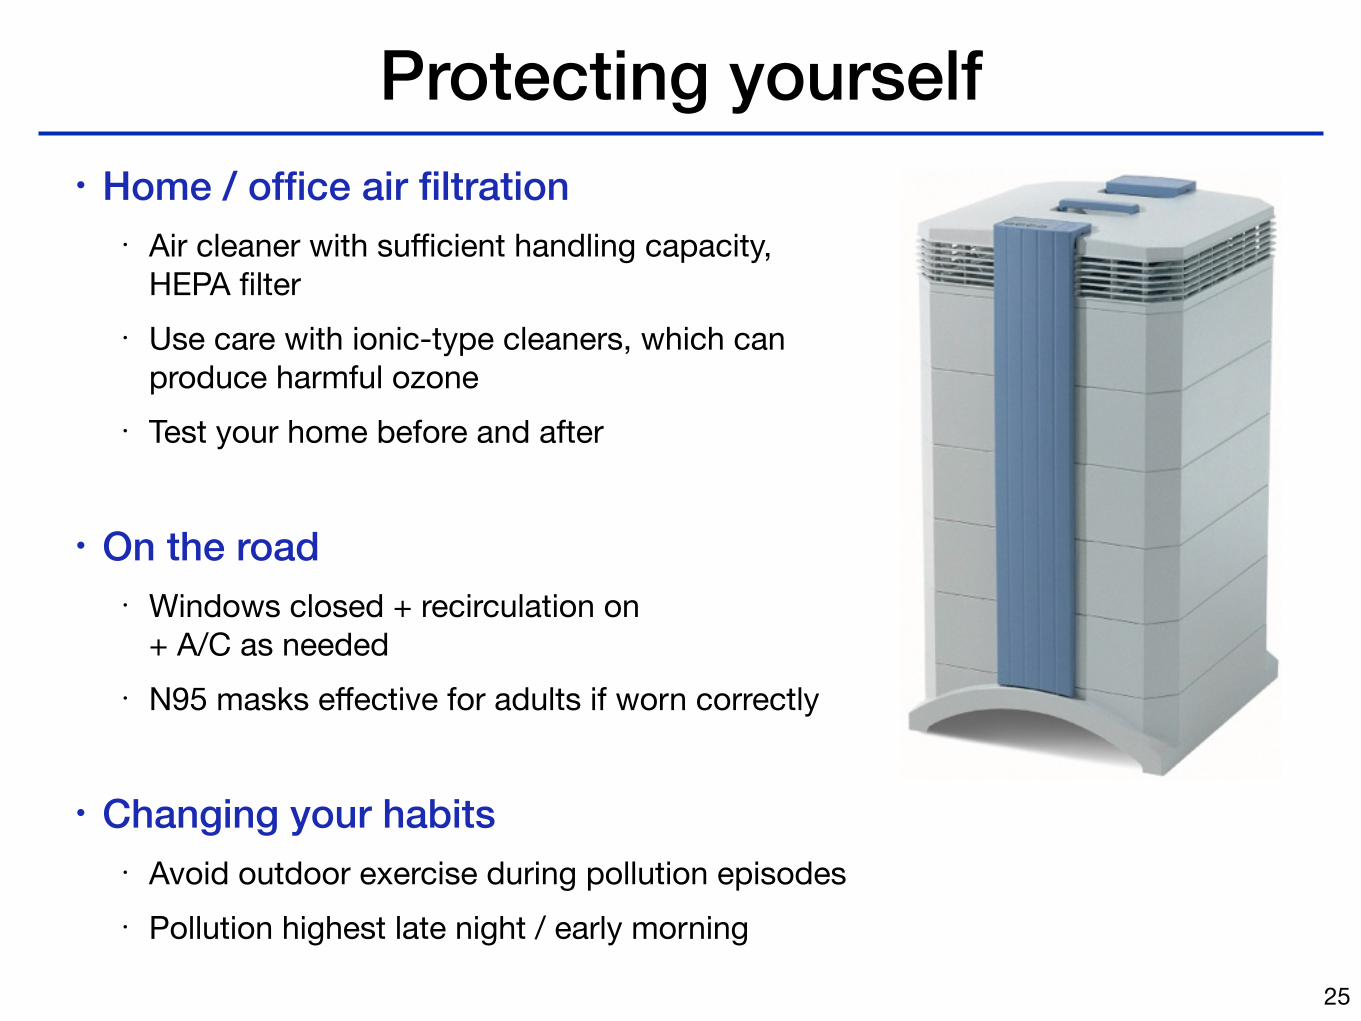
Protecting yourself• Home / office air filtration
• Air cleaner with sufficient handling capacity, HEPA filter
• Use care with ionic-type cleaners, which can produce harmful ozone
• Test your home before and after!
• On the road • Windows closed + recirculation on
+ A/C as needed• N95 masks effective for adults if worn correctly!
• Changing your habits • Avoid outdoor exercise during pollution episodes• Pollution highest late night / early morning
25
Summary• Air pollution in India is a health risk of comparable scale to
“traditional” global health challenges.!
• Major limitations to monitoring data. Large need for research & technical capacity
• Strategies for clean air are straightforward, but require major and sustained investment.
• Huge potential to exploit synergies in AQ - climate - health nexus!
• USA has much to offer India to aid in clearing the air
• In the meantime ... hold your breath!
26