Embed Size (px)
Citation preview

Scottish Green Bus Fund
Initial findings from Round 1

• Overview
• Aggregate Performance
• Detailed Analysis
• Concluding Remarks

• Overview
• Aggregate Performance
• Detailed Analysis
• Concluding Remarks

Scottish Green Bus Fund
• Aim to support the wider roll out of low emissions buses
• Reduce GHG emissions from bus fleet and help meet wider climate change reduction targets.
• Must reduce emissions by more than 30% against the chosen emissions benchmark

Scottish Green Bus Fund
• Low carbon engine technology is more expensive
• SGBF will meet up to 80% of the purchase cost differential
• Will be a number of additional costs and potential savings, particularly in the near-term
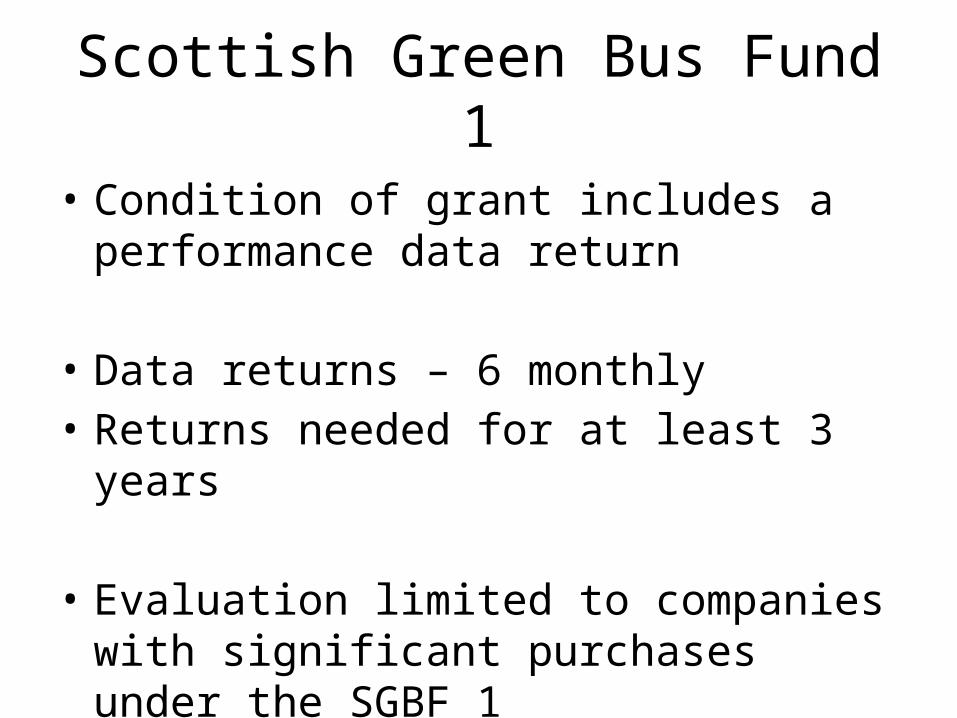
Scottish Green Bus Fund 1
• Condition of grant includes a performance data return
• Data returns – 6 monthly• Returns needed for at least 3 years
• Evaluation limited to companies with significant purchases under the SGBF 1

In God we trust……. but everyone else must bring data

Data Returns
• Not all buses were bought at the same time in the year
• Do not have all returns for SGBF 1 but sufficient for an emerging picture
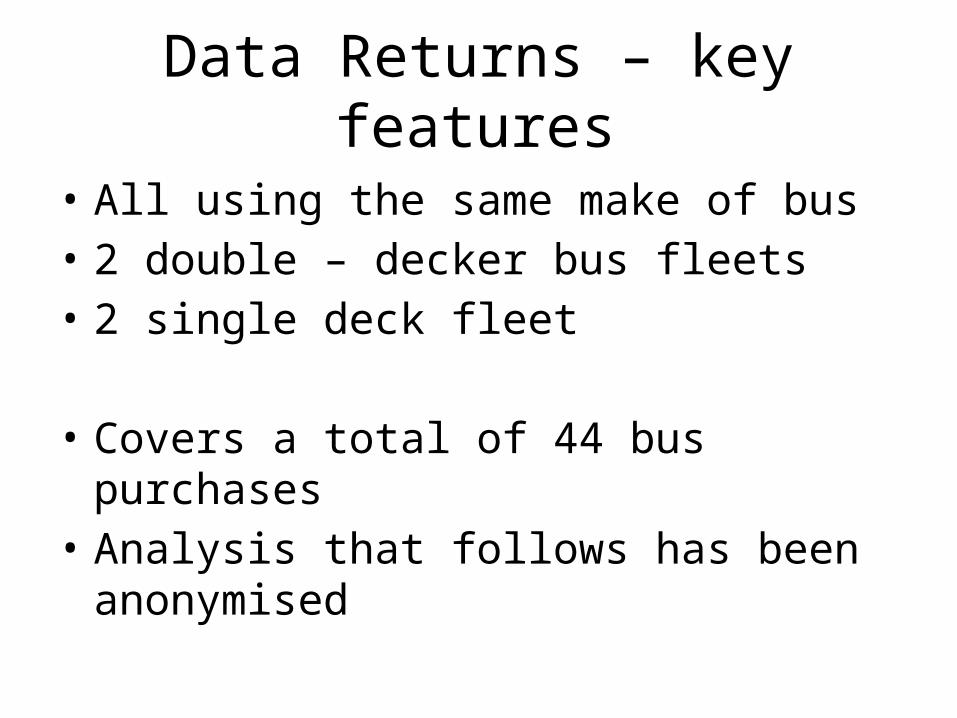
Data Returns – key features
• All using the same make of bus • 2 double – decker bus fleets• 2 single deck fleet
• Covers a total of 44 bus purchases • Analysis that follows has been anonymised

• Overview
• Aggregate Performance
• Detailed Analysis
• Concluding Remarks
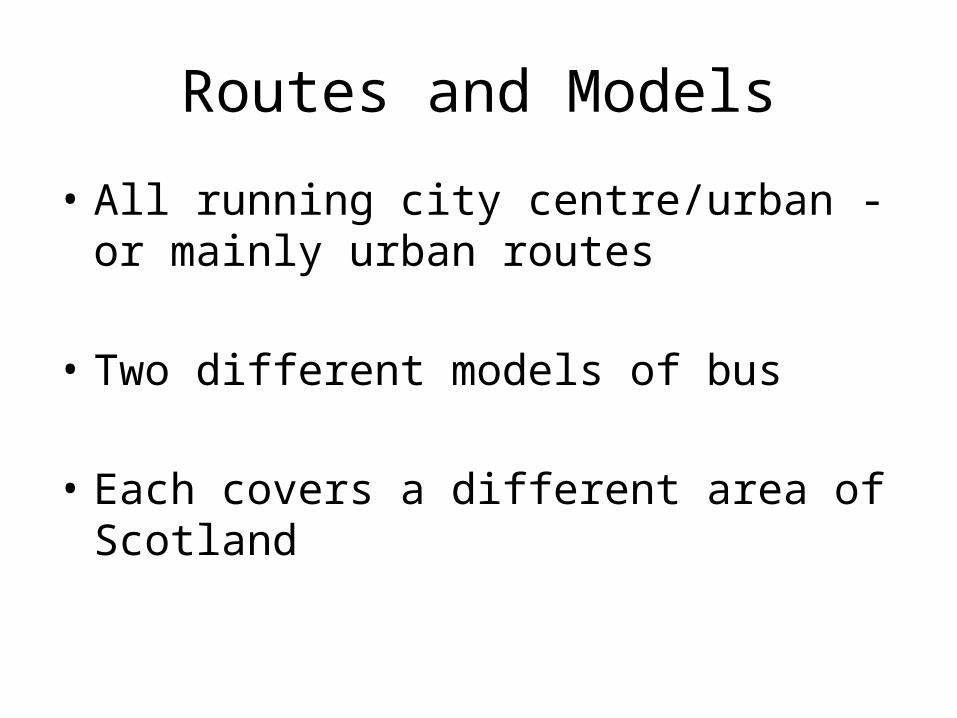
Routes and Models
• All running city centre/urban - or mainly urban routes
• Two different models of bus
• Each covers a different area of Scotland

Aggregate SGBF headlines
• The ‘average’ green bus travelled just under 33,500 miles in each 6 month period
• Range 21,000 – 46,000 kilometres
• Used 11,900 litres of fuel per period
• 21,000 miles (13,000 – 29,000 miles)• 2,600 gallons of fuel

Average SGBF performance
• 2.83 km/l
• 8.04 mpg
• Maximum variation around mean performance: +16%; -30% Are a few data issues with some individual and collective returns suggesting -23% not -30%
• 80% of SGBF buses within 10% of the 8.04 mpg average

Fleet comparator
• 6.37 mpg• 2.24 km/l• Maximum 9.89 mpg**• Minimum 5.00 mpg
• An average 26% increase in fuel efficiency

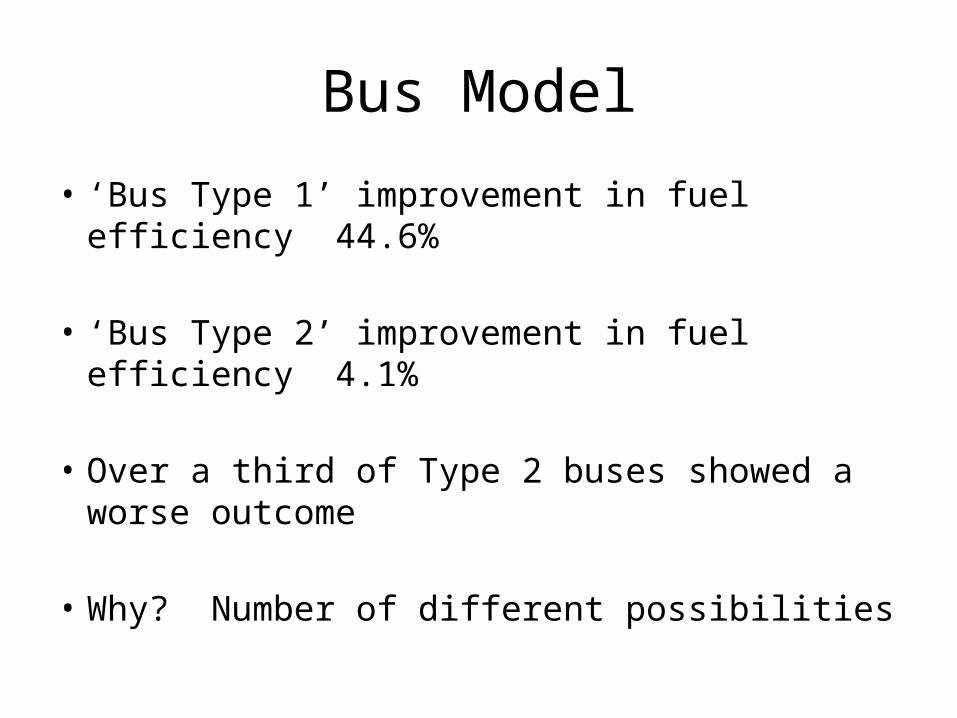
Bus Model
• ‘Bus Type 1’ improvement in fuel efficiency 44.6%
• ‘Bus Type 2’ improvement in fuel efficiency 4.1%
• Over a third of Type 2 buses showed a worse outcome
• Why? Number of different possibilities

Emissions impact
• Estimated cumulative savings in carbon dioxide emissions for SGBF 1 returns to date
• 11,500 tonnes of CO2e …..
• ….and counting
• Soon the data will overlap with future Funds

Data anomalies
• Maximum in comparator fleet is above maximum in hybrid fleet (9.89 mpg compared to 9.29 mpg)
• A number of what look like ‘data entry errors’

• Overview
• Aggregate Performance
• Detailed Analysis
• Concluding Remarks

Detailed Analysis
• Looked at data returns from individual companies.
• Considered data by:– Individual bus, – 6 month period, – Bus and 6 month period,– Distance and performance,– Season, and – bus performance ranking

Detailed Analysis
• Also compared findings against the average
• Happy to discuss any of this work 1:1 with any company that has sent returns under SGBF1


• Overview
• Aggregate Performance
• Detailed Analysis
• Concluding Remarks
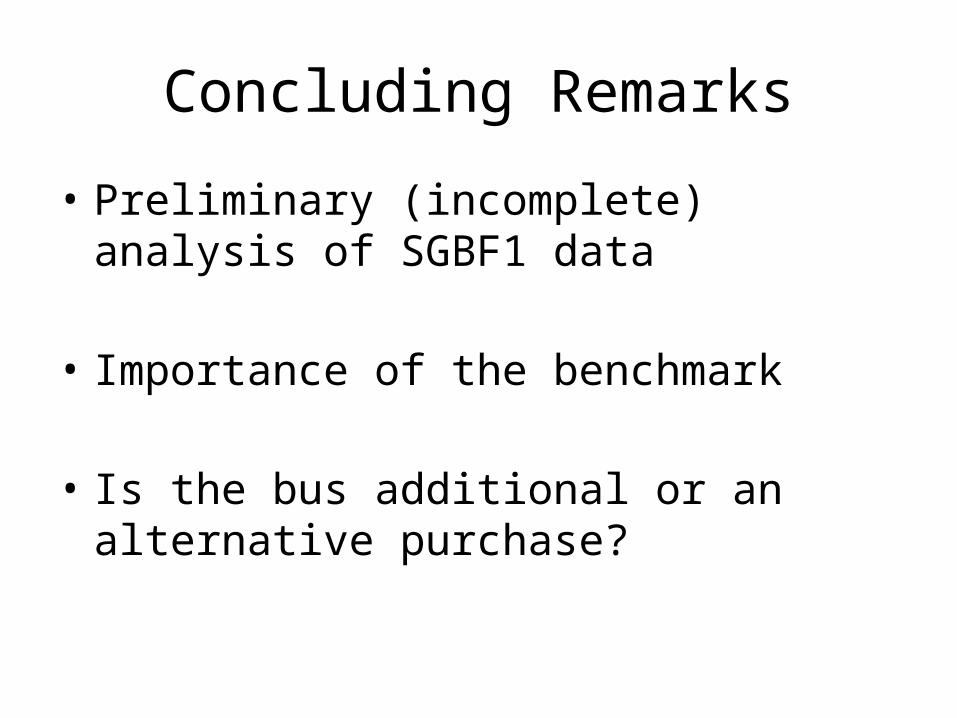
Concluding Remarks
• Preliminary (incomplete) analysis of SGBF1 data
• Importance of the benchmark
• Is the bus additional or an alternative purchase?

Concluding Remarks
• Suggests significant fuel (and running cost) savings are possible
• Suggests significant emissions savings per bus
• Not considered other costs (and uncertainties)
• Looking at data by period, bus model and trends suggests other factors impact on performance

Concluding Remarks
• Is the purchase price gap between a low emissions bus and standard bus reducing?
• New (additional) maintenance system needed
• Battery replacements costs and replacement timing uncertain
• Risk (large company vs small company)

Concluding Remarks
• Positive impact on patronage and revenues
• Welcome further discussions on findings with companies involved (any SGBF round)
THANK YOU


![BUS BUS BUS BUS BUS BUS BUS BUS BUS · Sunday 15 May 2016 Liverpool Street to Colchester, Ipswich, Norwich and branches BUS BUS BUS BUS BUS BUS BUS BUS BUS] 1 1 1 1 1 1 1 1 1 1 1](https://img.pdfslide.us/doc/110x75/5fab4ce2477d2d3adf21016a/bus-bus-bus-bus-bus-bus-bus-bus-sunday-15-may-2016-liverpool-street-to-colchester.jpg)