Embed Size (px)
Citation preview

www.TransformingTransportation.org
Spatial urban structure
matters on equity: A case
study in Bogota
Luis A. Guzmán, Researcher for the Universidad de los
AndesPresented at Transforming Transportation 2015

Luis A. Guzmán, Ph.DJanuary 2015
¿Spatial urban structure matters on equity?A case study in Bogota

3
The Bogota region
Grupo de Sostenibilidad Urbana y Regional
Bogota city and 12 contiguous municipalities:
• 7.35 million people in Bogota city
• 1.22 million of inhabitants in these
municipalities (in 2011)
The city offers the same
opportunities (access to
work) to its citizens
equitably? Let's see…

4
The average household (HH) income
Grupo de Sostenibilidad Urbana y Regional
Average income by household
[USD/month]:
Low income households < 545
Medium income households 545 - 1,800
High income households ≥1,800
Population by income group:
Low income group = 66%
Medium income group = 28%
High income group = 6%

5
Households’ income distribution
Grupo de Sostenibilidad Urbana y Regional
66% of HH in the city belong to the low-income category and 82%
of HH in the city earn less than USD 1,050/month.

6
The Bogota’s “super-densities”
Grupo de Sostenibilidad Urbana y Regional
Bogota is one of the densest
cities in the world and is the
densest in Latin America with
20,531 inh/km2 (Cervero, 2013).
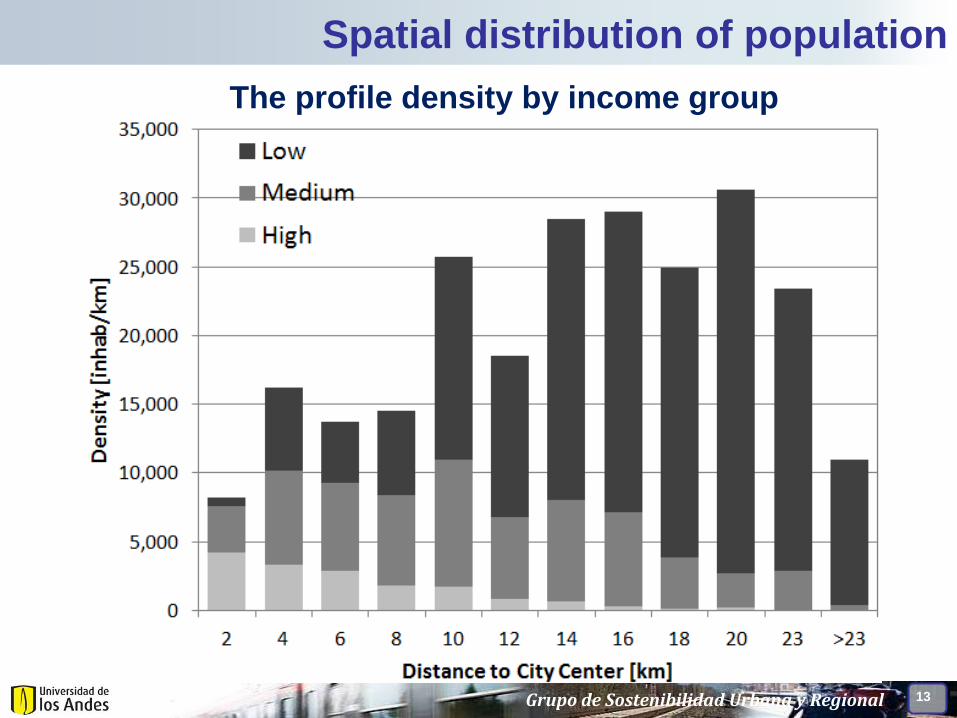
Average population density by
income group [inh/km2]:
Low income ≈ 23,100
Medium income ≈ 12,700
High income ≈ 7,500

7
The location of the population in recent years
Grupo de Sostenibilidad Urbana y Regional
The population has
concentrated

8
Frequency distribution of densities
Grupo de Sostenibilidad Urbana y Regional
9
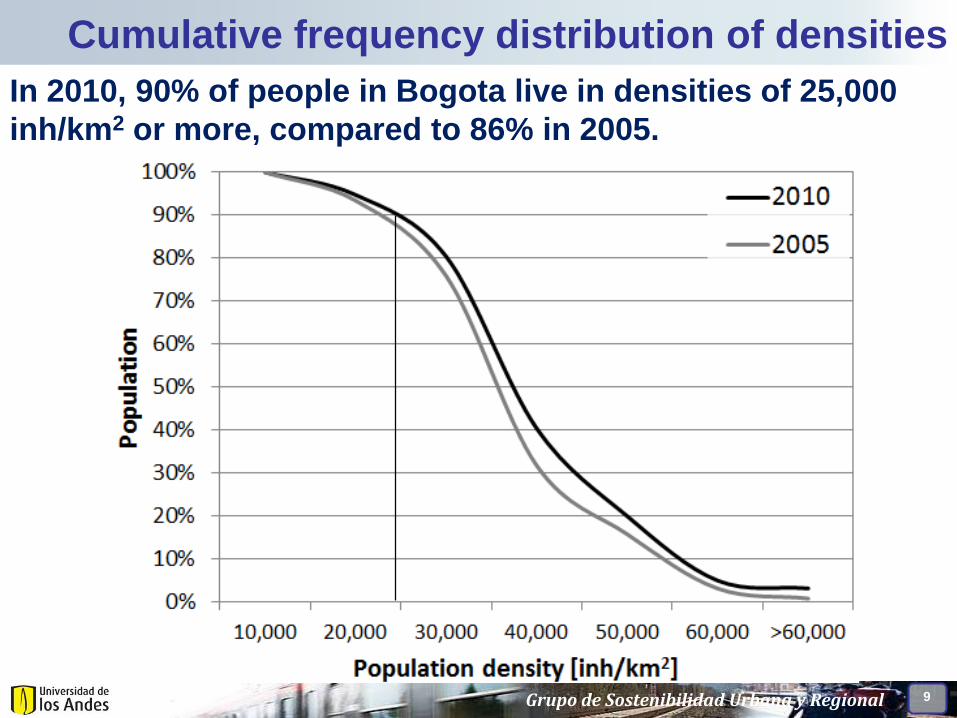
Cumulative frequency distribution of densities
Grupo de Sostenibilidad Urbana y Regional
In 2010, 90% of people in Bogota live in densities of 25,000
inh/km2 or more, compared to 86% in 2005.

Grupo de Sostenibilidad Urbana y Regional 10
Main activity centers
There is a dominance of a large
central core, along major road
corridors and especially the
north part of city center (the
richest zones).
Just over one-third of the city’s
employment occurs in zones
occupying only 10% of its urban
area.
Central
core

11
Territorial balance
Grupo de Sostenibilidad Urbana y Regional
The location of people and jobs is balanced?
30% of low income HH
lives far from their jobs
This implies longer
travels to work
12
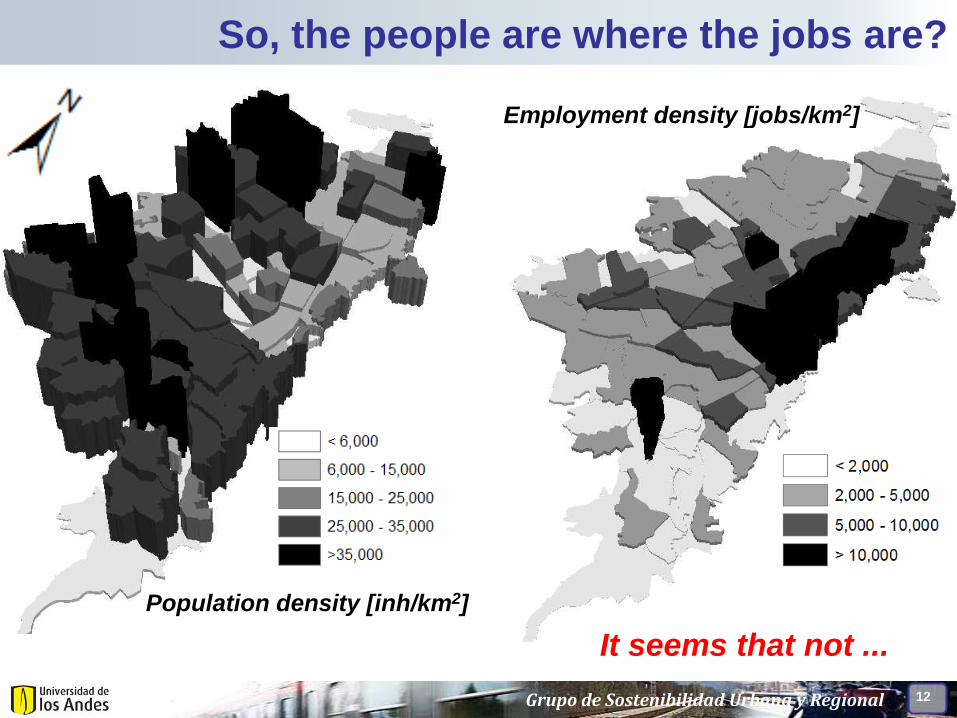
So, the people are where the jobs are?
Population density [inh/km2]
Employment density [jobs/km2]
It seems that not ...
Grupo de Sostenibilidad Urbana y Regional
13
Spatial distribution of population
Grupo de Sostenibilidad Urbana y Regional
The profile density by income group

14
Land distribution by income level
Grupo de Sostenibilidad Urbana y Regional
The high income group has
an evenly distribution of
urban land than others
The inequality is much higher
if we speak of green land
(parks)

15
And the accessibility to work?
Grupo de Sostenibilidad Urbana y Regional
is evenly distributed among income groups?
The high-income
group enjoy a
high accessibility
levels, higher
than average, for
most of the
population,
around 90%

16
Trips to work by person
Grupo de Sostenibilidad Urbana y Regional
The richest people make about 76% more trips to work
than poorest.
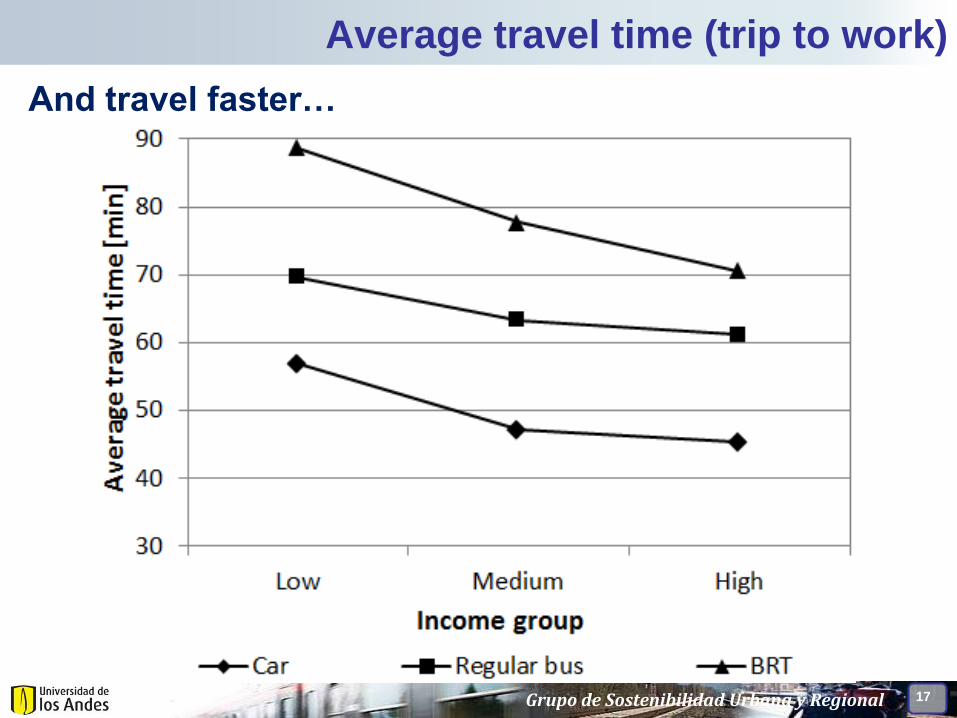
17
Average travel time (trip to work)
Grupo de Sostenibilidad Urbana y Regional
And travel faster…

18
Share on income spent on housing and transport
Grupo de Sostenibilidad Urbana y Regional
and also spend much less on transport and housing

19
Share on income spent on housing and transport
Grupo de Sostenibilidad Urbana y Regional
Low
income
group
High income group Medium income group
The location is a key
factor for transport
costs (particularly for
low-income groups).

20
How can improve quality of life in our city?
A great mobility system is not sufficient
to achieve sustainable development.
Grupo de Sostenibilidad Urbana y Regional
A sustainable long-term urban
development/planning is essential
Income levels
Sustainable
development

21
Equality vs. Equity
Grupo de Sostenibilidad Urbana y Regional
Given everyone the
same thing: only work
if everyone starts from
the same place. Same
income levels?
Access to same
opportunities: we must
first ensure equity before
we can enjoy equality.
Shared prosperity!