Embed Size (px)
Citation preview
1 / 9
Brahm Prakash, William Lipps, Laura Chambers, Di Wang; Shimadzu Scientific Instruments, Columbia, MD
Revisions to EPA Method 624 for Analysis of VOCs by GC/MS
2 / 92 / 9
Introduction
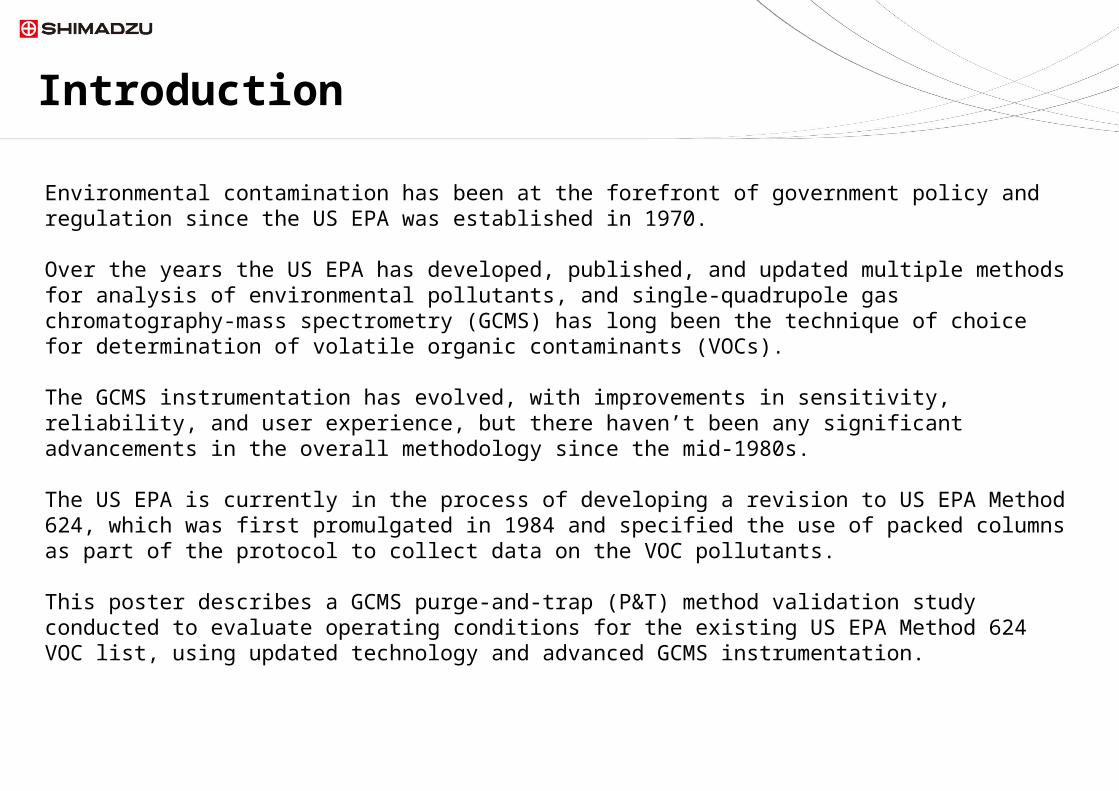
Environmental contamination has been at the forefront of government policy and regulation since the US EPA was established in 1970.
Over the years the US EPA has developed, published, and updated multiple methods for analysis of environmental pollutants, and single-quadrupole gas chromatography-mass spectrometry (GCMS) has long been the technique of choice for determination of volatile organic contaminants (VOCs).
The GCMS instrumentation has evolved, with improvements in sensitivity, reliability, and user experience, but there haven’t been any significant advancements in the overall methodology since the mid-1980s.
The US EPA is currently in the process of developing a revision to US EPA Method 624, which was first promulgated in 1984 and specified the use of packed columns as part of the protocol to collect data on the VOC pollutants.
This poster describes a GCMS purge-and-trap (P&T) method validation study conducted to evaluate operating conditions for the existing US EPA Method 624 VOC list, using updated technology and advanced GCMS instrumentation.
3 / 93 / 9
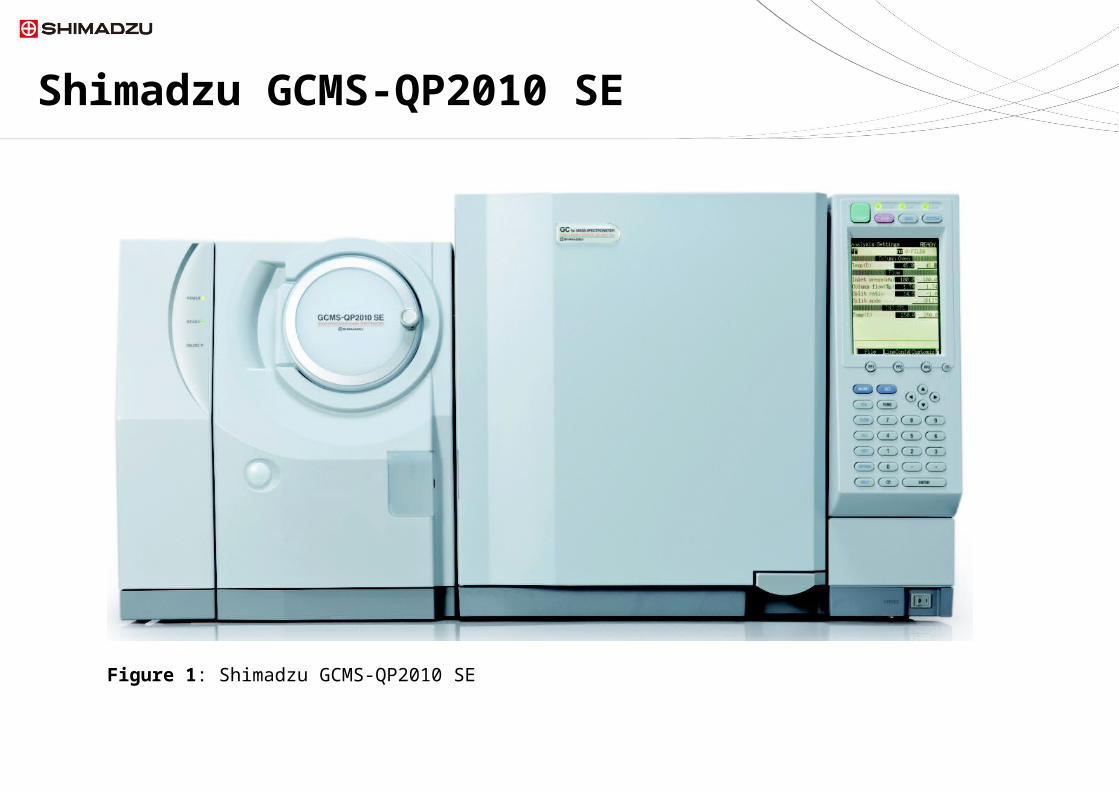
Figure 1: Shimadzu GCMS-QP2010 SE
Shimadzu GCMS-QP2010 SE
4 / 94 / 9
This study was conducted using the Shimadzu GCMS-QP2010 SE shown in Figure 1, configured with a capillary column designed specifically for analysis of VOCs by US EPA Method 624.
The GC was operated in the unique Constant Linear Velocity mode to provide optimum chromatographic resolution, symmetric peak shape, and enhanced sensitivity for all compounds.
Changes to quantitation and reference ions for a few selected compounds were made to improve overall sensitivity of the method.
Experimental
5 / 95 / 9
BFB Tune ResultsAt the beginning of the project the GCMS-QP2010 SE was tuned to meet the US EPA Method 624 requirements.
Each day prior to running samples, and at intervals of no longer than 12-hours during long sequences, an aliquot of the 4-bromofluorobenzene (BFB) was purged and analyzed.
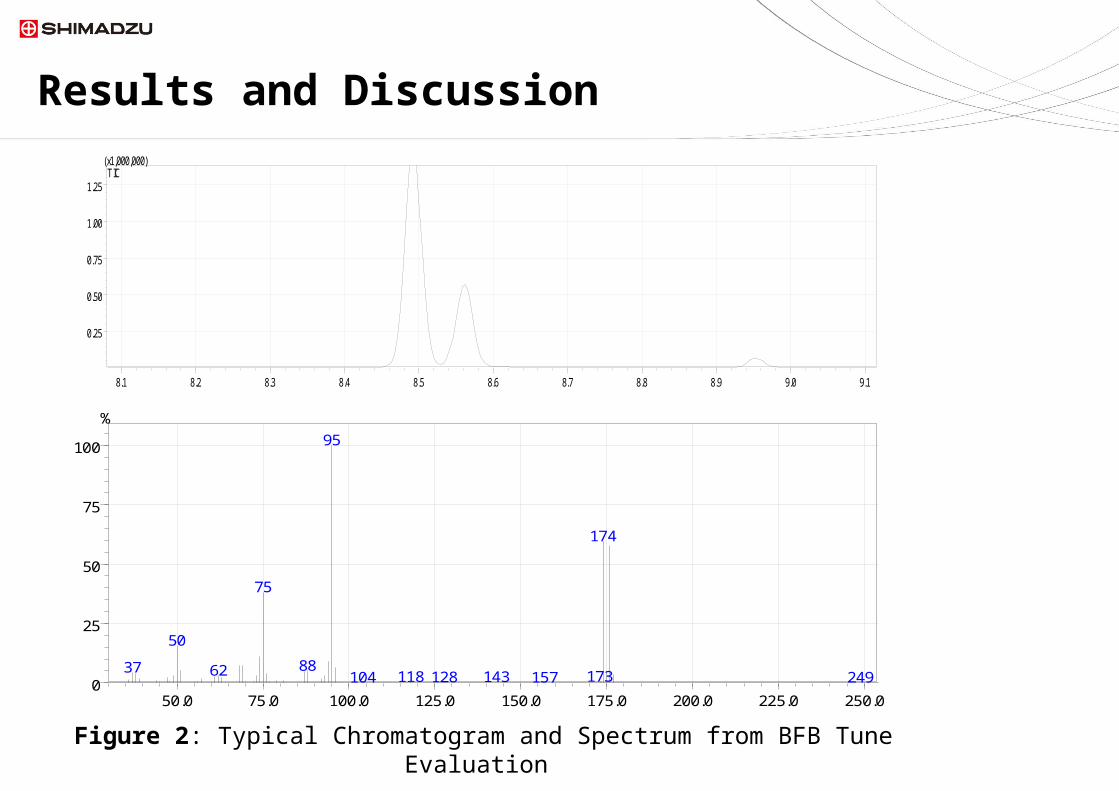
The BFB spectra were evaluated using the US EPA Method 624 criteria. A representative example of a BFB chromatogram and spectrum are shown in Figure 2.
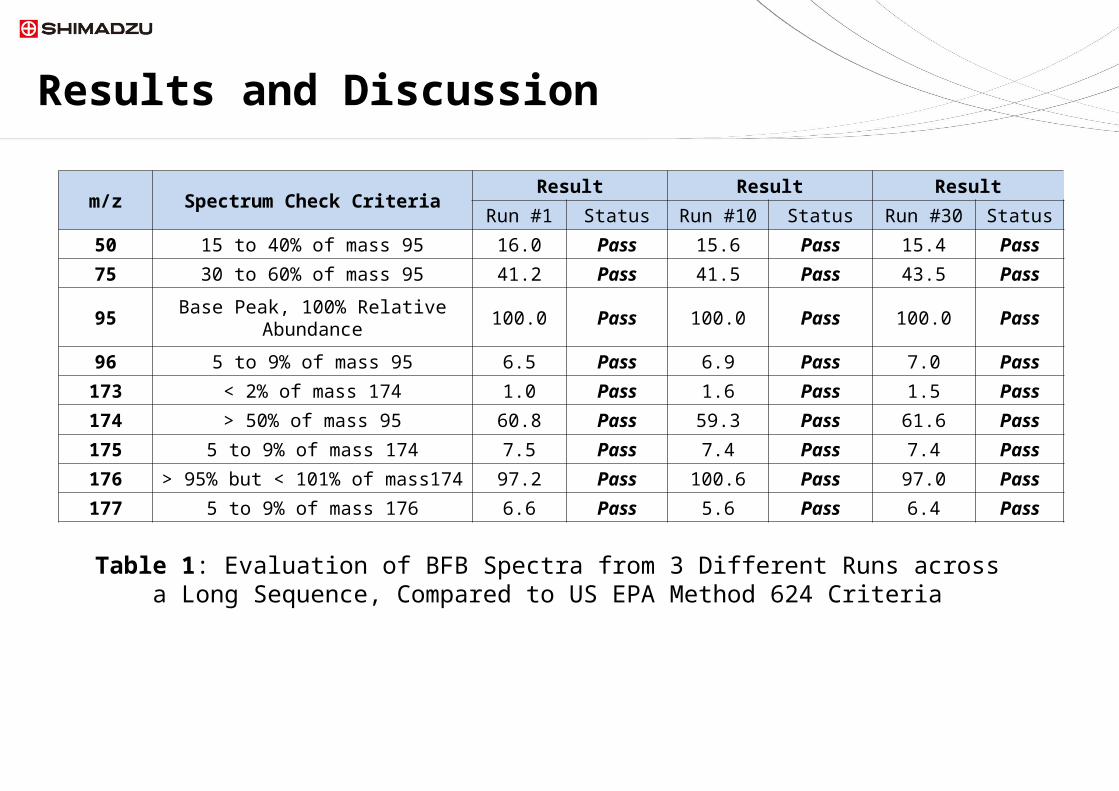
Table 1 lists the BFB results as compared to the method criteria from three selected analyses of BFB during one extended sequence.
The tune remained stable for over 2½ months, and the GCMS-QP2010 SE instrument did not require re-tuning at any time during the analysis period.
Results and Discussion
6 / 96 / 9
Results and Discussion
Figure 2: Typical Chromatogram and Spectrum from BFB Tune Evaluation
50.0 75.0 100.0 125.0 150.0 175.0 200.0 225.0 250.00
25
50
75
100
%
95
174
75
50
8837 62 173118 143128 157104 249
8.1 8.2 8.3 8.4 8.5 8.6 8.7 8.8 8.9 9.0 9.1
0.25
0.50
0.75
1.00
1.25
(x1,000,000)TIC
7 / 97 / 9
Results and Discussion
Table 1: Evaluation of BFB Spectra from 3 Different Runs across a Long Sequence, Compared to US EPA Method 624 Criteria
m/z Spectrum Check CriteriaResult Result Result
Run #1 Status Run #10 Status Run #30 Status
50 15 to 40% of mass 95 16.0 Pass 15.6 Pass 15.4 Pass
75 30 to 60% of mass 95 41.2 Pass 41.5 Pass 43.5 Pass
95Base Peak, 100% Relative
Abundance100.0 Pass 100.0 Pass 100.0 Pass
96 5 to 9% of mass 95 6.5 Pass 6.9 Pass 7.0 Pass
173 < 2% of mass 174 1.0 Pass 1.6 Pass 1.5 Pass
174 > 50% of mass 95 60.8 Pass 59.3 Pass 61.6 Pass
175 5 to 9% of mass 174 7.5 Pass 7.4 Pass 7.4 Pass
176 > 95% but < 101% of mass174 97.2 Pass 100.6 Pass 97.0 Pass
177 5 to 9% of mass 176 6.6 Pass 5.6 Pass 6.4 Pass
8 / 98 / 9
Initial Demonstration of ProficiencyA series of nine calibration standards across the range of 0.5 to 200 µg/L (parts-per-billion, ppb) was prepared.
The three internal standards (IS) were held constant at 30 µg/L, and the three surrogate standards (Surr) were held constant at 10 µg/L in all samples analyzed.
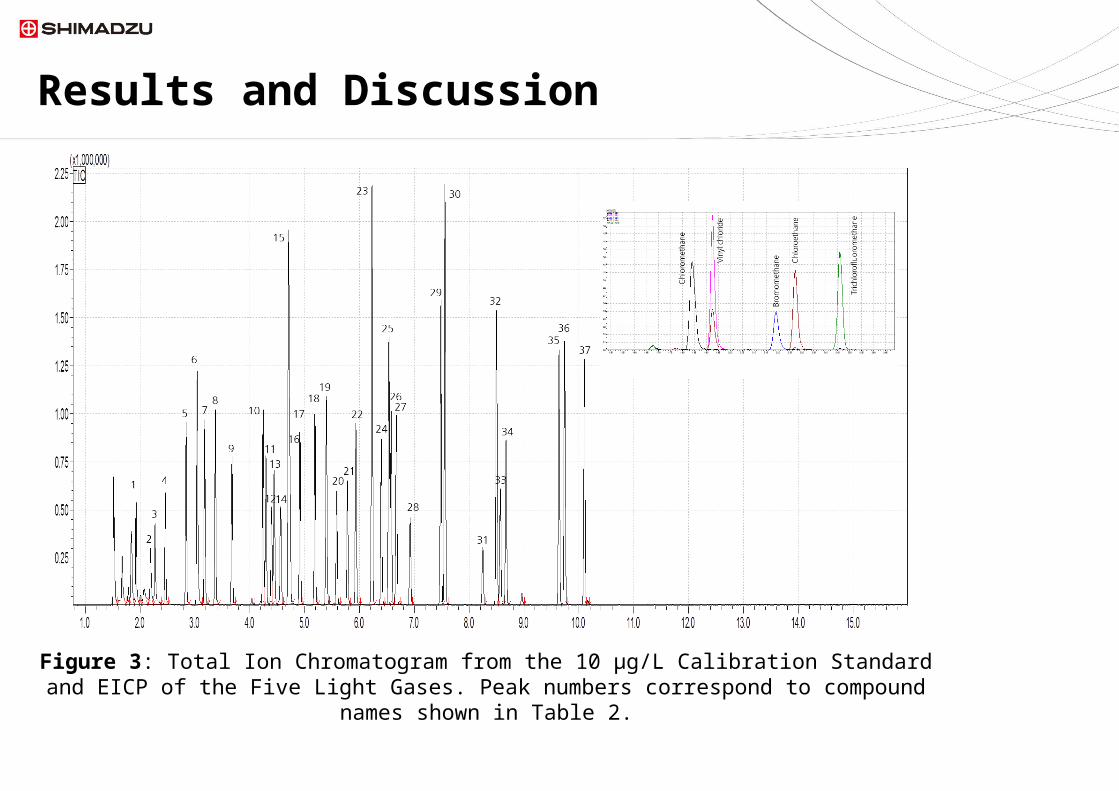
A total ion chromatogram (TIC) from the 10 µg/L standard is shown in Figure 3, along with an expanded view of the chromatography of the early-eluting light gases.
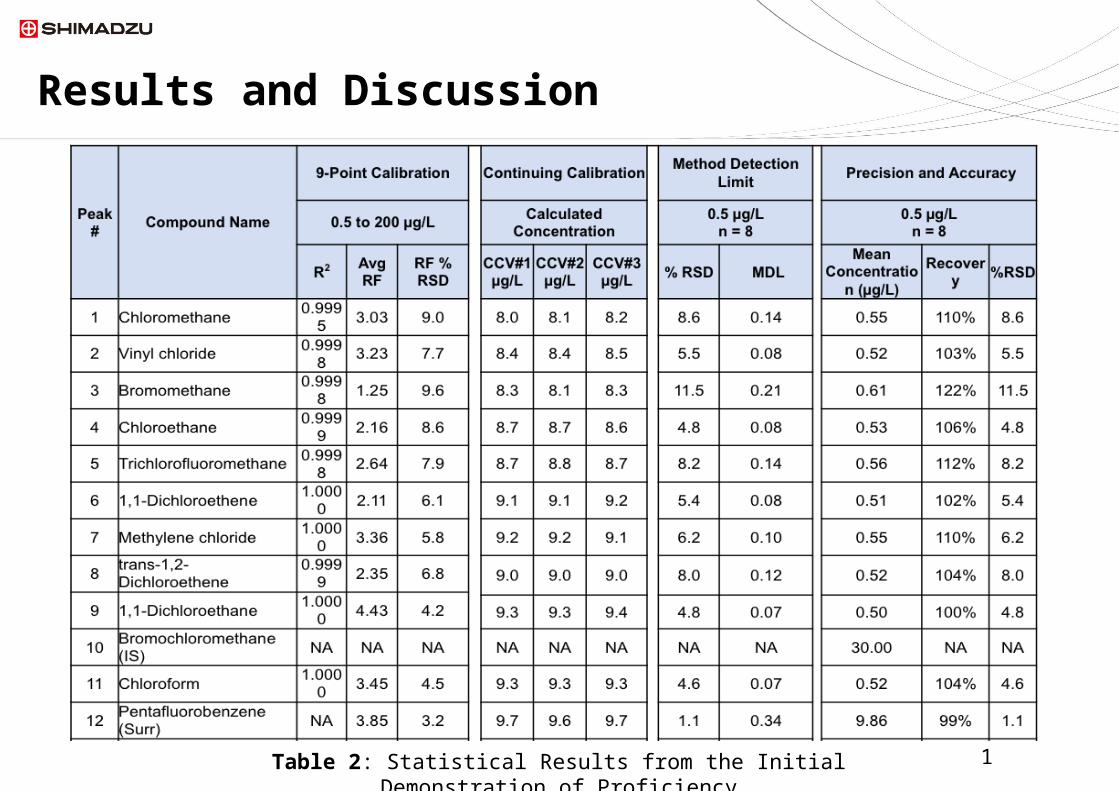
Results from the initial demonstration of proficiency are shown in Table 2.
Results and Discussion
9 / 99 / 9
Results and Discussion
Figure 3: Total Ion Chromatogram from the 10 µg/L Calibration Standard and EICP of the Five Light Gases. Peak numbers correspond to compound names shown in Table 2.
10 / 910 / 9
Results and Discussion
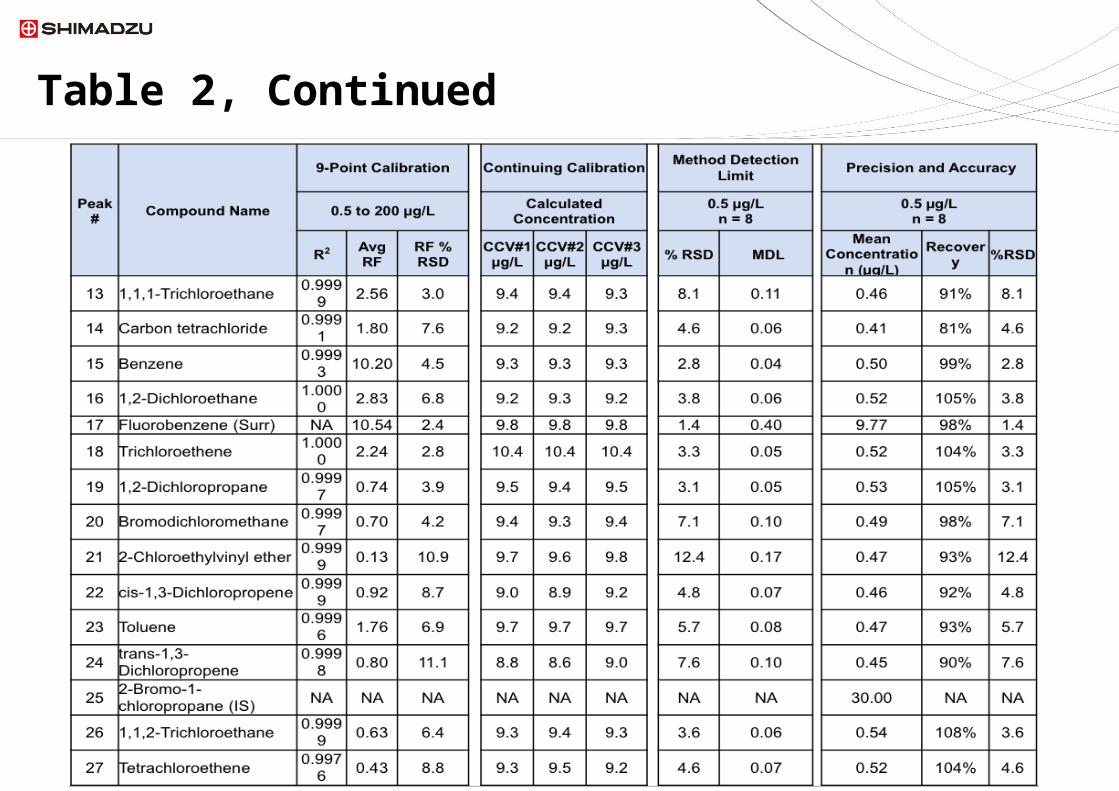
Table 2: Statistical Results from the Initial Demonstration of Proficiency
11 / 911 / 9
Table 2, Continued
12 / 912 / 9
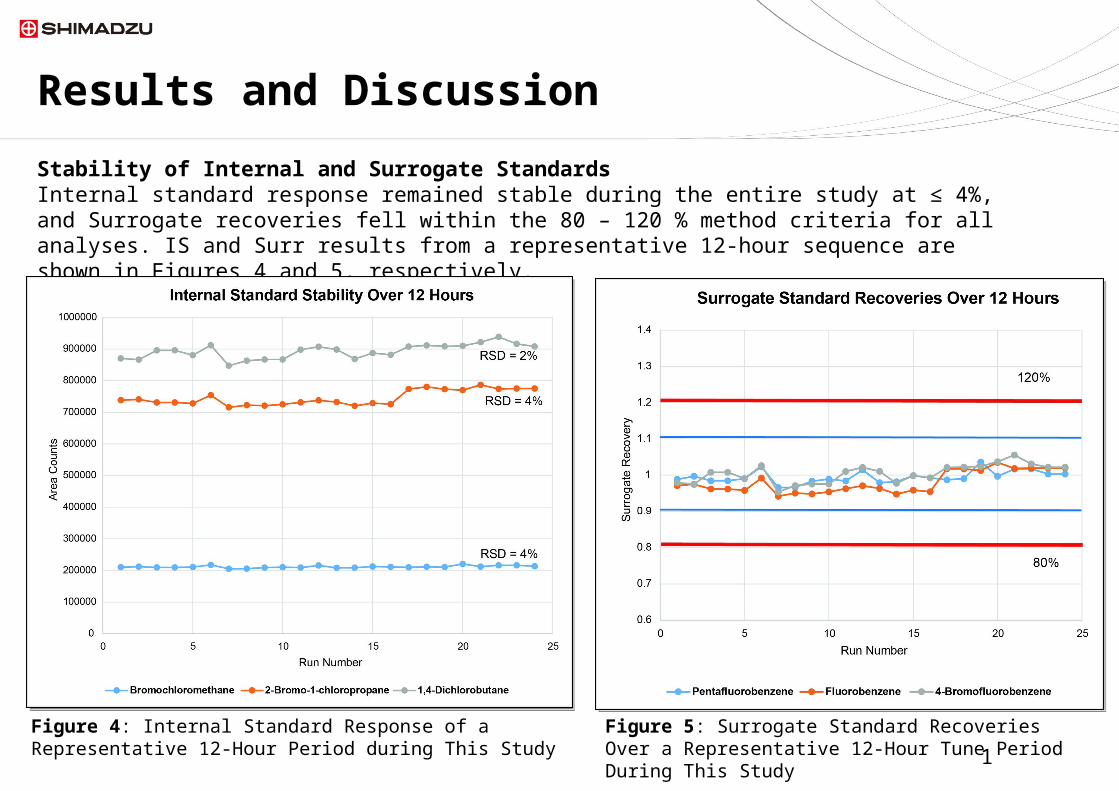
Stability of Internal and Surrogate StandardsInternal standard response remained stable during the entire study at ≤ 4%, and Surrogate recoveries fell within the 80 – 120 % method criteria for all analyses. IS and Surr results from a representative 12-hour sequence are shown in Figures 4 and 5, respectively.
Figure 4: Internal Standard Response of a Representative 12-Hour Period during This Study
Figure 5: Surrogate Standard Recoveries Over a Representative 12-Hour Tune Period During This Study
Results and Discussion
13 / 913 / 9
Summary and Conclusions
The instrumentation and analytical conditions shown here have been demonstrated to provide outstanding results for US EPA Method 624, far exceeding all existing method criteria.
The narrow-bore capillary column and Constant Linear Velocity mode provided outstanding chromatography for all compounds, including the early-eluting light gases, in less than 10 minutes.
Calibration curves over narrow or wide ranges can be used to meet the project or contract needs.
MDLs are easily 10-fold lower than the MDLs cited in the method, and a high level of precision and accuracy can be expected across any calibration range, particularly at the lower concentrations.
14 / 914 / 9
References
1. Shimadzu Guide to US EPA Method 624 for Analysis of Volatile Organic Compounds in Wastewater, GCMS Application News No. GCMS-1406.
2. Shimadzu Guide to BFB Tuning for Analysis of Volatile Organic Compounds, GCMS Application News No. GCMS-1405.
3. Appendix A to Part 136, Methods for Organic Chemical Analysis of Municipal and Industrial Wastewater, Method 624 – Purgeables.
4. Definition and Procedure for the Determination of the Method Detection Limit. Fed. Regist. 1984. 49 (209), Appendix B to Part 136.
15 / 9
Thank you for viewing this presentation. Should you have any questions or require additional information about our research, products or services, please visit our support page: www.ssi.shimadzu.com/support/
@shimadzussiFollow us on Twitter
Need More Info?