Embed Size (px)
Citation preview
Dale Walker
Agilent GCMS
Applications Engineer
Analyzing PCB Aroclors by Agilent's
7000B GCMS tandem quadrupole Mass
Spectrometer

Dale Walker
Agilent GCMS
Applications Engineer
Analyzing PCB Aroclors by Agilent's
7000B GCMS tandem quadrupole Mass Spectrometer
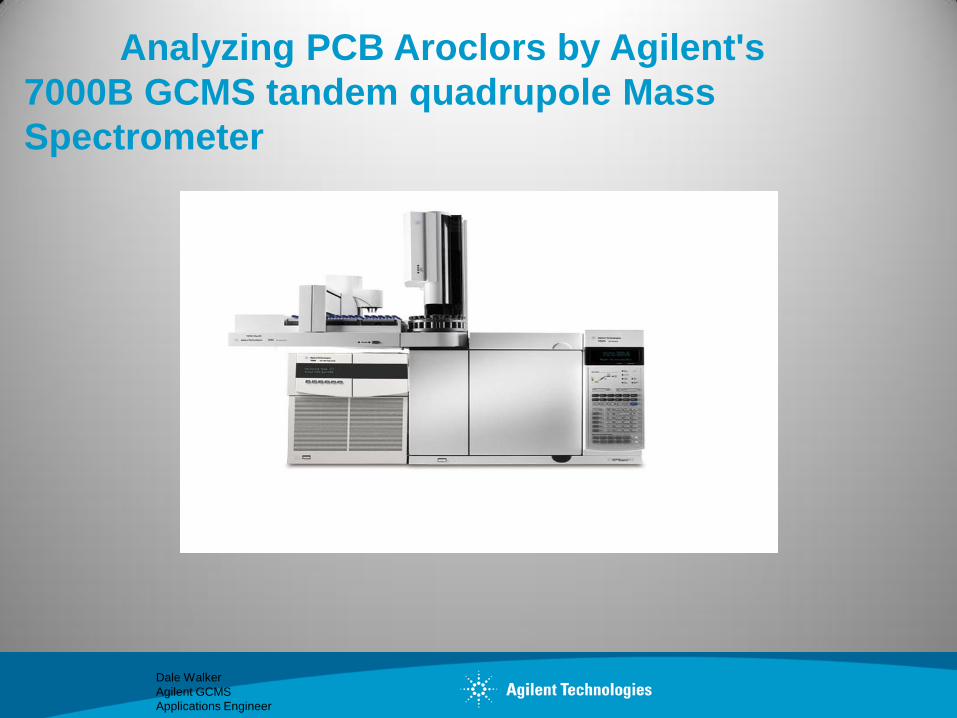
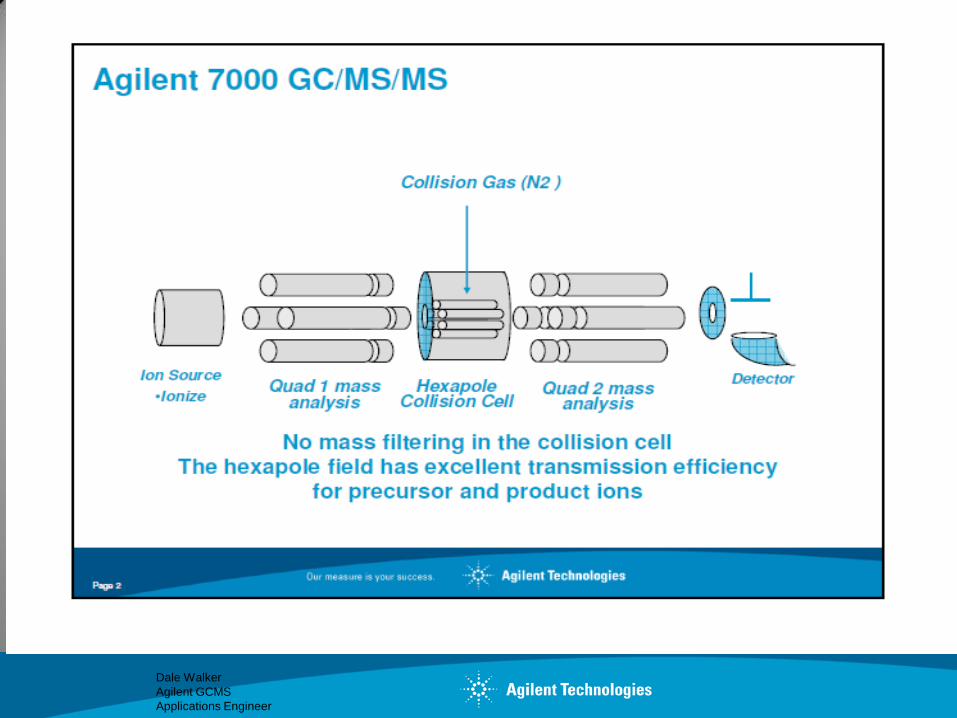
Providing positive identification of PCB Aroclors using the
Agilent 7000B GC/MS/MS
While maintaining ECD detection limits
Providing Positive identification in a single run
Dale Walker
Agilent GCMS
Applications Engineer
Dale Walker
Agilent GCMS
Applications Engineer

Dale Walker
Agilent GCMS
Applications Engineer
Aroclor Patterns
Dale Walker
Agilent GCMS
Applications Engineer
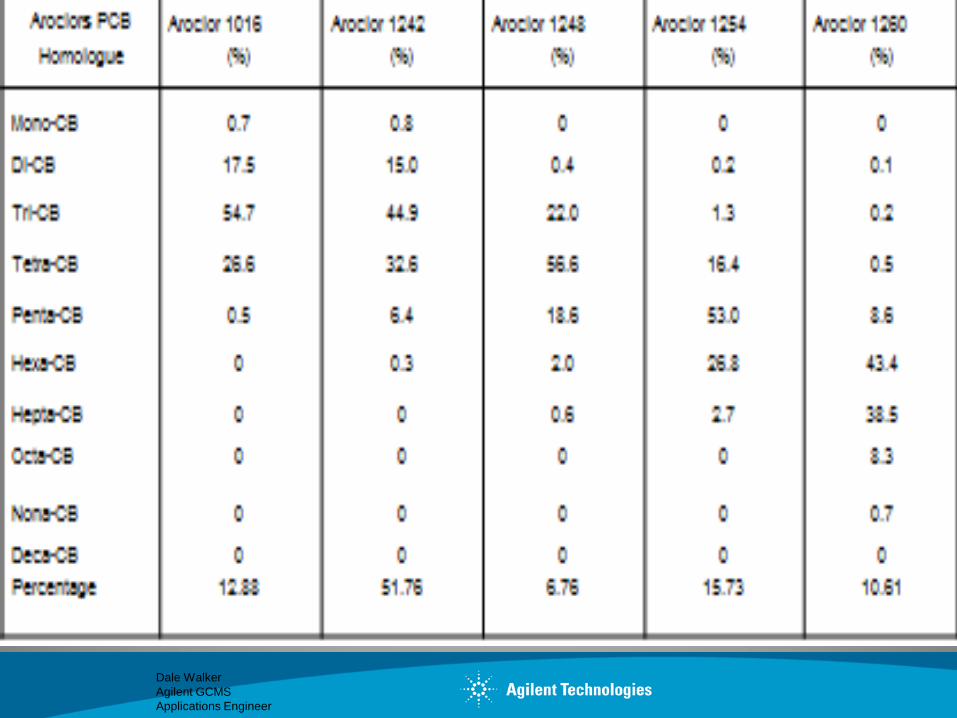
II. PCB Congener Composition of Aroclors A detailed analyses of the PCB congener distributions present in Aroclors 1016, 1242, 1248, 1254, and 1260 Note that the most abundant homologue groups are the di- and tri-chlorinated biphenyls for the low chlorinated Aroclors (1016 and 1242) While penta-chlorinated biphenyls were more abundant in the higher chlorinated Aroclors (1248, 1254 and 1260). Tetra-chlorinated biphenyls were abundant in both low chlorinated and higher chlorinated Aroclors.
Dale Walker
Agilent GCMS
Applications Engineer
Dale Walker
Agilent GCMS
Applications Engineer
Transitioning to
Transitioning to
Transitioning to
Transitioning to
Transitioning to
Transitioning to
Transitioning to
Transitioning to
Transitioning to
Transitioning to
Transitioning to
Transitioning to
Dale Walker
Agilent GCMS
Applications Engineer
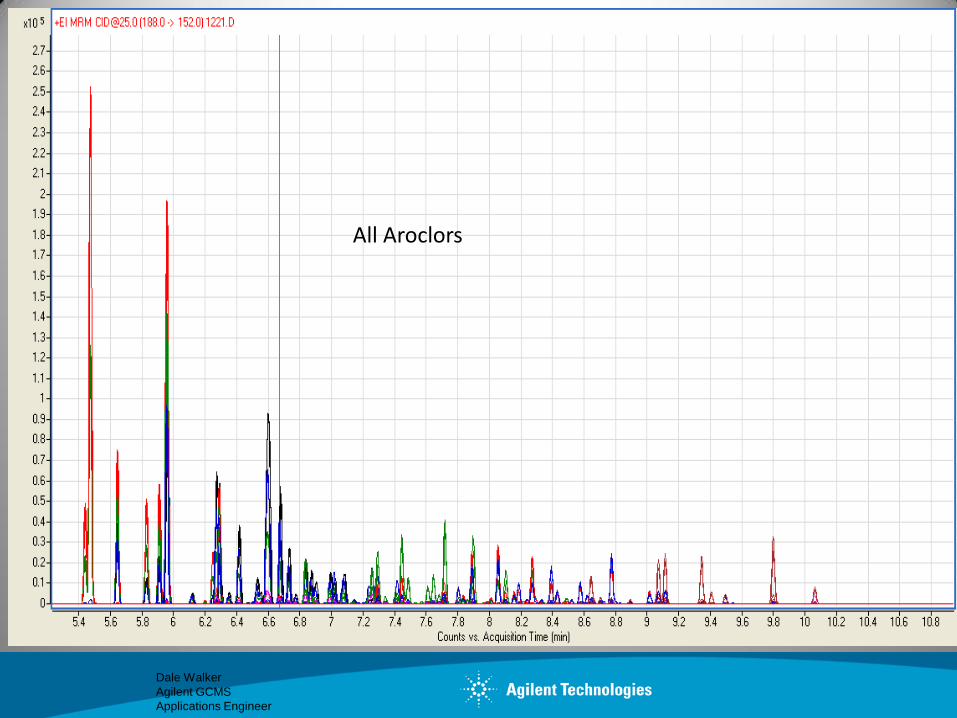
All Aroclors
Dale Walker
Agilent GCMS
Applications Engineer
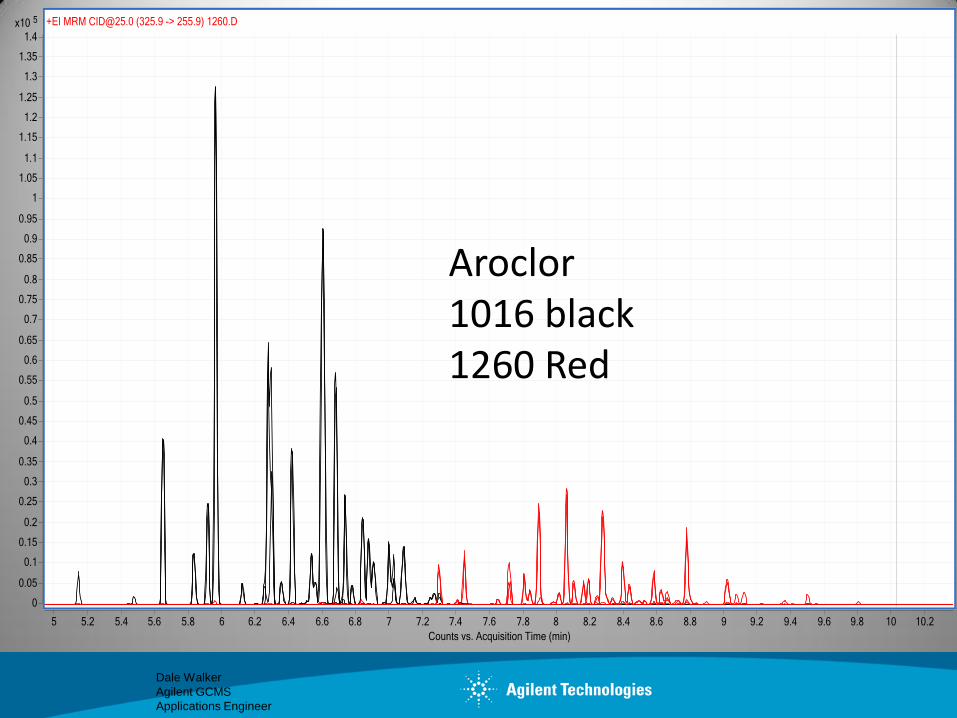
Aroclor 1016 black 1260 Red
Dale Walker
Agilent GCMS
Applications Engineer
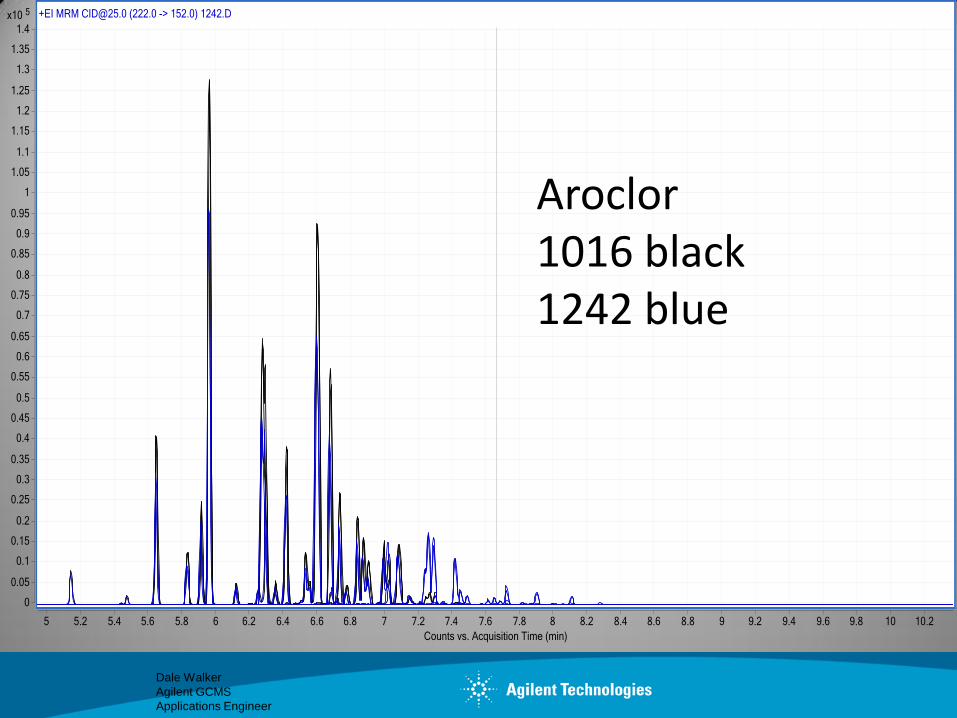
Aroclor 1016 black 1242 blue
Dale Walker
Agilent GCMS
Applications Engineer
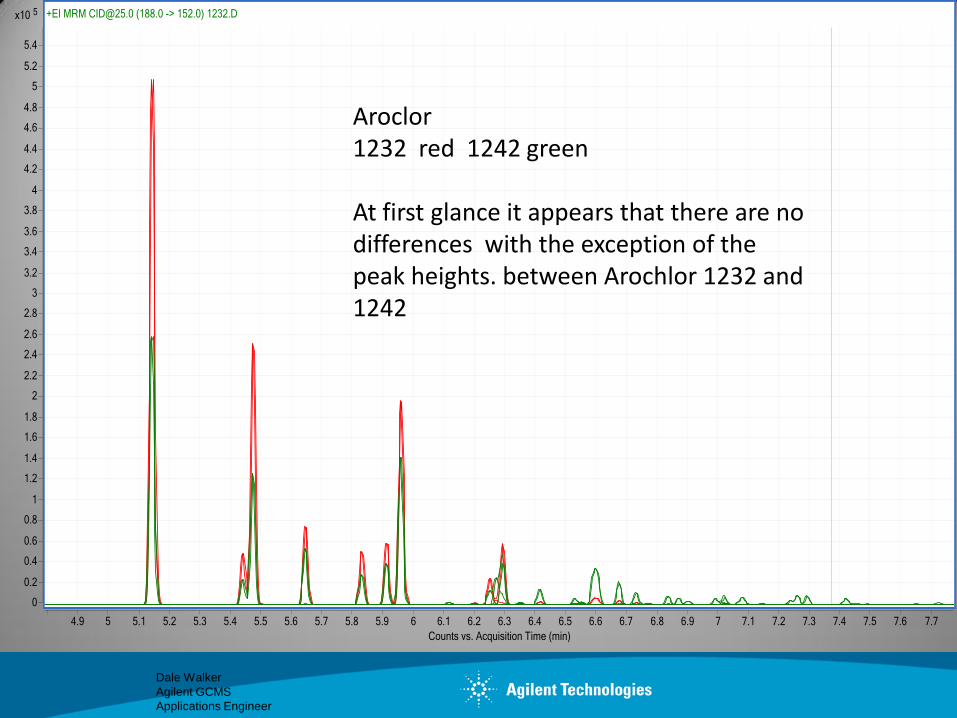
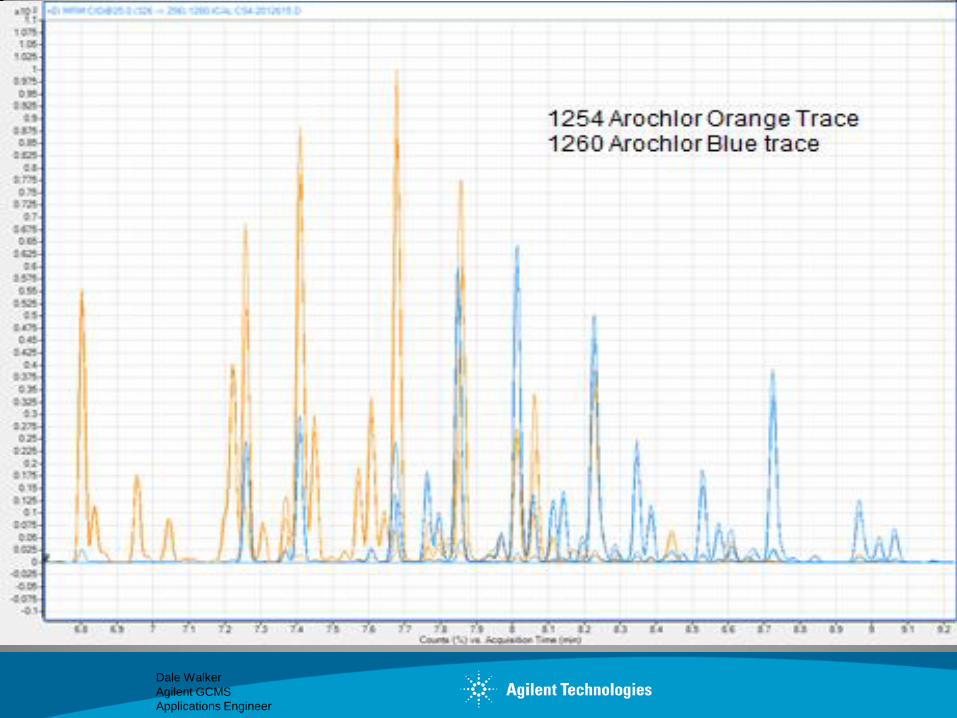
Aroclor 1232 red 1242 green At first glance it appears that there are no differences with the exception of the peak heights. between Arochlor 1232 and 1242
Dale Walker
Agilent GCMS
Applications Engineer
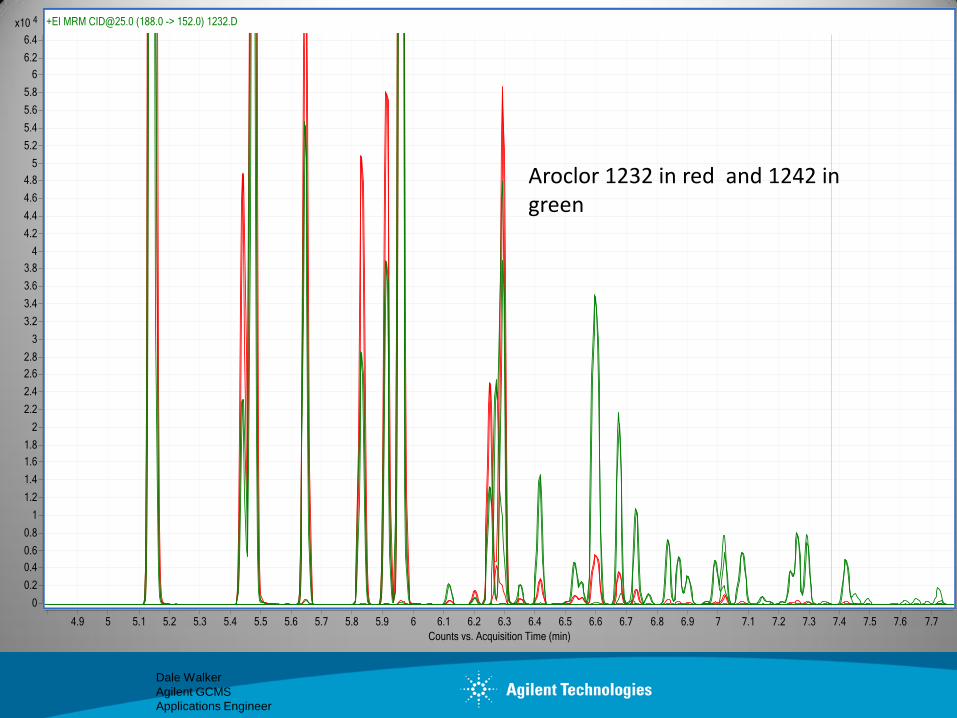
Aroclor 1232 in red and 1242 in green
Dale Walker
Agilent GCMS
Applications Engineer
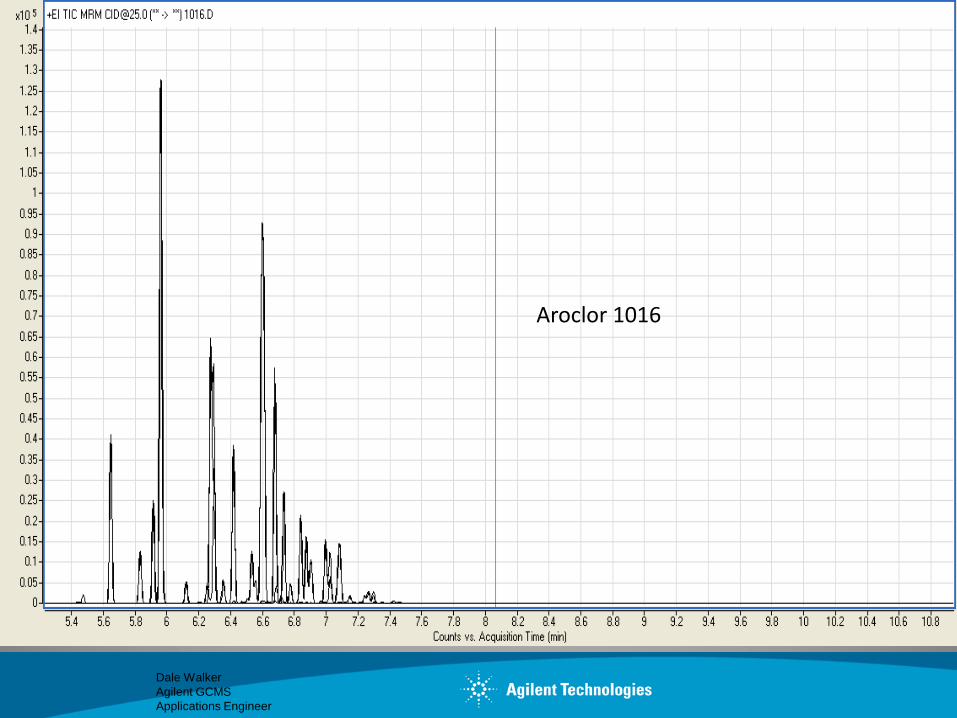
Aroclor 1016
Dale Walker
Agilent GCMS
Applications Engineer
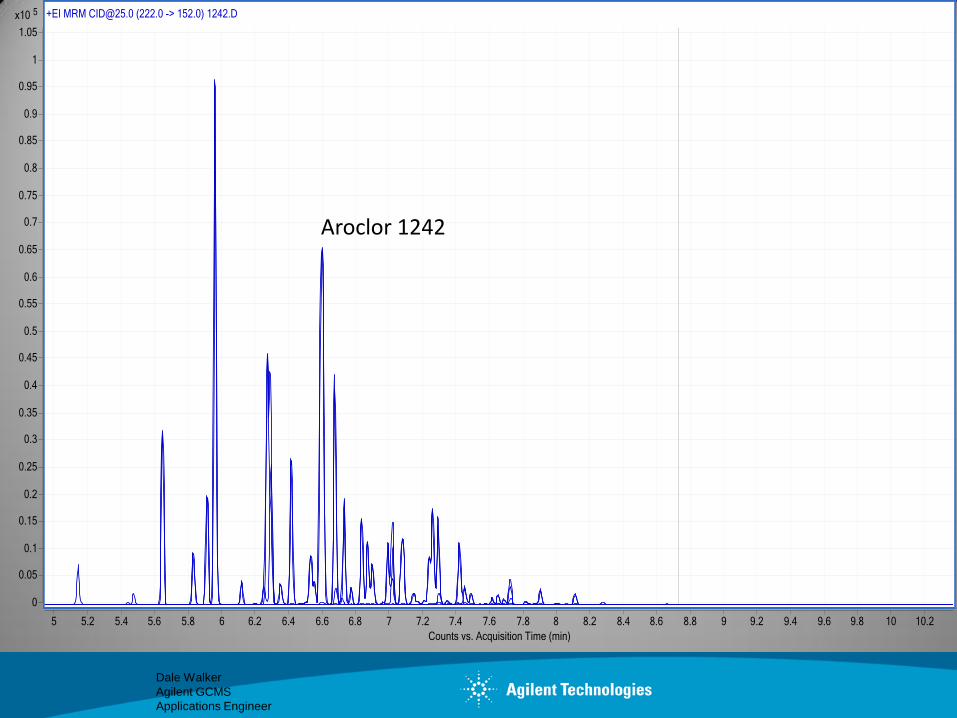
Aroclor 1242
Dale Walker
Agilent GCMS
Applications Engineer
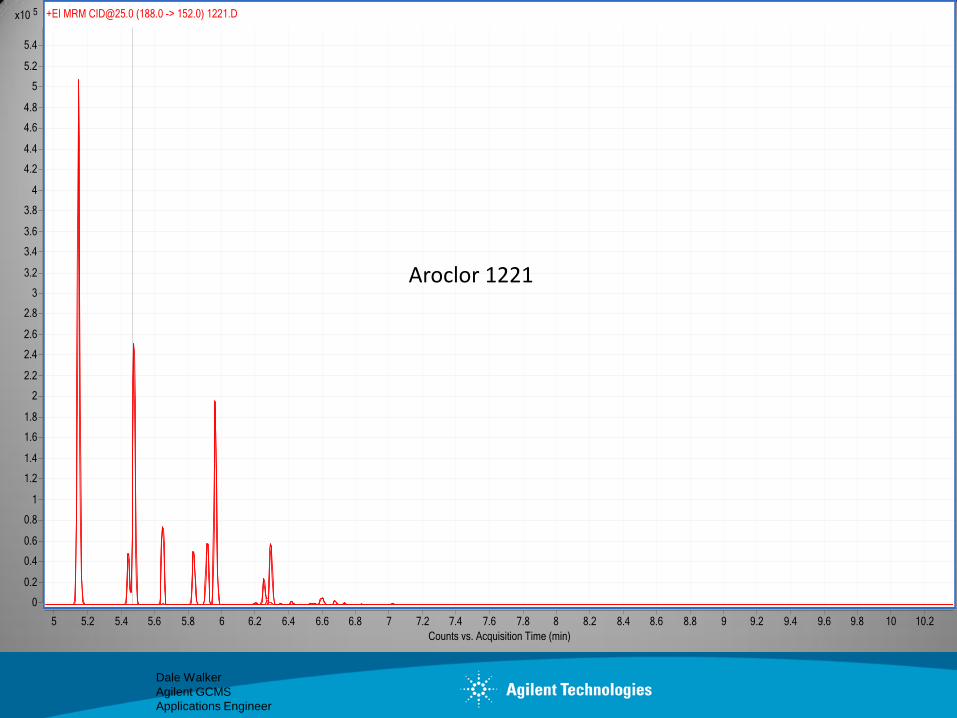
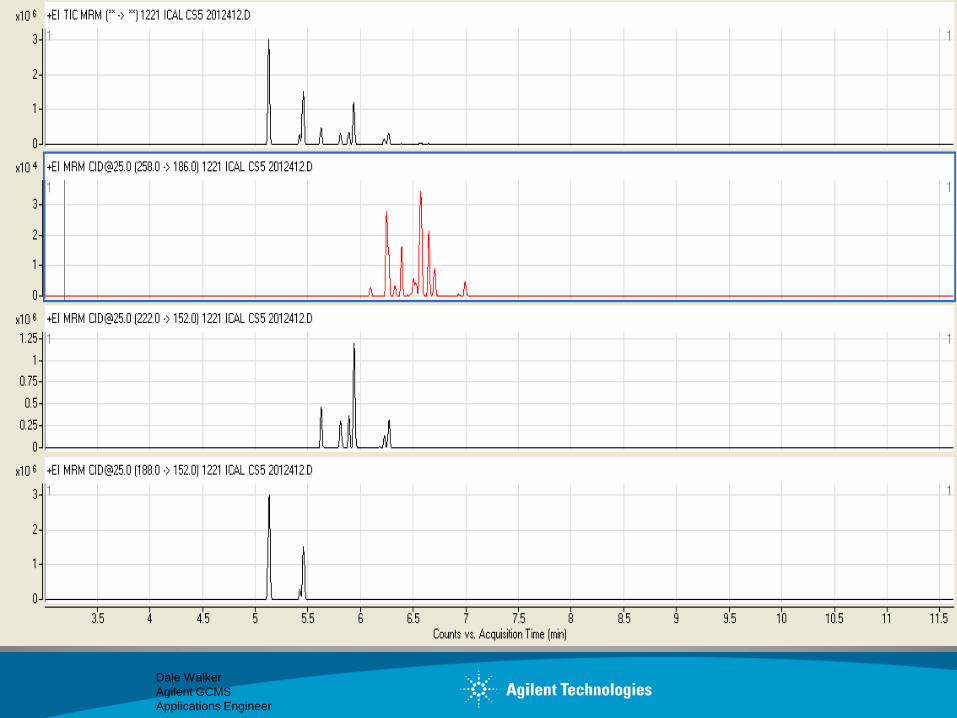
Aroclor 1221
Dale Walker
Agilent GCMS
Applications Engineer
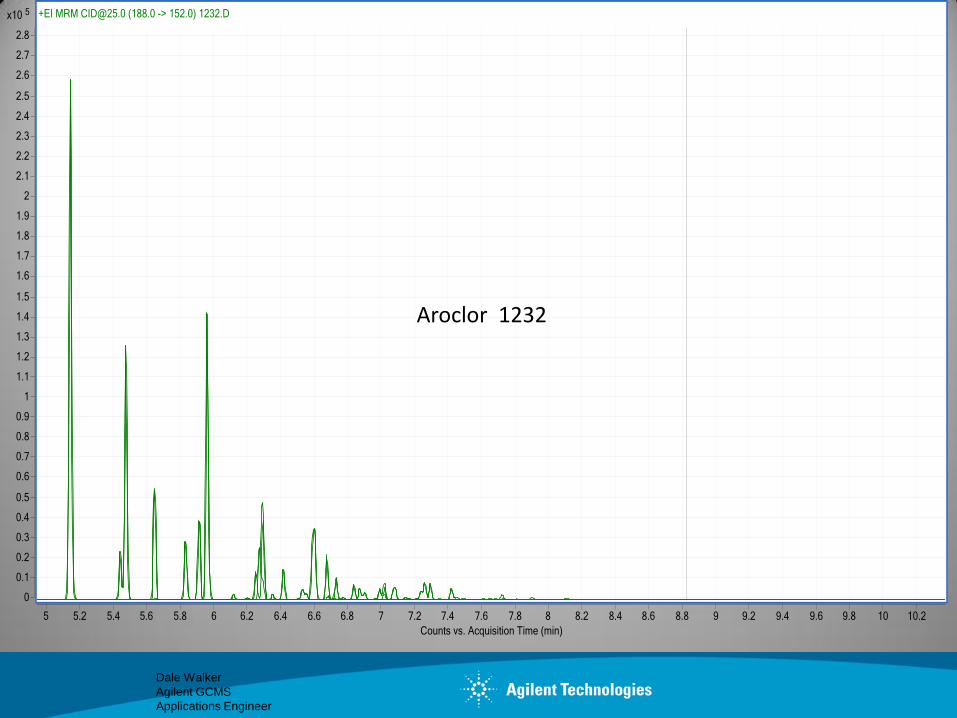
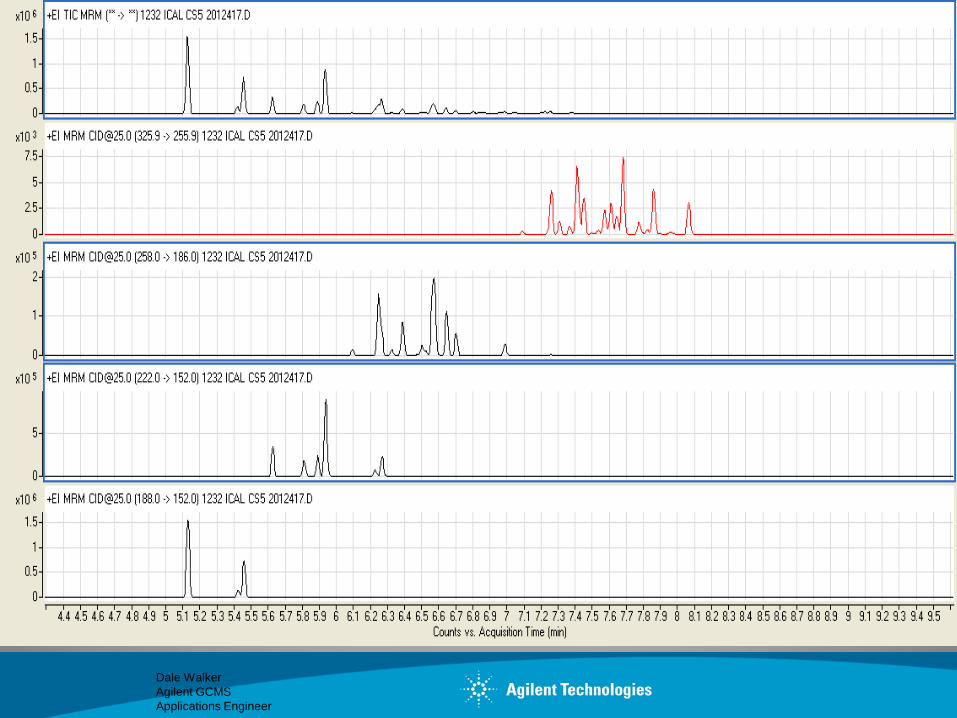
Aroclor 1232
Dale Walker
Agilent GCMS
Applications Engineer
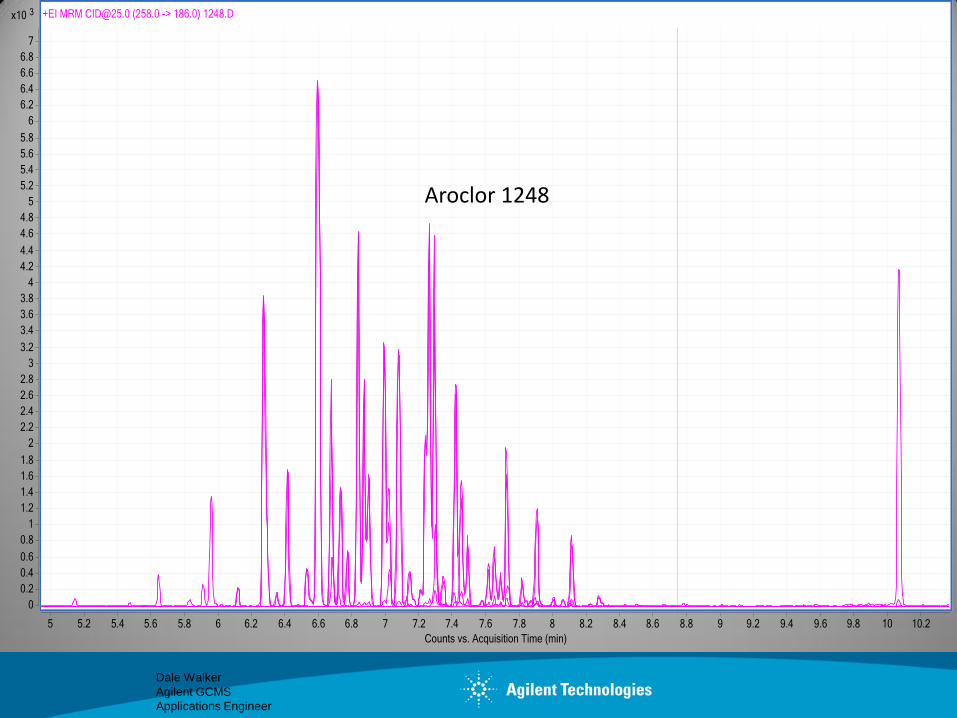
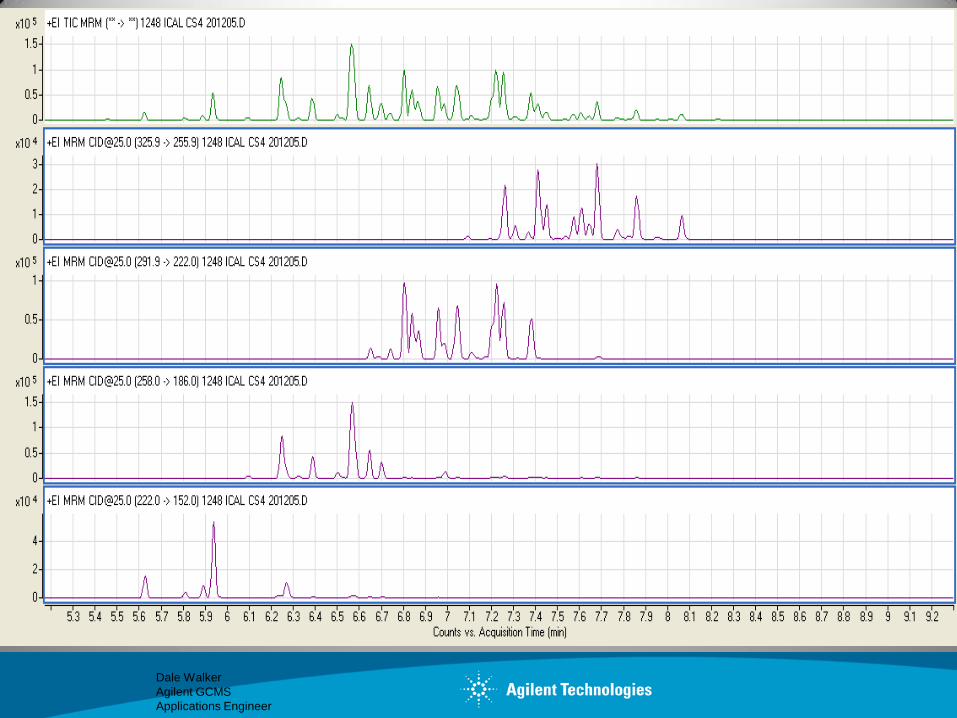
Aroclor 1248
Dale Walker
Agilent GCMS
Applications Engineer
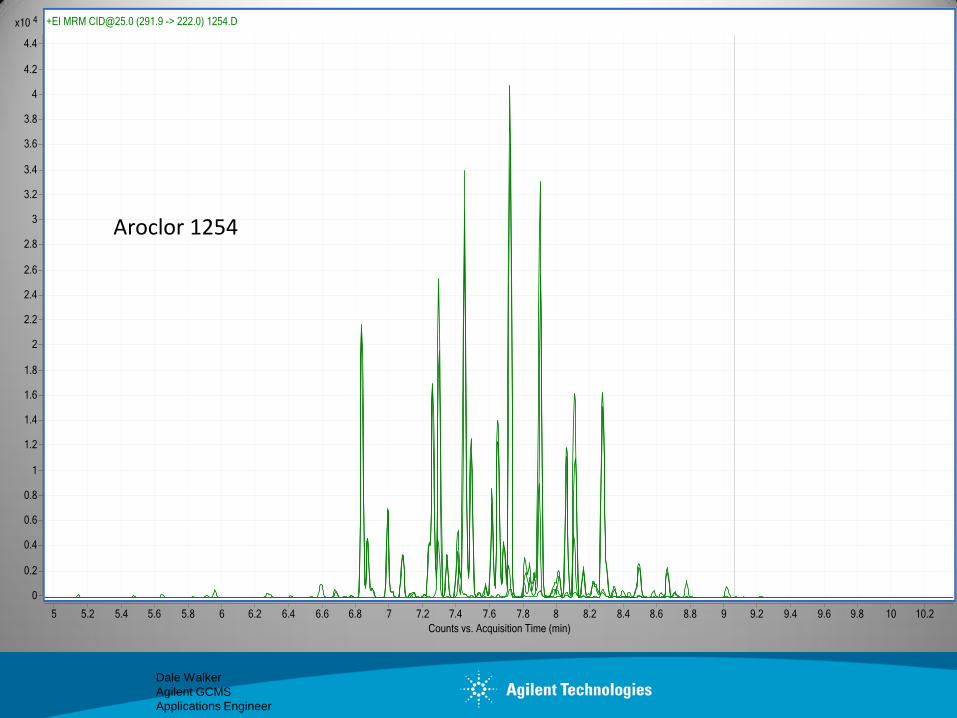
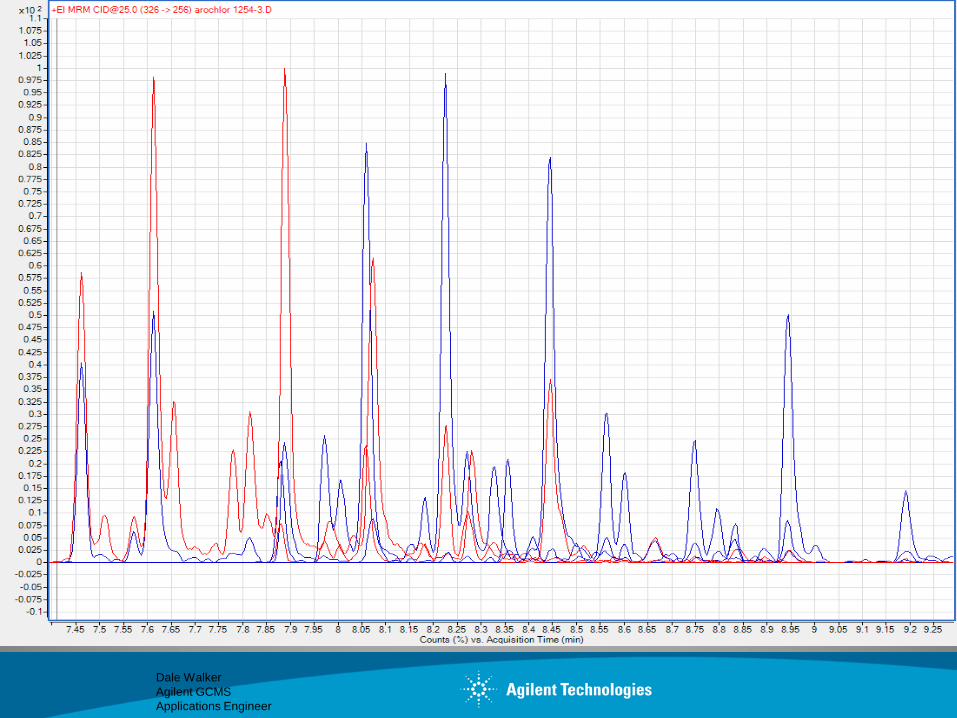
Aroclor 1254
Dale Walker
Agilent GCMS
Applications Engineer
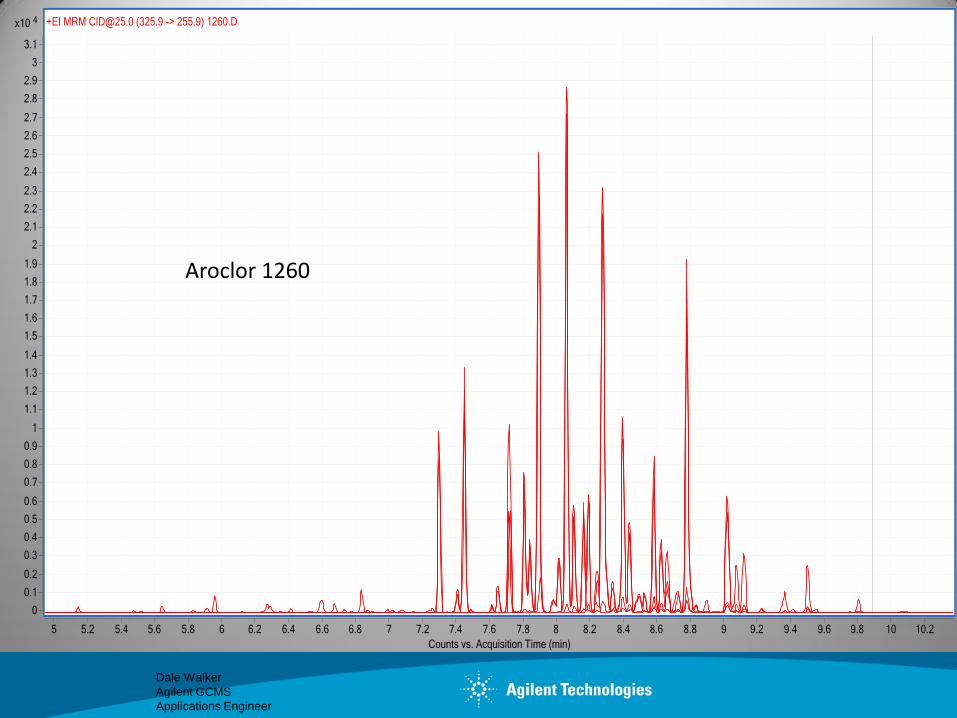
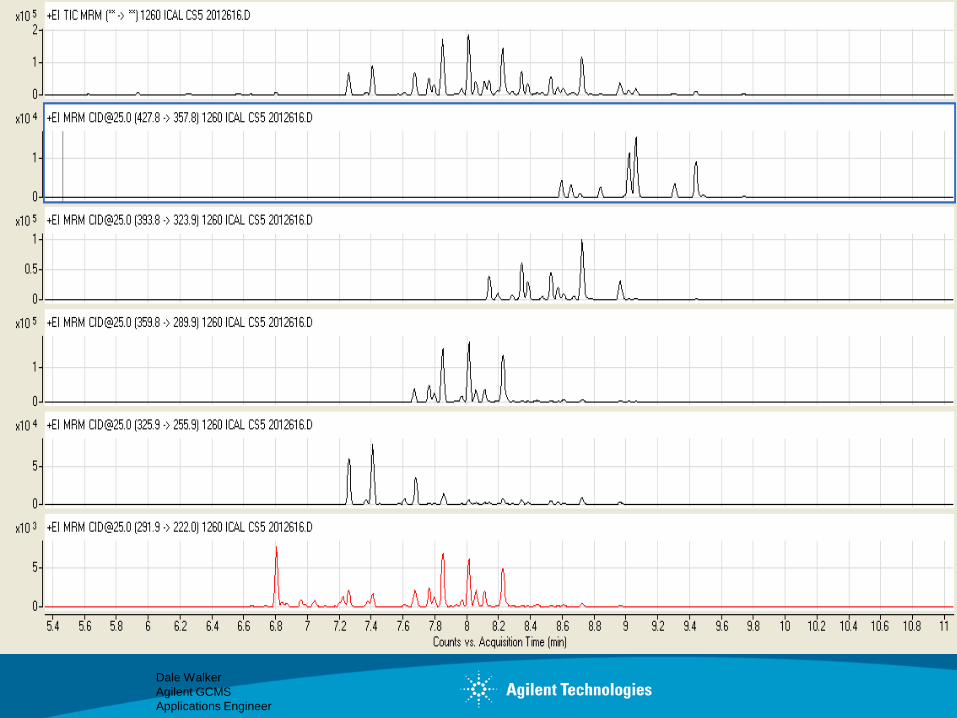
Aroclor 1260
Dale Walker
Agilent GCMS
Applications Engineer
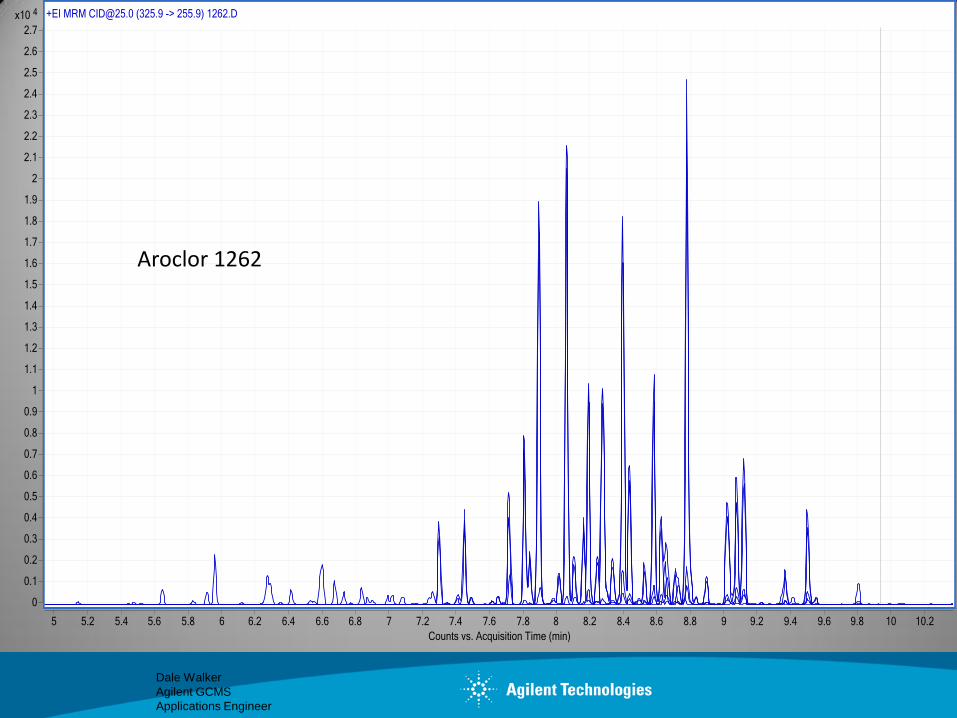
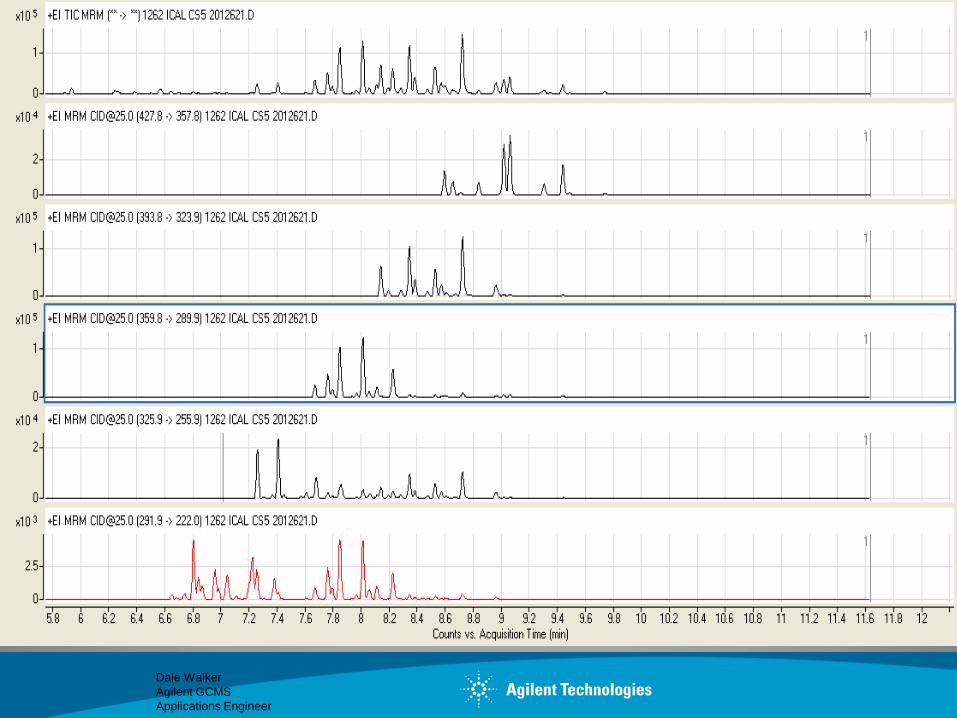
Aroclor 1262
Dale Walker
Agilent GCMS
Applications Engineer
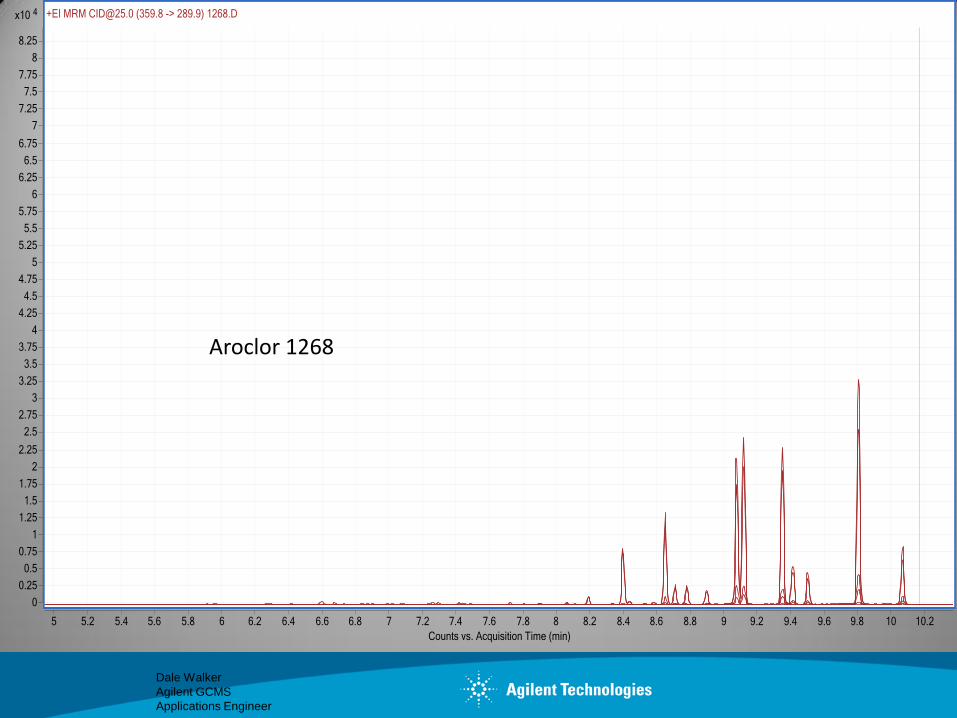
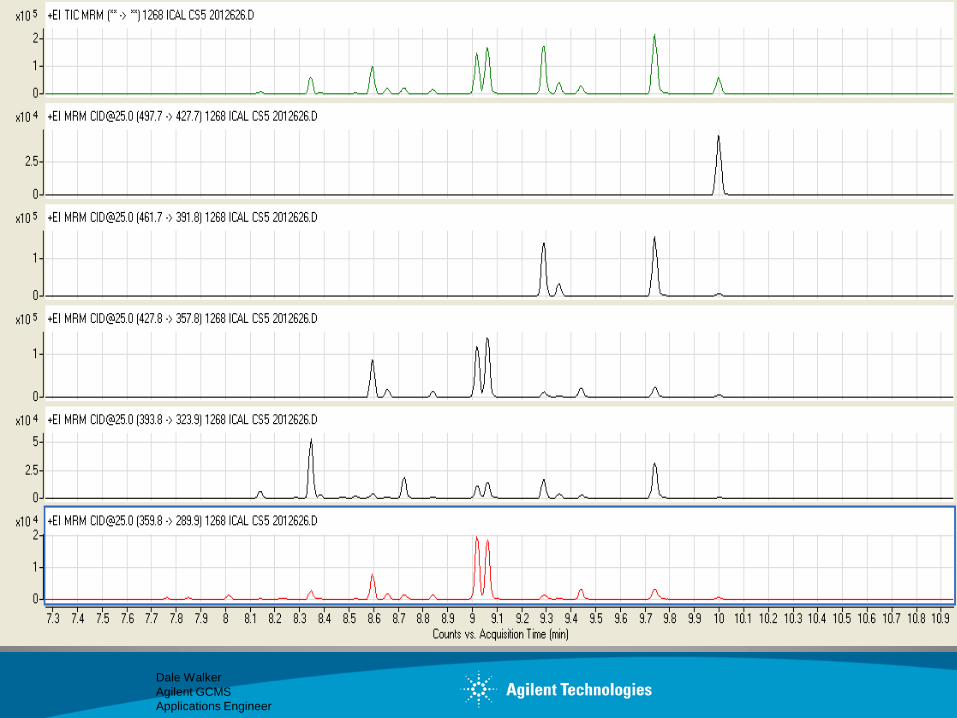
Aroclor 1268
Dale Walker
Agilent GCMS
Applications Engineer
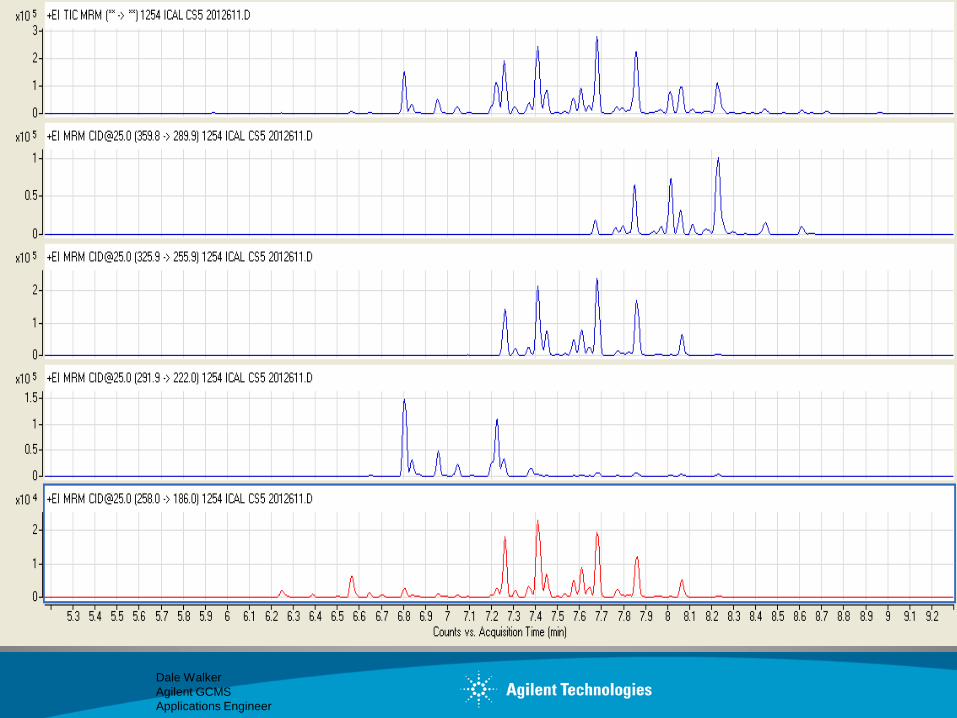
Lets take a closer look at what
makes up the TIC patterns
Dale Walker
Agilent GCMS
Applications Engineer
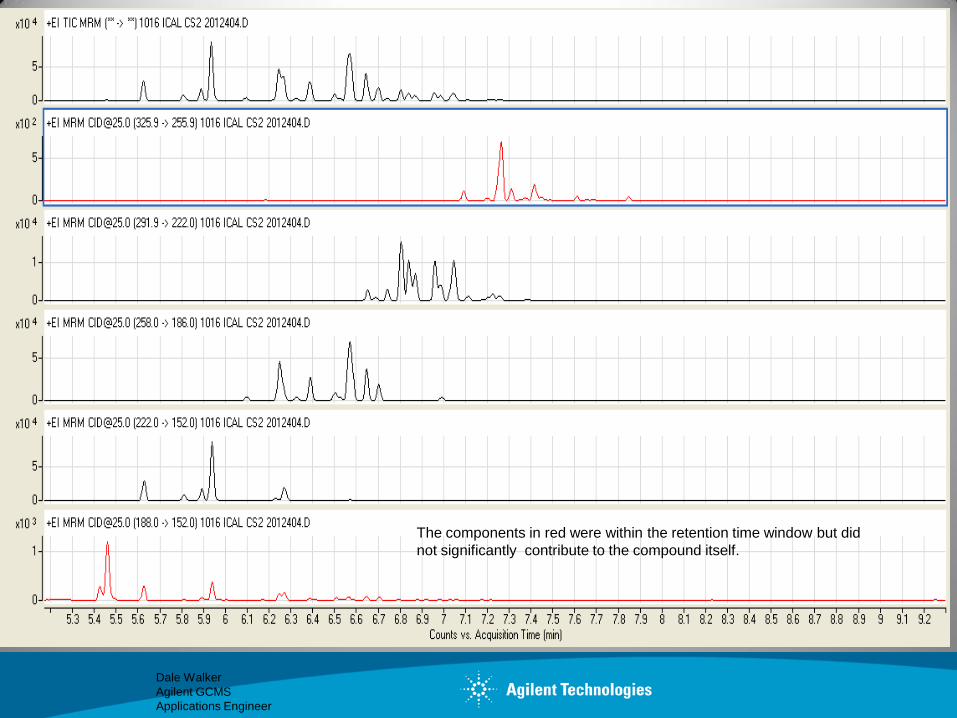
The components in red were within the retention time window but did
not significantly contribute to the compound itself.
Dale Walker
Agilent GCMS
Applications Engineer
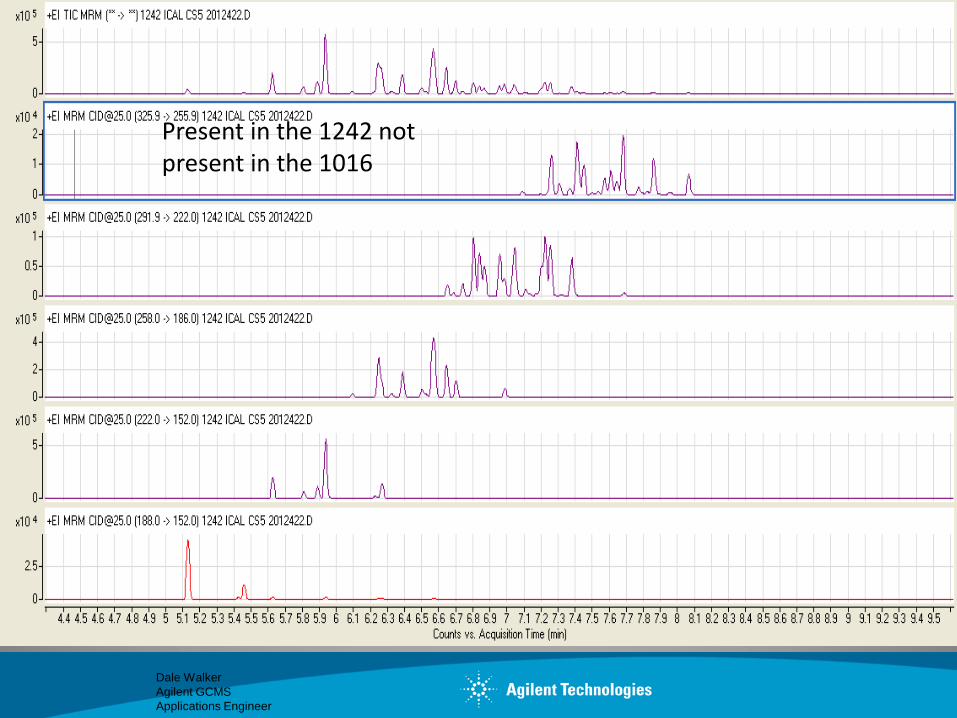
Present in the 1242 not present in the 1016
Dale Walker
Agilent GCMS
Applications Engineer
Dale Walker
Agilent GCMS
Applications Engineer
Dale Walker
Agilent GCMS
Applications Engineer

Dale Walker
Agilent GCMS
Applications Engineer
Dale Walker
Agilent GCMS
Applications Engineer
Dale Walker
Agilent GCMS
Applications Engineer
Dale Walker
Agilent GCMS
Applications Engineer
Dale Walker
Agilent GCMS
Applications Engineer
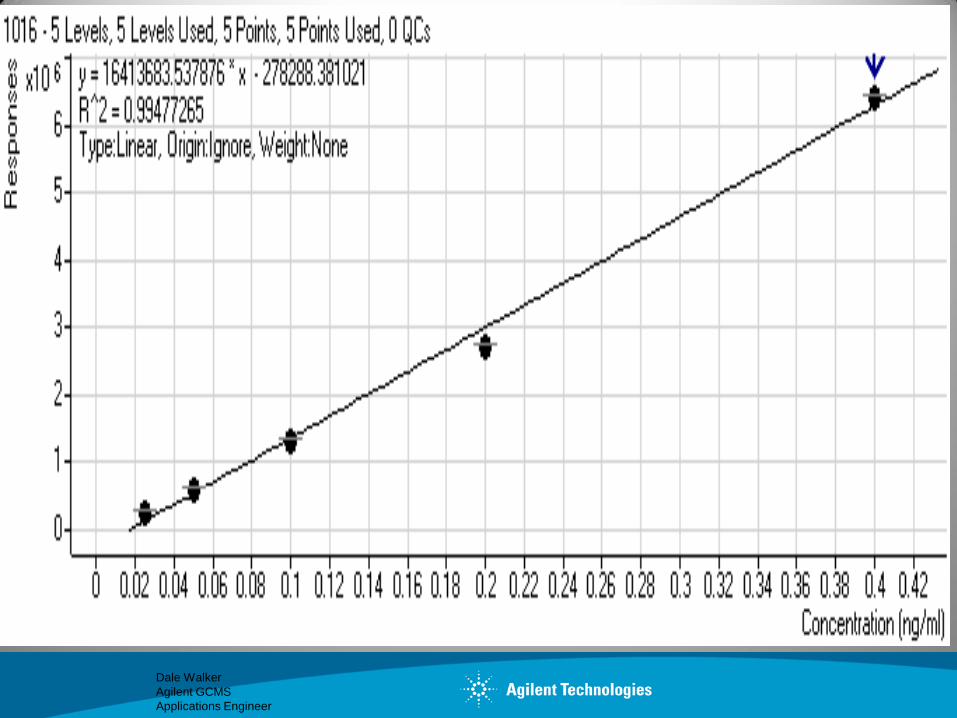
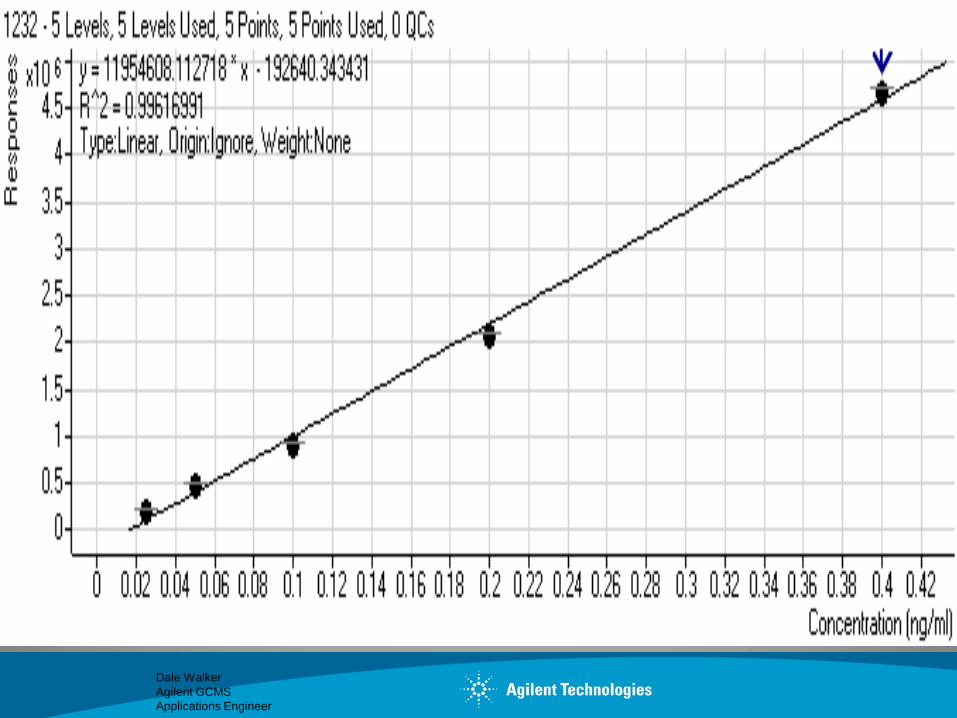
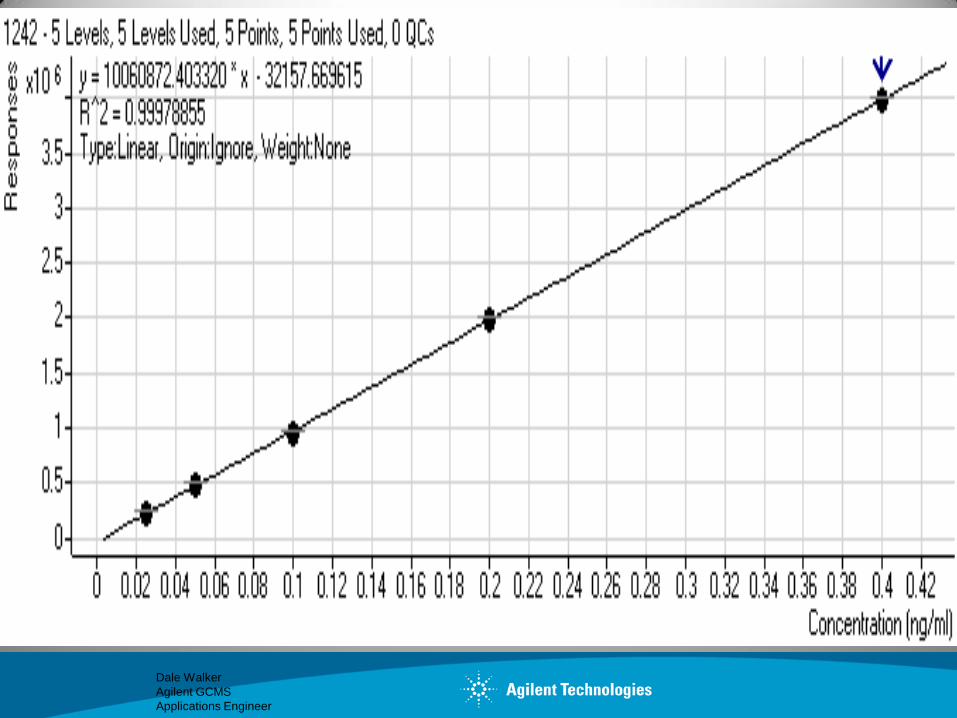
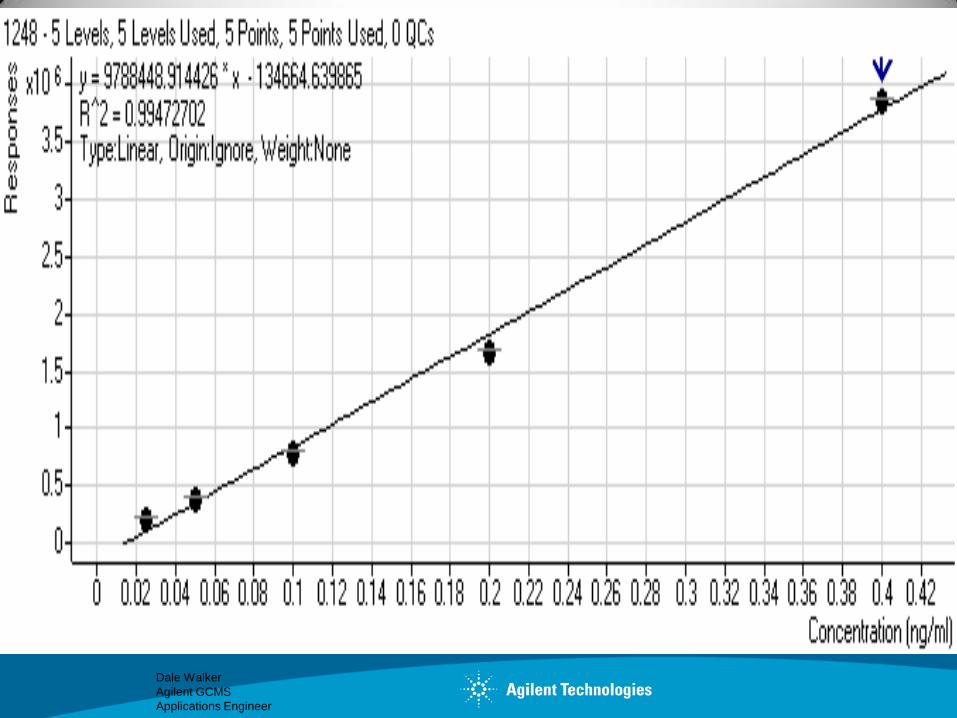
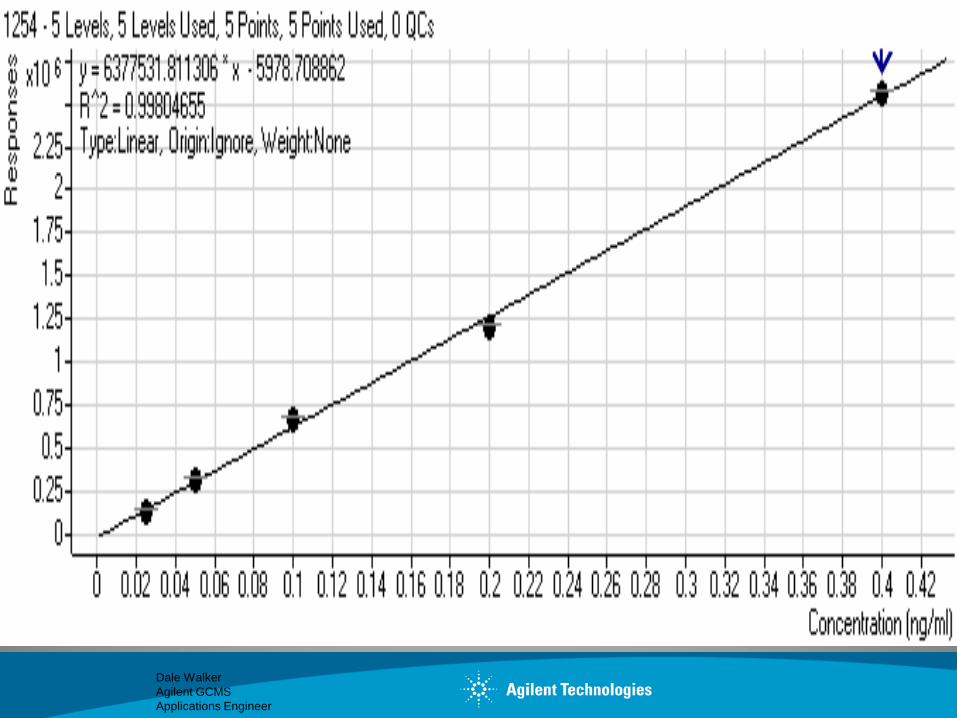
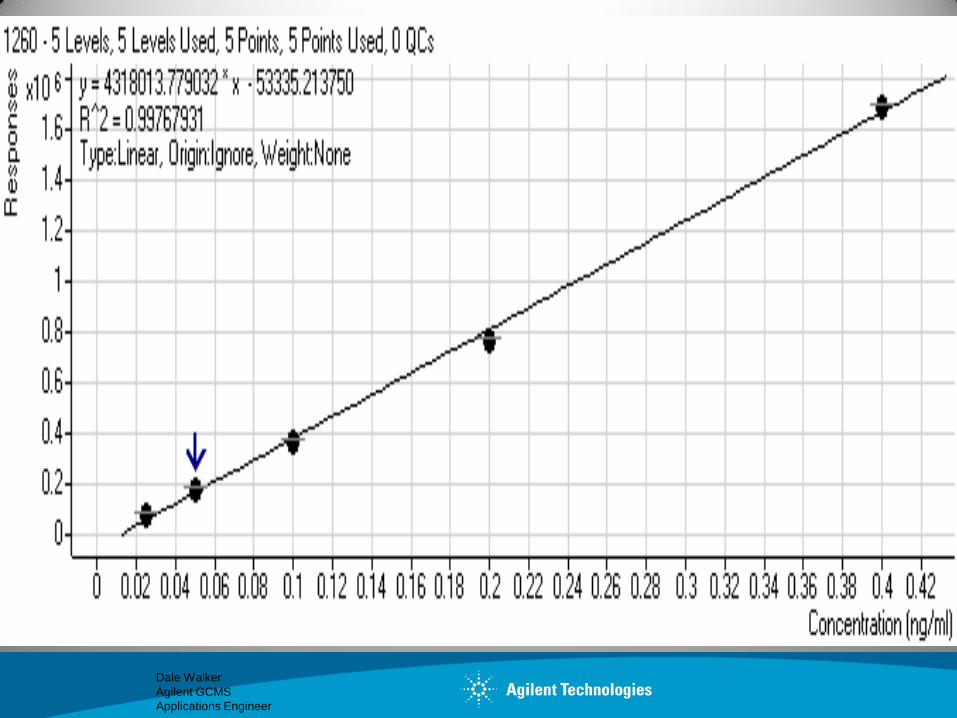
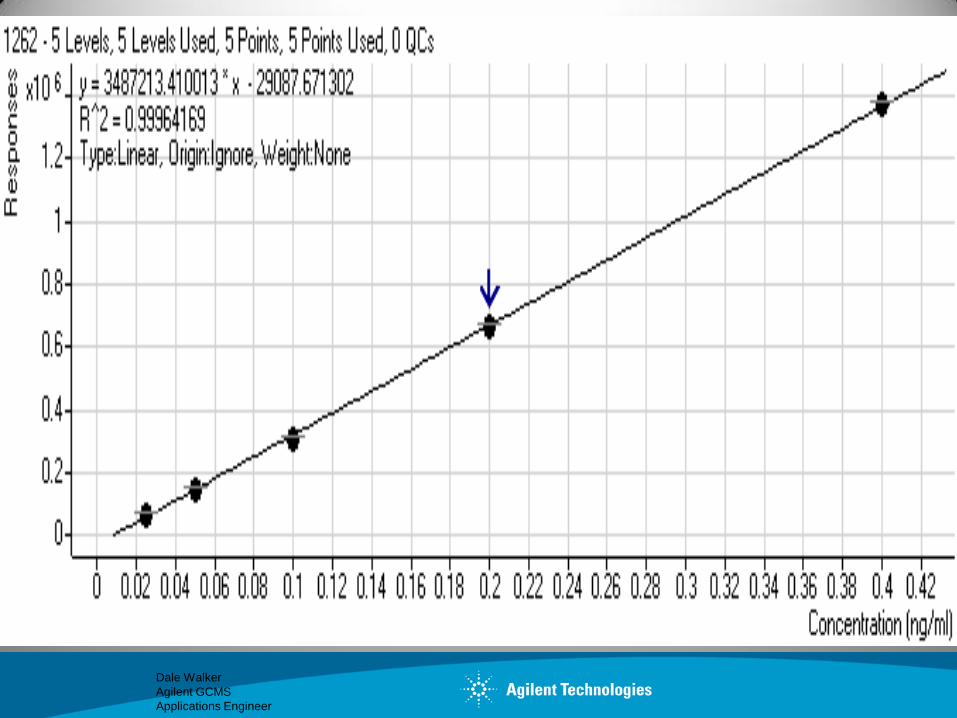
The process of identifying the
compound of interest starts by first
running each of the PCB’s as an
individual curve.
Dale Walker
Agilent GCMS
Applications Engineer
Dale Walker
Agilent GCMS
Applications Engineer
Dale Walker
Agilent GCMS
Applications Engineer
Dale Walker
Agilent GCMS
Applications Engineer
Dale Walker
Agilent GCMS
Applications Engineer
Dale Walker
Agilent GCMS
Applications Engineer
Dale Walker
Agilent GCMS
Applications Engineer

Dale Walker
Agilent GCMS
Applications Engineer
Dale Walker
Agilent GCMS
Applications Engineer
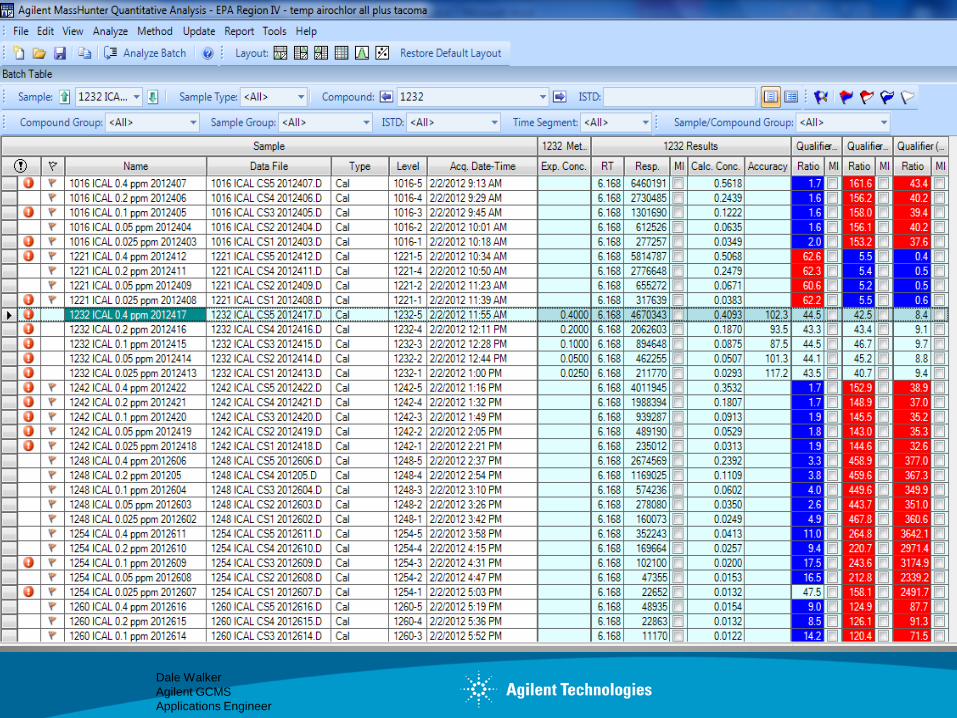
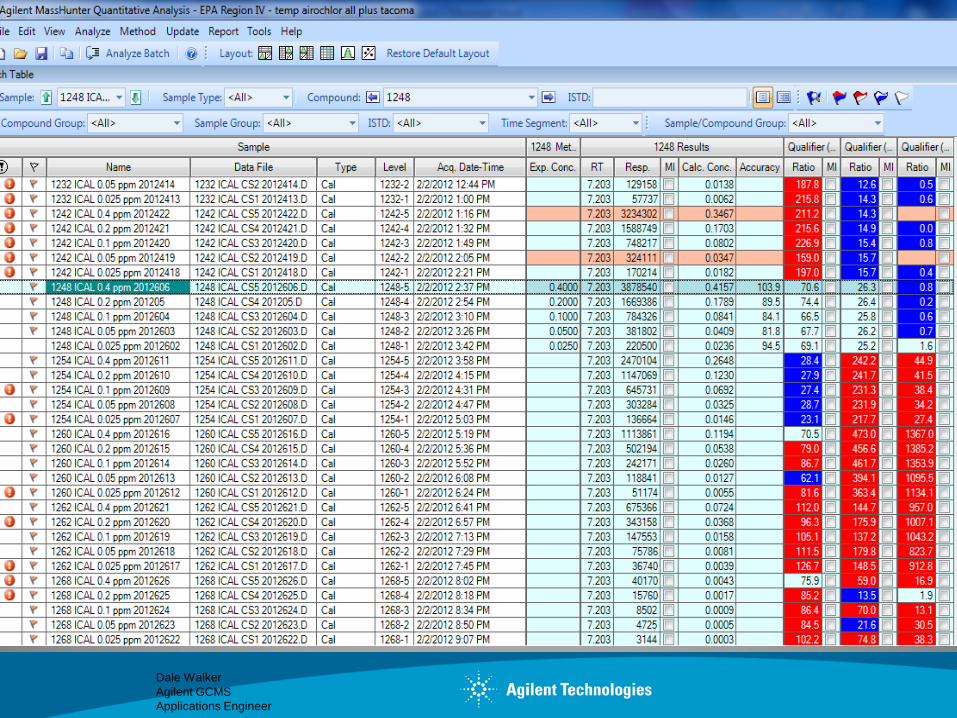
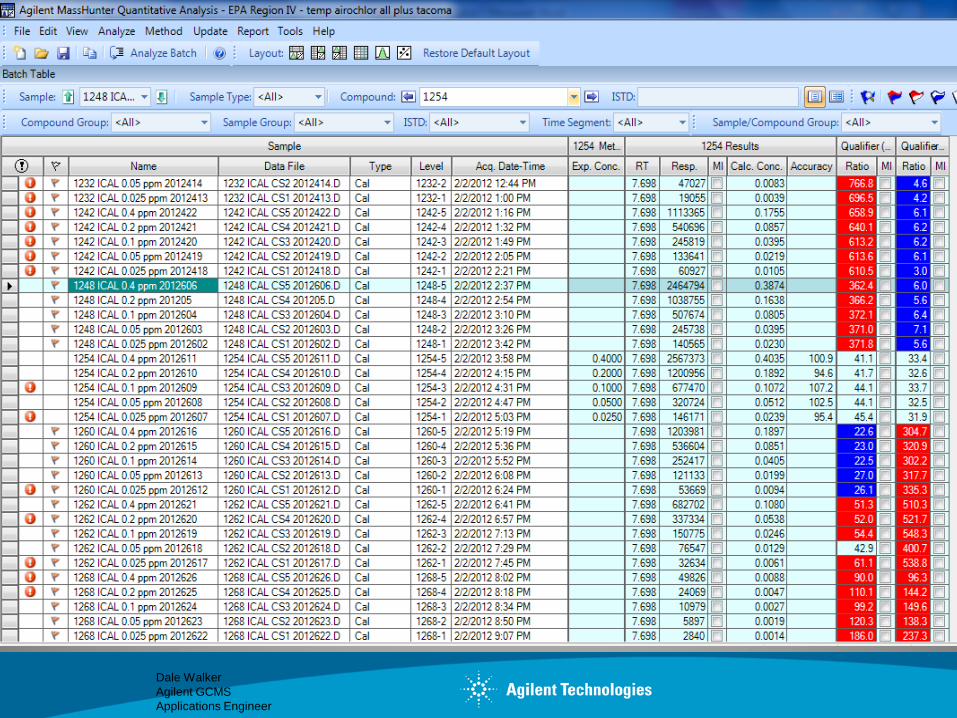
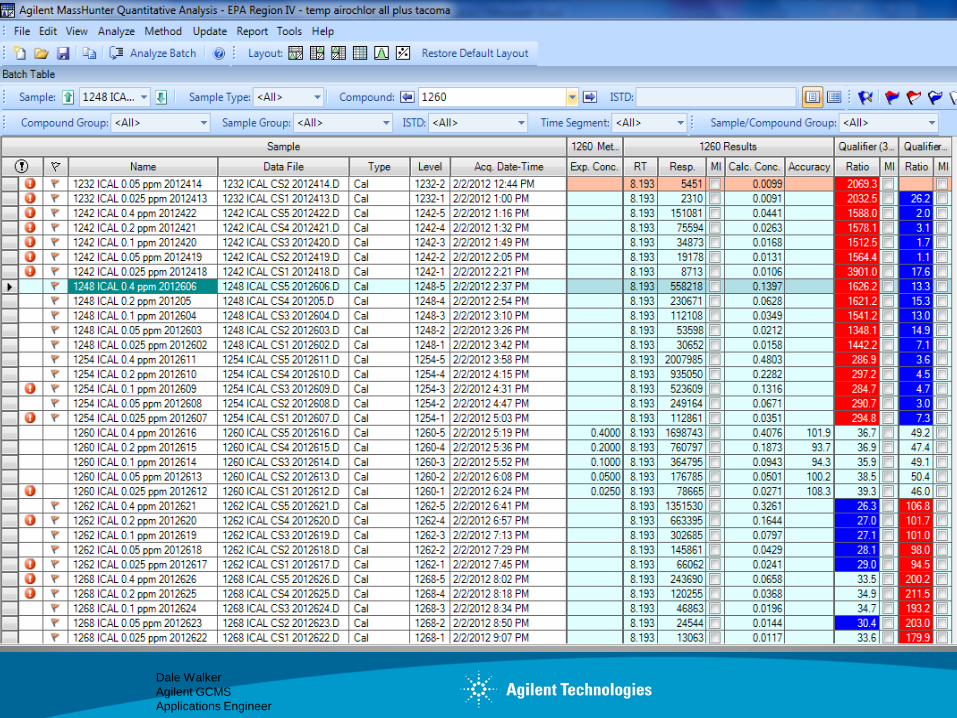
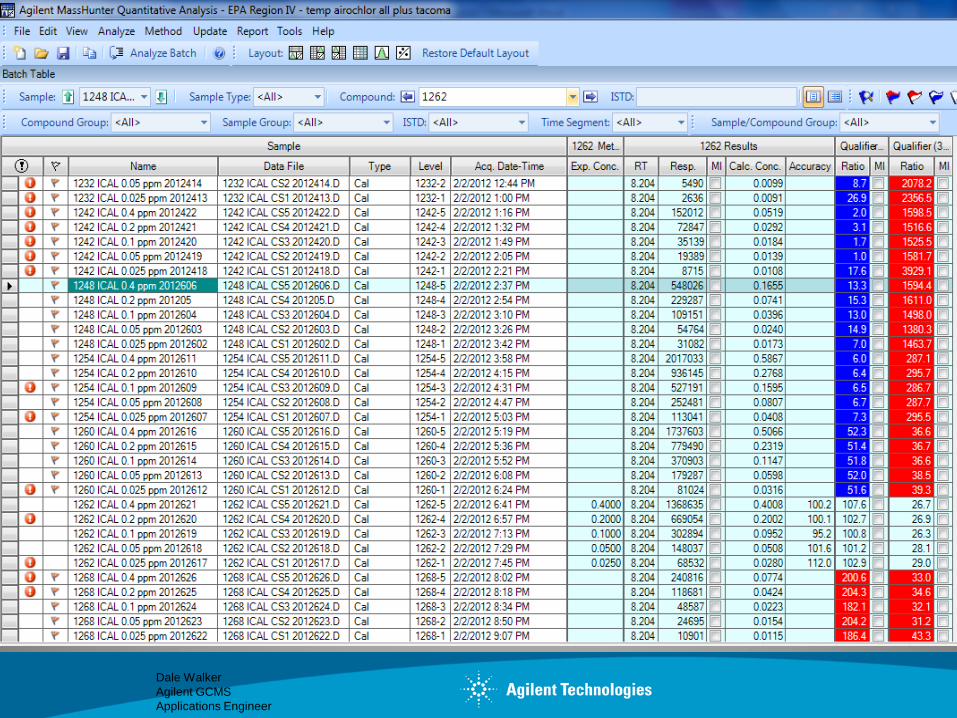
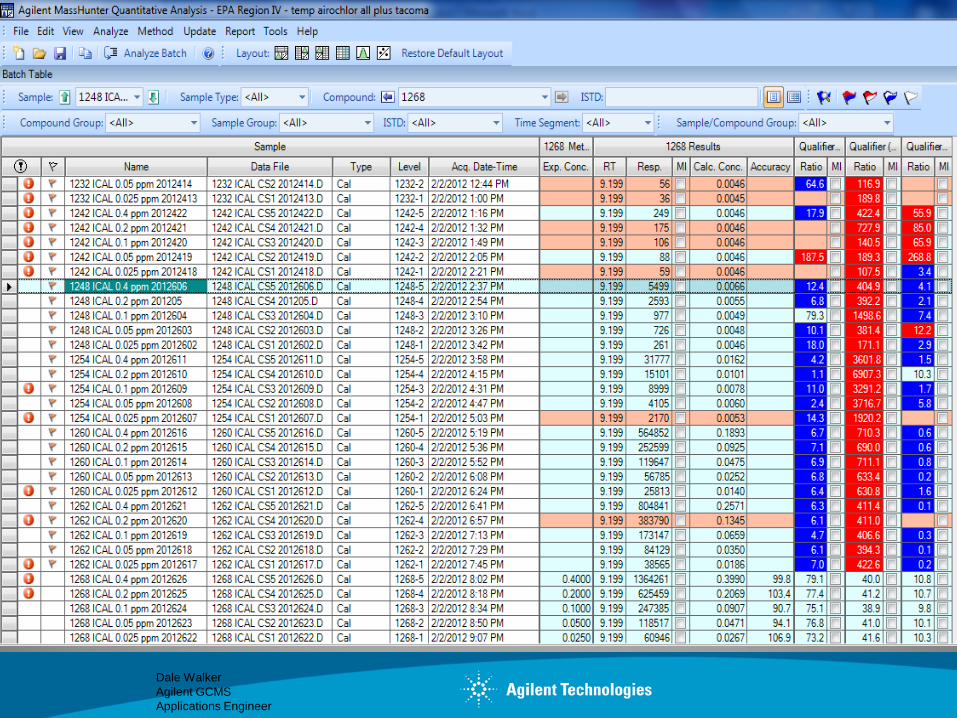
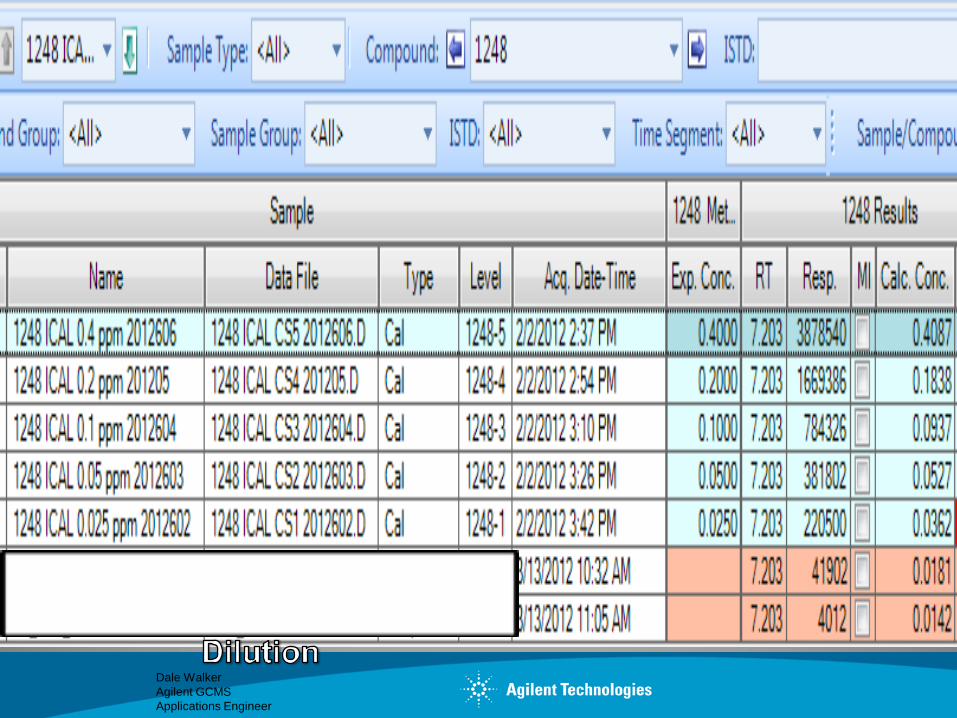
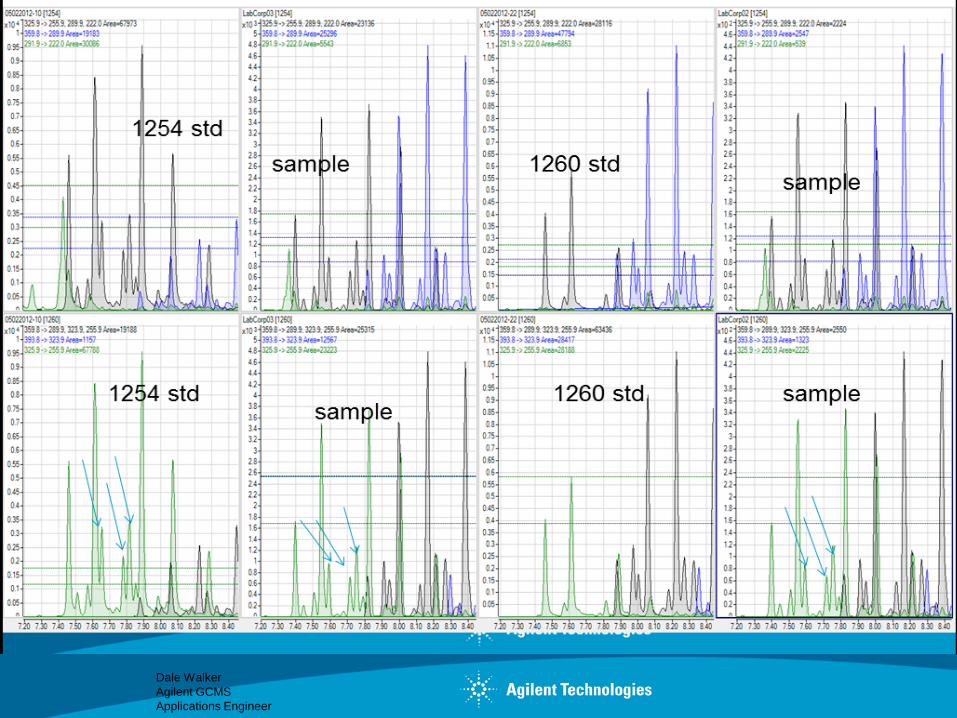
Once all of the curves have been run you can then
combine all of the curves into a single batch. This
allows you to quickly determine which PCB’s may be
present in the sample.
Those compounds which clearly fail to meet the criteria
from the combined curve may be eliminated.
If the PCB is present it will meet the criteria and fall
within the quantitation parameters for the particular
PCB.
Dale Walker
Agilent GCMS
Applications Engineer
Dale Walker
Agilent GCMS
Applications Engineer
Dale Walker
Agilent GCMS
Applications Engineer
Dale Walker
Agilent GCMS
Applications Engineer
Dale Walker
Agilent GCMS
Applications Engineer
Dale Walker
Agilent GCMS
Applications Engineer
Dale Walker
Agilent GCMS
Applications Engineer
Now that we have identified the process what
can we do with the system. Lets follow the data
from two experiments.
Dale Walker
Agilent GCMS
Applications Engineer
Experiment 1:
Experiment examine an unknown sample received
from an environmental site. For pesticides and
Aroclors

Dale Walker
Agilent GCMS
Applications Engineer
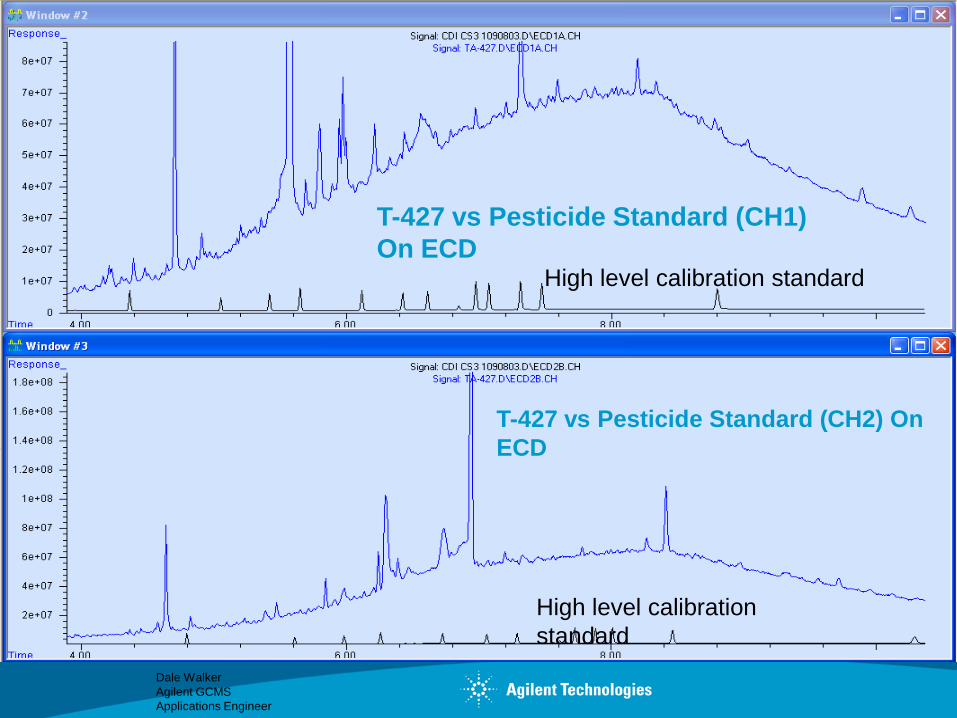
Sample TA-427 on ECD
Dale Walker
Agilent GCMS
Applications Engineer
T-427 vs Pesticide Standard (CD1) On
ECD
T-427 vs Pesticide Standard (CH1)
On ECD
T-427 vs Pesticide Standard (CH2) On
ECD
High level calibration
standard
High level calibration standard
Dale Walker
Agilent GCMS
Applications Engineer
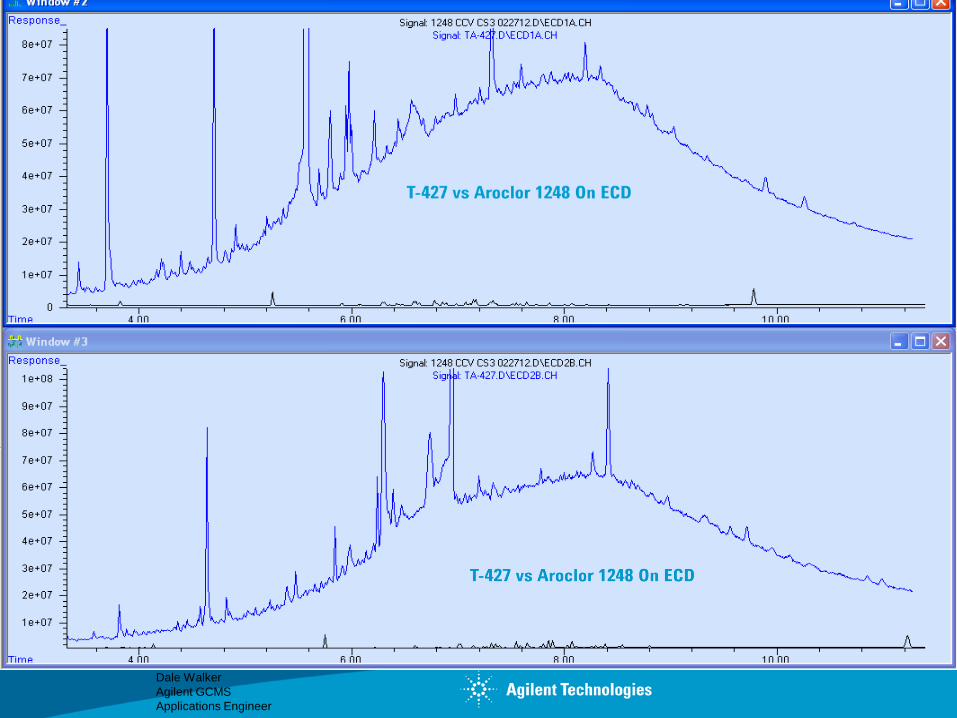
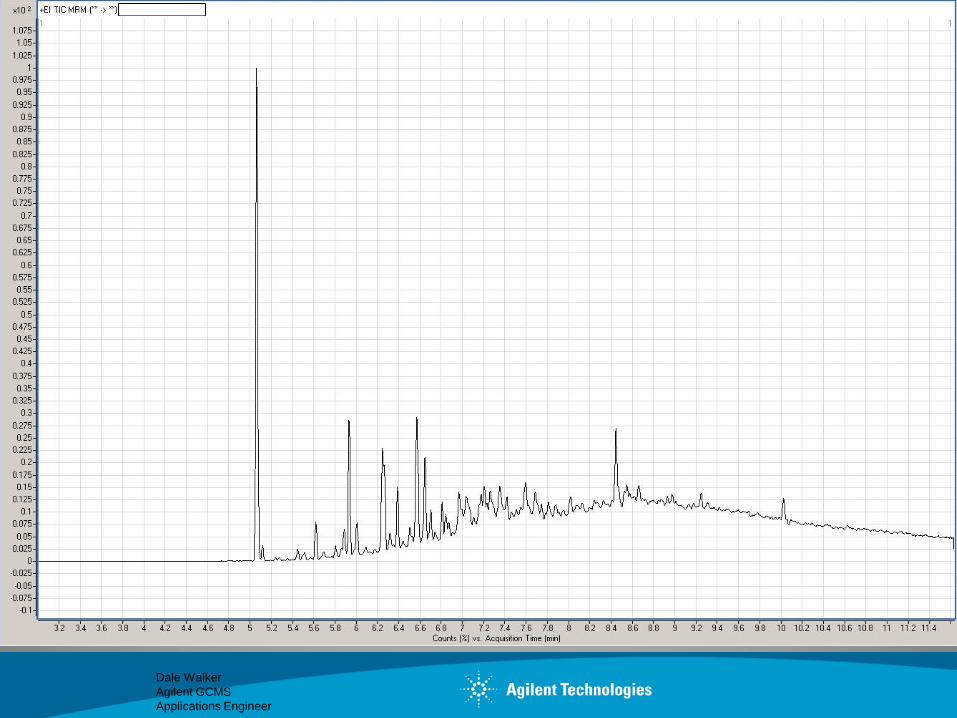
T-427 vs Aroclor 1248 On ECD
Dale Walker
Agilent GCMS
Applications Engineer
Dale Walker
Agilent GCMS
Applications Engineer
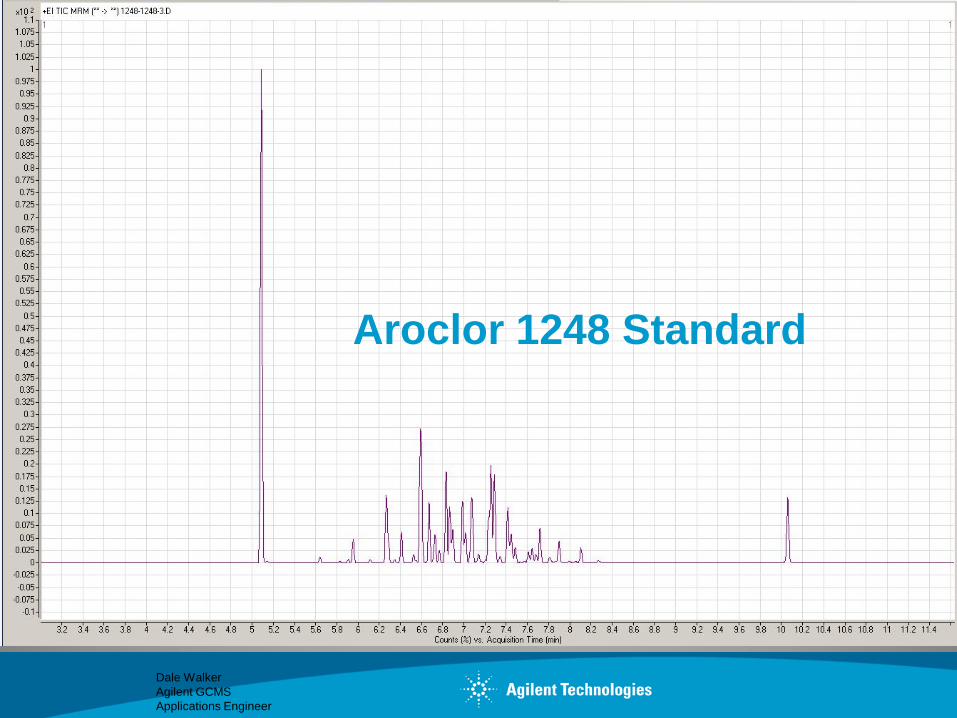
Aroclor 1248 Standard
Dale Walker
Agilent GCMS
Applications Engineer
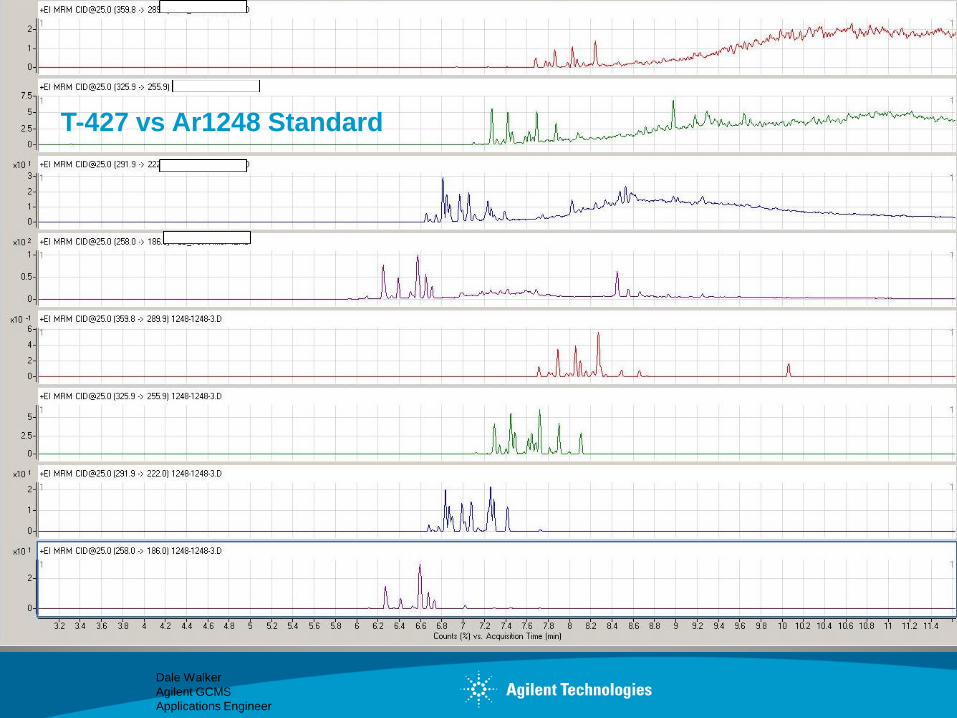
T-427 vs Ar1248 Standard
Dale Walker
Agilent GCMS
Applications Engineer
Dale Walker
Agilent GCMS
Applications Engineer
Conclusion Experiment 1:
Experiment examine an unknown sample received from an environmental site. The
sample was analyzed using the method as previously outlined.
The ECD showed heavy interferences so much so that it was not possible to make a
positive identification.
While there was heavy matrix and interferences within the sample a positive
identification was made utilizing an MS/MS experiment
Dale Walker
Agilent GCMS
Applications Engineer
Experiment 2:
Experiment one was to examine an unknown sample in blood matrix.
For PCB Arochlors
Dale Walker
Agilent GCMS
Applications Engineer

Dale Walker
Agilent GCMS
Applications Engineer

Dale Walker
Agilent GCMS
Applications Engineer
Dale Walker
Agilent GCMS
Applications Engineer
Dale Walker
Agilent GCMS
Applications Engineer
Dale Walker
Agilent GCMS
Applications Engineer

Dale Walker
Agilent GCMS
Applications Engineer
Dale Walker
Agilent GCMS
Applications Engineer
Dale Walker
Agilent GCMS
Applications Engineer
Dale Walker
Agilent GCMS
Applications Engineer
Dale Walker
Agilent GCMS
Applications Engineer
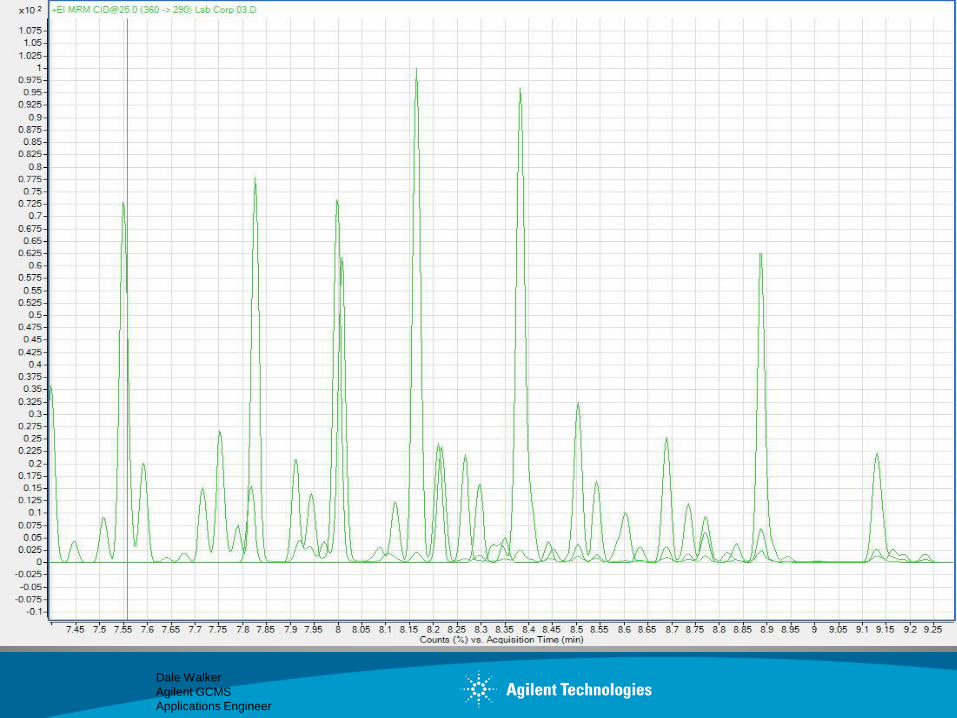
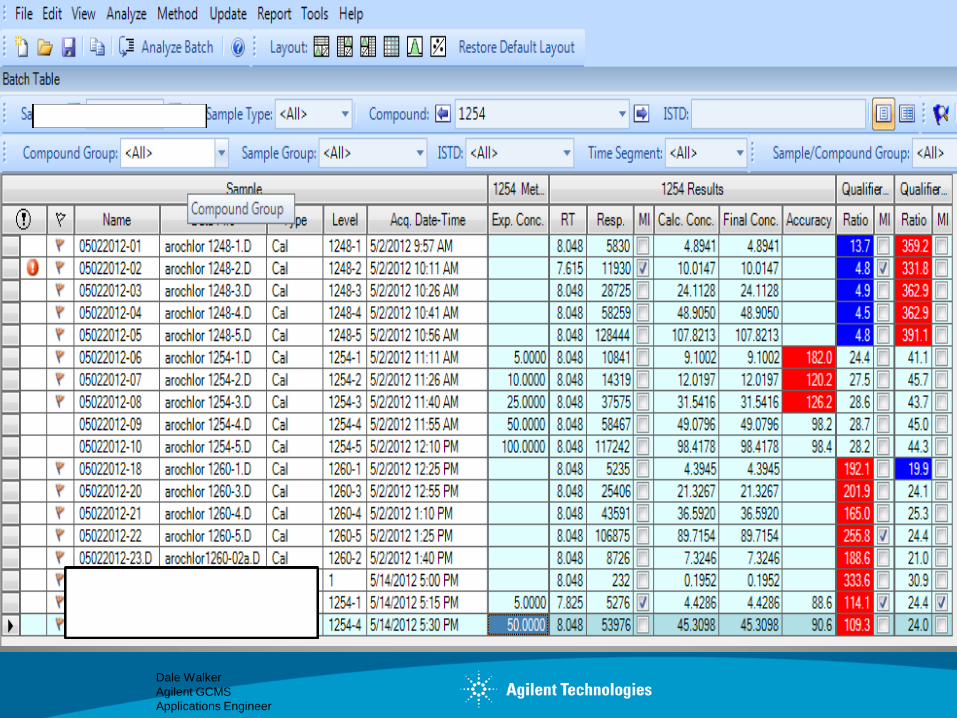
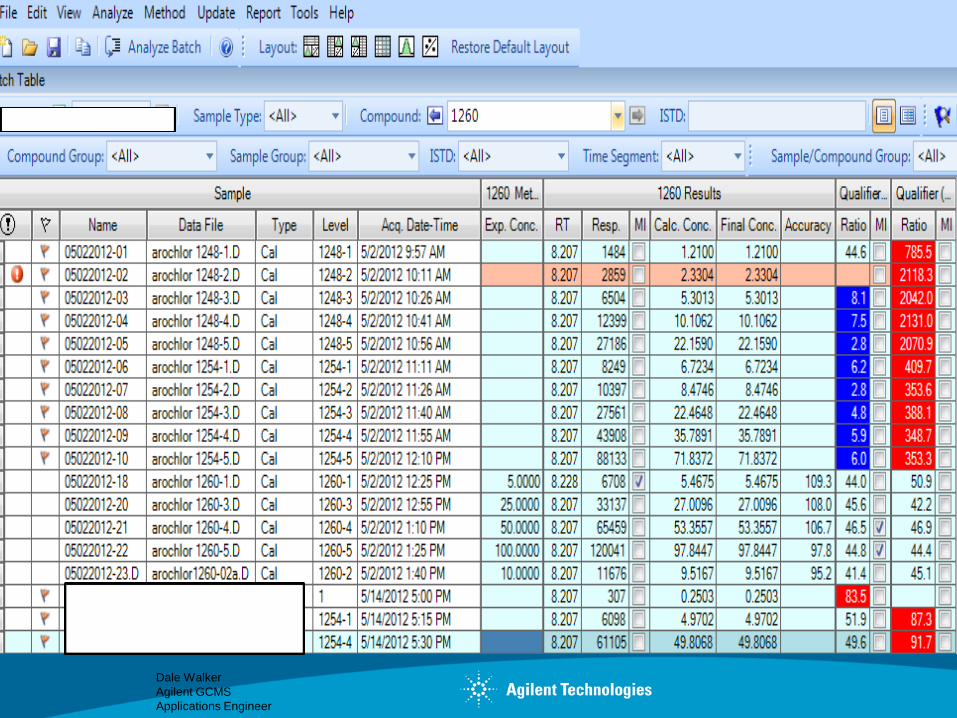
Conclusion Experiment 2:
While there was heavy matrix and interferences within the sample a positive
identification was made for both Arochlor 1254 and 1260 in a single sample during
the same run.
The spiked amount for 1254 was 5ppb the amount reported was 4.42ppb The high
spike was 50 ppb and the amount found was 45.30ppb
The spiked amount for 1260 was 5ppb the amount reported was 4.97ppb The high
spike was 50 ppb and the amount found was 49.80ppb
Dale Walker
Agilent GCMS
Applications Engineer
Here is a preview of one of a future
presentation for pesticides using EPA method
8081
Dale Walker
Agilent GCMS
Applications Engineer
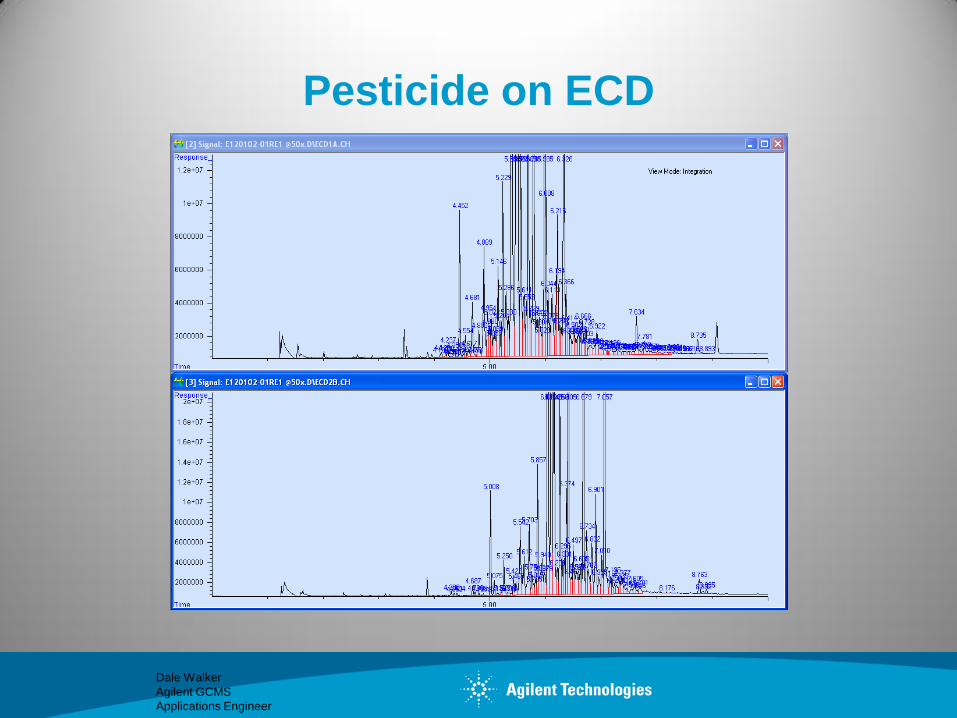
Pesticide on ECD

Dale Walker
Agilent GCMS
Applications Engineer
Pesticide on 7000B QQQ
Dale Walker
Agilent GCMS
Applications Engineer
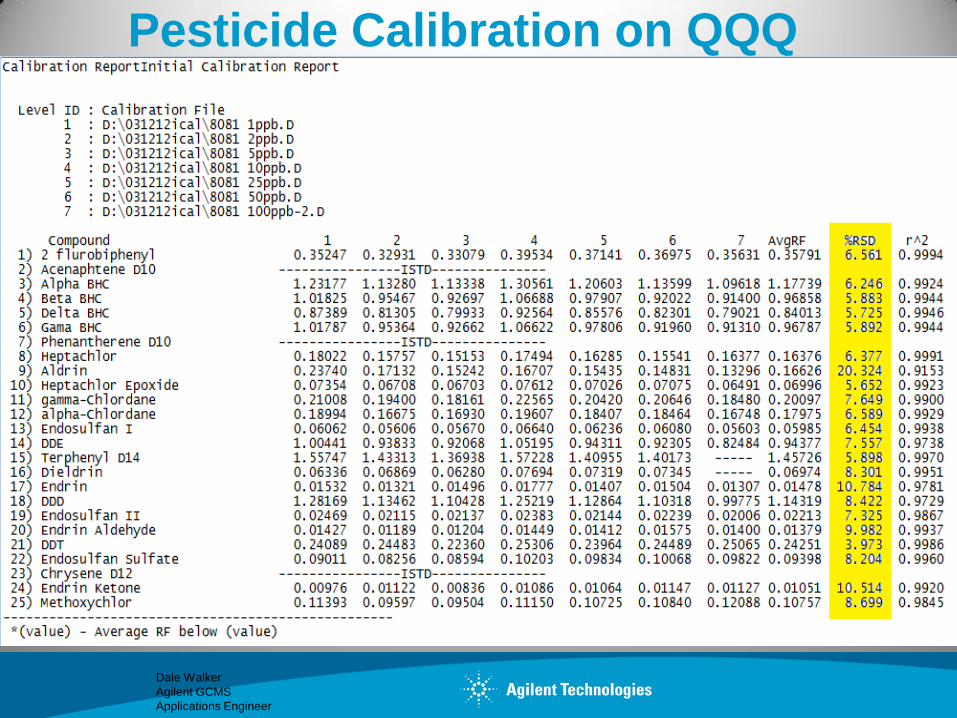
Pesticide Calibration on QQQ
Dale Walker
Agilent GCMS
Applications Engineer
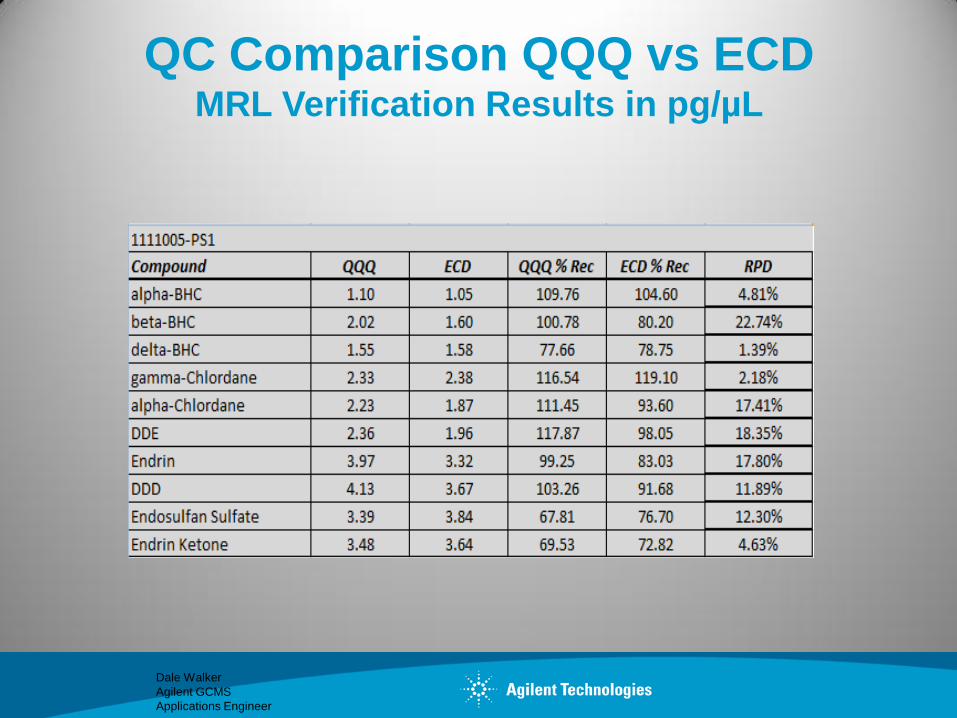
QC Comparison QQQ vs ECD MRL Verification Results in pg/µL
Dale Walker
Agilent GCMS
Applications Engineer
Summary
We can analyze and report difficult samples that previously
would have required additional sample treatment or raised
detection limits on the ECD.
We are able to achieve detection limits at or below those
currently attained on the ECD.
By using GC/MS/MS we are now able to confirm the
presents of Aroclors not only by pattern matching TIC
patterns but by insuring that the transitions are clearly
defined. This offers the best legally defensible data.
Dale Walker
Agilent GCMS
Applications Engineer
Acknowledgement
I would like to personally thank the following individuals. Without
their help this presentation would not have been possible.
Fred Feyerherm Agilent Technologies
Jeannie Williamson and Jason Collum
Organic Chemistry Section SESD Region 4 EPA