Embed Size (px)
Citation preview
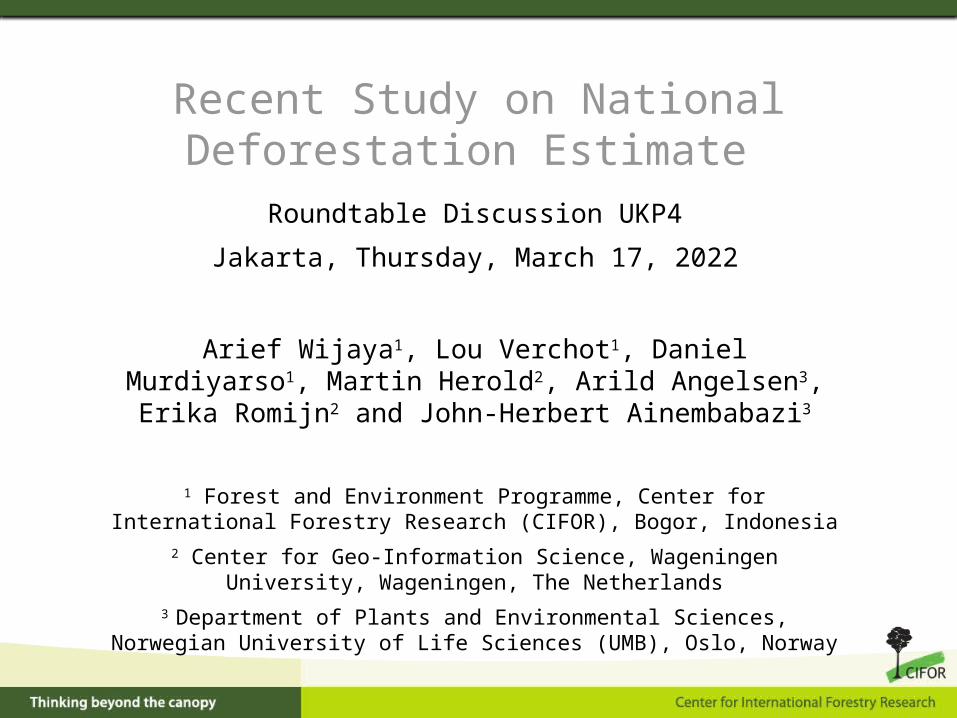
Recent Study on National Deforestation Estimate
Roundtable Discussion UKP4
Jakarta, April 15, 2023
Arief Wijaya1, Lou Verchot1, Daniel Murdiyarso1, Martin Herold2, Arild Angelsen3, Erika Romijn2 and John-Herbert
Ainembabazi3
1 Forest and Environment Programme, Center for International Forestry Research (CIFOR), Bogor, Indonesia
2 Center for Geo-Information Science, Wageningen University, Wageningen, The Netherlands
3 Department of Plants and Environmental Sciences, Norwegian University of Life Sciences (UMB), Oslo, Norway
Purpose of the study
Estimation of future carbon emissions from LULUCF sector is yet challenging for Indonesia
Opportunity: Indonesia has several spatially explicit deforestation maps/estimates
Objective of the talk: to share our approach to improve the reliability of national deforestation estimate
Materials
Land cover map of MOF (2000-2012)
Annual deforestation map of University of Maryland (2000-2010)
Land cover change map of CRISP (2000-2010)
Stratified sample of land cover change map of EU-JRC (2000-2010)
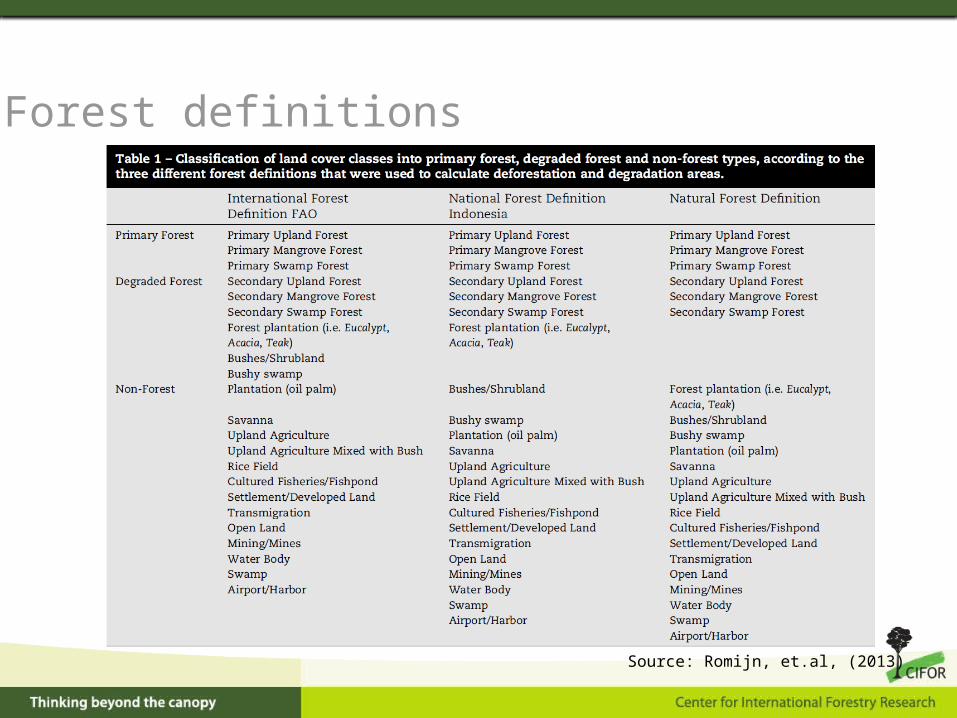
Forest definitions
Source: Romijn, et.al, (2013)
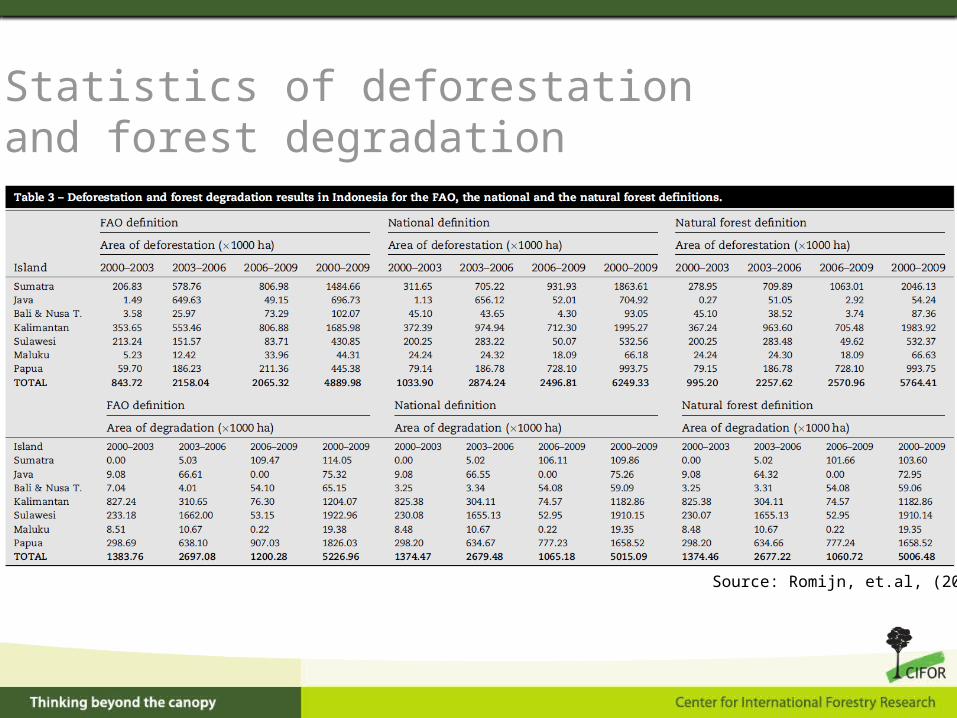
Statistics of deforestation and forest degradation
Source: Romijn, et.al, (2013)
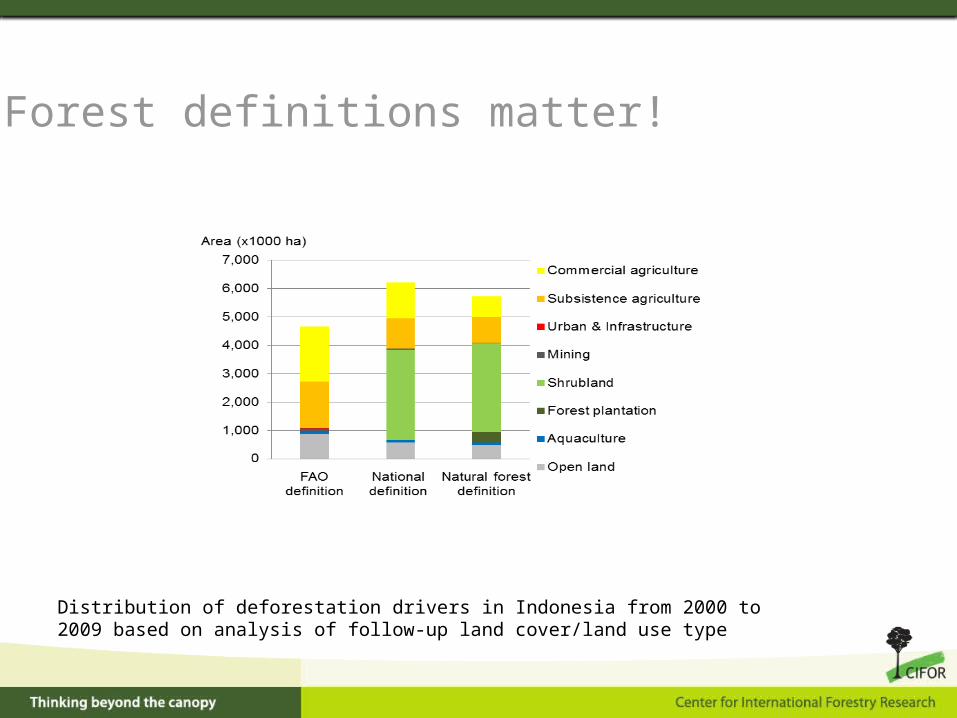
Forest definitions matter!
Distribution of deforestation drivers in Indonesia from 2000 to 2009 based on analysis of follow-up land cover/land use type
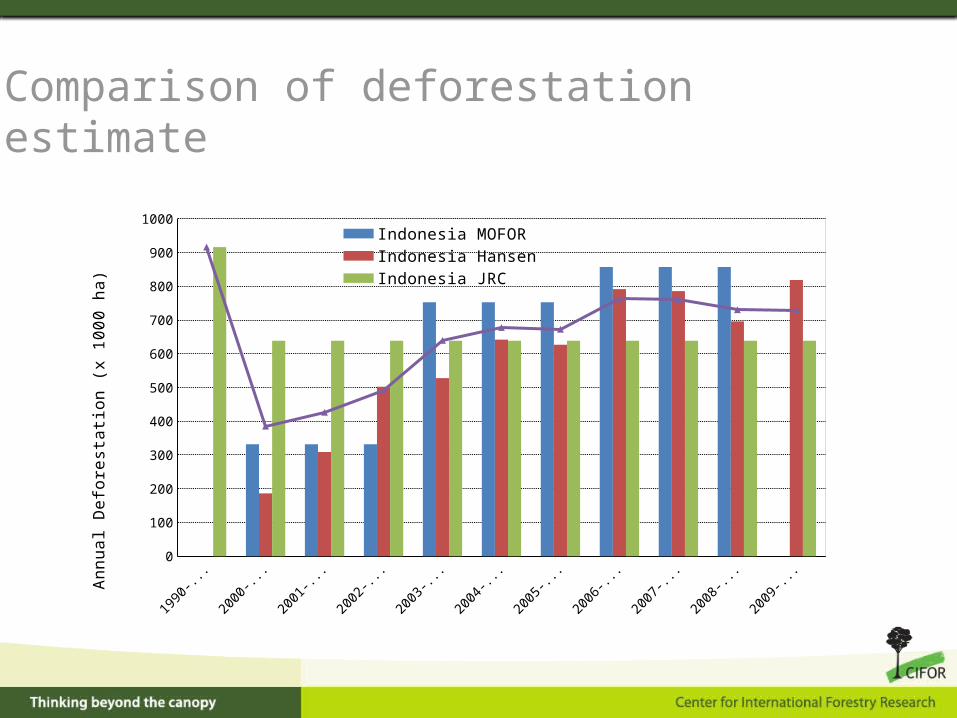
Comparison of deforestation estimate
1990-2000
2000-2001
2001-2002
2002-2003
2003-2004
2004-2005
2005-2006
2006-2007
2007-2008
2008-2009
2009-20100
100
200
300
400
500
600
700
800
900
1000
Indonesia MOFOR Indonesia Hansen
Indonesia JRC Indonesia Mean
Annu
al D
efor
esta
tion
(x 1
000
ha)
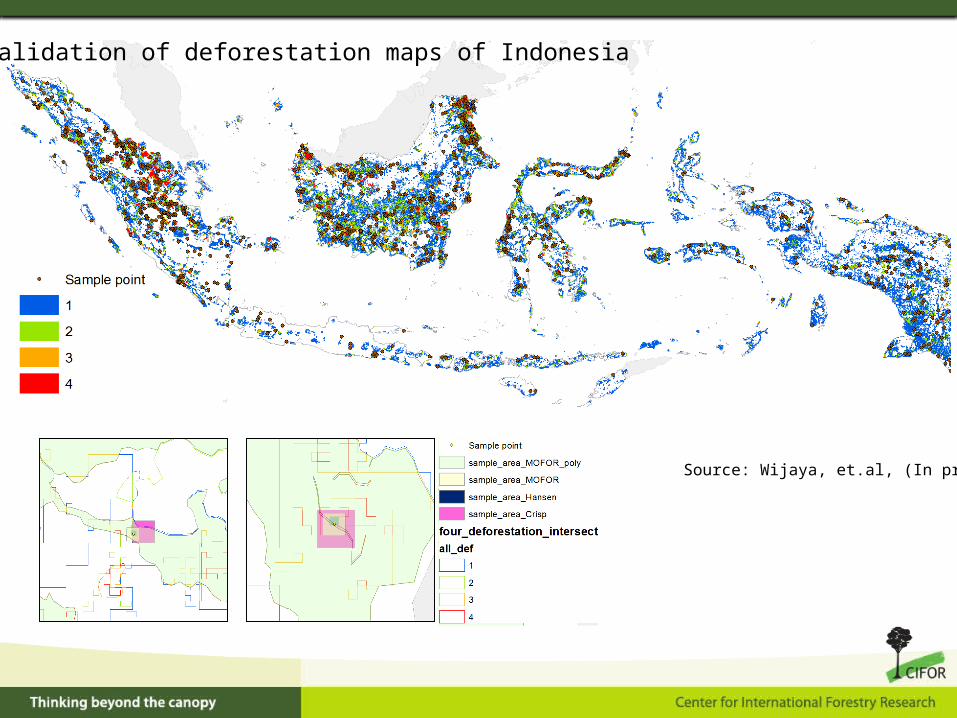
Validation of deforestation maps of Indonesia
Source: Wijaya, et.al, (In prep)
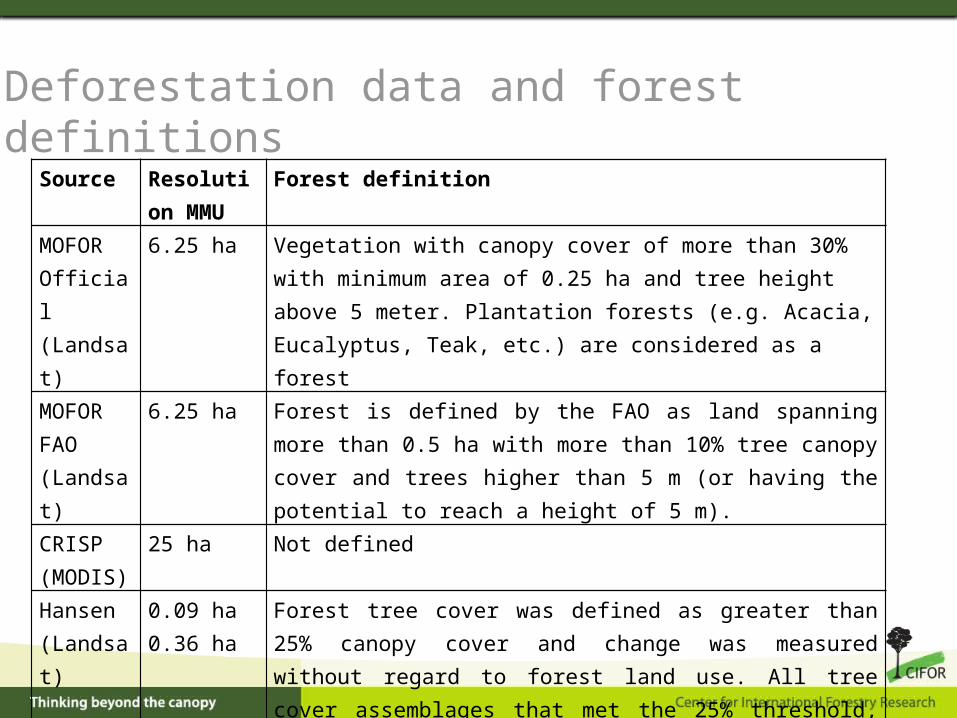
Deforestation data and forest definitionsSource Resolution
MMU Forest definition
MOFOR Official (Landsat)
6.25 ha Vegetation with canopy cover of more than 30% with minimum area of 0.25 ha and tree height above 5 meter. Plantation forests (e.g. Acacia, Eucalyptus, Teak, etc.) are considered as a forest
MOFOR FAO (Landsat)
6.25 ha Forest is defined by the FAO as land spanning more than 0.5 ha with more than 10% tree canopy cover and trees higher than 5 m (or having the potential to reach a height of 5 m).
CRISP (MODIS)
25 ha Not defined
Hansen (Landsat)
0.09 ha0.36 ha
Forest tree cover was defined as greater than 25% canopy cover and change was measured without regard to forest land use. All tree cover assemblages that met the 25% threshold, including intact forests, plantations, and forest regrowth, were defined as forests.
EU-JRC (Landsat)
5 ha More than 5 m height, forest prop. In polygon (FP)>70, canopy cover (CC)>10
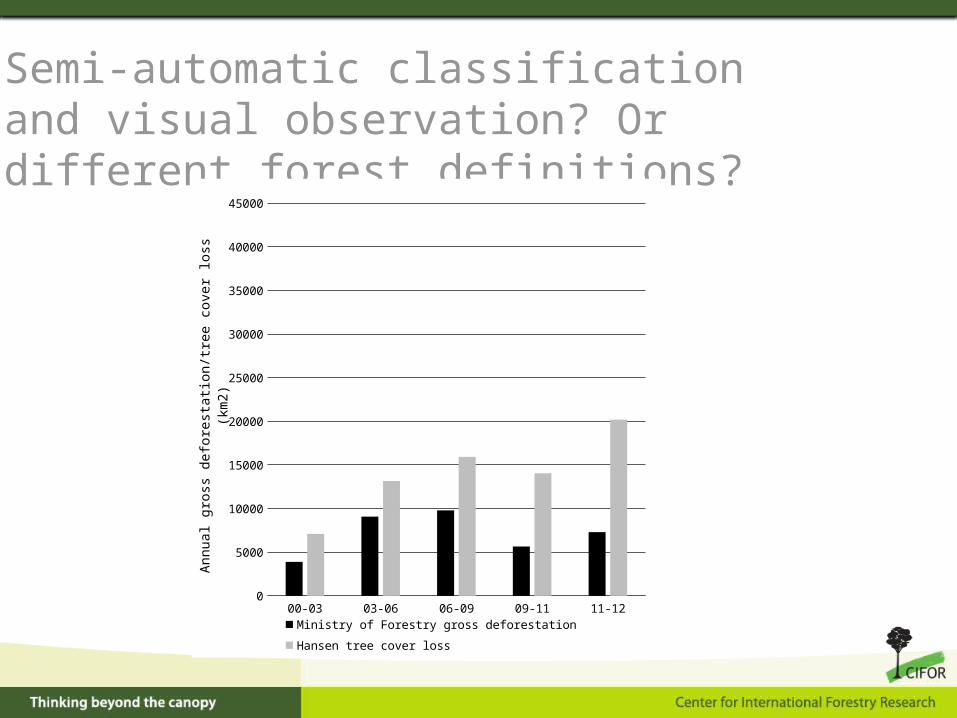
Semi-automatic classification and visual observation? Or different forest definitions?
00-03 03-06 06-09 09-11 11-120
5000
10000
15000
20000
25000
30000
35000
40000
45000
Ministry of Forestry gross deforestation Hansen tree cover loss
Ann
ual g
ross
def
ores
tatio
n/tr
ee c
over
loss
(km
2)
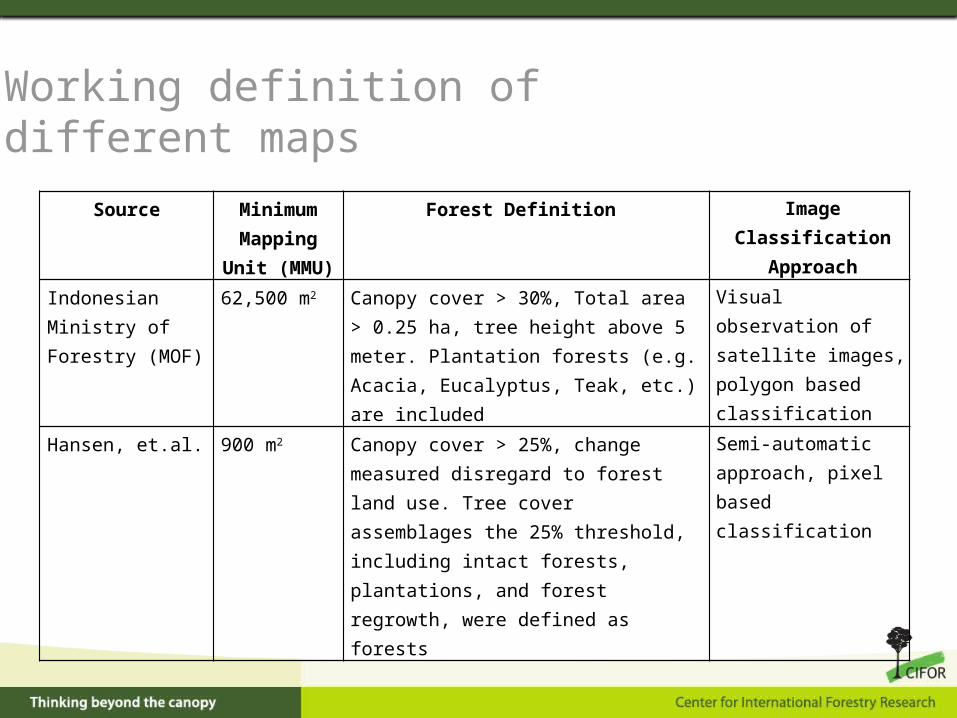
Working definition of different maps
Source Minimum Mapping Unit
(MMU)
Forest Definition Image Classification Approach
Indonesian Ministry of Forestry (MOF)
62,500 m2 Canopy cover > 30%, Total area > 0.25 ha, tree height above 5 meter. Plantation forests (e.g. Acacia, Eucalyptus, Teak, etc.) are included
Visual observation of satellite images, polygon based classification
Hansen, et.al. 900 m2 Canopy cover > 25%, change measured disregard to forest land use. Tree cover assemblages the 25% threshold, including intact forests, plantations, and forest regrowth, were defined as forests
Semi-automatic approach, pixel based classification
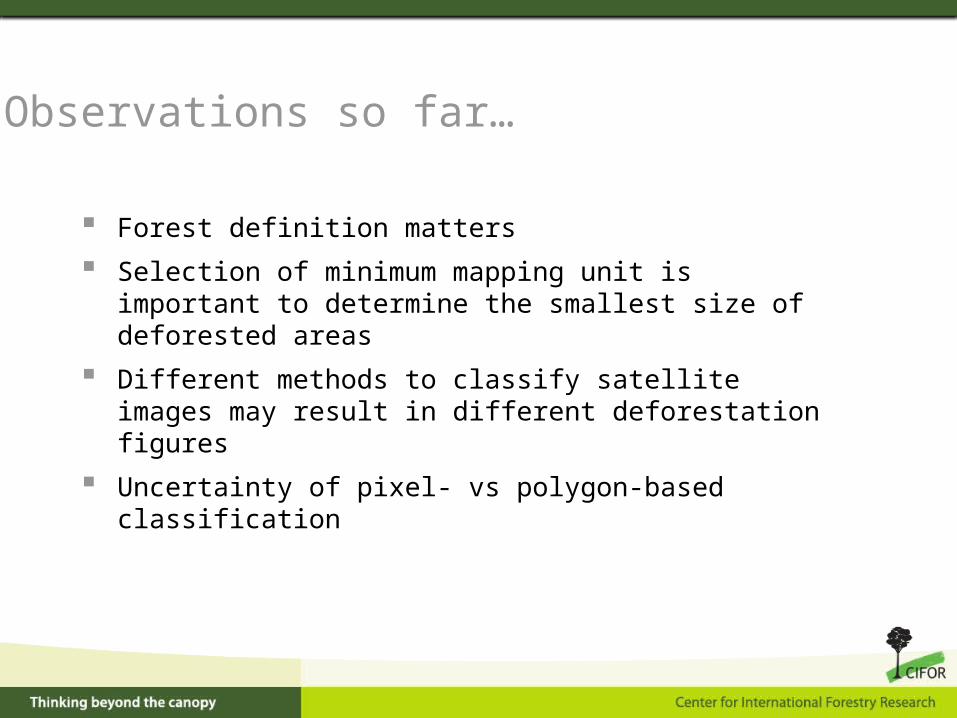
Observations so far…
Forest definition matters
Selection of minimum mapping unit is important to determine the smallest size of deforested areas
Different methods to classify satellite images may result in different deforestation figures
Uncertainty of pixel- vs polygon-based classification
Thank you!