Embed Size (px)
Citation preview

Satpal

2 of 30
CONTENTS TO BE COVERED…
Introduction to stack monitoring
Stack
Stack Emission Monitoring
Stack monitoring for Thermal
Power Plant
Stack monitoring for Fertilizer
Industry
Stack monitoring for Oil
Refineries
Discussion & Conclusion

3 of 30
INTRODUCTION
Atmosphere which makes up largest fraction of
the biosphere is the dynamic system that
continuously absorbs a wide range of solids,
liquids and gases from both man-made &
natural sources.
Undesirable change in physical, chemical &
biological characteristics of air which adversely
effect the life is called air POLLUTION. The
pollutants can be dust, odour, mist, smoke, etc.

4 of 30
There are various
sources of emission of
air pollutants and
Industry is majorly
responsible for
emitting air pollutants
into the atmosphere.
Source: http://24.media.tumblr.com/tumblr_lj8vfzptb01qg5mwho1_500.gif

5 of 30
The industry includes:-
Iron & steel
Thermal power plants
Copper/zinc/aluminum
smelters
Oil refineries/
petrochemical
industries
Pesticides & fertilizer
units, etc.
Smoke emissions come
out of power plants by
stacks. Source: http://img.ehowcdn.com/article-
new/ehow/images/a08/c3/c1/five-different-types-air-
pollution-800x800.jpg

6 of 30
The main pollutants are:-
CO
NOx
CO2
SOx
SPM, etc.
The gases emitted from the
stack impair the composition of
the atmosphere. Thus causes air
pollution. Therefore, analysis &
monitoring of pollutants is
done.

7 of 30
STACK
A stack is a structure for
venting hot flue gases or
smoke from a boiler, stove,
furnace or fireplace to the
outside atmosphere.
These are typically vertical
to ensure that the gases flow
smoothly through them.

8 of 30
The height of stack plays an important role in their
ability to transfer flue gases and it varies for
different industries.
The dispersion of pollutants at a higher altitude
helps reduce the influence of pollutants in the
surroundings.
In the case of chemically aggressive output, the tall
stack allows partial or complete self- neutralization
of chemicals in the air before they reach the ground.
The dispersion of pollutants over a large area
reduces their concentration in compliance with
regulatory limits.

9 of 30
STACK EMISSION MONITORING
Stack monitoring is performed
by inserting a measuring device
into the stack to obtain a sample
of flume.
The purpose of stack sampling
is to determine the quantity,
quality & the type of pollutants
emitted from a specific source,
efficiency of the pollutant
collector & to determine an
appropriate design for air
pollution control equipment. Source:
http://www.motorship.com/__data/assets/image/0018/6452
10/varieties/carousel.jpg

10 of 30
Parameters to be considered….
S.No. Parameter Location Frequency
1 Temperature Secondary
combustion chamber,
stack emissions
Continuous
monitoring
2 Carbon monoxide Stack emissions Continuous
3 Excess oxygen Secondary
combustion chamber,
stack emissions
Continuous
4 Pressure Combustion chambers Continuous
5 Total particulate
matter
Stack emissions Continuous
6 HCl Stack emissions Continuous
11 of 30
s.no. Parameter Location Frequency
7 HF Stack emissions Once in every month,
initially for first year.
If the correlation with
HCL scrubbing
efficiency is
established, the
frequency may be
relaxed by the State
Boards/ Pollution
Control Committees
appropriately
8 SO2 Stack emissions Continuous
9 NOx Stack emissions Continuous
10 Mercury Stack emissions Twice a year, under
critical operating
conditions
11 Heavy metals Stack emissions, Twice a year
Source :- www.cpcb.nic.in

12 of 30
STACK MONITORING FOR
THERMAL POWER PLANT

13 of 30
With the current world recession & high price of oil
& gas supplies many countries are building more
coal fired power plants.
Unfortunately out of all the fossil fuels coal
produces the greatest amount of carbon dioxide
emission when combusted.
When the coal is burnt in the boiler furnace, gases,
particulates & the vapors are produced & most of
these are removed in the fume treatment plant
process.
Thermal power plant belong to 17 categories of
highly polluting industries as mentioned by CPCB
in 2000.

14 of 30
The increased dependence of the power sector on coal
has been associated with emissions from power plants
in the form of particulate matter, toxic elements, fly
ash, oxides of nitrogen, sulphur and carbon besides
ash which requires large stretches of land for disposal.
The amount of pollutants released depends upon the
quality of coal being used in the plant.
Source :- www.cpcb.nic.in

15 of 30
The emissions also contain certain trace elements
such as arsenic, cadmium, lead, nickel & vanadium.
Oxides of nitrogen are the main pollutants.
The stack height in a thermal power plant is directly
proportional to the pollution generation capacity of
the plant.
Source :- www.cpcb.nic.in

16 of 30
If the plant is being used for steam
generation and coal is being used as the
input then the stack heights are given as
follows :-
Source :- www.cpcb.nic.in

17 of 30
STACK MONITORING FOR
FERTILIZER INDUSTRY

18 of 30
Environmental issues concerning the production of
fertilizers include potential pollution of air, water and
land.
A typical fertilizer unit in India produces 300 tons per day
of ammonia, 300tons/day of urea, 1100tons/day of
complex fertilizer & 130tons/day of methanol.
Atmospheric pollutants emitted by the fertilizer industry
can include gaseous ammonia (NH3) and ammonium salt
aerosols, nitric and nitrous oxides (NO and N2O), carbon
dioxide(CO2), fluorine – as silicon fluoride (SiF4 ) and
hydrogen fluoride (HF) – sulphur oxides (SOx), fertilizer
dust and acid mists.

19 of 30
Fertilizer plants in India can be classified into the
following 5 categories:-
Ammonia & Urea plant
Ammonia, Nitric Acid& Ammonium Nitrate
plants
Ammonia, urea, phosphoric acid & complex
fertilizer plants
Ammonia, urea, ammonium sulphate and
sulphuric acid plants
Ammonia, urea, phosphoric acid, nitric acid,
sulphuric acid plants

20 of 30
Parameters to be considered…..
PARAMETERS UNITS TOLERANCE LIMIT
N MG/L 20
SO2 MG/L 1000
P MG/L 5
F MG/L 10
Source :- www.cpcb.nic.in

21 of 30
EMISSIONS Parameter VALUES
Phosphatic Fertilizers
(Fluorides and
particulate matter
emission)
Phosphoric acid
manufacturing unit
Granulation mixing
and
grinding or rock
phosphate
25 milligram per
normal cubic
meter as total Fluoride
150
milligram per normal
cubic
meter of particulate
matter.
Urea (Particulate
matter emission)
Pricing Tower
Commissioned
prior to January 1,
1982
150 milligram per
normal cubic
meter or 2 kilogram
per tone of
product.
Commissioned after 1-
1-1982
50 milligram per
normal cubic
meter or 0.5 kilogram
per tone
of product
Source :- www.cpcb.nic.in
22 of 30
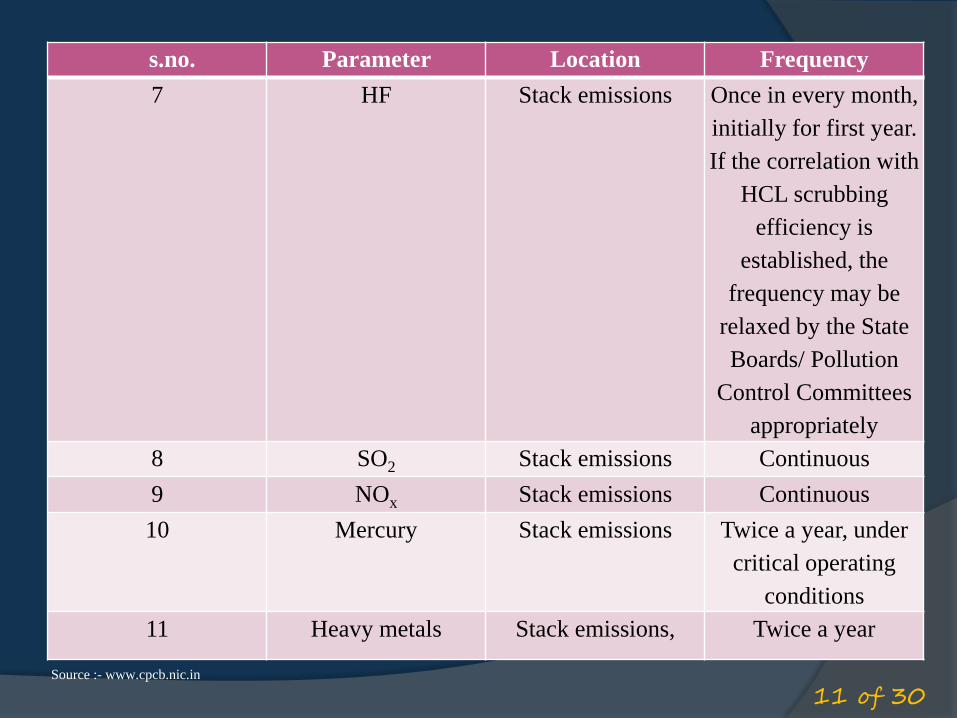
The frequency and duration of sampling depends
upon the nature of pollutant.
Source :- www.cpcb.nic.in

23 of 30
STACK MONITORING FOR
PETROCHEMICAL INDUSTRY

24 of 30
The exploration and exploitation activities often have
a severe impact on the various components of
environment i.e. Air, Water, Land & on health unless
proper preventive measures are taken.
The various sources of air pollution in an oil field
are-
The exhaust generated by engines , generators ,compressors
etc.
Pungent fumes , odours and dust from mud fields.
Evaporation of oil from the oil fields in the form of
vapours.

25 of 30
Burning of the oil in the
oil pit.
Flaring the natural gas
directly into the
atmosphere.
Presence of smoke ,fog
mist in which the SPM
remains suspended
Increase in the
temperature of the
surrounding by the heat
generated by the flare.
26 of 30
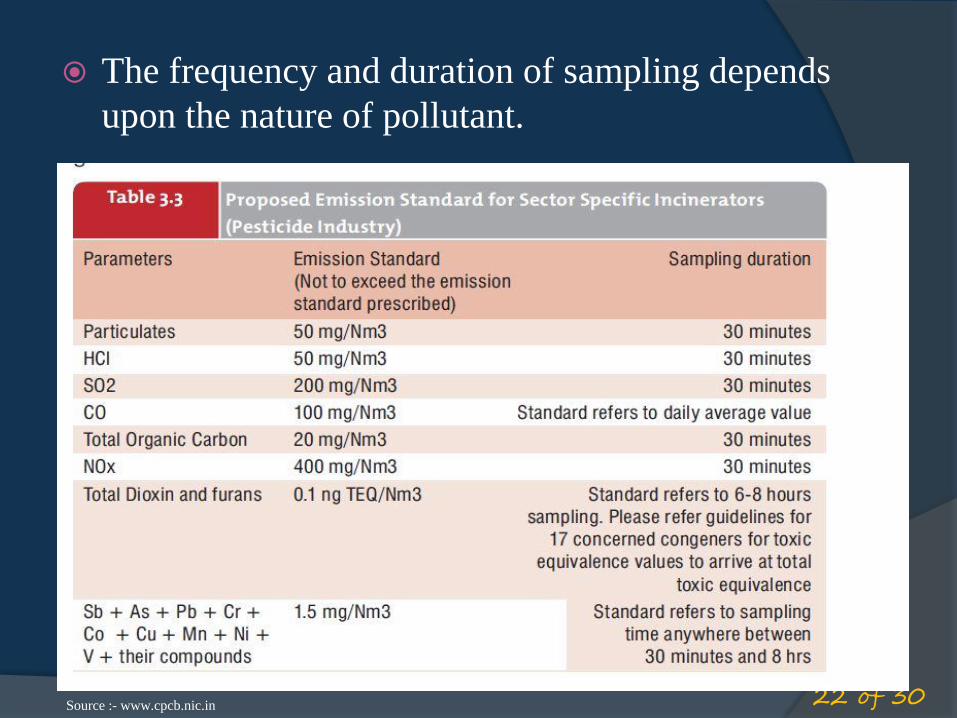
The main pollutants generated
from such sources are :–
Sulphur Oxides
Carbon Monoxide
Nitrogen Oxides
Additional Pollutants :-
Hydrogen Sulphide
Benzene and Toulene
Volatile Organic
Compounds
Stack height in these
industries are generally
expected to be 30m or above.

Permissible Limits……
Production amount
GASES UNITS LIMITS
SO2 Mg/Nm3 50
NOx Mg/Nm3 350
CO Mg/Nm3 150
Particulate
Matter
Mg/Nm3 10
Source :- www.cpcb.nic.in
Source :- http://www.stockwatch.in/ongc-sonangol-jointly-bid-
oil-field-angola-24511

28 of 30
DISSCUSSION & CONCLUSION
The objectives of monitoring emissions from stacks
of these industries are as follows:-
to ensure that air emissions from the ongoing
operation of the industry are minimized
to ensure that high quality data are available to
model and verify ambient air quality
ensure that an emissions control strategy is in place
to monitor air emissions & ambient air quality

29 of 30
If You pollute the air,
The air will pollute you
THANK YOU