Embed Size (px)
Citation preview
IS BIGGER BEST?E X A M I N I N G T H E E C O N O M I E S O F S C A L E O F R E N E W A B L E E N E R G Y
John Farrell Director of Energy Democracy
December 5, 2016

A H I S T O R Y O F B I G T H I N G S
Volume 1 8Surface area 6 24x4
x8
Ther
mal
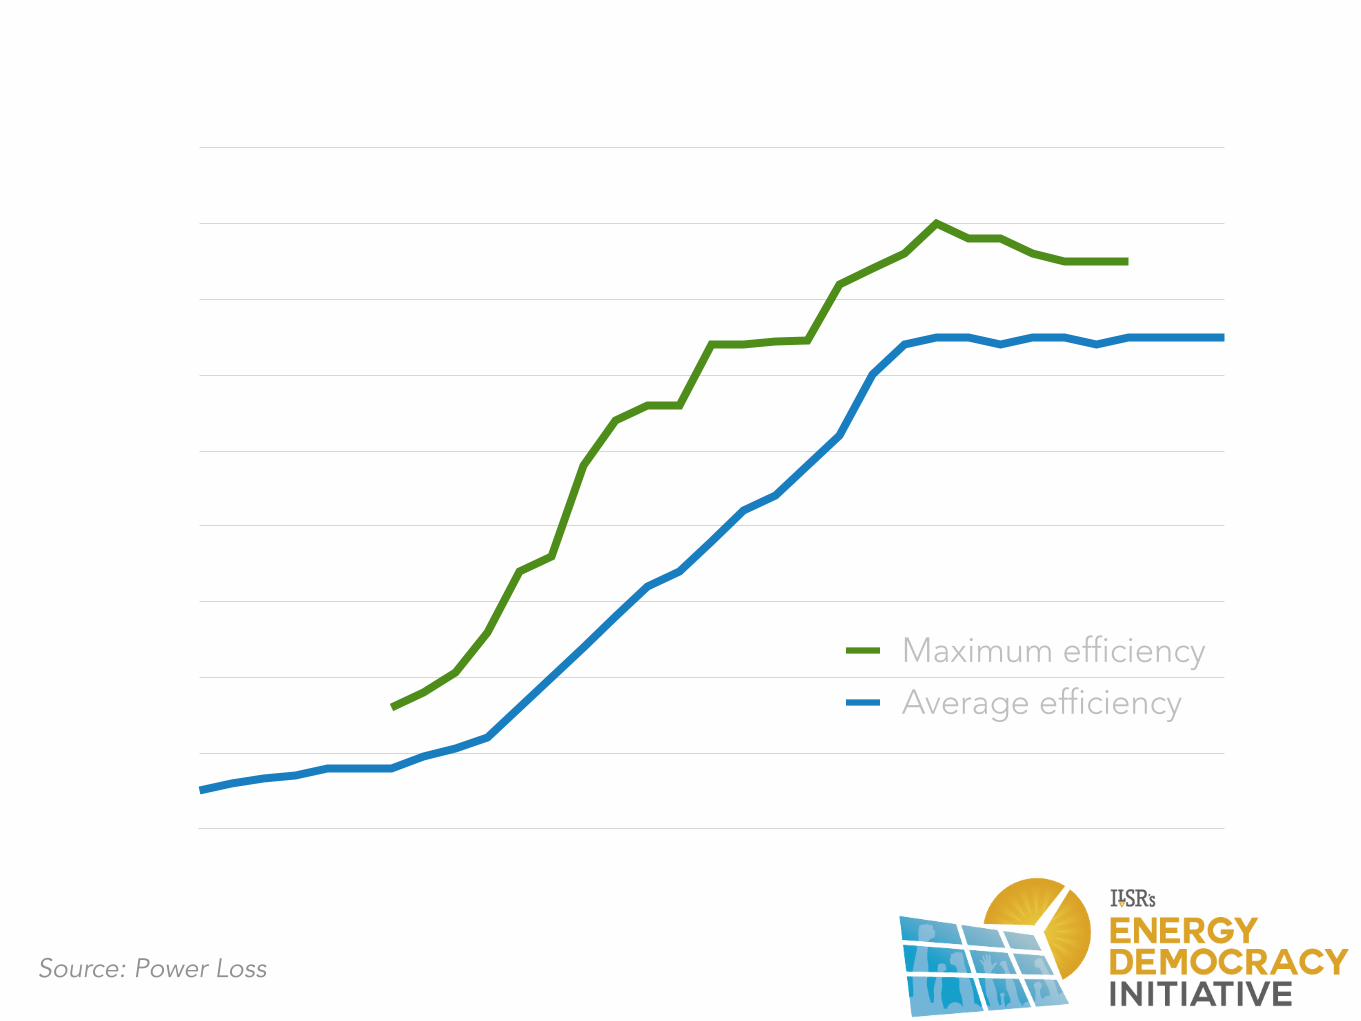
Effi
cien
cy
0%
5%
10%
15%
20%
25%
30%
35%
40%
45%
Maximum efficiency
Average efficiency
P O W E R P L A N T E F F I C I E N C Y
Source: Power Loss
1882 19941900 1925 1950 1975

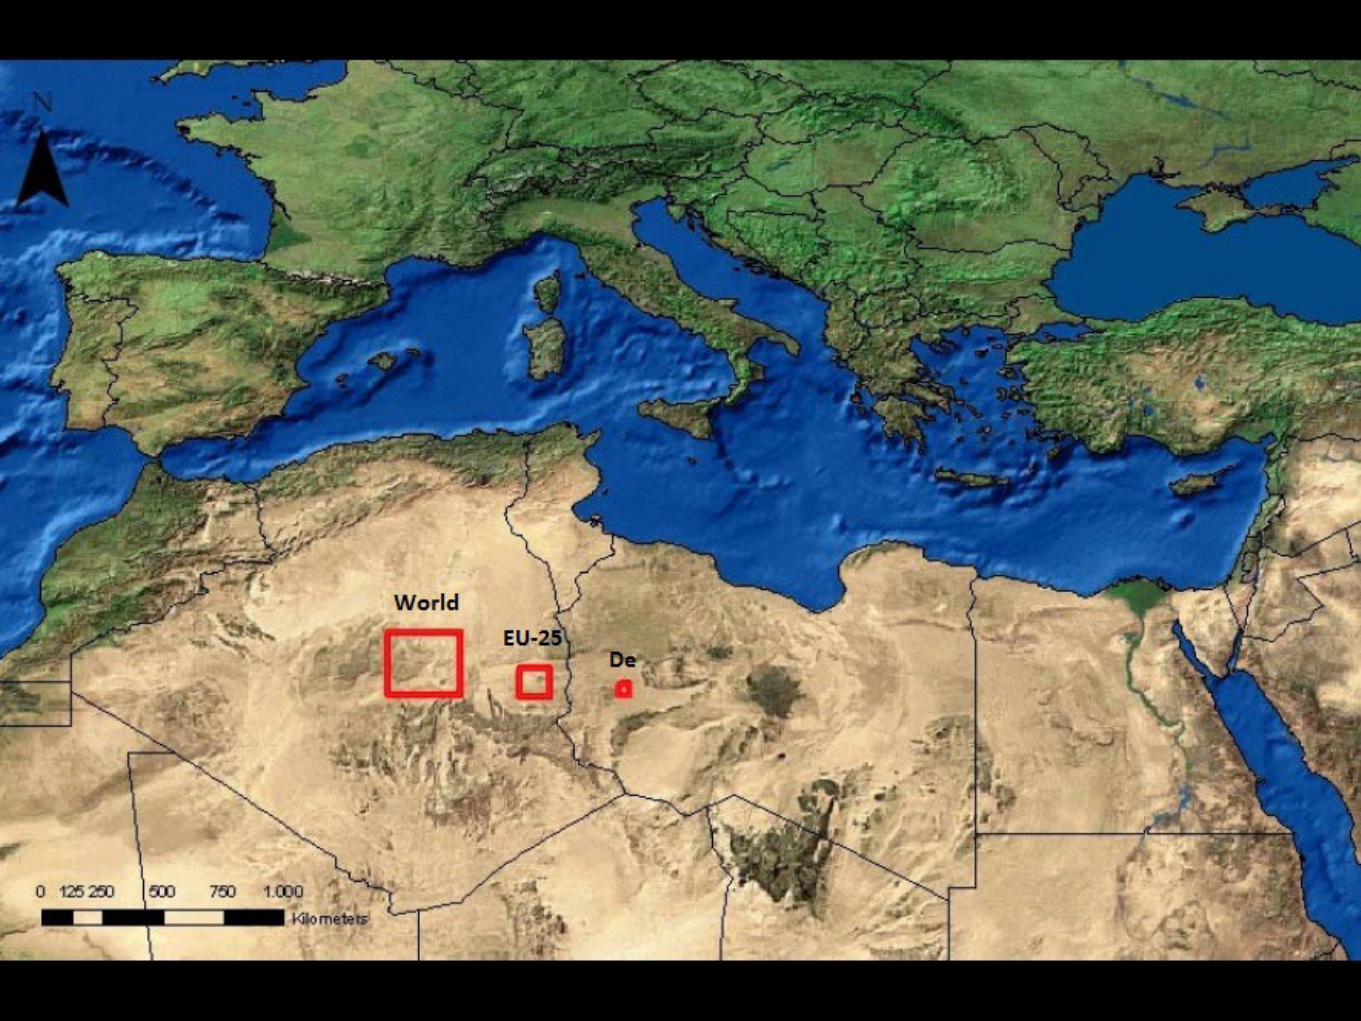
W H I C H S TAT E T O P O W E R T H E M A L L ?

W H I C H S TAT E T O P O W E R T H E M A L L ?

W I N D P O W E R

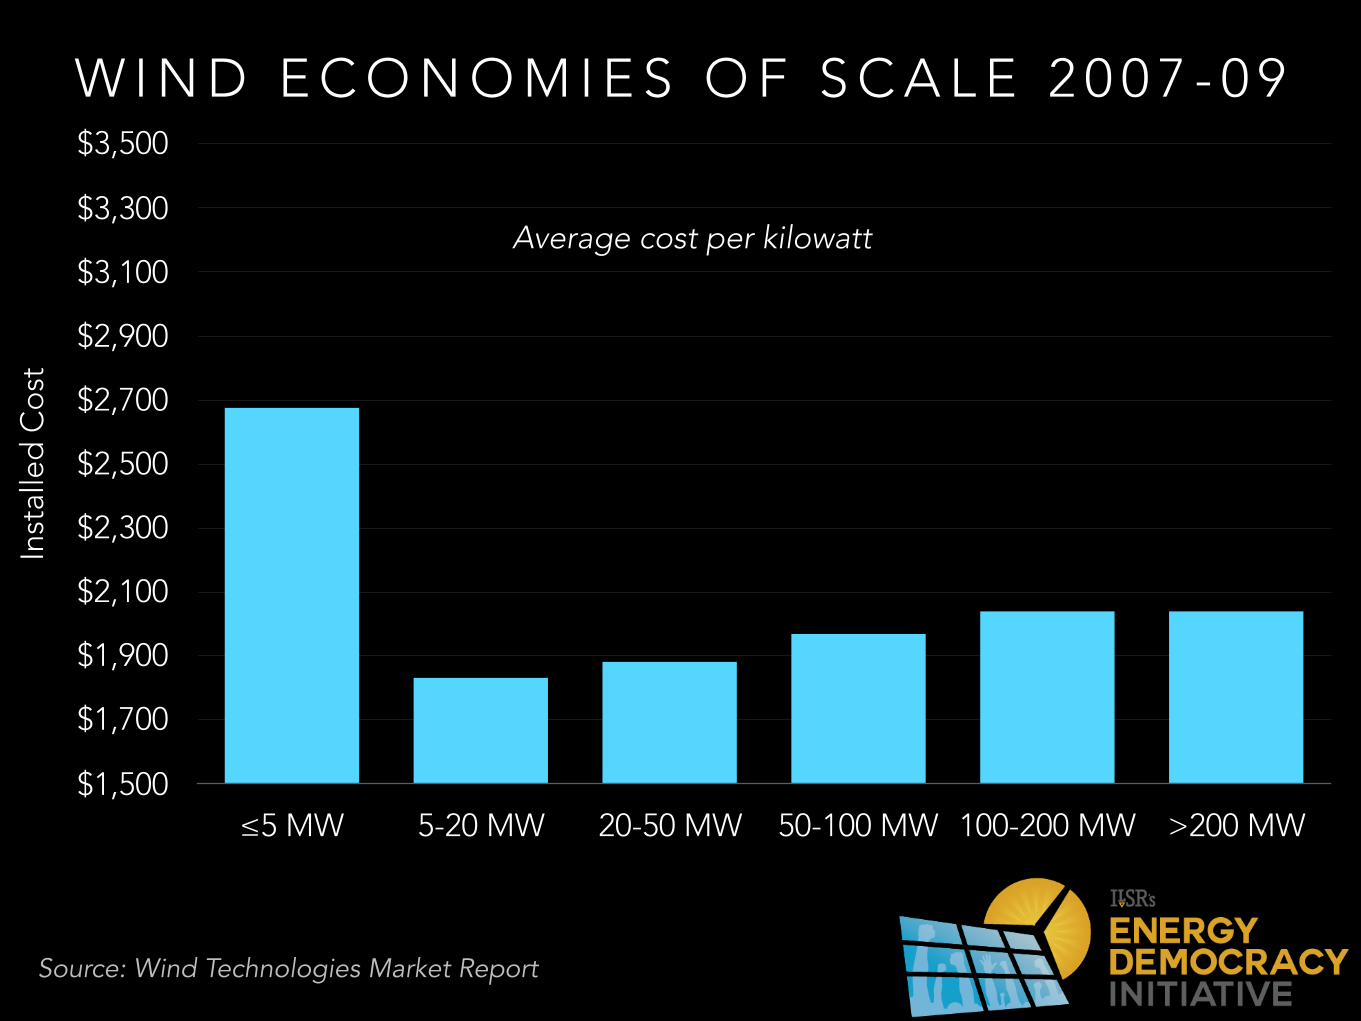
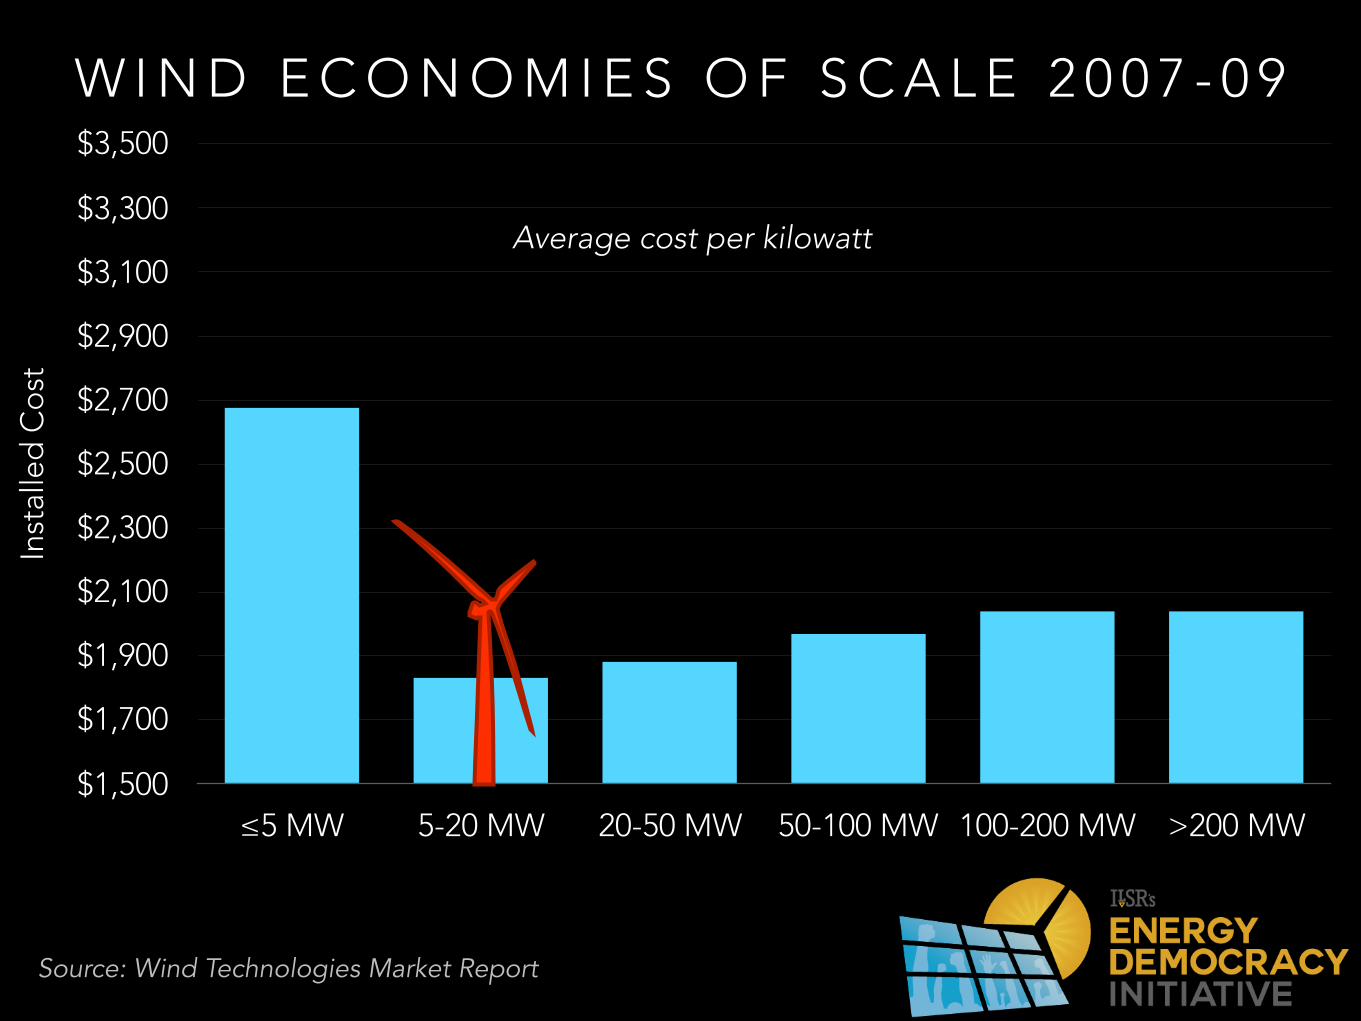
S U R P R I S I N G S AV I N G S I N S M A L L N E S S
Inst
alle
d C
ost
$1,500
$1,700
$1,900
$2,100
$2,300
$2,500
$2,700
$2,900
$3,100
$3,300
$3,500
≤5 MW 5-20 MW 20-50 MW 50-100 MW 100-200 MW >200 MW
W I N D E C O N O M I E S O F S C A L E 2 0 0 7 - 0 9
Source: Wind Technologies Market Report
Average cost per kilowatt
Inst
alle
d C
ost
$1,500
$1,700
$1,900
$2,100
$2,300
$2,500
$2,700
$2,900
$3,100
$3,300
$3,500
≤5 MW 5-20 MW 20-50 MW 50-100 MW 100-200 MW >200 MW
W I N D E C O N O M I E S O F S C A L E 2 0 0 7 - 0 9
Source: Wind Technologies Market Report
Average cost per kilowatt
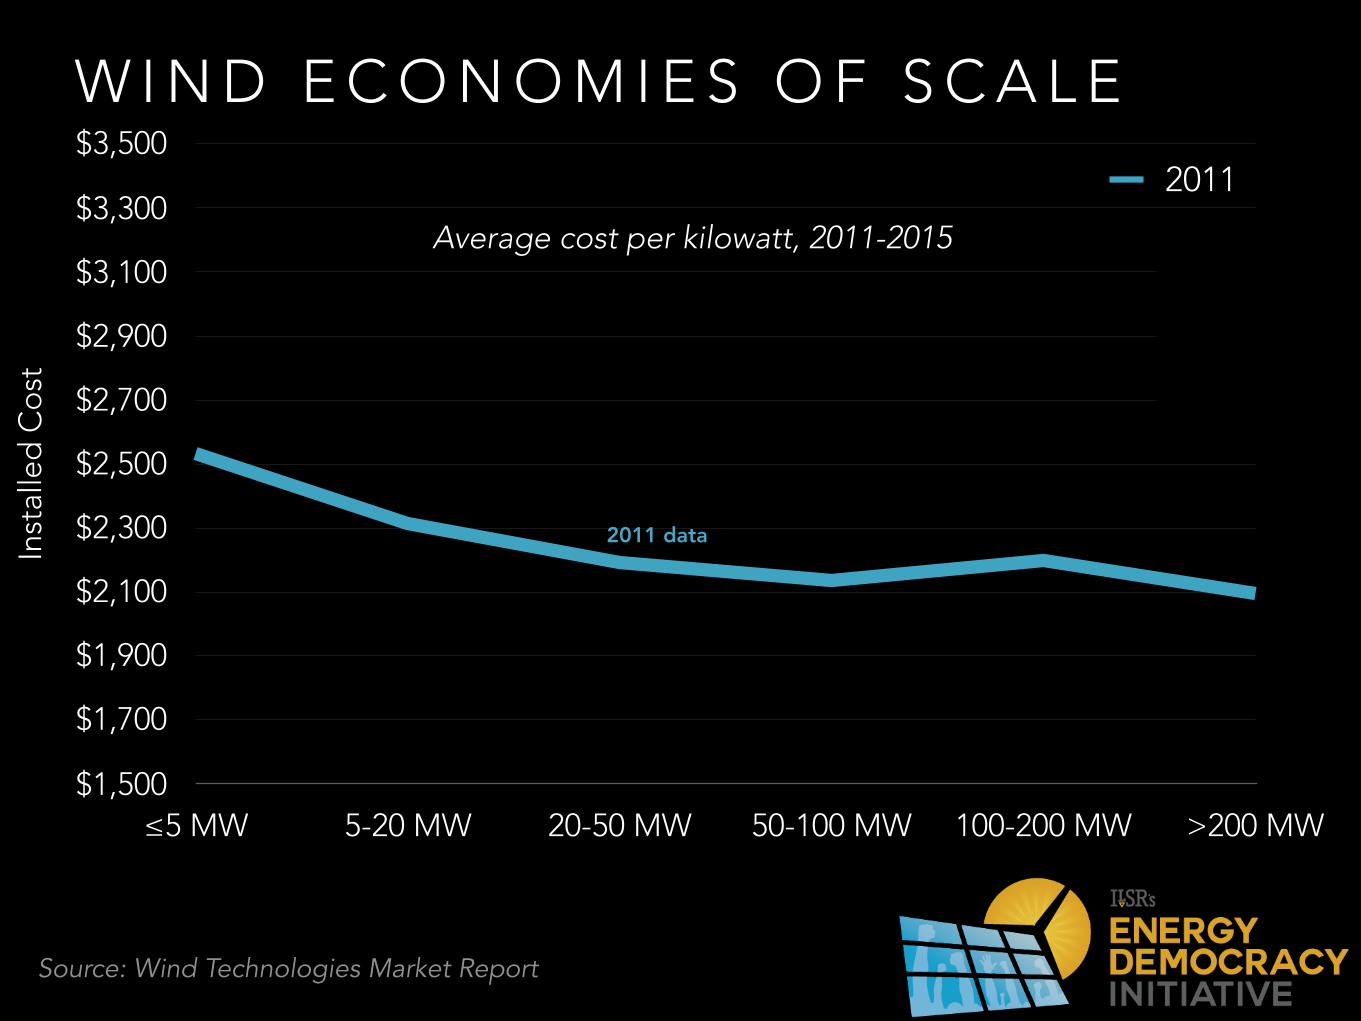
W I N D E C O N O M I E S O F S C A L EIn
stal
led
Co
st
$1,500
$1,700
$1,900
$2,100
$2,300
$2,500
$2,700
$2,900
$3,100
$3,300
$3,500
≤5 MW 5-20 MW 20-50 MW 50-100 MW 100-200 MW >200 MW
2011
2012
2013
2014
2015
Source: Wind Technologies Market Report
Average cost per kilowatt, 2011-2015
2011 data

W I N D E C O N O M I E S O F S C A L EIn
stal
led
Co
st
$1,500
$1,700
$1,900
$2,100
$2,300
$2,500
$2,700
$2,900
$3,100
$3,300
$3,500
≤5 MW 5-20 MW 20-50 MW 50-100 MW 100-200 MW >200 MW
2011
2012
2013
2014
2015
Source: Wind Technologies Market Report
Average cost per kilowatt, 2011-2015
2011 data
2015 data
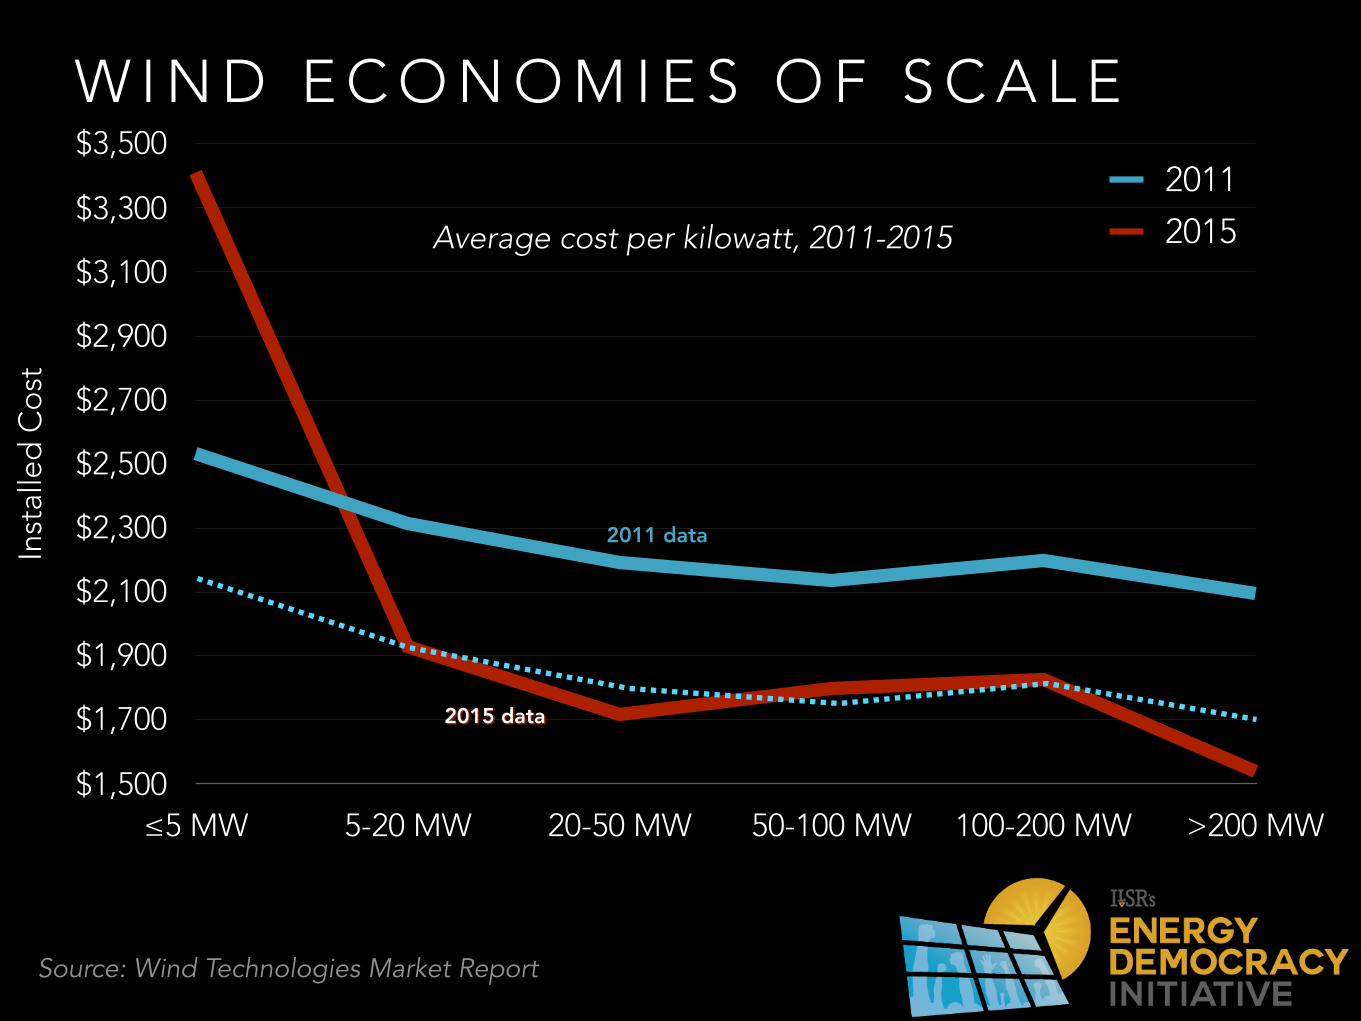
W I N D E C O N O M I E S O F S C A L EIn
stal
led
Co
st
$1,500
$1,700
$1,900
$2,100
$2,300
$2,500
$2,700
$2,900
$3,100
$3,300
$3,500
≤5 MW 5-20 MW 20-50 MW 50-100 MW 100-200 MW >200 MW
2011
2015
Source: Wind Technologies Market Report
Average cost per kilowatt, 2011-2015
2011 data
2015 data

W I N D E C O N O M I E S O F S C A L EIn
stal
led
Co
st
0%
20%
40%
60%
80%
100%
120%
140%
≤5 MW 5-20 MW 20-50 MW 50-100 MW 100-200 MW >200 MW
84%87%88%92%100%
131%Average cost per kilowatt as a percentage of 5-20 MW wind projects,
2011-2015 average data
Source: Wind Technologies Market Report
$2,191/kW

B E N E F I T S O F L O C A L
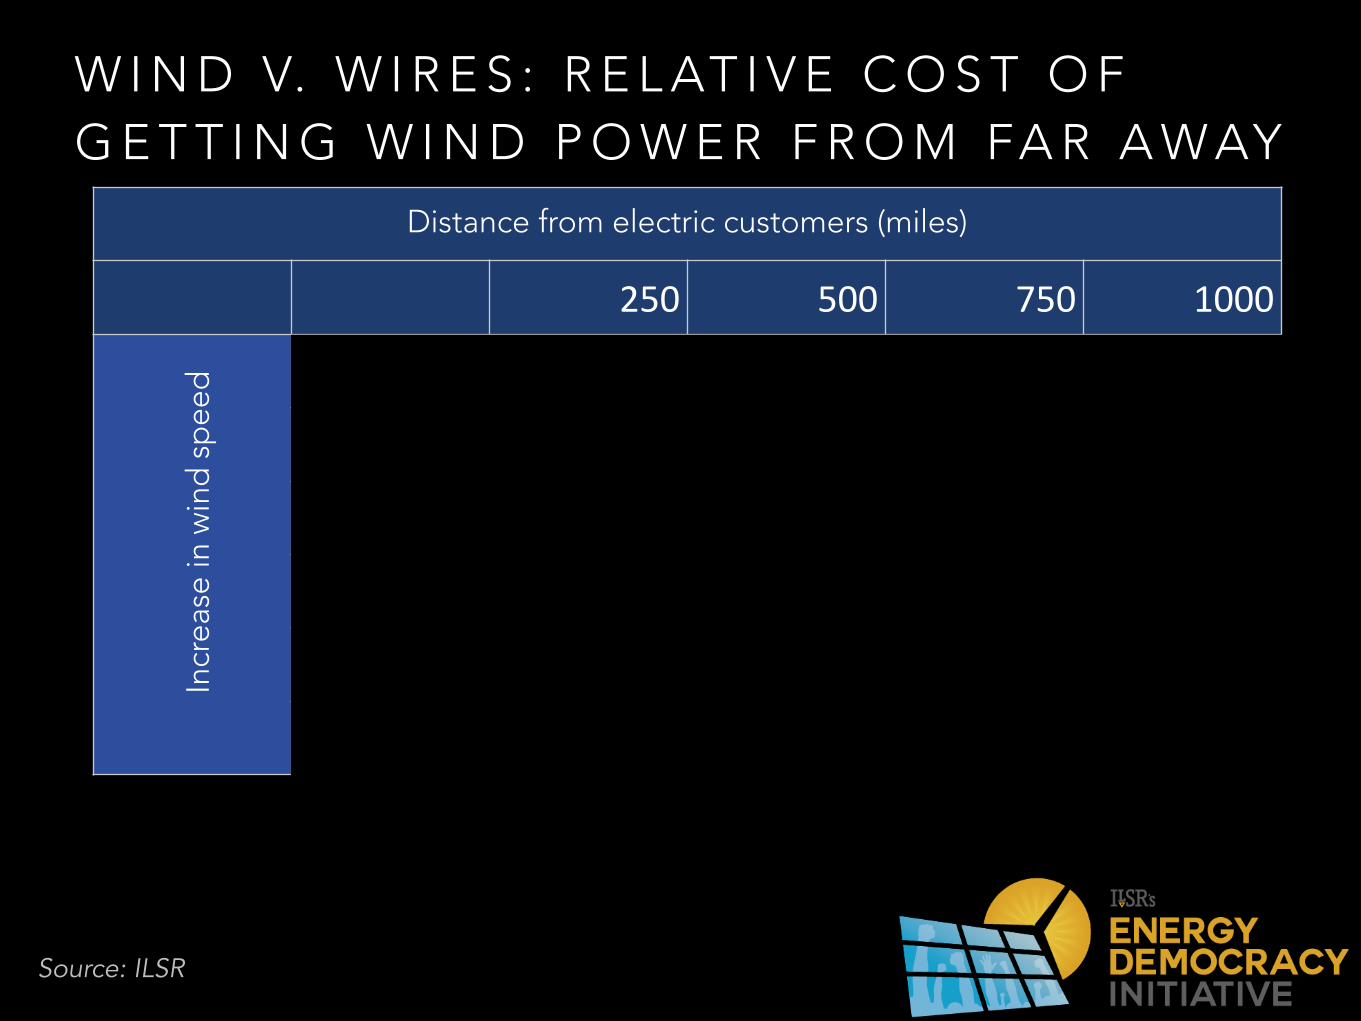
W I N D V. W I R E S : R E L AT I V E C O S T O F G E T T I N G W I N D P O W E R F R O M FA R A W AY
Source: ILSR
250 500 750 1000
10% 108% 131% 154% 176%
20% 93% 116% 139% 162%
30% 78% 101% 124% 147%
40% 64% 86% 109% 132%
50% 49% 72% 94% 117%
60% 34% 57% 80% 102%
Distance from electric customers (miles)
Baseline cost of 3.6¢ per kilowatt-hour
Incr
ease
in w
ind
sp
eed

W I N D V. W I R E S : R E L AT I V E C O S T O F G E T T I N G W I N D P O W E R F R O M FA R A W AY
Source: ILSR
250 500 750 1000
10% 108% 131% 154% 176%
20% 93% 116% 139% 162%
30% 78% 101% 124% 147%
40% 64% 86% 109% 132%
50% 49% 72% 94% 117%
60% 34% 57% 80% 102%
Distance from electric customers (miles)
Transmission cost outweighs wind speed benefit
Baseline cost of 3.6¢ per kilowatt-hour
Incr
ease
in w
ind
sp
eed
Transmission lowers cost
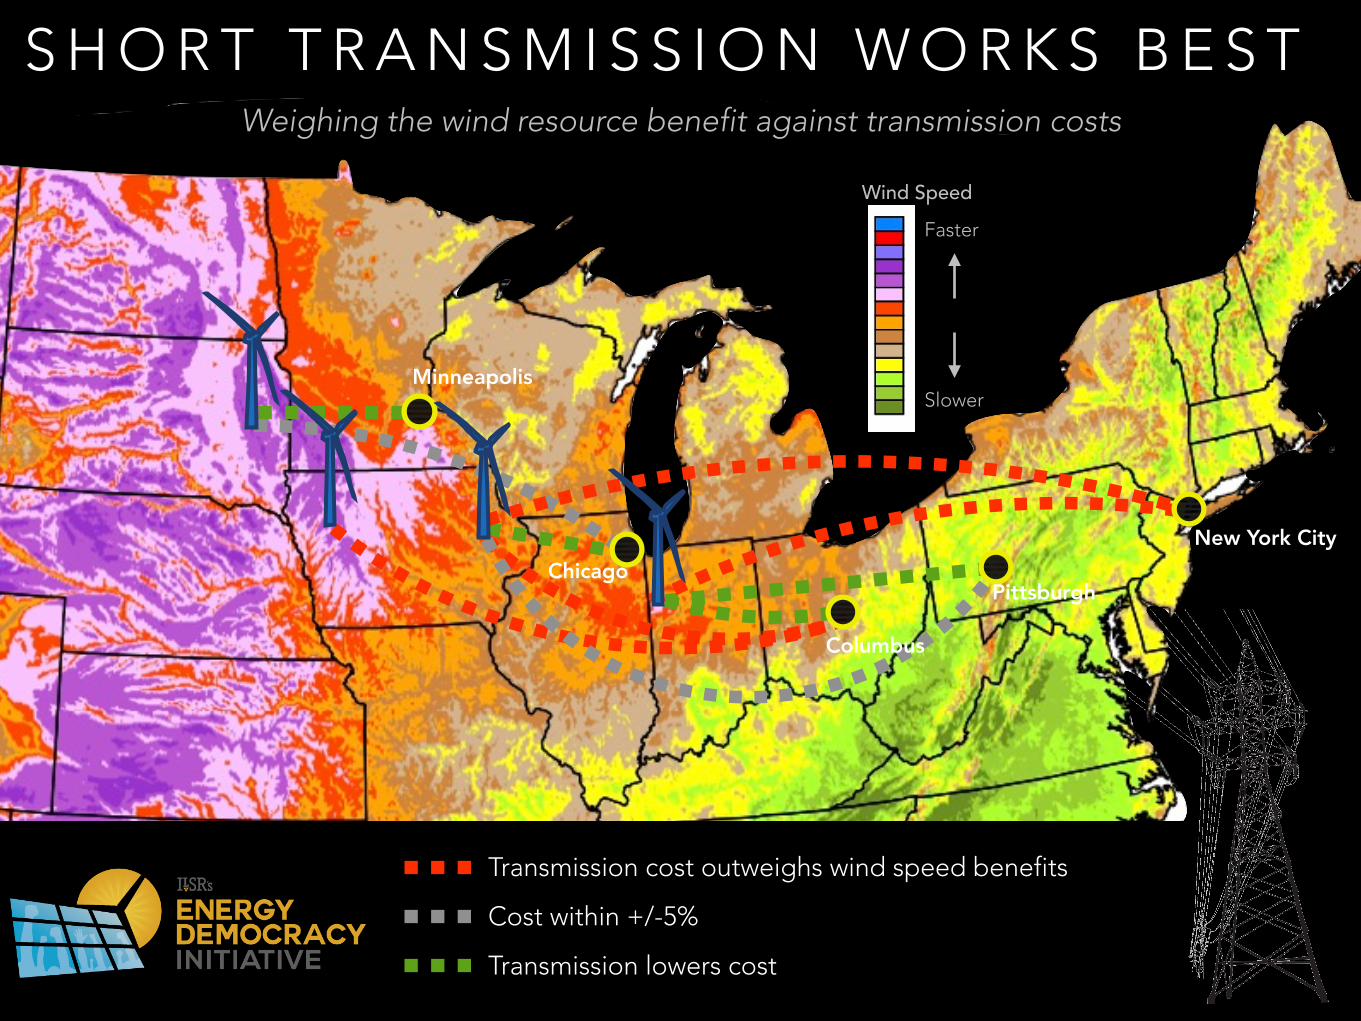
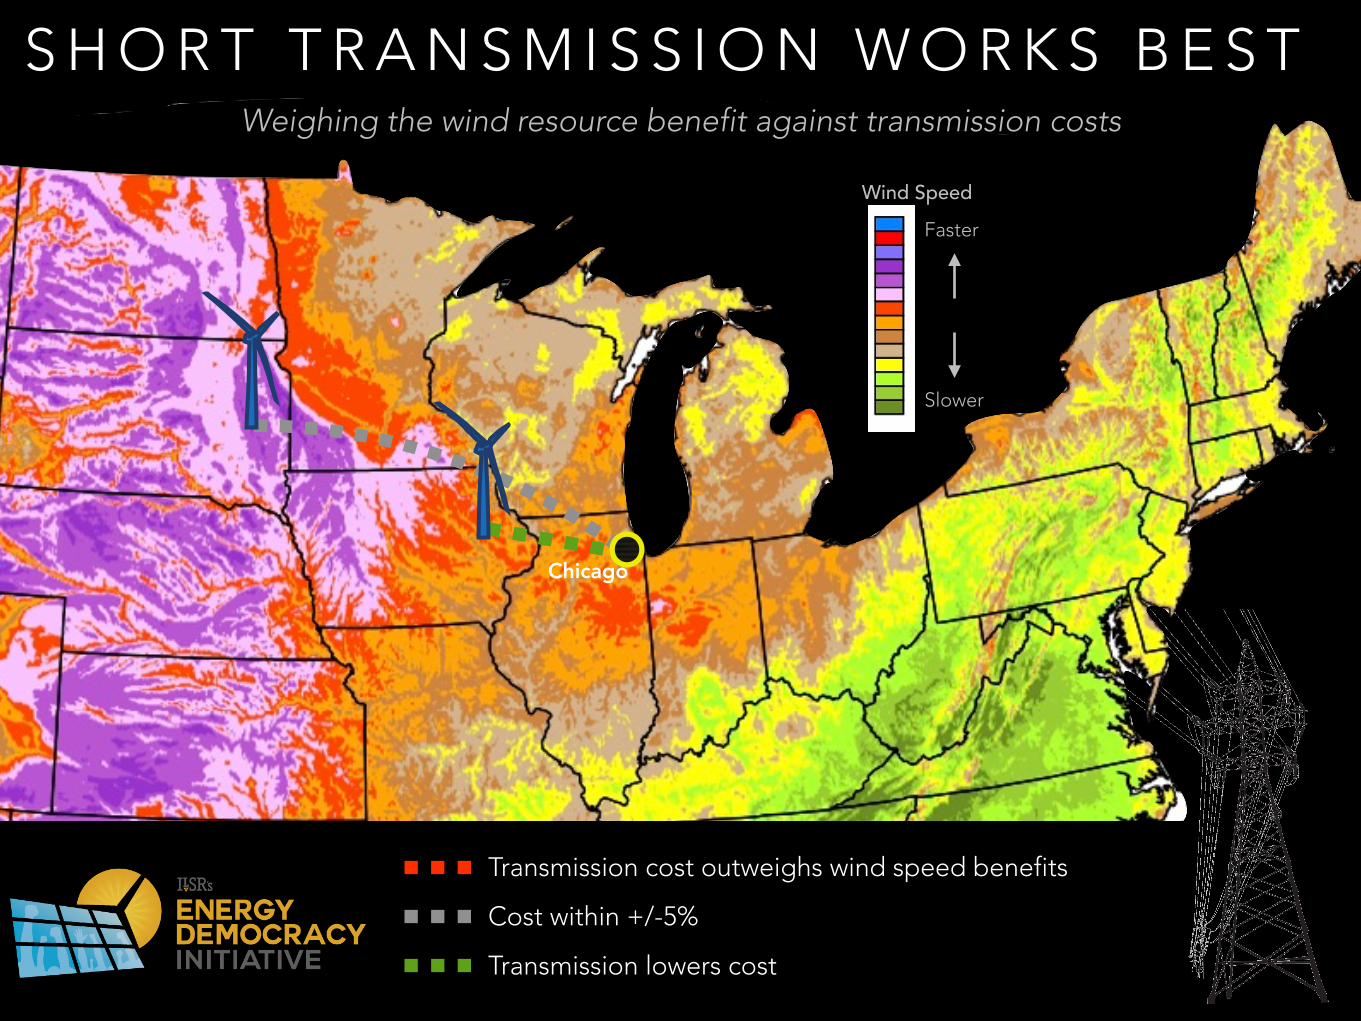
S H O R T T R A N S M I S S I O N W O R K S B E S TWeighing the wind resource benefit against transmission costs
Transmission cost outweighs wind speed benefits
Minneapolis
Chicago
Columbus
Pittsburgh
New York City
Transmission lowers cost
Cost within +/-5%
Wind SpeedFaster
Slower
S H O R T T R A N S M I S S I O N W O R K S B E S TWeighing the wind resource benefit against transmission costs
Transmission cost outweighs wind speed benefits
Chicago
Transmission lowers cost
Cost within +/-5%
Wind SpeedFaster
Slower

S H O R T T R A N S M I S S I O N W O R K S B E S TWeighing the wind resource benefit against transmission costs
Transmission cost outweighs wind speed benefits
ChicagoNew York City
Transmission lowers cost
Cost within +/-5%
Wind SpeedFaster
Slower

T H E P R I C E T H AT M AT T E R S
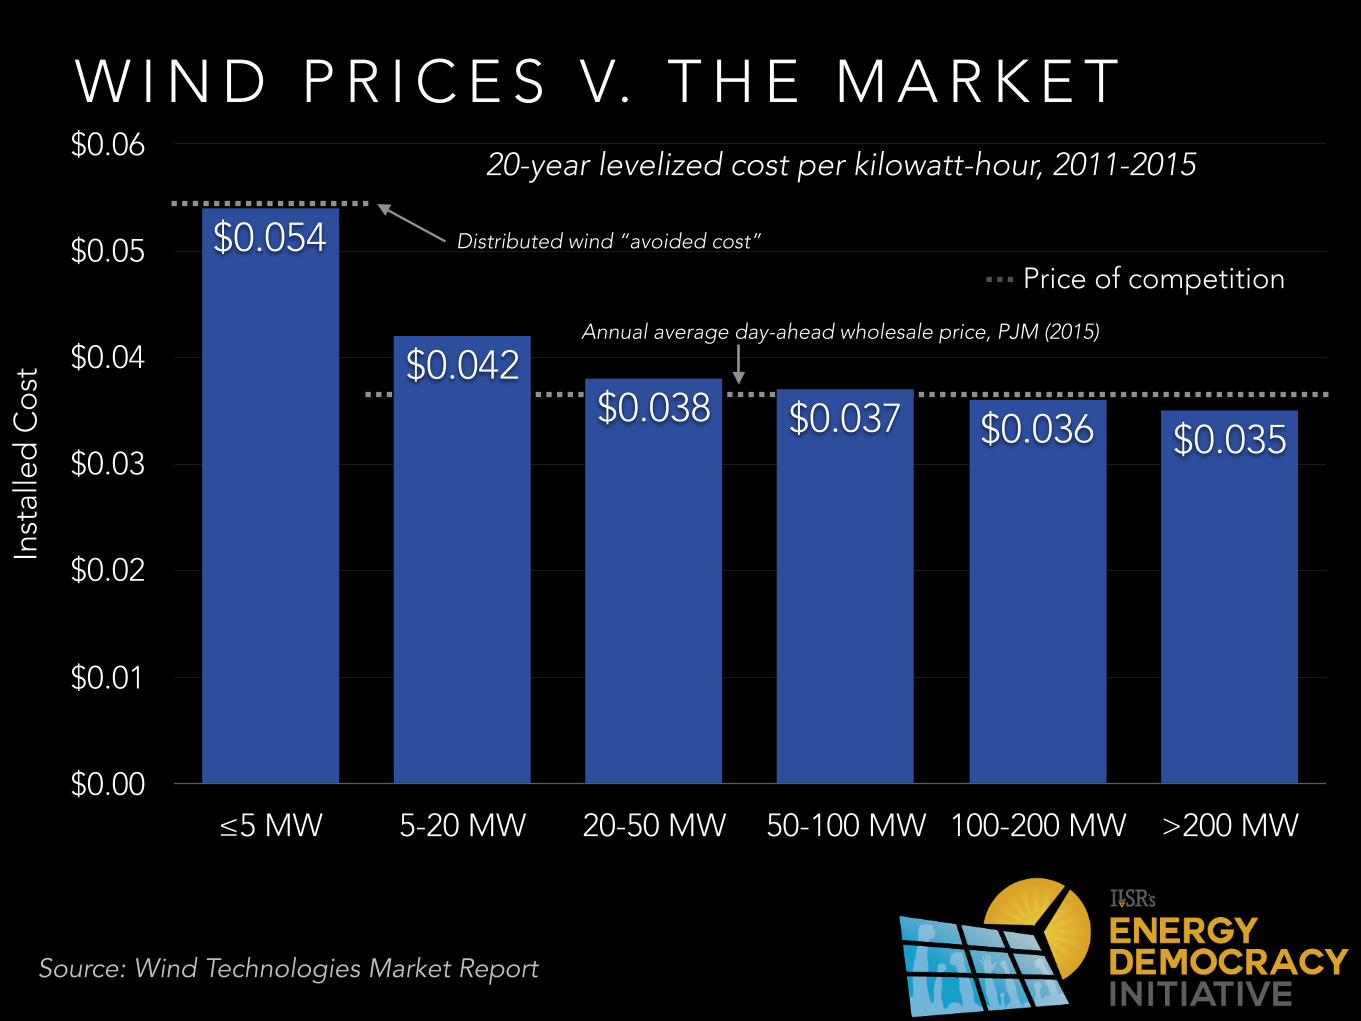
W I N D P R I C E S V. T H E M A R K E T20-year levelized cost per kilowatt-hour, 2011-2015
Source: Wind Technologies Market Report
Price of competition
Annual average day-ahead wholesale price, PJM (2015)
Distributed wind “avoided cost”
Inst
alle
d C
ost
$0.00
$0.01
$0.02
$0.03
$0.04
$0.05
$0.06
≤5 MW 5-20 MW 20-50 MW 50-100 MW 100-200 MW >200 MW
$0.035$0.036$0.037$0.038$0.042
$0.054

S O L A R P O W E R
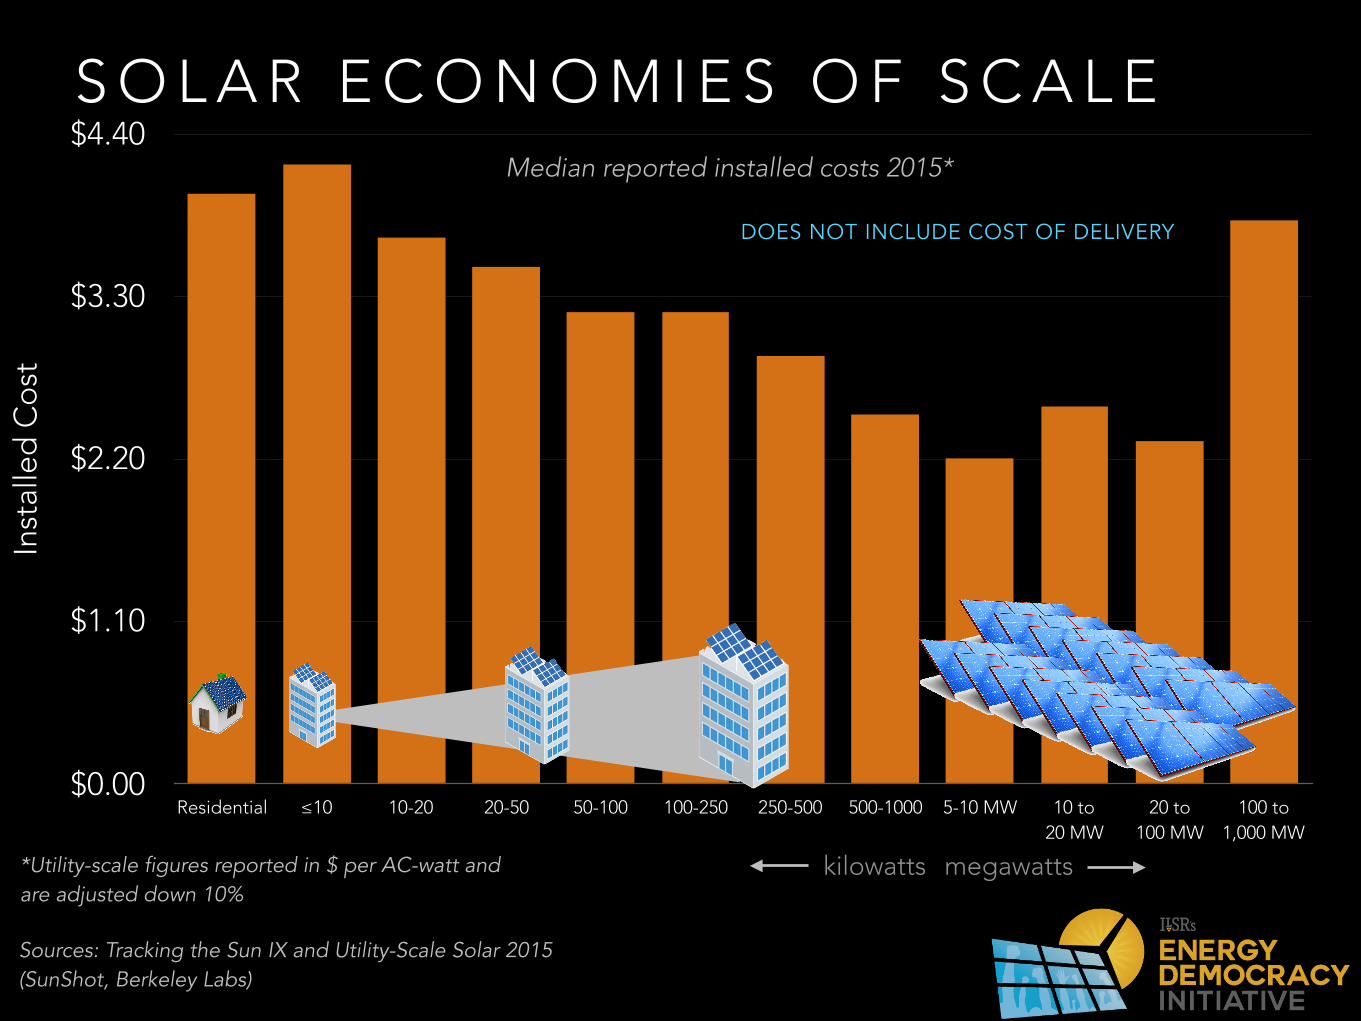
S O L A R E C O N O M I E S O F S C A L EIn
stal
led
Co
st
$0.00
$1.10
$2.20
$3.30
$4.40
Residential ≤10 10-20 20-50 50-100 100-250 250-500 500-1000 5-10 MW 10 to 20 MW
20 to 100 MW
100 to 1,000 MW
Median reported installed costs 2015*
kilowatts megawatts
Sources: Tracking the Sun IX and Utility-Scale Solar 2015 (SunShot, Berkeley Labs)
DOES NOT INCLUDE COST OF DELIVERY
*Utility-scale figures reported in $ per AC-watt and are adjusted down 10%

S O L A R E C O N O M I E S O F S C A L EC
ost
of e
lect
ricity
0.0¢
2.0¢
4.0¢
6.0¢
8.0¢
10.0¢
12.0¢
14.0¢
Residential ≤10 10-20 20-50 50-100 100-250 250-500 500-1000 5-10 MW 10 to 20 MW
20 to 100 MW
100 to 1,000 MW
Estimated levelized cost of electricity based on reported 2015 costs*
kilowatts megawatts
Sources: Tracking the Sun IX and Utility-Scale Solar 2015 (SunShot, Berkeley Labs); SAM (NREL); ILSR
DOES NOT INCLUDE COST OF DELIVERY

T H E P R I C E T H AT M AT T E R S
Co
st o
f ele
ctric
ity
0.0¢
2.0¢
4.0¢
6.0¢
8.0¢
10.0¢
12.0¢
14.0¢
Residential ≤10 10-20 20-50 50-100 100-250 250-500 500-1000 5-10 MW 10 to 20 MW
20 to 100 MW
100 to 1,000 MW
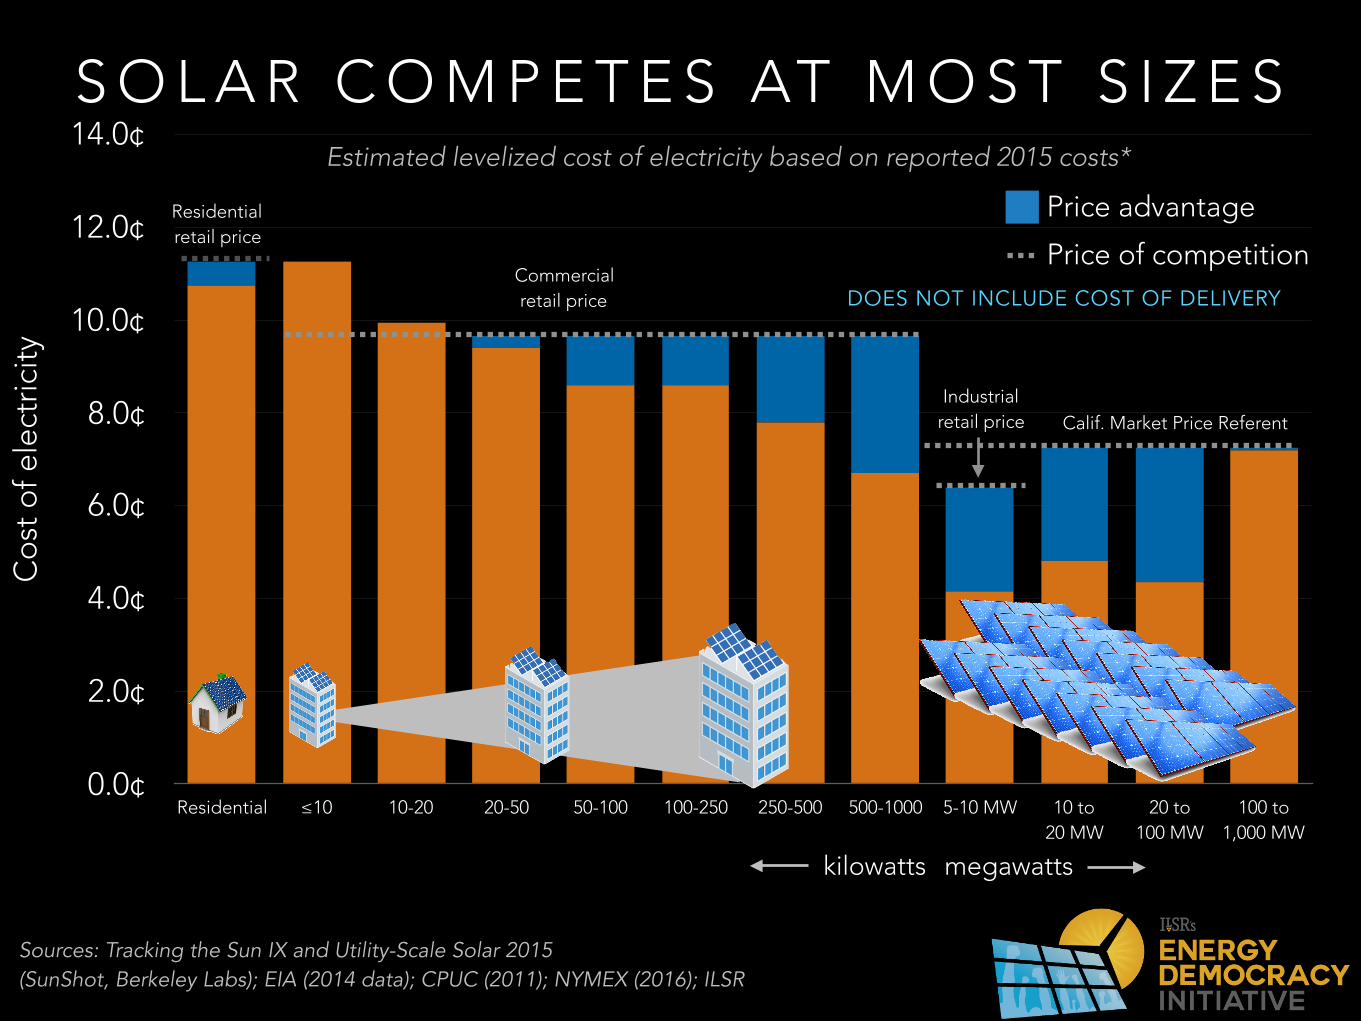
S O L A R C O M P E T E S AT M O S T S I Z E S
kilowatts megawatts
Sources: Tracking the Sun IX and Utility-Scale Solar 2015 (SunShot, Berkeley Labs); EIA (2014 data); CPUC (2011); NYMEX (2016); ILSR
DOES NOT INCLUDE COST OF DELIVERY
Residential retail price
Commercial retail price
Industrial retail price Calif. Market Price Referent
Price of competition
Price advantage
Estimated levelized cost of electricity based on reported 2015 costs*
S I Z A B L E D E P L O Y M E N T S

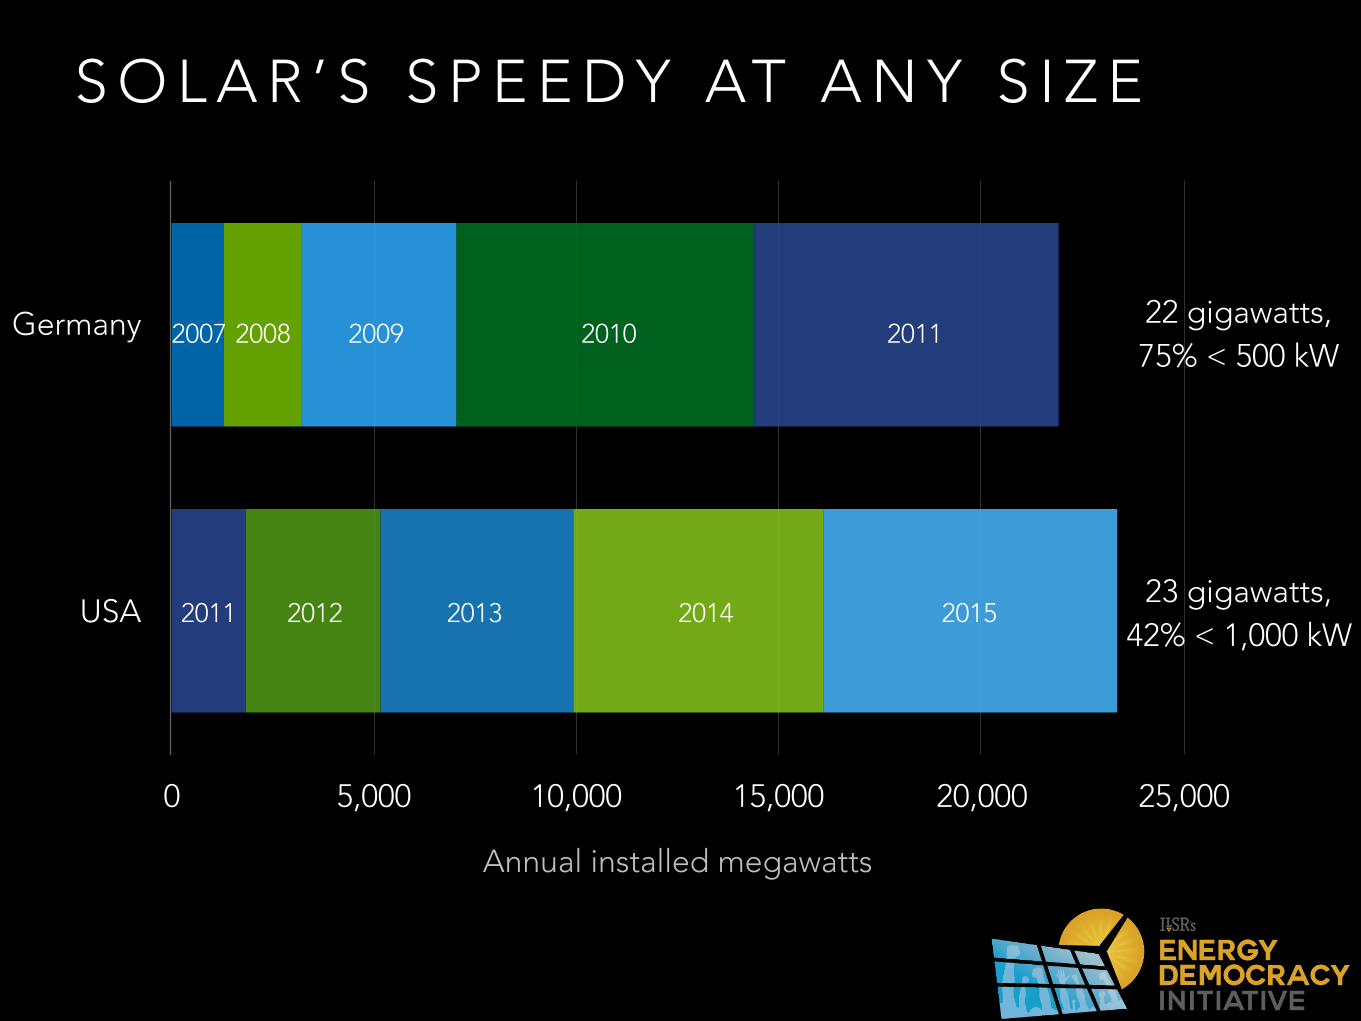
S O L A R ’ S S P E E D Y AT A N Y S I Z E
Germany
USA
Annual installed megawatts
0 5,000 10,000 15,000 20,000 25,000
22 gigawatts, 75% < 500 kW
23 gigawatts, 42% < 1,000 kW
2007 2008 2009 2010 2011
2011 2012 2013 2014 2015
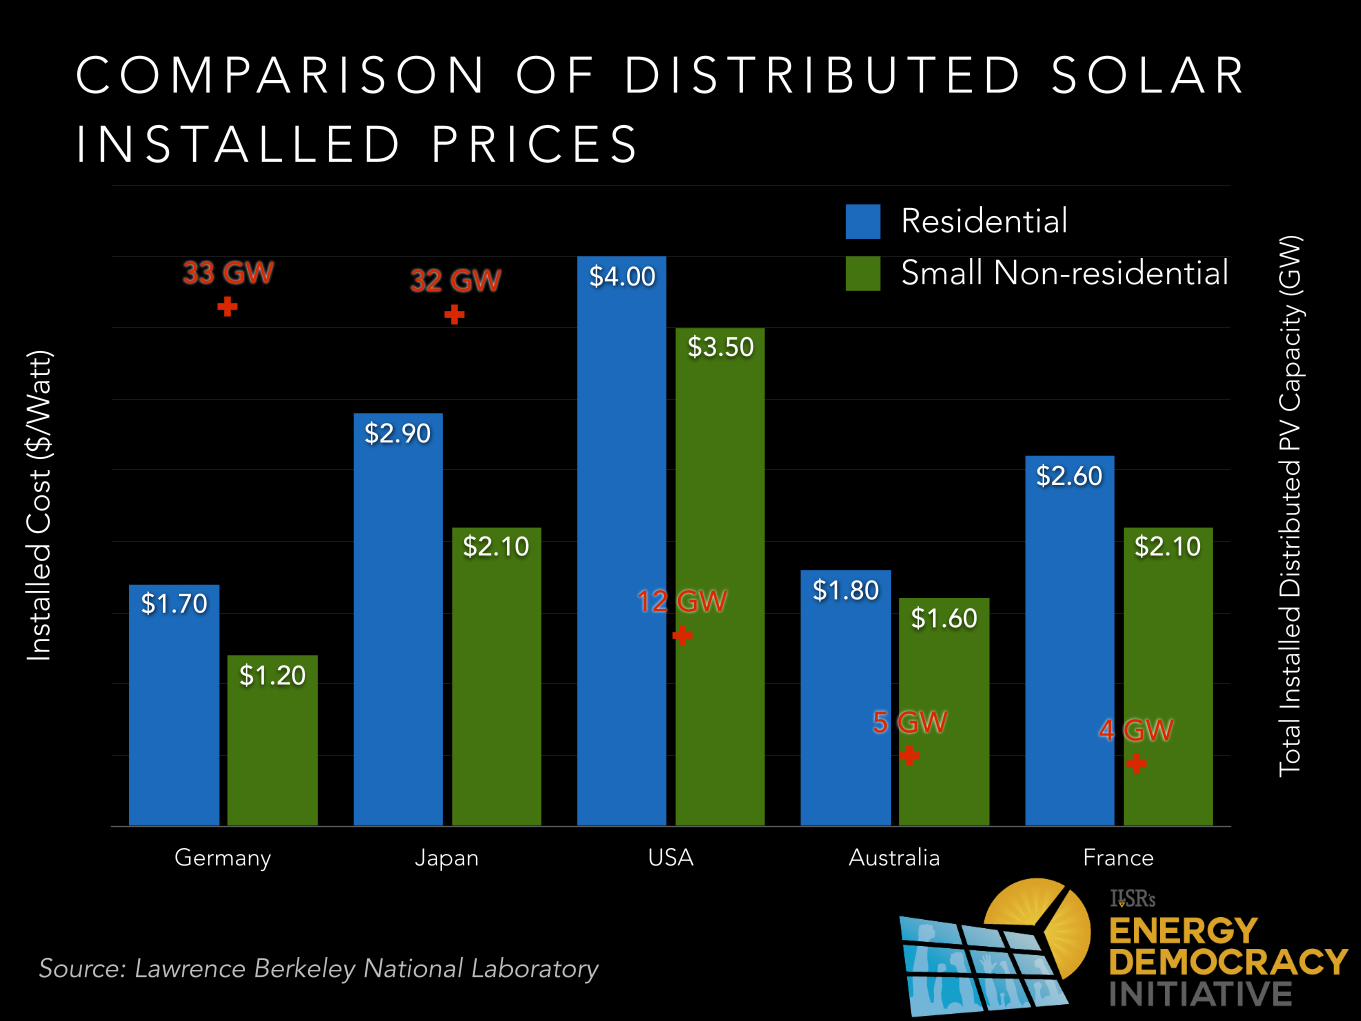
Inst
alle
d C
ost
($/W
att)
Germany Japan USA Australia France
$2.10
$1.60
$3.50
$2.10
$1.20
$2.60
$1.80
$4.00
$2.90
$1.70
Residential
Small Non-residential
$0.0 $1.3 $2.5 $3.8 $5.0
33 GW 32 GW
12 GW
5 GW 4 GW
C O M PA R I S O N O F D I S T R I B U T E D S O L A R I N S TA L L E D P R I C E S
Tota
l Ins
talle
d D
istr
ibut
ed P
V C
apac
ity (G
W)
Source: Lawrence Berkeley National Laboratory
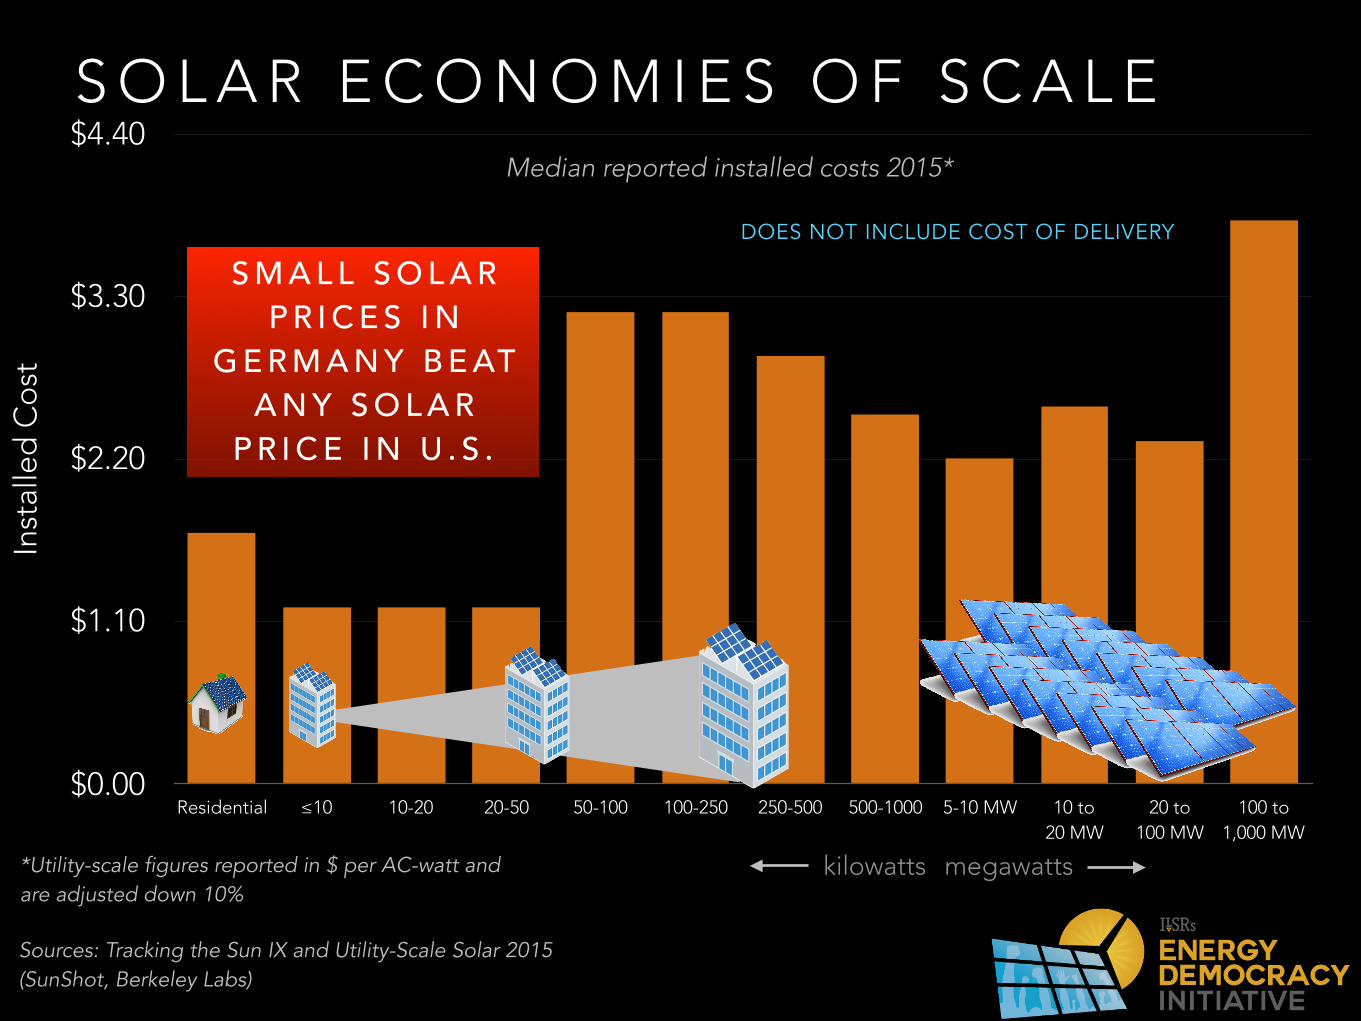
S O L A R E C O N O M I E S O F S C A L EIn
stal
led
Co
st
$0.00
$1.10
$2.20
$3.30
$4.40
Residential ≤10 10-20 20-50 50-100 100-250 250-500 500-1000 5-10 MW 10 to 20 MW
20 to 100 MW
100 to 1,000 MW
Median reported installed costs 2015*
kilowatts megawatts
Sources: Tracking the Sun IX and Utility-Scale Solar 2015 (SunShot, Berkeley Labs)
DOES NOT INCLUDE COST OF DELIVERY
*Utility-scale figures reported in $ per AC-watt and are adjusted down 10%
S M A L L S O L A R P R I C E S I N
G E R M A N Y B E AT A N Y S O L A R
P R I C E I N U . S .

B O T T O M L I N E ?
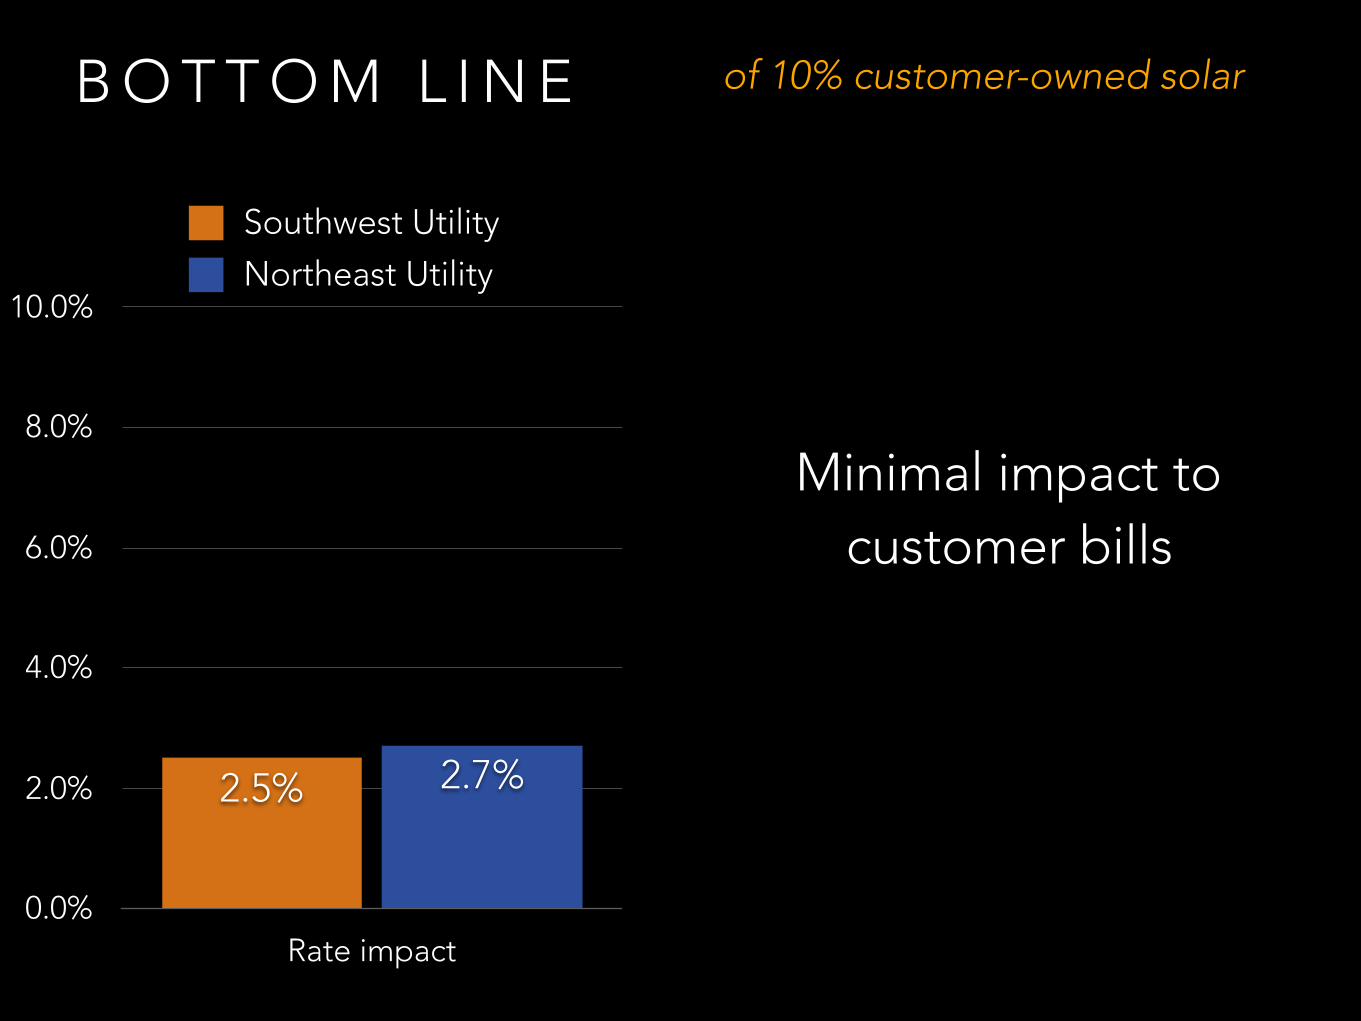
0.0%
2.0%
4.0%
6.0%
8.0%
10.0%
Rate impact
2.7%2.5%
Southwest Utility
Northeast Utility
B O T T O M L I N E of 10% customer-owned solar
Minimal impact to customer bills
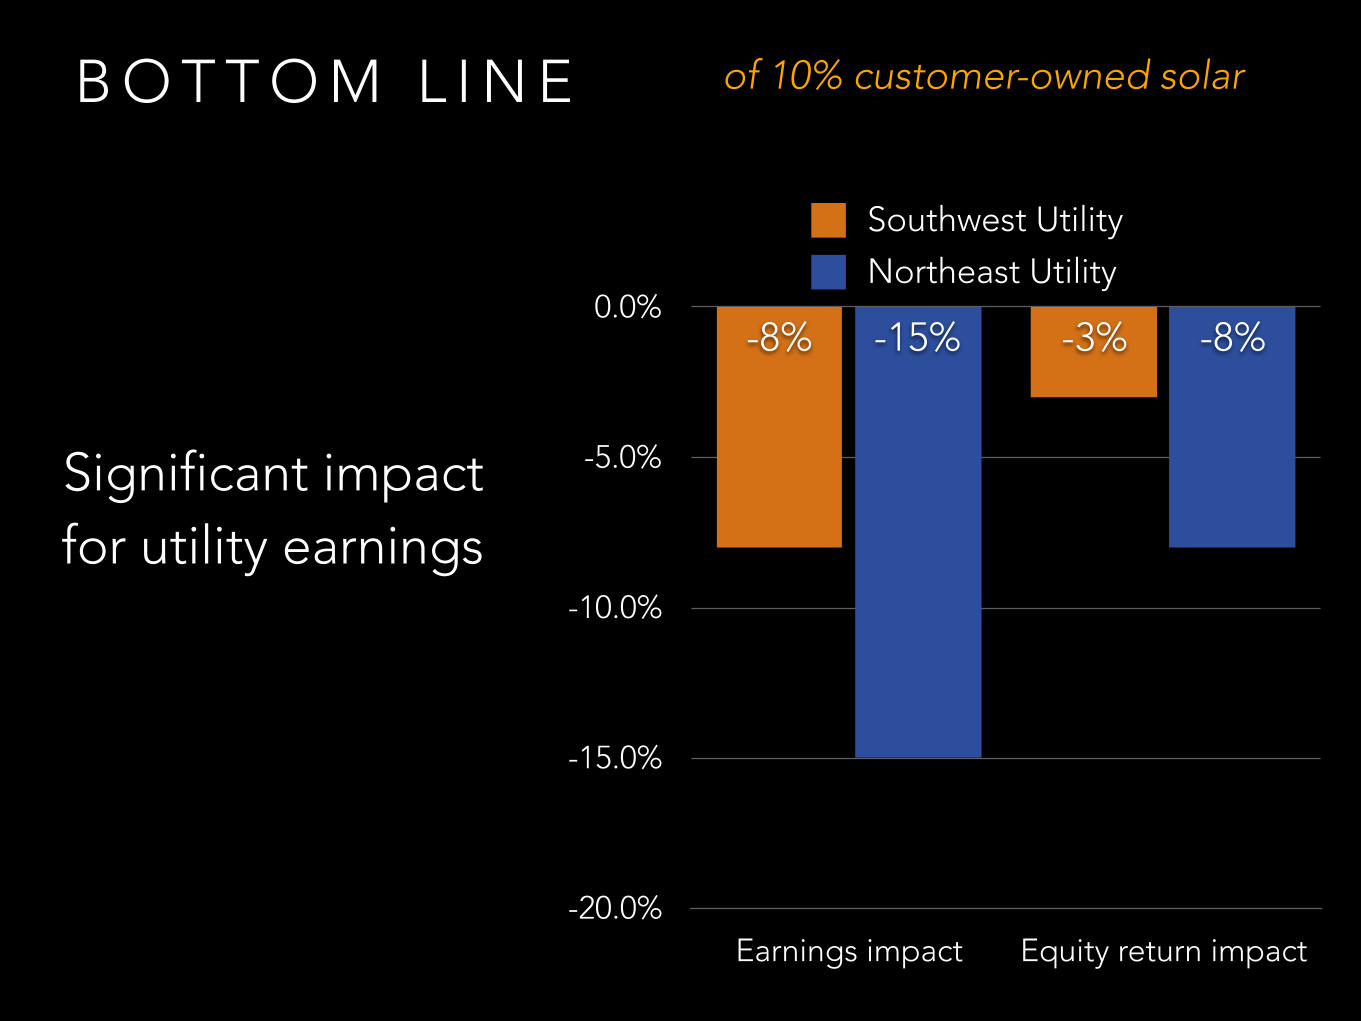
-20.0%
-15.0%
-10.0%
-5.0%
0.0%
Earnings impact Equity return impact
-8%-15% -3%-8%
Southwest Utility
Northeast Utility
B O T T O M L I N E of 10% customer-owned solar
Significant impact for utility earnings

W H O C A R E S ?

“There is one great advantage that must follow regulation, and
that advantage is protection"

“We come to work each day to do what we did the day before”
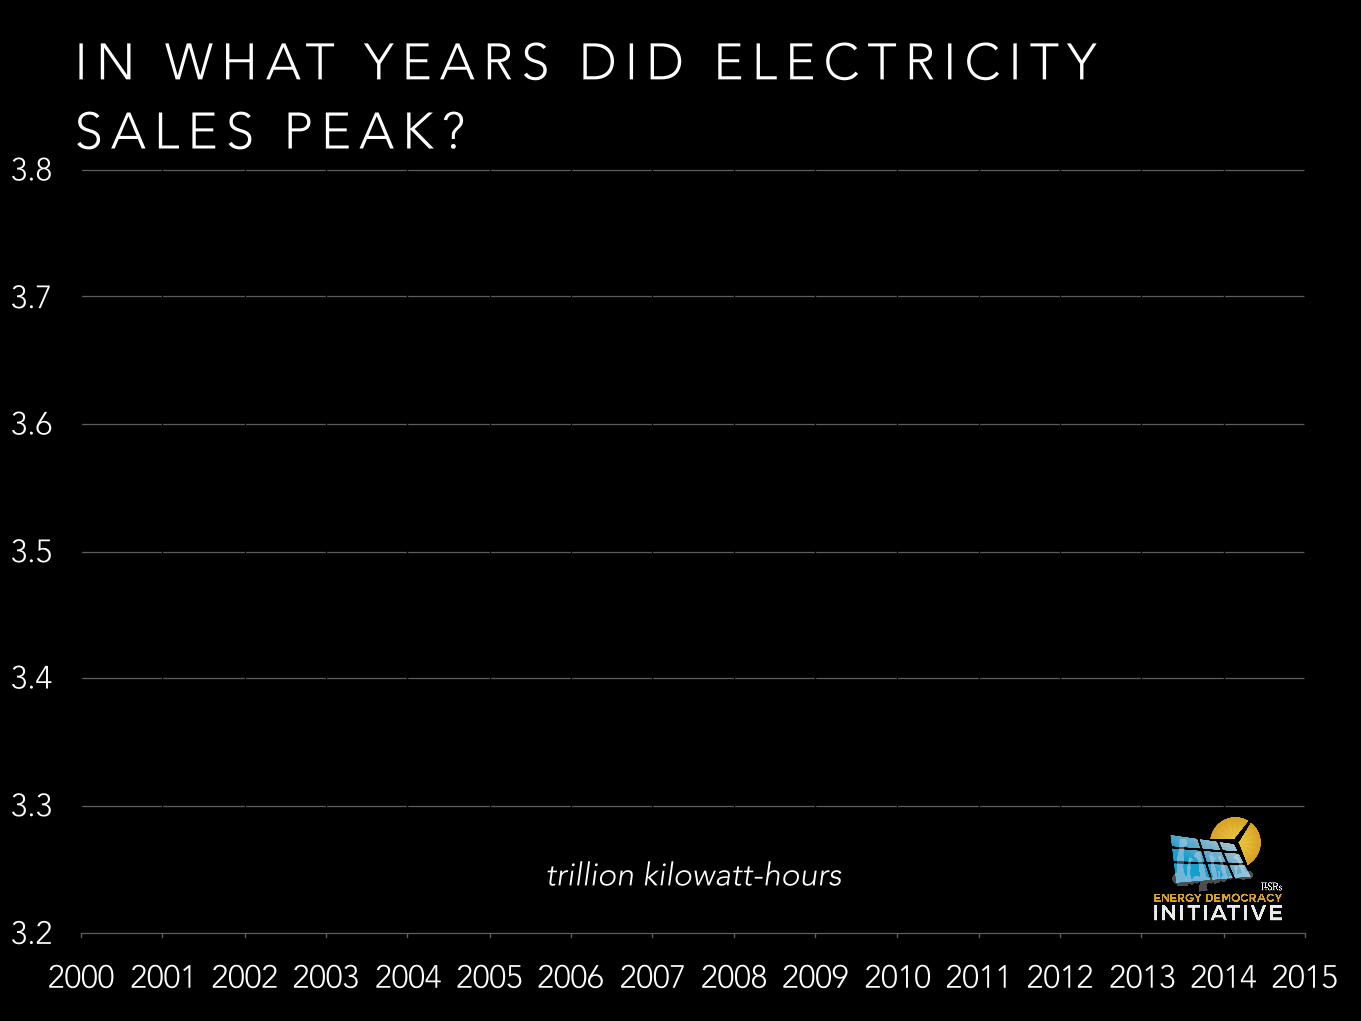
3.2
3.3
3.4
3.5
3.6
3.7
3.8
2000 2001 2002 2003 2004 2005 2006 2007 2008 2009 2010 2011 2012 2013 2014 2015
I N W H AT Y E A R S D I D E L E C T R I C I T Y S A L E S P E A K ?
trillion kilowatt-hours

3.2
3.3
3.4
3.5
3.6
3.7
3.8
2000 2001 2002 2003 2004 2005 2006 2007 2008 2009 2010 2011 2012 2013 2014 2015
P E A K
S TA G N A N T R E TA I L S A L E S
trillion kilowatt-hours
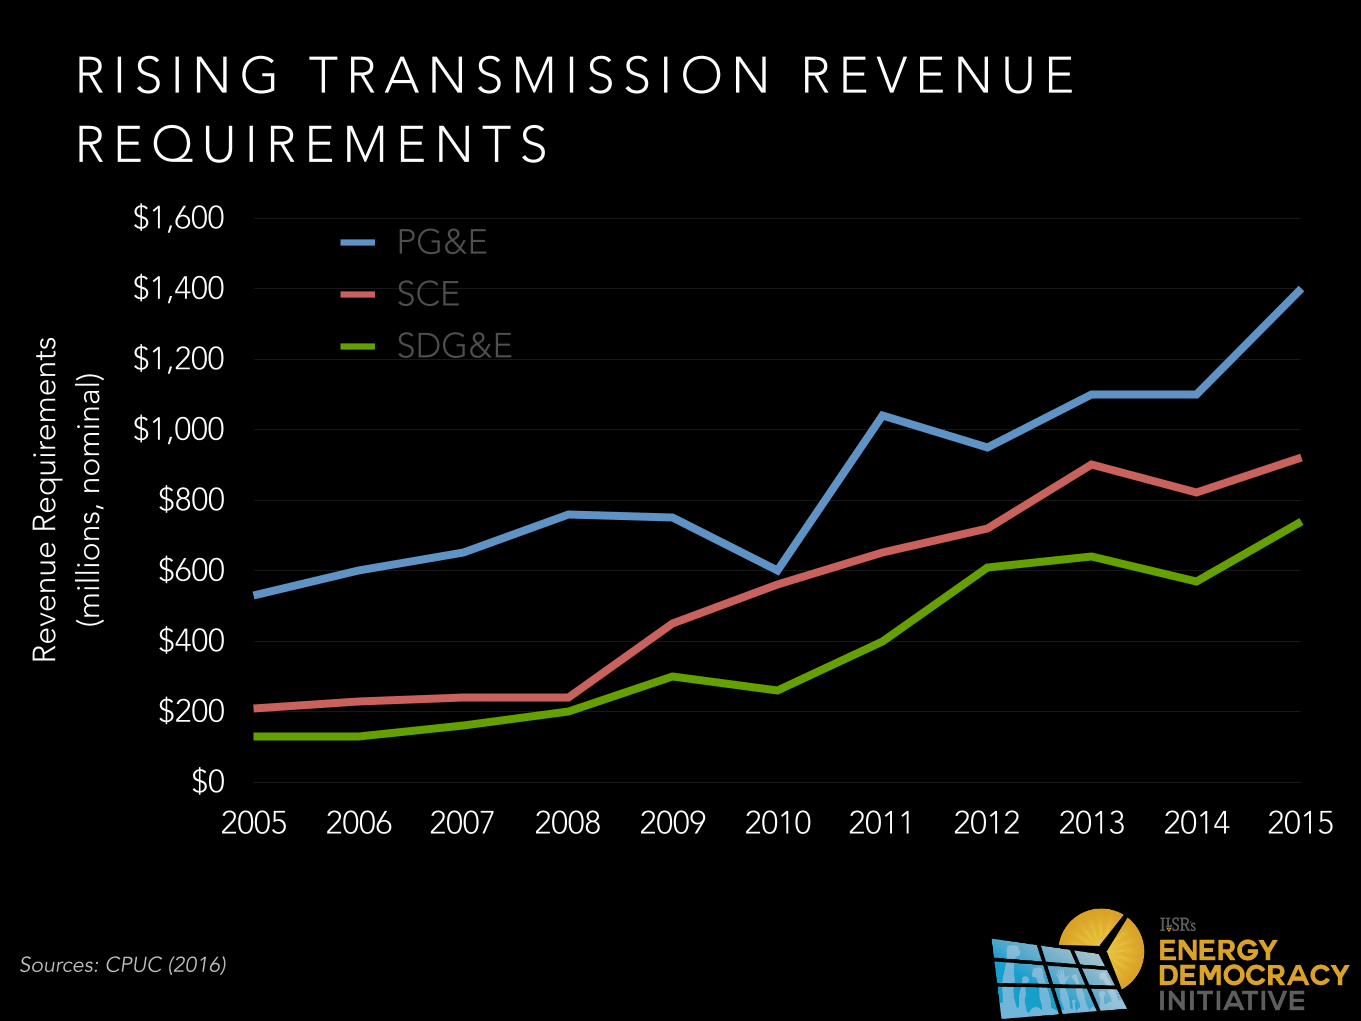
Reve
nue
Req
uire
men
ts
(mill
ions
, no
min
al)
$0
$200
$400
$600
$800
$1,000
$1,200
$1,400
$1,600
2005 2006 2007 2008 2009 2010 2011 2012 2013 2014 2015
PG&E
SCE
SDG&E
R I S I N G T R A N S M I S S I O N R E V E N U E R E Q U I R E M E N T S
Sources: CPUC (2016)
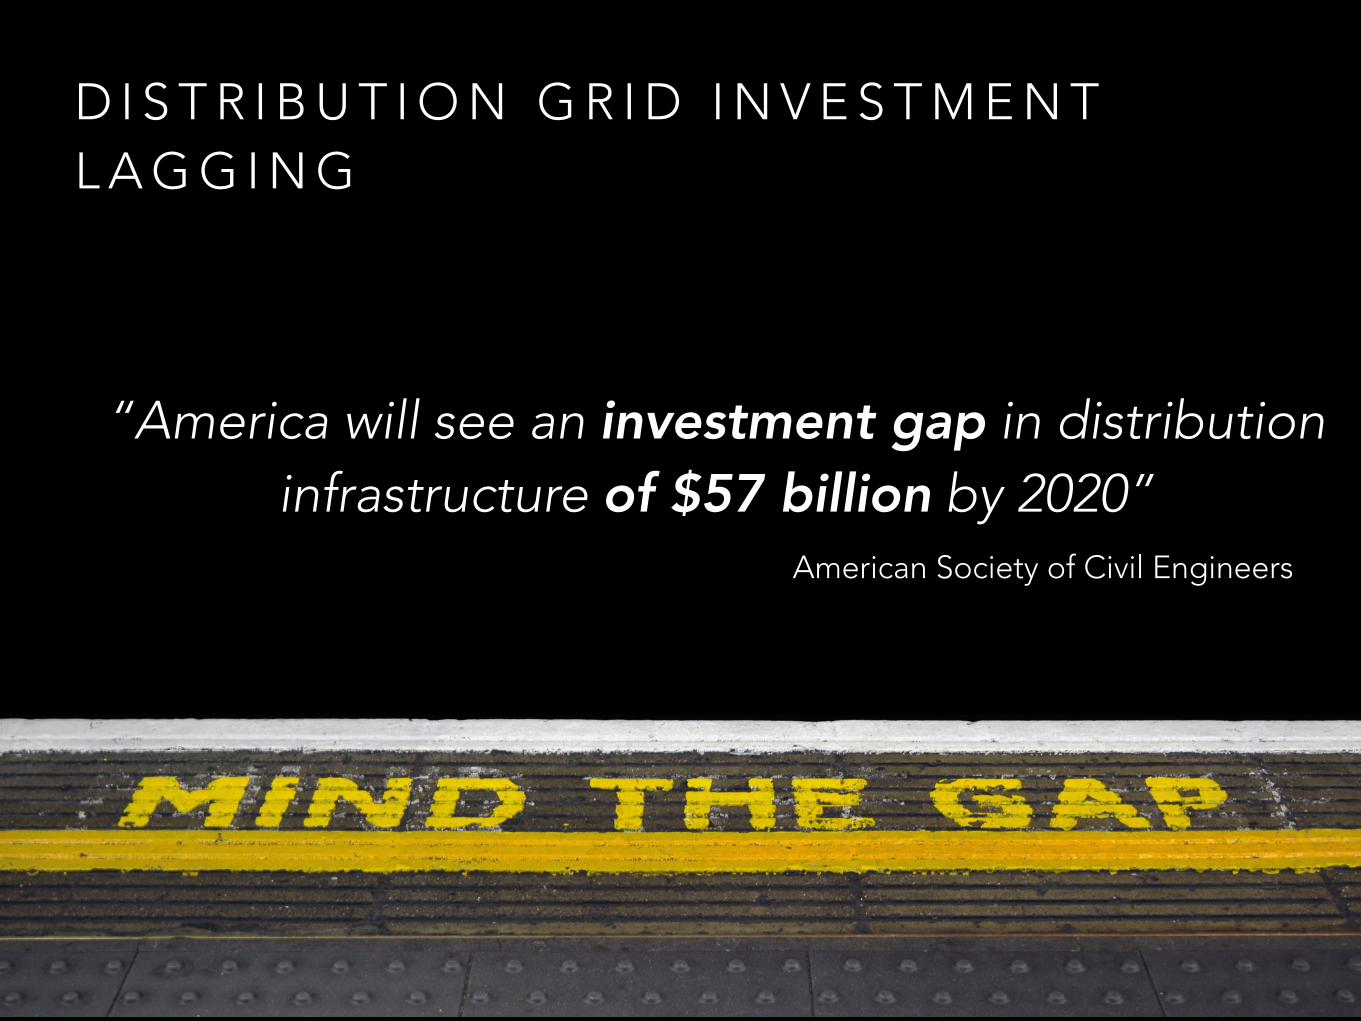
D I S T R I B U T I O N G R I D I N V E S T M E N T L A G G I N G
American Society of Civil Engineers
“America will see an investment gap in distribution infrastructure of $57 billion by 2020”

F R E E D O M T O G E N E R AT E U N D E R F I R ESTATES FACING CHALLENGES TO DISTRIBUTED POWER
May 2016- Q1 2016 action- No recent action
Source: The 50 States of Solar: Q1 2016, NC Clean Energy Technology


N E W R U L E S
• Enable alternatives

N E W R U L E S
• Set up markets
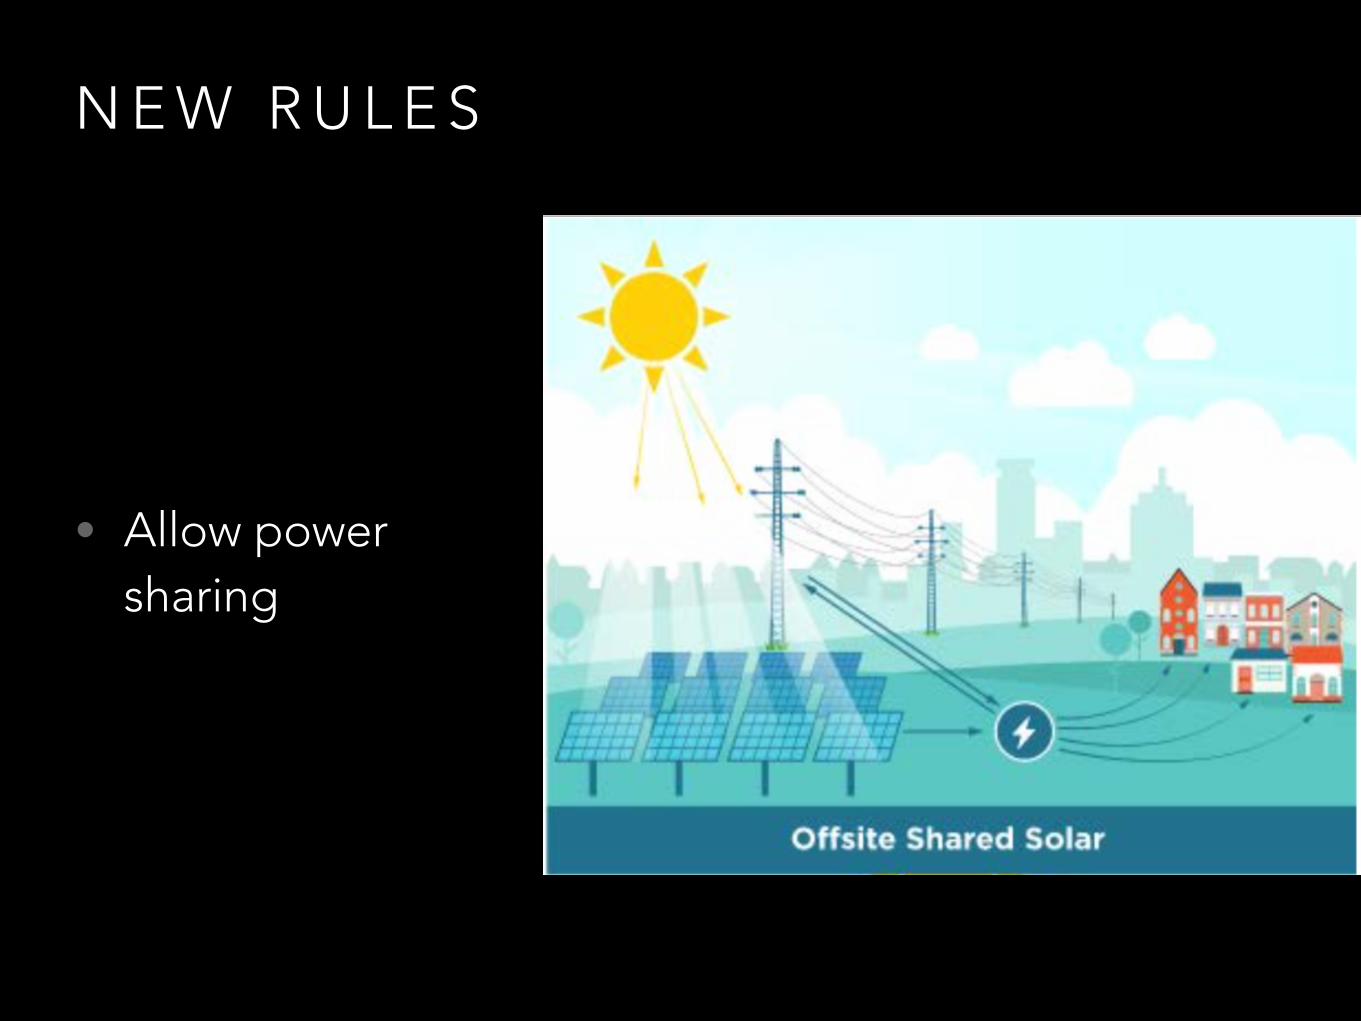
N E W R U L E S
• Allow power sharing
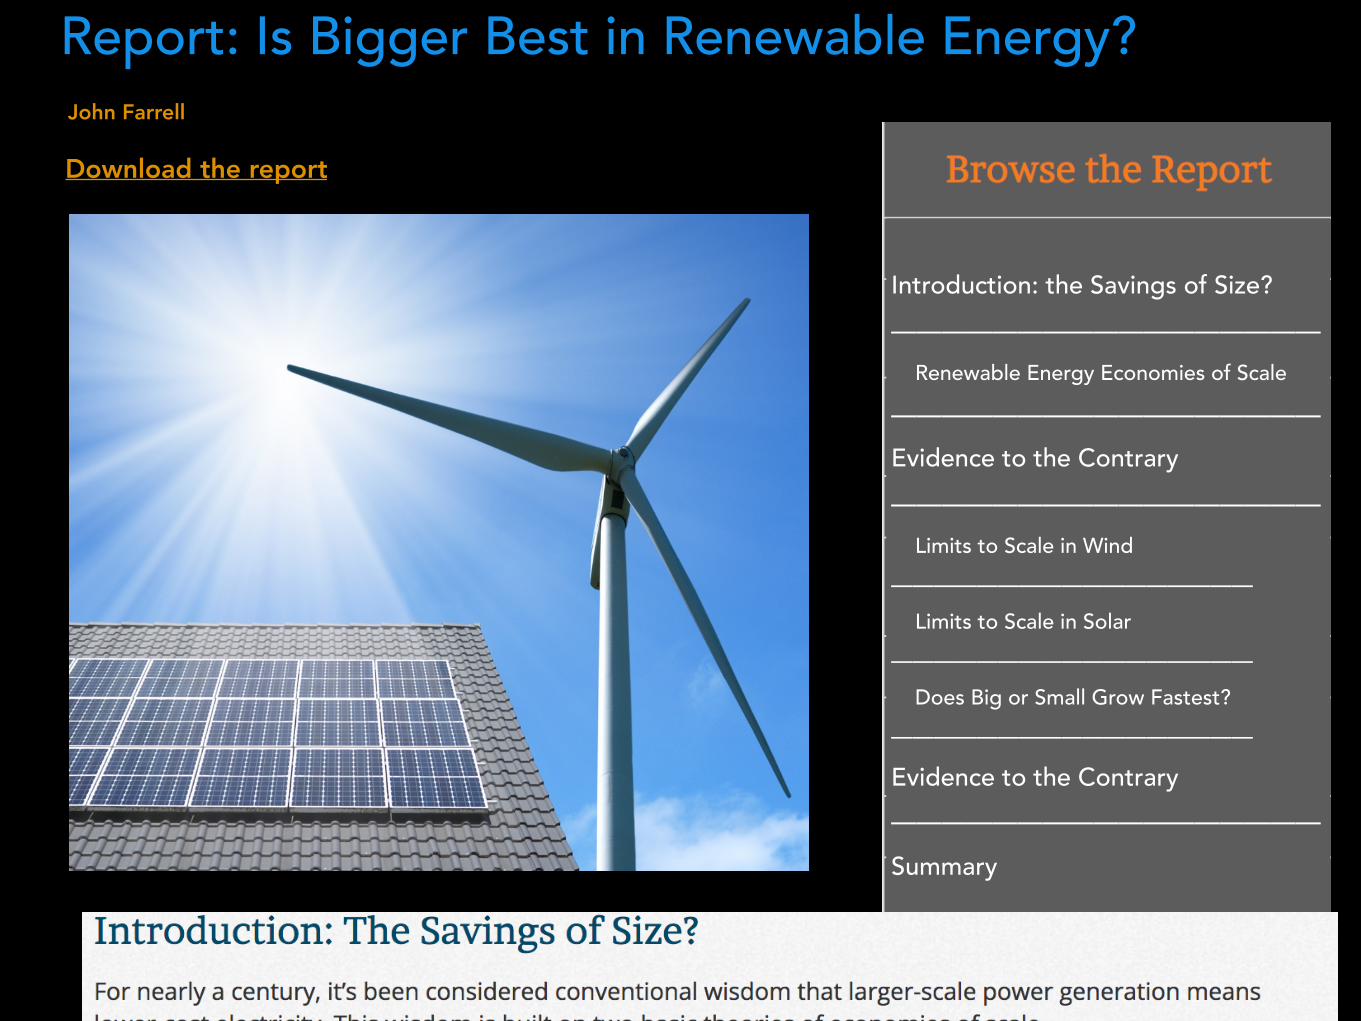
Report: Is Bigger Best in Renewable Energy?
Download the report
Introduction: the Savings of Size? —————————————————
Renewable Energy Economies of Scale ————————————————— Evidence to the Contrary —————————————————
Limits to Scale in Wind —————————————————
Limits to Scale in Solar —————————————————
Does Big or Small Grow Fastest? ————————————————— Evidence to the Contrary————————————————— Summary
John Farrell
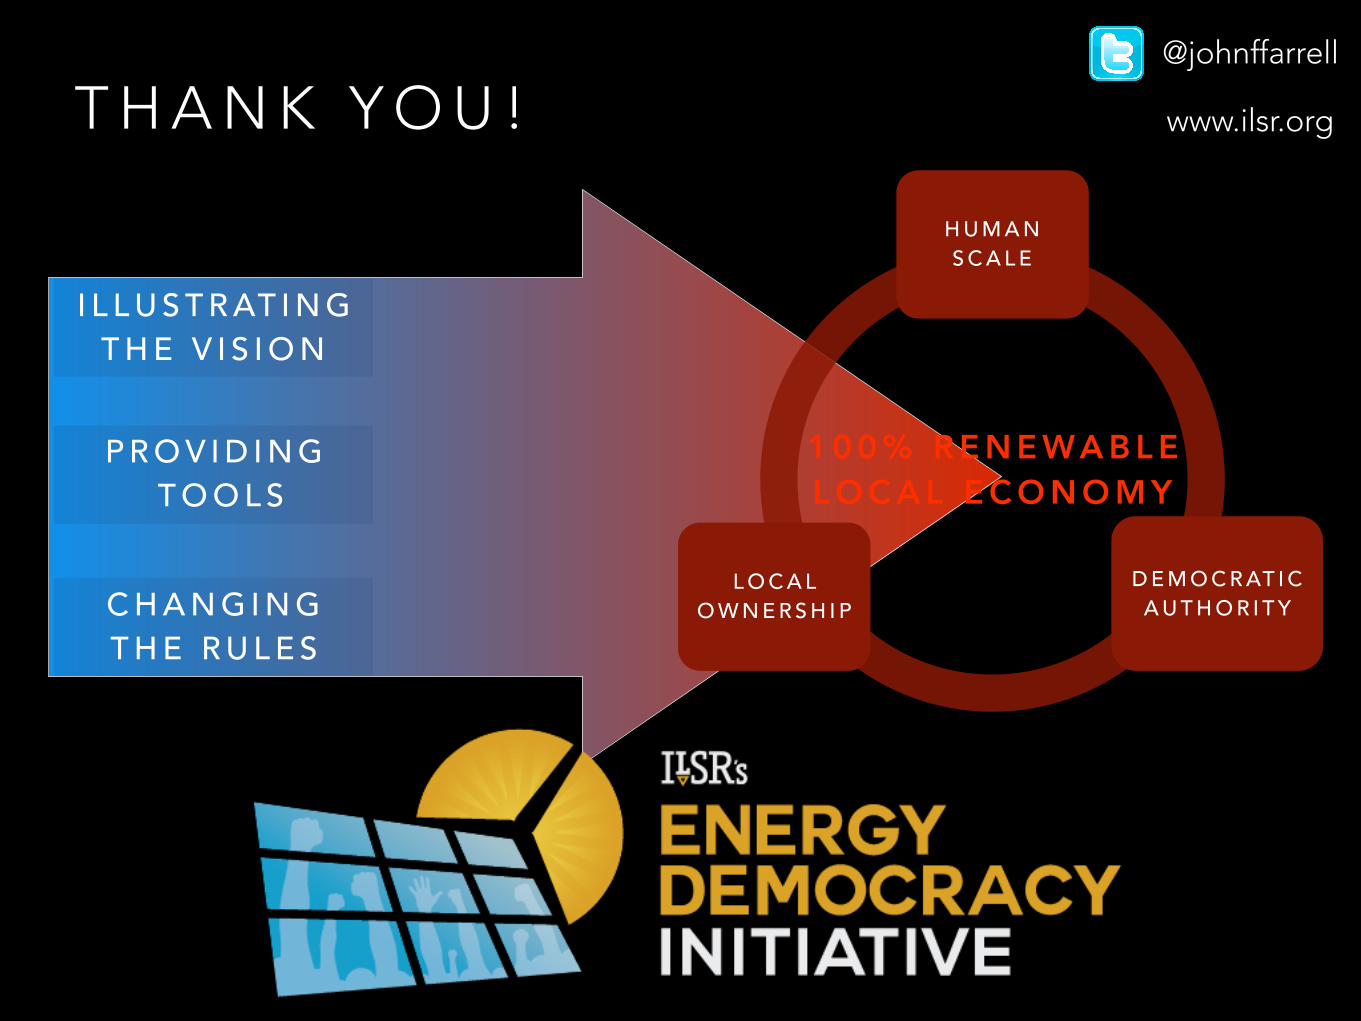
T H A N K Y O U !@johnffarrell
www.ilsr.org
C H A N G I N G T H E R U L E S
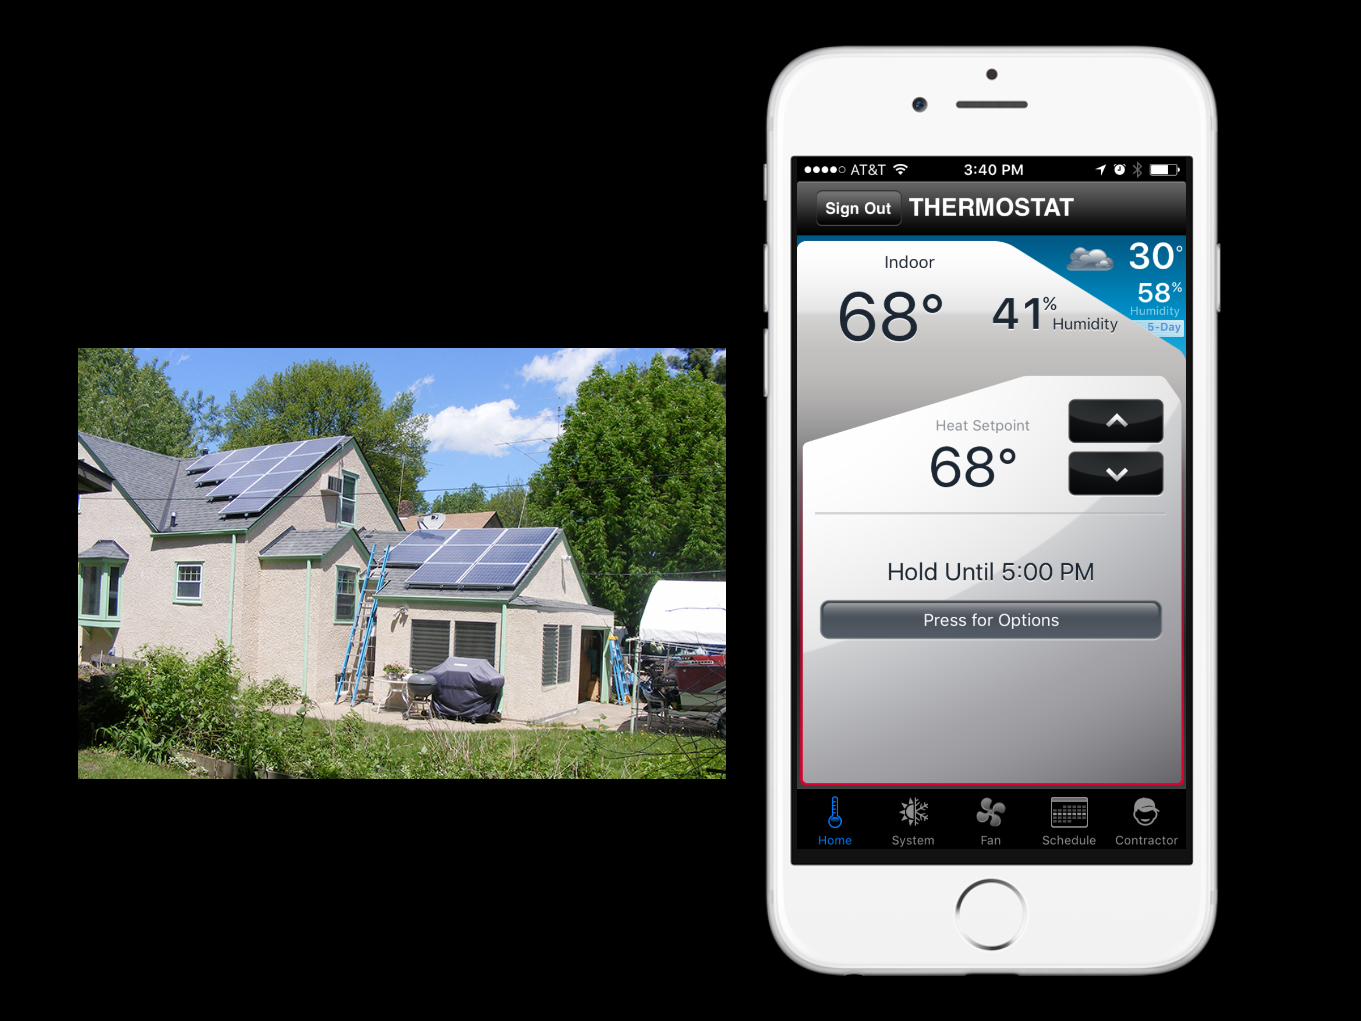
P R O V I D I N G T O O L S
1 0 0 % R E N E WA B L E L O C A L E C O N O M Y
H U M A N S C A L E
L O C A L O W N E R S H I P
D E M O C R AT I C A U T H O R I T Y
I L L U S T R AT I N G T H E V I S I O N