Embed Size (px)
Citation preview
12 September 2013
HIGHLIGHTS Oil futures escalated in August on rising geopolitical tensions over
Syria’s suspected use of chemical weapons and the near total shut‐in of Libyan production. Prices turned lower in early‐September as a Russian proposal for Syria to surrender its chemical weapons gained traction. Brent was last trading at $111.60/bbl, WTI at $107.50/bbl.
The forecast of global demand growth remains flat at 895 kb/d for 2013, as stronger–than‐expected deliveries in July offset concerns about the demand impact of currency fluctuations in emerging market economies. Demand growth is forecast to rise to 1.1 mb/d in 2014, as the underlying macroeconomic backdrop solidifies.
Global supply is estimated to have fallen by 770 kb/d in August to 91.59 mb/d, with both non‐OPEC and OPEC registering monthly declines. In 3Q13 non‐OPEC production is expected to rise by 520 kb/d q‐o‐q as a seasonal decline in the North Sea is more than made up for by North American growth and steady production elsewhere.
OPEC crude supplies fell by 260 kb/d to 30.51 mb/d in August as near‐record Saudi output only partly offset a collapse in Libyan production. The ‘call on OPEC crude and stock change’ was raised by 200 kb/d on higher demand for 3Q13 but lowered by 100 kb/d for 4Q13, to 30.3 mb/d and 29.6 mb/d, respectively.
OECD commercial total oil stocks built by a weak 8.0 mb to 2 659 mb in July, bringing their deficit to the five‐year average to 65 mb, its widest in two years. Refined products covered 30.7 days of forward demand, a rise of 0.6 day on end‐June. Preliminary data indicate OECD inventories drew counter‐seasonally by 14.2 mb in August.
Global refinery crude runs reached a seasonal peak in July, at an estimated 78.2 mb/d, up 1 mb/d from June and 1.8 mb/d above a year earlier. Throughputs are set to fall steeply from August on weaker margins and heavy maintenance. Global runs average 77.2 mb/d in 3Q13, up 1.1 mb/d y‐o‐y, and 76.8 mb/d in 4Q13.

TABLE OF CONTENTS
HIGHLIGHTS ....................................................................................................................................................................................... 1
HEATING UP AND COOLING DOWN ..................................................................................................................................... 3
DEMAND ............................................................................................................................................................................................. 4 Summary ........................................................................................................................................................................................... 4 Global Overview ............................................................................................................................................................................ 4
Emerging Market Currency Depreciation Set to Impact Demand .......................................................................................... 5 Top 10 Consumers ........................................................................................................................................................................ 6 OECD ............................................................................................................................................................................................. 12
Americas ................................................................................................................................................................................... 12 Europe ....................................................................................................................................................................................... 13 Asia Oceania ............................................................................................................................................................................. 14
Non-OECD ................................................................................................................................................................................... 14
SUPPLY ................................................................................................................................................................................................ 16 Summary ......................................................................................................................................................................................... 16 OPEC Crude Oil Supply ............................................................................................................................................................. 17
Libyan Oil Supplies Cascade Lower .......................................................................................................................................... 20 Non-OPEC Overview ................................................................................................................................................................. 22 OECD ............................................................................................................................................................................................. 23
North America ........................................................................................................................................................................ 23 Mexico’s Proposed Energy Sector Reforms – A Watershed for the Energy Industry? ......................................................... 24 North Sea .................................................................................................................................................................................. 27
Non-OECD ................................................................................................................................................................................... 27 Latin America ........................................................................................................................................................................... 27 Asia ............................................................................................................................................................................................. 28 Africa .......................................................................................................................................................................................... 28 Former Soviet Union .............................................................................................................................................................. 29
OECD STOCKS ................................................................................................................................................................................ 31 Summary ......................................................................................................................................................................................... 31 OECD Inventory Position at End-July and Revisions to Preliminary Data ....................................................................... 31 Analysis of Recent OECD Industry Stock Changes .............................................................................................................. 32
OECD Americas ...................................................................................................................................................................... 32 European Industry Stock Draws in Perspective ....................................................................................................................... 33 OECD Europe .......................................................................................................................................................................... 34 OECD Asia Oceania ............................................................................................................................................................... 35
Recent Developments in Singapore and China Stocks ......................................................................................................... 36
PRICES ................................................................................................................................................................................................. 38 Summary ......................................................................................................................................................................................... 38 Market Overview ......................................................................................................................................................................... 38 Futures Markets ............................................................................................................................................................................ 40
Financial Regulation ................................................................................................................................................................. 42 Spot Crude Oil Prices ................................................................................................................................................................. 42 Spot Product Prices ..................................................................................................................................................................... 44 Freight ............................................................................................................................................................................................. 46
REFINING ........................................................................................................................................................................................... 48 Summary ......................................................................................................................................................................................... 48 Global Refinery Overview .......................................................................................................................................................... 48
Refining Margins ....................................................................................................................................................................... 49 OECD Refinery Throughput ...................................................................................................................................................... 51 Non-OECD Refinery Throughput ............................................................................................................................................ 54
TABLES ................................................................................................................................................................................................ 57

INTERNATIONAL ENERGY AGENCY ‐ OIL MARKET REPORT MARKET OVERVIEW
12 SEPTEMBER 2013 3
HEATING UP AND COOLING DOWN After rallying to six‐month highs amid expectations of western military strikes in Syria, benchmark Brent oil prices ratcheted down again as support seemed to build for an alternative plan to withhold strikes and neutralise Syrian chemical weapon stocks instead. Whether a crisis has been permanently averted or merely postponed remains unclear, however. Oil markets may be taking a breather, but prices remain elevated. The Syrian conflict continues to rage. Across the Mediterranean, a collapse in Libyan exports, which played a large supporting role in the recent run‐up in prices, shows no sign of abating. While there are still plenty of causes for concern, there is some good news, too. Despite continued tensions, the recent tightening of oil market fundamentals – the broad bullish backdrop that has arguably heightened the oil market’s sensitivity to the Syrian threat – looks set to give way to somewhat easier conditions in the fourth quarter. After hitting an all‐time high in July, refinery demand for crude is receding. Nowhere is this truer than in Russia, where a refining boom slashed crude exports in summer, but where heavy seasonal plant maintenance now looks set to reopen the export floodgates. In Europe and Asia, some refiners may decide to extend maintenance shutdowns due to poor margins. Global crude supply – notwithstanding the Libyan problems – looks set for an upward jump in 4Q13, thanks to a heady mix of seasonal, cyclical, political and structural factors. The winding down of seasonal field maintenance in the North Sea and the US Gulf of Mexico will bolster 4Q13 supply – even as a political accord between Sudan and South Sudan sets the stage for a ramp‐up in Sudanese crude exports. New North American production – including US light tight oil and Canadian synthetic crude – continues to surge. Saudi production is hovering near record highs, even as a seasonal dip in domestic air‐conditioning demand looks set to free up more barrels for export. OECD oil inventories have tightened in recent months but may be on the verge of a rebound. The latest data suggest that total industry oil stocks built by just a fraction of the five‐year average in July, bringing the OECD oil stock deficit to the five‐year average to 65 mb, its widest in two years. Our supply/demand forecast suggests however that, even in the absence of an increase in OPEC production (i.e., holding OPEC crude output flat at August levels), rebounding OECD stocks could match or even exceed their five‐year average by December. Assuming zero Libyan production from September through December, stocks could still top their five‐year average by end‐year. Measured in days of forward demand, OECD product stocks under both scenarios would exceed their five‐year range by the end of this month. These projections must be taken with a grain of salt, as reality rarely unfolds according to plan. Our balances also predicted seasonal growth in OECD oil stocks for the last six months, whereas in fact stocks held about flat. That discrepancy shows up as a hefty “Miscellaneous to Balance” time item of 1 mb/d for 2Q13 – reflecting either non‐OECD stock builds, unreported OECD builds, overstated supply, understated demand, or any combination of the above. To correct for such a factor, we have tried carrying forward a large “Miscellaneous to Balance” line item in our 4Q13 balance scenarios. Even so, OECD demand cover is still likely to rise to the top of the range through the remainder of the year if OPEC output is held steady, or hover near average levels in a low OPEC supply scenario. Global balances are of course a rather coarse way of looking at the market, especially in the absence of good non‐OECD stock data. The big picture also masks regional imbalances that can be a challenge for market participants on the ground. Surging US LTO or Canadian synthetic production might be good news for US refiners but not as much of a help to Mediterranean refiners looking for a substitute for disrupted Libyan barrels. Any shift in market conditions will yield winners and losers, until the markets rebalance. But, while the geopolitical storms in the Middle East and North Africa have yet to pass, easing fundamentals look set to lessen the pressure somewhat on market participants – at least for the next few months.

DEMAND INTERNATIONAL ENERGY AGENCY ‐ OIL MARKET REPORT
4 12 SEPTEMBER 2013
DEMAND
Summary
Global oil demand growth is forecast to pick up to 1.1 mb/d in 2014 from 895 kb/d in 2013 as the underlying macroeconomic situation improves. Global oil demand is projected to average 90.9 mb/d in 2013 and 92.0 mb/d in 2014.
High cooling use in July and August raised the estimate of demand for 3Q13, compounding the impact of modest improvements in the economy. Roughly 260 kb/d has been added to the total 3Q13 global consumption estimate, to 91.5 mb/d, since last month’s Report. Upward adjustments to the July demand estimates for the US (+190 kb/d), China (+175 kb/d) and Russia (+90 kb/d) led the revision.
Global Oil Demand (2012-2014)
(million barrels per day)
1Q12 2Q12 3Q12 4Q12 2012 1Q13 2Q13 3Q13 4Q13 2013 1Q14 2Q14 3Q14 4Q14 2014Africa 3.6 3.6 3.6 3.7 3.7 3.8 3.8 3.8 3.9 3.8 3.9 4.0 4.0 4.1 4.0Americas 29.6 30.1 30.3 30.4 30.1 30.1 30.3 30.5 30.4 30.3 30.1 30.4 30.7 30.5 30.4Asia/Pacif ic 29.9 29.1 29.2 30.5 29.7 30.5 29.6 29.6 30.8 30.1 31.1 30.1 30.3 31.4 30.7Europe 14.3 14.5 14.5 14.3 14.4 13.8 14.5 14.4 14.1 14.2 13.8 14.0 14.4 14.2 14.1FSU 4.3 4.4 4.6 4.6 4.5 4.3 4.5 4.8 4.8 4.6 4.4 4.6 4.9 4.9 4.7Middle East 7.3 7.8 8.2 7.5 7.7 7.5 7.8 8.4 7.7 7.8 7.6 8.1 8.6 8.0 8.1World 89.0 89.5 90.5 91.1 90.0 89.9 90.5 91.5 91.7 90.9 91.0 91.3 92.7 93.0 92.0Annual Chg (%) 0.7 1.9 0.7 1.5 1.2 1.0 1.1 1.1 0.7 1.0 1.2 0.9 1.3 1.4 1.2Annual Chg (mb/d) 0.7 1.7 0.6 1.3 1.1 0.9 1.0 1.0 0.6 0.9 1.1 0.8 1.2 1.3 1.1Changes from last OMR (mb/d) 0.04 0.15 0.06 0.04 0.07 0.02 0.08 0.26 -0.08 0.07 0.03 0.13 0.07 0.06 0.07
Currency depreciation in a number of emerging markets, adding to the impact of already high oil prices, has raised the possibility of further associated price effects on demand. Several countries – including India, Indonesia, Malaysia, Peru, the Philippines and Thailand – have faced dramatic currency depreciation versus the US dollar in recent weeks. If sustained, this may ultimately curb their demand trend or, in countries where oil subsidies are in place, raise pressure on their governments to reduce those subsidy programmes.
The divergence in demand trends between emerging markets and developed economies has been easing somewhat lately. Data for 2Q13 show the OECD demand contraction slowing to 0.3% y‐o‐y and non‐OECD demand growth easing to 2.6%, a much narrower gap in the growth pattern than the average of the last five years.
Global Overview
The possibility of slowing oil demand in emerging markets has dominated the headlines recently, with reports of sharp currency depreciation in several non‐OECD countries compounding the effect of already high oil prices in US dollar terms. Higher prices, with all else being held equal, have a negative influence on demand, although in many countries subsidies can cushion their effect for some time. Countering such concerns are the latest demand numbers, which on balance came in stronger than expected for July. Overall, global oil demand is forecast to average roughly 90.9 mb/d in 2013, up by 895 kb/d (or 1.0%) y‐o‐y, essentially unchanged on last month’s growth estimate. Growth is expected to accelerate in 2014 to around 1.1 mb/d (or 1.2%), lifting demand to 92.0 mb/d, as the macroeconomic backdrop continues to improve. The International Monetary Fund’s July World Economic Outlook forecast a rise in global GDP growth to 3.8% in 2014, from 3.1% in 2013; predictions that underpin our oil forecasts. Heightened
INTERNATIONAL ENERGY AGENCY ‐ OIL MARKET REPORT DEMAND
12 SEPTEMBER 2013 5
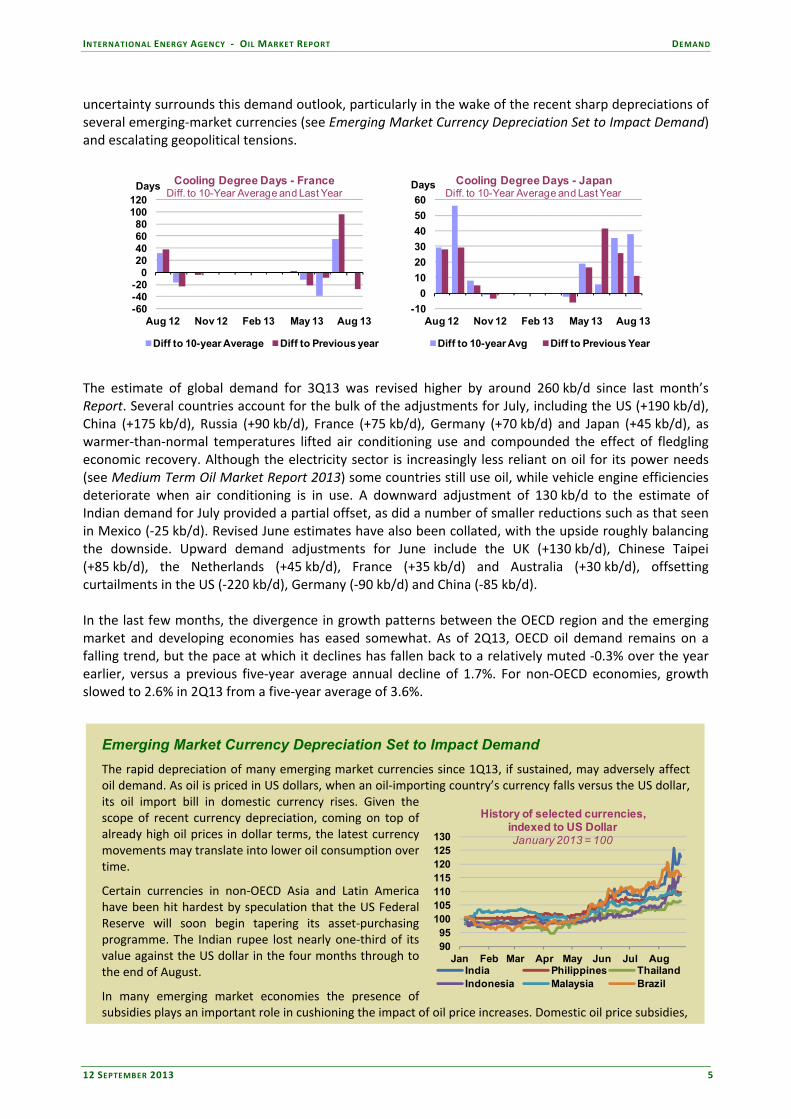
uncertainty surrounds this demand outlook, particularly in the wake of the recent sharp depreciations of several emerging‐market currencies (see Emerging Market Currency Depreciation Set to Impact Demand) and escalating geopolitical tensions.
-60-40-20
020406080
100120
Aug 12 Nov 12 Feb 13 May 13 Aug 13
Days Cooling Degree Days - FranceDiff. to 10-Year Average and Last Year
Diff to 10-year Average Diff to Previous year
-10
0
10
20
30
40
50
60
Aug 12 Nov 12 Feb 13 May 13 Aug 13
Days Cooling Degree Days - JapanDiff. to 10-Year Average and Last Year
Diff to 10-year Avg Diff to Previous Year
The estimate of global demand for 3Q13 was revised higher by around 260 kb/d since last month’s Report. Several countries account for the bulk of the adjustments for July, including the US (+190 kb/d), China (+175 kb/d), Russia (+90 kb/d), France (+75 kb/d), Germany (+70 kb/d) and Japan (+45 kb/d), as warmer‐than‐normal temperatures lifted air conditioning use and compounded the effect of fledgling economic recovery. Although the electricity sector is increasingly less reliant on oil for its power needs (see Medium Term Oil Market Report 2013) some countries still use oil, while vehicle engine efficiencies deteriorate when air conditioning is in use. A downward adjustment of 130 kb/d to the estimate of Indian demand for July provided a partial offset, as did a number of smaller reductions such as that seen in Mexico (‐25 kb/d). Revised June estimates have also been collated, with the upside roughly balancing the downside. Upward demand adjustments for June include the UK (+130 kb/d), Chinese Taipei (+85 kb/d), the Netherlands (+45 kb/d), France (+35 kb/d) and Australia (+30 kb/d), offsetting curtailments in the US (‐220 kb/d), Germany (‐90 kb/d) and China (‐85 kb/d). In the last few months, the divergence in growth patterns between the OECD region and the emerging market and developing economies has eased somewhat. As of 2Q13, OECD oil demand remains on a falling trend, but the pace at which it declines has fallen back to a relatively muted ‐0.3% over the year earlier, versus a previous five‐year average annual decline of 1.7%. For non‐OECD economies, growth slowed to 2.6% in 2Q13 from a five‐year average of 3.6%.
Emerging Market Currency Depreciation Set to Impact Demand
The rapid depreciation of many emerging market currencies since 1Q13, if sustained, may adversely affect oil demand. As oil is priced in US dollars, when an oil‐importing country’s currency falls versus the US dollar, its oil import bill in domestic currency rises. Given the scope of recent currency depreciation, coming on top of already high oil prices in dollar terms, the latest currency movements may translate into lower oil consumption over time.
Certain currencies in non‐OECD Asia and Latin America have been hit hardest by speculation that the US Federal Reserve will soon begin tapering its asset‐purchasing programme. The Indian rupee lost nearly one‐third of its value against the US dollar in the four months through to the end of August.
In many emerging market economies the presence of subsidies plays an important role in cushioning the impact of oil price increases. Domestic oil price subsidies,
9095
100105110115120125130
Jan Feb Mar Apr May Jun Jul Aug
History of selected currencies, indexed to US DollarJanuary 2013 = 100
India Philippines ThailandIndonesia Malaysia Brazil
DEMAND INTERNATIONAL ENERGY AGENCY ‐ OIL MARKET REPORT
6 12 SEPTEMBER 2013
Emerging Market Currency Depreciation Set to Impact Demand (continued)
such as those that effectively exist for Indian diesel, shield the consumer from the direct impact of price pressures. The price increases do not simply vanish, however, as they instead filter through indirectly to the economy as the government takes the hit in terms of sharply higher import bills.
Over the longer term, governments will likely become less capable of protecting oil consumers from price effects, as currency depreciation makes subsidies increasingly burdensome and ultimately unaffordable. Oil subsidies can themselves feed into currency depreciation. Many of the countries that have recently faced steep contractions in the value of their domestic currency experienced it due to their unsustainable current account balances.
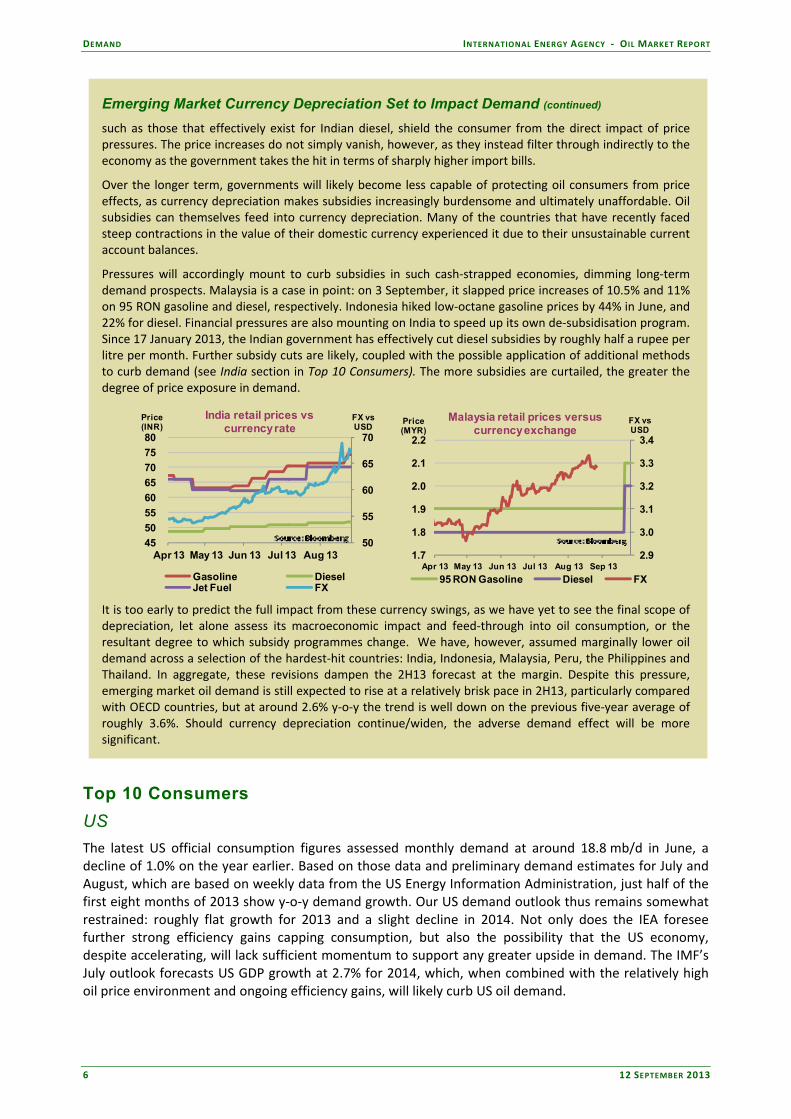
Pressures will accordingly mount to curb subsidies in such cash‐strapped economies, dimming long‐term demand prospects. Malaysia is a case in point: on 3 September, it slapped price increases of 10.5% and 11% on 95 RON gasoline and diesel, respectively. Indonesia hiked low‐octane gasoline prices by 44% in June, and 22% for diesel. Financial pressures are also mounting on India to speed up its own de‐subsidisation program. Since 17 January 2013, the Indian government has effectively cut diesel subsidies by roughly half a rupee per litre per month. Further subsidy cuts are likely, coupled with the possible application of additional methods to curb demand (see India section in Top 10 Consumers). The more subsidies are curtailed, the greater the degree of price exposure in demand.
50
55
60
65
70
45
50
55
60
65
70
75
80
Apr 13 May 13 Jun 13 Jul 13 Aug 13
FX vs USD
Price (INR)
India retail prices vscurrency rate
Gasoline DieselJet Fuel FX
2.9
3.0
3.1
3.2
3.3
3.4
1.7
1.8
1.9
2.0
2.1
2.2
Apr 13 May 13 Jun 13 Jul 13 Aug 13 Sep 13
FX vs USD
Price (MYR)
Malaysia retail prices versus currency exchange
95 RON Gasoline Diesel FX
It is too early to predict the full impact from these currency swings, as we have yet to see the final scope of depreciation, let alone assess its macroeconomic impact and feed‐through into oil consumption, or the resultant degree to which subsidy programmes change. We have, however, assumed marginally lower oil demand across a selection of the hardest‐hit countries: India, Indonesia, Malaysia, Peru, the Philippines and Thailand. In aggregate, these revisions dampen the 2H13 forecast at the margin. Despite this pressure, emerging market oil demand is still expected to rise at a relatively brisk pace in 2H13, particularly compared with OECD countries, but at around 2.6% y‐o‐y the trend is well down on the previous five‐year average of roughly 3.6%. Should currency depreciation continue/widen, the adverse demand effect will be more significant.
Top 10 Consumers
US
The latest US official consumption figures assessed monthly demand at around 18.8 mb/d in June, a decline of 1.0% on the year earlier. Based on those data and preliminary demand estimates for July and August, which are based on weekly data from the US Energy Information Administration, just half of the first eight months of 2013 show y‐o‐y demand growth. Our US demand outlook thus remains somewhat restrained: roughly flat growth for 2013 and a slight decline in 2014. Not only does the IEA foresee further strong efficiency gains capping consumption, but also the possibility that the US economy, despite accelerating, will lack sufficient momentum to support any greater upside in demand. The IMF’s July outlook forecasts US GDP growth at 2.7% for 2014, which, when combined with the relatively high oil price environment and ongoing efficiency gains, will likely curb US oil demand.

INTERNATIONAL ENERGY AGENCY ‐ OIL MARKET REPORT DEMAND
12 SEPTEMBER 2013 7
US50: Total Oil Product Demand
17,500
18,500
19,500
20,500
Jan Apr Jul Oct Jan
kb/d
Range 08-12 5-year avg2012 2013
US50: Motor Gasoline Demand
8,200
8,600
9,000
9,400
Jan Apr Jul Oct Jan
kb/d
Range 08-12 5-year avg2012 2013
Despite reports of recent strength in the US demand, the underlying macroeconomics remain somewhat subdued. Economic growth in 2Q13 amounted to just 0.4% over 1Q13 (but 1.7% when annualised). In essence, the 2Q13 US GDP growth trend was actually below that experienced by the UK, Korea, Germany, France and Japan, and slower than the US pace of growth as recently as 3Q12.
Top-10 Oil Consumers(thousand barrels per day)
Jun-13 2013 2014 Jun-13 2013 2014 Jun-13 2013 2014
US50 18,786 18,661 18,618 -193 55 -43 -1.0 0.3 -0.2
China 10,221 10,140 10,520 526 373 380 5.4 3.8 3.7
Japan 3,877 4,542 4,422 -237 -172 -120 -5.8 -3.7 -2.6
Russia 3,575 3,404 3,512 146 104 108 4.2 3.2 3.2
India 3,415 3,427 3,543 -67 85 116 -1.9 2.6 3.4
Saudi Arabia 3,281 3,026 3,138 53 104 111 1.6 3.6 3.7
Brazil 3,043 3,088 3,185 83 102 97 2.8 3.4 3.1
Germany 2,492 2,382 2,372 -28 -6 -10 -1.1 -0.3 -0.4
Korea 2,301 2,311 2,315 -36 10 4 -1.5 0.4 0.2
Canada 2,233 2,295 2,297 30 8 2 1.3 0.4 0.1
% global demand 59% 59% 59%
Demand Annual Chg (kb/d) Annual Chg (%)
Looming US ‘sequester’ cuts and arguments about the debt ceiling are likely to dampen consumer sentiment in 2H13, with a particular strong impact on gasoline demand as high retail gasoline prices and declining consumer confidence compound the impact of vehicle efficiency gains. The US Energy Information Administration estimates that the efficiency of the US light‐vehicle pool improved by around 1.9% y‐o‐y in 1H13.
China
This has been a mixed month for Chinese demand data, with offsetting adjustments to the June (‐85 kb/d) and July (+175 kb/d) series. This net addition meant that despite the maintenance of our forecast for significantly slower growth in 2H13, the forecast for the year as a whole has been raised modestly, to 3.8% versus last month’s 3.7% projection. Revised estimates of Chinese apparent demand (defined as the sum of refinery output and net product imports, minus product inventory builds) depict roughly 10.2 mb/d of oil products being consumed in June, a gain of 5.4% on the year earlier, supported by particularly sharp gains in transport fuels and naphtha. Preliminary July estimates imply a similar rate of growth, to 10.3 mb/d, despite reports of product destocking which have the effect of inflating apparent demand estimates (see ‘Chinese Demand Forecast Upgraded‘, OMR January 2013). Early indications point towards a significant deceleration in August, in line with the forecast carried in last month’s Report, as refiners reduced runs by 155 kb/d over July.

DEMAND INTERNATIONAL ENERGY AGENCY ‐ OIL MARKET REPORT
8 12 SEPTEMBER 2013
China: Total Oil Product Demand
8,500
9,500
10,500
Jan Apr Jul Oct Jan
kb/d
2011 2012 2013 2014
China: Naphtha Demand
600
800
1,000
1,200
Jan Apr Jul Oct Jan
kb/d
Range 2008-2012 5-year avg2012 2013
Supporting the Chinese growth forecast of nearly 4%, in a year of exceptionally choppy demand, is the IMF assumption of 7.8% rise in GDP in 2013 (decelerating to 7.7% in 2014). The latest economic indicators – such as industrial output rising 9.7% y‐o‐y in July and 10.4% in August – add credibility to these forecasts.
China: Demand by Product(thousand barrels per day)
Annual Chg (kb/d) Annual Chg (%)
2012 2013 2014 2013 2014 2013 2014
LPG & Ethane 753 766 788 13 21 1.7 2.8
Naphtha 985 1,079 1,150 94 72 9.5 6.6
Motor Gasoline 1,953 2,100 2,209 147 109 7.6 5.2
Jet Fuel & Kerosene 438 481 510 43 28 9.9 5.9
Gas/Diesel Oil 3,406 3,427 3,525 21 97 0.6 2.8
Residual Fuel Oil 496 519 529 23 10 4.6 1.9
Other Products 1,736 1,768 1,810 31 42 1.8 2.4
Total Products 9,768 10,140 10,520 373 380 3.8 3.7
Demand
Japan
The unusually warm early summer temperatures have raised the estimate of 2013 Japanese oil consumption as power sector needs (driven by air conditioning demand) are likely to exceed earlier expectations. Fuel oil and ‘other product’ demand (which includes crude oil for direct burn) notably support power sector needs. For the year as a whole, an overall decline rate of 3.7% is now assumed (previously the forecast decline rate was 3.8%), taking total Japanese demand to an average of around 4.5 mb/d. Consumption contracted by a steep 4.3% y‐o‐y in 2Q13 but is expected to show slower declines from then on. Having fallen sharply in 1Q13, gasoline demand will lead the reversal in fortunes in 2H13, supported by likely gains in consumer confidence.
Japan: Total Oil Product Demand
3,500
4,000
4,500
5,000
5,500
6,000
Jan Apr Jul Oct Jan
kb/d
Range 08-12 5-year avg2012 2013
Japan: Motor Gasoline Demand
850
900
950
1,000
1,050
1,100
1,150
1,200
Jan Apr Jul Oct Jan
kb/d
Range 08-12 5-year avg2012 2013

INTERNATIONAL ENERGY AGENCY ‐ OIL MARKET REPORT DEMAND
12 SEPTEMBER 2013 9
India
In July, for the second consecutive month, Indian demand contracted y‐o‐y as the country’s effective de‐subsidisation programme continues to cut into diesel consumption. Since January, the government has been undergoing a programme of cutting the effective diesel price subsidy by roughly half a rupee per litre per month, whereby half a rupee is equal to roughly one US cent as of 11 September. Reduced agricultural demand and signs of slowing economic growth also contributed. Agricultural consumption has been particularly curbed as of late, with relatively plentiful rains reducing irrigation needs (a big gasoil/diesel user), while the recent economic slowdown has dampened consumption, a pressure compounded as prices have risen. Although consumer purchasing decisions have, to date, largely avoided the most dire consequences from the rupee’s depreciation, with effective subsidies continuing to protect domestic diesel demand, the already cash‐strapped government is under pressure to reduce these subsidies still further, or find alternative methods to curb use. The oil ministry, in an open letter to the Prime Minister, has outlined some potential measures, such as requesting that refiners reduce imports, encouraging people to consume less, or restricting retailers’ opening hours (an option since discarded).
India: Total Oil Product Demand
2,600
3,100
3,600
Jan Apr Jul Oct Jan
kb/d
Range 2008-2012 5-year avg2012 2013
India: Gasoil Demand
800
1,200
1,600
Jan Apr Jul Oct Jan
kb/d
Range 2008-2012 5-year avg2012 2013
Even if governments have many ways to discourage consumption, economists widely believe that the pricing mechanism is the most efficient method of distributing limited supplies. Indeed, the smaller gasoline sector – which accounted for just 11.1% of Indian demand in 2012, versus 41.1% for gasoil – has already experienced some sharp price gains, with six hikes seen since May (gasoline prices having risen by 17.5% between the end of May of the beginning of September, whereas diesel prices have inched up a mere 3.4%). The price effect is far from perfect, however, as demonstrated by the continued strong gains seen in gasoline demand. Also the current programme of curbing the effective diesel subsidy is not simply a commitment to raise the price by the stated amount each month, but instead a pledge to do so until the so‐called under‐recoveries have disappeared. The term under‐recoveries refers to the situation where the actual selling price is lower than the price retailers/distributors pay to refiners. This policy of small but steady steps showed significant progress with the under‐recoveries going down, from about 9 rupees per litre in January to 3.73 rupees per litre for the fortnight of 16 May. Due to a combination of a declining rupee and increases in the Indian crude oil price basket, the under‐recoveries shot up to 12.12 rupees per litre for the fortnight of 1 September. Since January, diesel prices have been raised seven times, for a total of 4.25 rupees per litre. Local media speculation is rife that a one‐off Rupee 5 per litre hike is in the offing. Although this could be a step in the right direction, such a move looks unlikely with elections less than a year away. Whatever method is adopted, we have trimmed our own demand forecast, to 2.6% in 2013, from 2.8% before.

DEMAND INTERNATIONAL ENERGY AGENCY ‐ OIL MARKET REPORT
10 12 SEPTEMBER 2013
Russia
The strong recent Russian demand trend continues, with roughly 3.6 mb/d consumed in July, a gain of 5.5% on the year earlier and marking the fifth month in a row that growth has exceeded the previous six‐month average. Once again, manufacturing continues to provide the majority of the demand support, with particularly sharp gains seen in gasoil, fuel oil and ‘other products’. Consumption of jet/kerosene and LPG has lagged as concerns regarding the pace of GDP growth have spread following the somewhat subdued 2Q13 number (+1.2% y‐o‐y).
Russia: Total Oil Product Demand
2,600
2,800
3,000
3,200
3,400
3,600
Jan Apr Jul Oct Jan
kb/d
Range 2008-2012 5-year avg2012 2013
So urce: P etro market R G, IEA
Russia: Residual Fuel Oil Demand
100
200
300
400
Jan Apr Jul Oct Jan
kb/d
Range 2008-2012 5-year avg2012 2013
Source: Petromarket RG, IEA
Regardless of the relatively strong 2Q13 demand showing – with a near 3% gain in Russian oil use seen over the corresponding period for 2012 – the forecast for the year as a whole remains largely unchanged, reflecting nagging concerns about the pace of macroeconomic momentum in the second half of the year. Although the majority of 2013, thus far, saw ‘expansionary’ manufacturing sentiment depicted in its confidence statistics, the perspective clearly darkened in July/August. Filtering from these forces, overall oil consumption growth is forecast to average out at 3.2% in both 2013 and 2014.
Russian Manufacturing PMI
49
50
51
52
53
Aug12 Nov12 Feb13 May13 Aug13
Not e: 50=cont ract ion/ expansion t hreshold. Sources: HSBC, Markit
Brazilian Manufacturing PMI
48
49
50
51
52
53
Aug12 Nov12 Feb13 May13
Not e: 50=cont ract ion/ expansion t hreshold. Sources: HSBC, Markit
Brazil
Brazilian consumption in June averaged 3.0 mb/d, 45 kb/d less than our month earlier prediction. Slowing gasoil demand growth, itself a consequence of the Latin American nation’s recent industrial woes, underpinned the lower number. Industrial sentiment has been on a declining trend since the beginning of the year, although HSBC’s Manufacturing Purchasing Managers’ Index (PMI) remained within ‘expansionary’ territory until July, requiring a less rampant growth in gasoil use, up 2.8% y‐o‐y in June versus previous a 12‐month average gain of 6.5%. This mid‐year weakness, which is likely to continue through 3Q13 if the PMI is any guide, resulted in a modest curtailment in our 2013 growth forecast, to 3.4% – down by two‐tenths of a percentage point on that carried in last month’s Report.

INTERNATIONAL ENERGY AGENCY ‐ OIL MARKET REPORT DEMAND
12 SEPTEMBER 2013 11
Saudi Arabia
The consumption data for June came out roughly in‐line with last month’s forecast, up 1.6% on the year earlier to 3.3 mb/d. By far the greatest upside was seen in fuel oil, as demand surged to a near‐five‐year high supported by additional power sector usage. Absolute declines in ‘other products’ and gasoil provided a partial offset, suggesting some switching of direct crude burn and gasoil to fuel oil in power generation. With the underlying macroeconomic environment likely to deteriorate in 2013 – the International Monetary Fund (IMF) forecasting GDP growth of 4.0% in 2013 after a gain of 5.1% in 2012 – then so, too, will oil demand growth, to 3.6% in 2013 from 4.7% in 2012. Similar growth (+3.7%) is foreseen in 2014 as this rough trend continues.
Saudi Arabia: Total Oil Product Demand
1,900
2,300
2,700
3,100
3,500
Jan Apr Jul Oct Jan
kb/d
Range 2008-2012 5-year avg2012 2013
Saudi Arabia: Residual Fuel Oil Demand
200
300
400
500
Jan Apr Jul Oct Jan
kb/d
Range 2008-2012 5-year avg2012 2013
Germany
Despite reports of an uptick in recent German economic activity, the demand forecast for the year as a whole remains essentially flat, as the underlying macroeconomic growth trend remains subdued. The greatest upside, in the forecast, is provided by industrially important gasoil and LPG, while downside momentum is provided by heavier fuel oil and the transportation markets of gasoline and jet/kerosene. Predictions of continued efficiency gains will likely keep the demand forecast restrained in 2014.
Germany: Total Oil Product Demand
2,100
2,300
2,500
2,700
2,900
Jan Apr Jul Oct Jan
kb/d
Range 08-12 5-year avg2012 2013
German: Gasoil Demand
800
1,000
1,200
1,400
Jan Apr Jul Oct Jan
kb/d
Range 08-12 5-year avg2012 2013
Korea
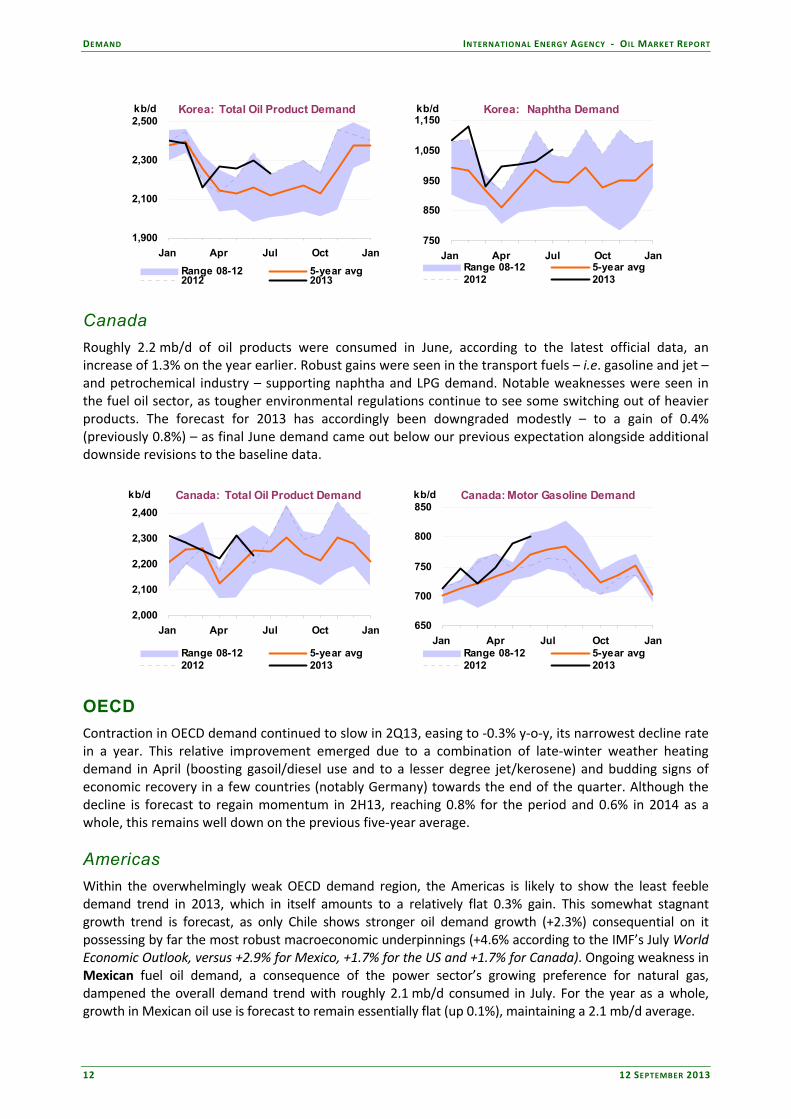
At an average of 2.2 mb/d in July, South Korean demand was in line with the forecast carried in last month’s Report. There has, however been something of a redistribution of product across the barrel, as the previously overestimated ‘other product’ category was seemingly ‘too high’ at the expense of a combination of ‘too little’ fuel oil, LPG, naphtha and gasoil. Particularly strong naphtha demand likely re‐emerged as the earlier spate of heavy cracker maintenance drew to a close. The overall consumption trend, for the year as a whole, is forecast to remain relatively flat, in line with government policy, little changed from last month’s Report.
DEMAND INTERNATIONAL ENERGY AGENCY ‐ OIL MARKET REPORT
12 12 SEPTEMBER 2013
Korea: Total Oil Product Demand
1,900
2,100
2,300
2,500
Jan Apr Jul Oct Jan
kb/d
Range 08-12 5-year avg2012 2013
Korea: Naphtha Demand
750
850
950
1,050
1,150
Jan Apr Jul Oct Jan
kb/d
Range 08-12 5-year avg2012 2013
Canada
Roughly 2.2 mb/d of oil products were consumed in June, according to the latest official data, an increase of 1.3% on the year earlier. Robust gains were seen in the transport fuels – i.e. gasoline and jet – and petrochemical industry – supporting naphtha and LPG demand. Notable weaknesses were seen in the fuel oil sector, as tougher environmental regulations continue to see some switching out of heavier products. The forecast for 2013 has accordingly been downgraded modestly – to a gain of 0.4% (previously 0.8%) – as final June demand came out below our previous expectation alongside additional downside revisions to the baseline data.
Canada: Total Oil Product Demand
2,000
2,100
2,200
2,300
2,400
Jan Apr Jul Oct Jan
kb/d
Range 08-12 5-year avg2012 2013
Canada: Motor Gasoline Demand
650
700
750
800
850
Jan Apr Jul Oct Jan
kb/d
Range 08-12 5-year avg2012 2013
OECD
Contraction in OECD demand continued to slow in 2Q13, easing to ‐0.3% y‐o‐y, its narrowest decline rate in a year. This relative improvement emerged due to a combination of late‐winter weather heating demand in April (boosting gasoil/diesel use and to a lesser degree jet/kerosene) and budding signs of economic recovery in a few countries (notably Germany) towards the end of the quarter. Although the decline is forecast to regain momentum in 2H13, reaching 0.8% for the period and 0.6% in 2014 as a whole, this remains well down on the previous five‐year average.
Americas
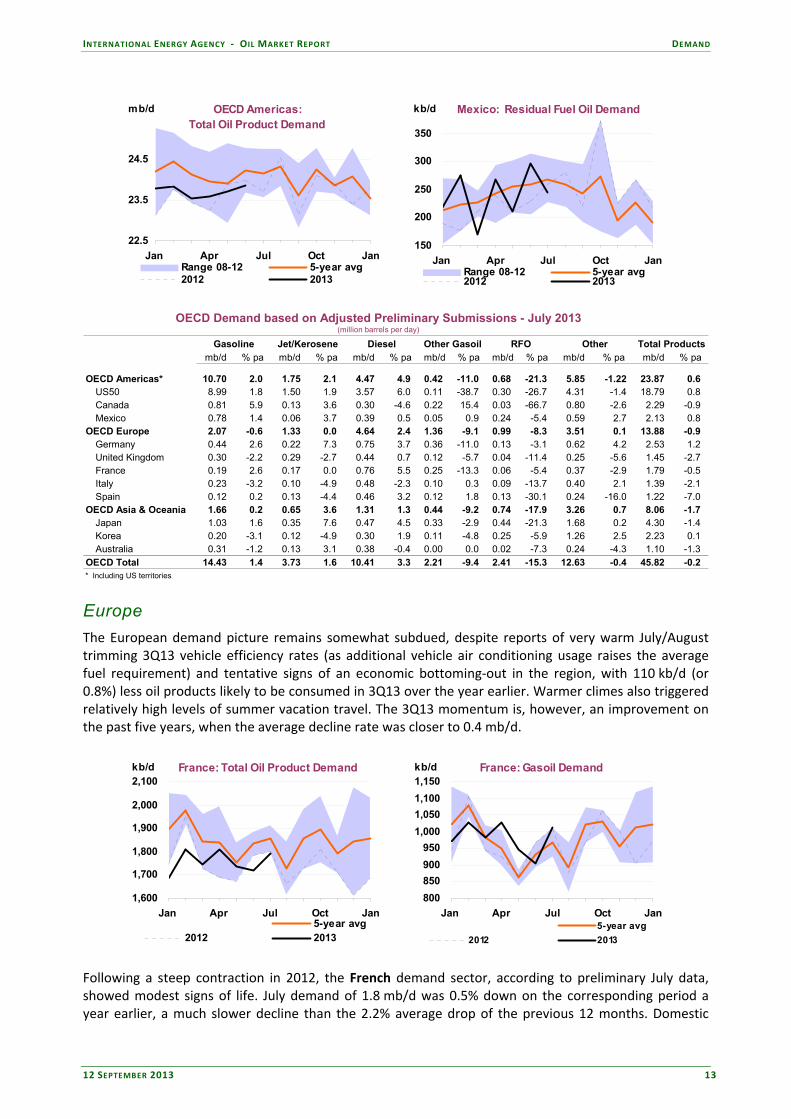
Within the overwhelmingly weak OECD demand region, the Americas is likely to show the least feeble demand trend in 2013, which in itself amounts to a relatively flat 0.3% gain. This somewhat stagnant growth trend is forecast, as only Chile shows stronger oil demand growth (+2.3%) consequential on it possessing by far the most robust macroeconomic underpinnings (+4.6% according to the IMF’s July World Economic Outlook, versus +2.9% for Mexico, +1.7% for the US and +1.7% for Canada). Ongoing weakness in Mexican fuel oil demand, a consequence of the power sector’s growing preference for natural gas, dampened the overall demand trend with roughly 2.1 mb/d consumed in July. For the year as a whole, growth in Mexican oil use is forecast to remain essentially flat (up 0.1%), maintaining a 2.1 mb/d average.
INTERNATIONAL ENERGY AGENCY ‐ OIL MARKET REPORT DEMAND
12 SEPTEMBER 2013 13
OECD Americas:Total Oil Product Demand
22.5
23.5
24.5
Jan Apr Jul Oct Jan
mb/d
Range 08-12 5-year avg2012 2013
Mexico: Residual Fuel Oil Demand
150
200
250
300
350
Jan Apr Jul Oct Jan
kb/d
Range 08-12 5-year avg2012 2013
OECD Demand based on Adjusted Preliminary Submissions - July 2013(million barrels per day)
mb/d % pa mb/d % pa mb/d % pa mb/d % pa mb/d % pa mb/d % pa mb/d % pa
OECD Americas* 10.70 2.0 1.75 2.1 4.47 4.9 0.42 -11.0 0.68 -21.3 5.85 -1.22 23.87 0.6 US50 8.99 1.8 1.50 1.9 3.57 6.0 0.11 -38.7 0.30 -26.7 4.31 -1.4 18.79 0.8 Canada 0.81 5.9 0.13 3.6 0.30 -4.6 0.22 15.4 0.03 -66.7 0.80 -2.6 2.29 -0.9 Mexico 0.78 1.4 0.06 3.7 0.39 0.5 0.05 0.9 0.24 -5.4 0.59 2.7 2.13 0.8
OECD Europe 2.07 -0.6 1.33 0.0 4.64 2.4 1.36 -9.1 0.99 -8.3 3.51 0.1 13.88 -0.9 Germany 0.44 2.6 0.22 7.3 0.75 3.7 0.36 -11.0 0.13 -3.1 0.62 4.2 2.53 1.2 United Kingdom 0.30 -2.2 0.29 -2.7 0.44 0.7 0.12 -5.7 0.04 -11.4 0.25 -5.6 1.45 -2.7 France 0.19 2.6 0.17 0.0 0.76 5.5 0.25 -13.3 0.06 -5.4 0.37 -2.9 1.79 -0.5 Italy 0.23 -3.2 0.10 -4.9 0.48 -2.3 0.10 0.3 0.09 -13.7 0.40 2.1 1.39 -2.1 Spain 0.12 0.2 0.13 -4.4 0.46 3.2 0.12 1.8 0.13 -30.1 0.24 -16.0 1.22 -7.0
OECD Asia & Oceania 1.66 0.2 0.65 3.6 1.31 1.3 0.44 -9.2 0.74 -17.9 3.26 0.7 8.06 -1.7 Japan 1.03 1.6 0.35 7.6 0.47 4.5 0.33 -2.9 0.44 -21.3 1.68 0.2 4.30 -1.4 Korea 0.20 -3.1 0.12 -4.9 0.30 1.9 0.11 -4.8 0.25 -5.9 1.26 2.5 2.23 0.1 Australia 0.31 -1.2 0.13 3.1 0.38 -0.4 0.00 0.0 0.02 -7.3 0.24 -4.3 1.10 -1.3
OECD Total 14.43 1.4 3.73 1.6 10.41 3.3 2.21 -9.4 2.41 -15.3 12.63 -0.4 45.82 -0.2 * Including US territories
RFO Other Total ProductsGasoline Jet/Kerosene Diesel Other Gasoil
Europe
The European demand picture remains somewhat subdued, despite reports of very warm July/August trimming 3Q13 vehicle efficiency rates (as additional vehicle air conditioning usage raises the average fuel requirement) and tentative signs of an economic bottoming‐out in the region, with 110 kb/d (or 0.8%) less oil products likely to be consumed in 3Q13 over the year earlier. Warmer climes also triggered relatively high levels of summer vacation travel. The 3Q13 momentum is, however, an improvement on the past five years, when the average decline rate was closer to 0.4 mb/d.
France: Total Oil Product Demand
1,600
1,700
1,800
1,900
2,000
2,100
Jan Apr Jul Oct Jan
kb/d
5-year avg2012 2013
France: Gasoil Demand
800
850
900
950
1,000
1,050
1,100
1,150
Jan Apr Jul Oct Jan
kb/d
5-year avg
2012 2013
Following a steep contraction in 2012, the French demand sector, according to preliminary July data, showed modest signs of life. July demand of 1.8 mb/d was 0.5% down on the corresponding period a year earlier, a much slower decline than the 2.2% average drop of the previous 12 months. Domestic
DEMAND INTERNATIONAL ENERGY AGENCY ‐ OIL MARKET REPORT
14 12 SEPTEMBER 2013
transport fuels led the upside, with total gasoil demand up 0.1% in July, to 1.0 mb/d, and gasoline use up 2.6% to 185 kb/d. The forecast for the year as a whole has been revised, to a decline rate of 1.4% versus the previous ‐2.1% estimate, consequential on roughly 75 kb/d being added to the July estimate and 35 kb/d to June.
Asia Oceania
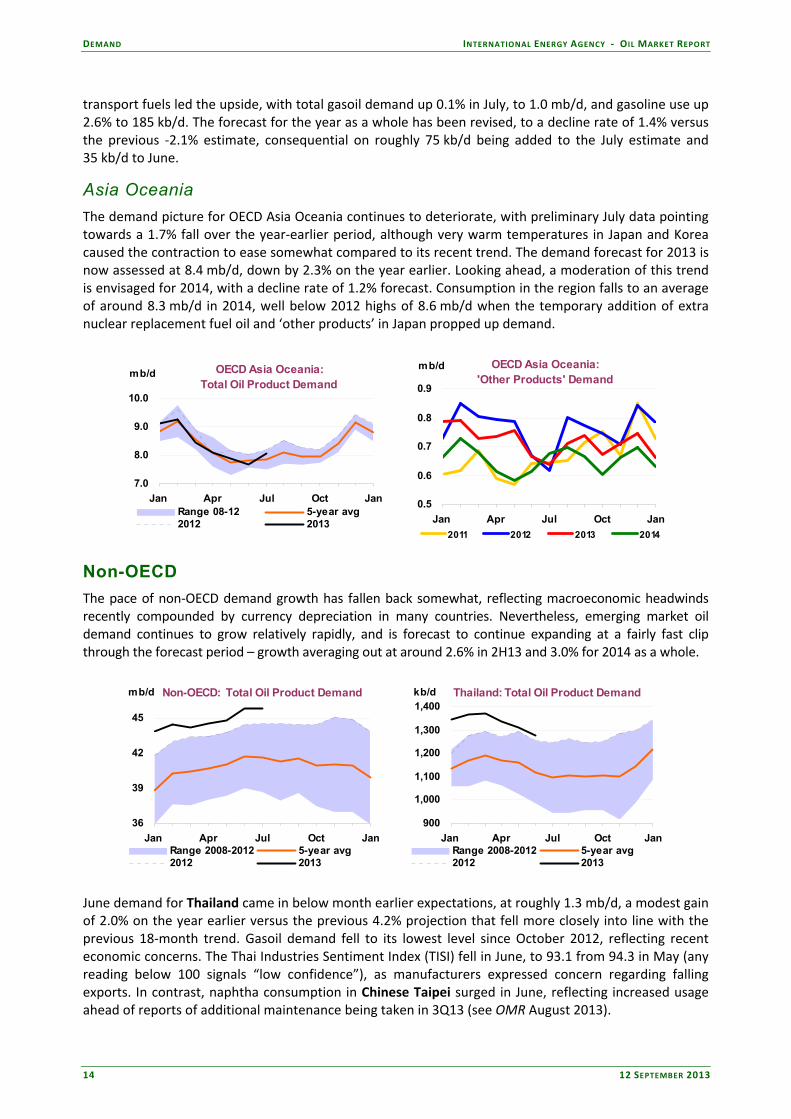
The demand picture for OECD Asia Oceania continues to deteriorate, with preliminary July data pointing towards a 1.7% fall over the year‐earlier period, although very warm temperatures in Japan and Korea caused the contraction to ease somewhat compared to its recent trend. The demand forecast for 2013 is now assessed at 8.4 mb/d, down by 2.3% on the year earlier. Looking ahead, a moderation of this trend is envisaged for 2014, with a decline rate of 1.2% forecast. Consumption in the region falls to an average of around 8.3 mb/d in 2014, well below 2012 highs of 8.6 mb/d when the temporary addition of extra nuclear replacement fuel oil and ‘other products’ in Japan propped up demand.
OECD Asia Oceania:Total Oil Product Demand
7.0
8.0
9.0
10.0
Jan Apr Jul Oct Jan
mb/d
Range 08-12 5-year avg2012 2013
OECD Asia Oceania:'Other Products' Demand
0.5
0.6
0.7
0.8
0.9
Jan Apr Jul Oct Jan
mb/d
2011 2012 2013 2014
Non-OECD
The pace of non‐OECD demand growth has fallen back somewhat, reflecting macroeconomic headwinds recently compounded by currency depreciation in many countries. Nevertheless, emerging market oil demand continues to grow relatively rapidly, and is forecast to continue expanding at a fairly fast clip through the forecast period – growth averaging out at around 2.6% in 2H13 and 3.0% for 2014 as a whole.
Non-OECD: Total Oil Product Demand
36
39
42
45
Jan Apr Jul Oct Jan
mb/d
Range 2008-2012 5-year avg2012 2013
Thailand: Total Oil Product Demand
900
1,000
1,100
1,200
1,300
1,400
Jan Apr Jul Oct Jan
kb/d
Range 2008-2012 5-year avg2012 2013
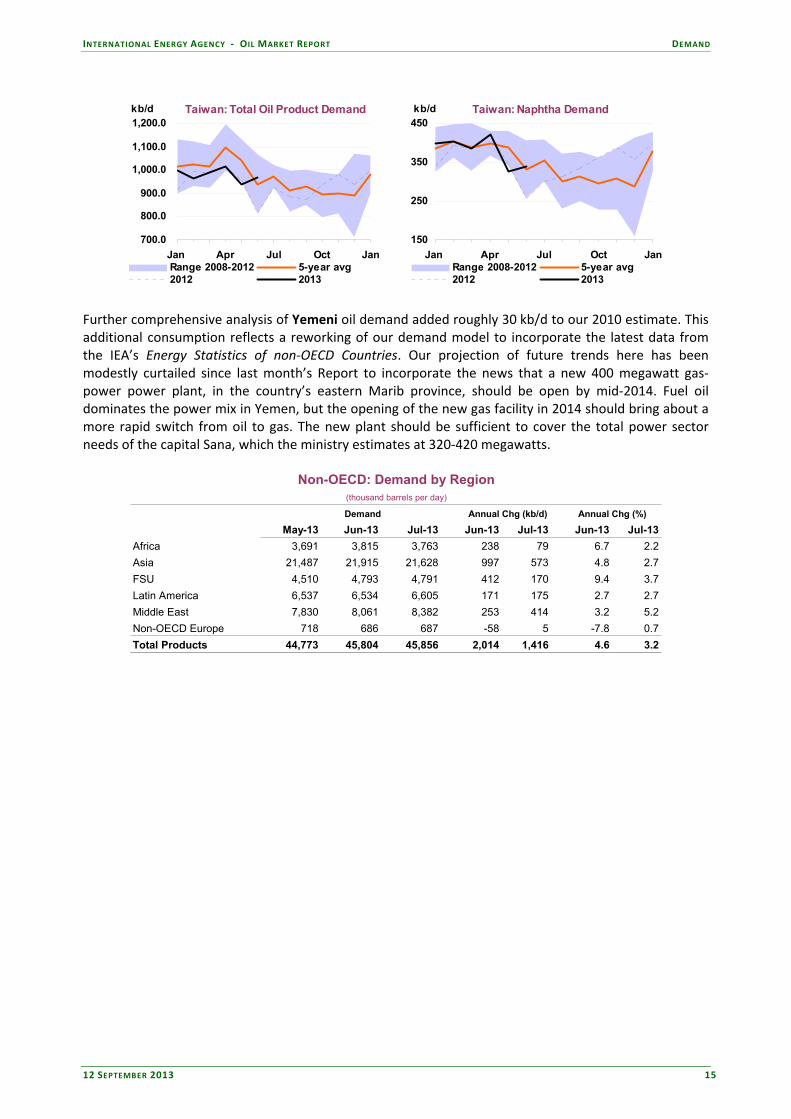
June demand for Thailand came in below month earlier expectations, at roughly 1.3 mb/d, a modest gain of 2.0% on the year earlier versus the previous 4.2% projection that fell more closely into line with the previous 18‐month trend. Gasoil demand fell to its lowest level since October 2012, reflecting recent economic concerns. The Thai Industries Sentiment Index (TISI) fell in June, to 93.1 from 94.3 in May (any reading below 100 signals “low confidence”), as manufacturers expressed concern regarding falling exports. In contrast, naphtha consumption in Chinese Taipei surged in June, reflecting increased usage ahead of reports of additional maintenance being taken in 3Q13 (see OMR August 2013).
INTERNATIONAL ENERGY AGENCY ‐ OIL MARKET REPORT DEMAND
12 SEPTEMBER 2013 15
Taiwan: Total Oil Product Demand
700.0
800.0
900.0
1,000.0
1,100.0
1,200.0
Jan Apr Jul Oct Jan
kb/d
Range 2008-2012 5-year avg2012 2013
Taiwan: Naphtha Demand
150
250
350
450
Jan Apr Jul Oct Jan
kb/d
Range 2008-2012 5-year avg2012 2013
Further comprehensive analysis of Yemeni oil demand added roughly 30 kb/d to our 2010 estimate. This additional consumption reflects a reworking of our demand model to incorporate the latest data from the IEA’s Energy Statistics of non‐OECD Countries. Our projection of future trends here has been modestly curtailed since last month’s Report to incorporate the news that a new 400 megawatt gas‐power power plant, in the country’s eastern Marib province, should be open by mid‐2014. Fuel oil dominates the power mix in Yemen, but the opening of the new gas facility in 2014 should bring about a more rapid switch from oil to gas. The new plant should be sufficient to cover the total power sector needs of the capital Sana, which the ministry estimates at 320‐420 megawatts.
Non-OECD: Demand by Region(thousand barrels per day)
Annual Chg (kb/d) Annual Chg (%)
May-13 Jun-13 Jul-13 Jun-13 Jul-13 Jun-13 Jul-13
Africa 3,691 3,815 3,763 238 79 6.7 2.2
Asia 21,487 21,915 21,628 997 573 4.8 2.7
FSU 4,510 4,793 4,791 412 170 9.4 3.7
Latin America 6,537 6,534 6,605 171 175 2.7 2.7
Middle East 7,830 8,061 8,382 253 414 3.2 5.2
Non-OECD Europe 718 686 687 -58 5 -7.8 0.7
Total Products 44,773 45,804 45,856 2,014 1,416 4.6 3.2
Demand
SUPPLY INTERNATIONAL ENERGY AGENCY ‐ OIL MARKET REPORT
16 12 SEPTEMBER 2013
SUPPLY
Summary
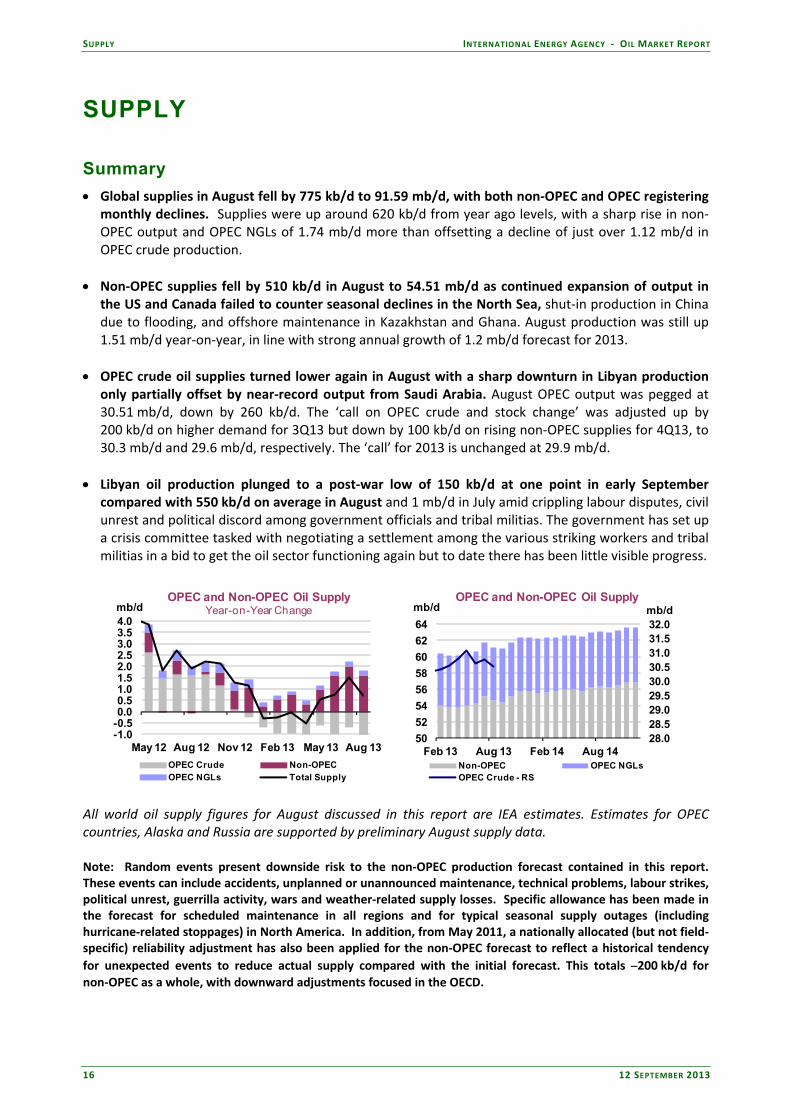
Global supplies in August fell by 775 kb/d to 91.59 mb/d, with both non‐OPEC and OPEC registering monthly declines. Supplies were up around 620 kb/d from year ago levels, with a sharp rise in non‐OPEC output and OPEC NGLs of 1.74 mb/d more than offsetting a decline of just over 1.12 mb/d in OPEC crude production.
Non‐OPEC supplies fell by 510 kb/d in August to 54.51 mb/d as continued expansion of output in the US and Canada failed to counter seasonal declines in the North Sea, shut‐in production in China due to flooding, and offshore maintenance in Kazakhstan and Ghana. August production was still up 1.51 mb/d year‐on‐year, in line with strong annual growth of 1.2 mb/d forecast for 2013.
OPEC crude oil supplies turned lower again in August with a sharp downturn in Libyan production only partially offset by near‐record output from Saudi Arabia. August OPEC output was pegged at 30.51 mb/d, down by 260 kb/d. The ‘call on OPEC crude and stock change’ was adjusted up by 200 kb/d on higher demand for 3Q13 but down by 100 kb/d on rising non‐OPEC supplies for 4Q13, to 30.3 mb/d and 29.6 mb/d, respectively. The ‘call’ for 2013 is unchanged at 29.9 mb/d.
Libyan oil production plunged to a post‐war low of 150 kb/d at one point in early September compared with 550 kb/d on average in August and 1 mb/d in July amid crippling labour disputes, civil unrest and political discord among government officials and tribal militias. The government has set up a crisis committee tasked with negotiating a settlement among the various striking workers and tribal militias in a bid to get the oil sector functioning again but to date there has been little visible progress.
-1.0-0.50.00.51.01.52.02.53.03.54.0
May 12 Aug 12 Nov 12 Feb 13 May 13 Aug 13
mb/dOPEC and Non-OPEC Oil Supply
Year-on-Year Change
OPEC Crude Non-OPECOPEC NGLs Total Supply
28.028.529.029.530.030.531.031.532.0
50
52
54
56
58
60
62
64
Feb 13 Aug 13 Feb 14 Aug 14
mb/dmb/dOPEC and Non-OPEC Oil Supply
Non-OPEC OPEC NGLsOPEC Crude - RS
All world oil supply figures for August discussed in this report are IEA estimates. Estimates for OPEC countries, Alaska and Russia are supported by preliminary August supply data. Note: Random events present downside risk to the non‐OPEC production forecast contained in this report. These events can include accidents, unplanned or unannounced maintenance, technical problems, labour strikes, political unrest, guerrilla activity, wars and weather‐related supply losses. Specific allowance has been made in the forecast for scheduled maintenance in all regions and for typical seasonal supply outages (including hurricane‐related stoppages) in North America. In addition, from May 2011, a nationally allocated (but not field‐specific) reliability adjustment has also been applied for the non‐OPEC forecast to reflect a historical tendency
for unexpected events to reduce actual supply compared with the initial forecast. This totals ‒200 kb/d for non‐OPEC as a whole, with downward adjustments focused in the OECD.
INTERNATIONAL ENERGY AGENCY ‐ OIL MARKET REPORT SUPPLY
12 SEPTEMBER 2013 17
OPEC Crude Oil Supply
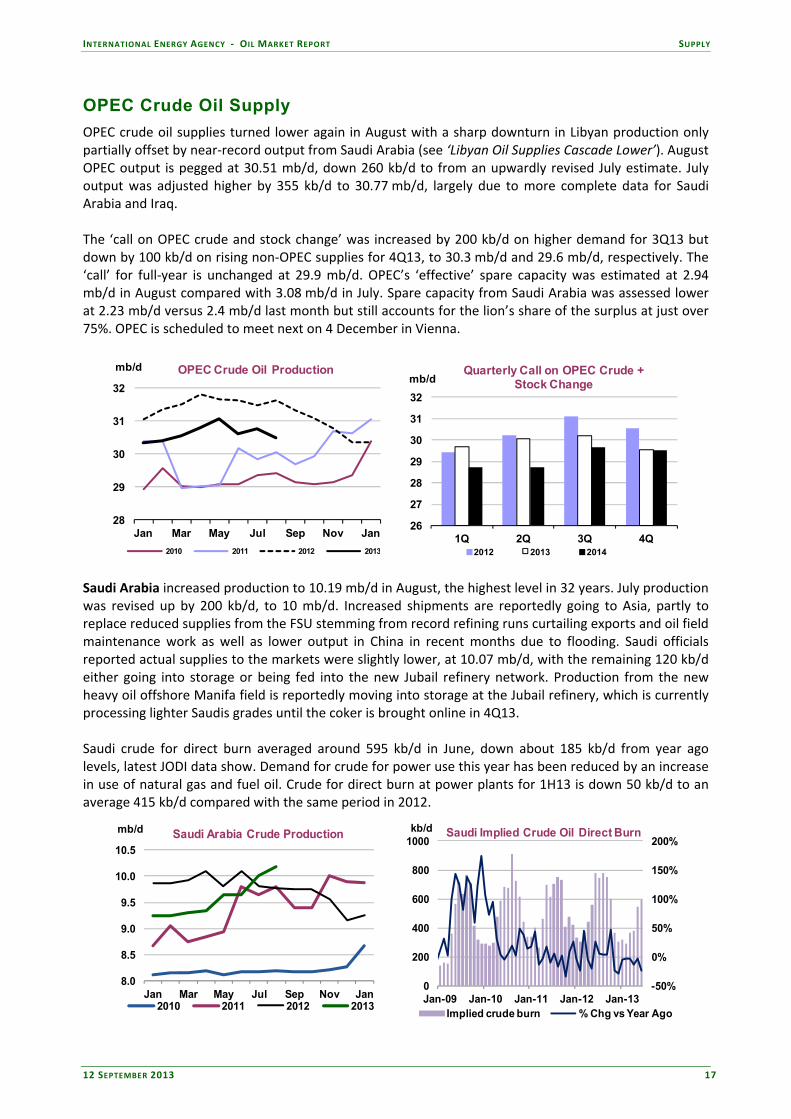
OPEC crude oil supplies turned lower again in August with a sharp downturn in Libyan production only partially offset by near‐record output from Saudi Arabia (see ‘Libyan Oil Supplies Cascade Lower’). August OPEC output is pegged at 30.51 mb/d, down 260 kb/d to from an upwardly revised July estimate. July output was adjusted higher by 355 kb/d to 30.77 mb/d, largely due to more complete data for Saudi Arabia and Iraq. The ‘call on OPEC crude and stock change’ was increased by 200 kb/d on higher demand for 3Q13 but down by 100 kb/d on rising non‐OPEC supplies for 4Q13, to 30.3 mb/d and 29.6 mb/d, respectively. The ‘call’ for full‐year is unchanged at 29.9 mb/d. OPEC’s ‘effective’ spare capacity was estimated at 2.94 mb/d in August compared with 3.08 mb/d in July. Spare capacity from Saudi Arabia was assessed lower at 2.23 mb/d versus 2.4 mb/d last month but still accounts for the lion’s share of the surplus at just over 75%. OPEC is scheduled to meet next on 4 December in Vienna.
28
29
30
31
32
Jan Mar May Jul Sep Nov Jan
mb/d OPEC Crude Oil Production
2010 2011 2012 2013
26
27
28
29
30
31
32
1Q 2Q 3Q 4Q
mb/dQuarterly Call on OPEC Crude +
Stock Change
2012 2013 2014
Saudi Arabia increased production to 10.19 mb/d in August, the highest level in 32 years. July production was revised up by 200 kb/d, to 10 mb/d. Increased shipments are reportedly going to Asia, partly to replace reduced supplies from the FSU stemming from record refining runs curtailing exports and oil field maintenance work as well as lower output in China in recent months due to flooding. Saudi officials reported actual supplies to the markets were slightly lower, at 10.07 mb/d, with the remaining 120 kb/d either going into storage or being fed into the new Jubail refinery network. Production from the new heavy oil offshore Manifa field is reportedly moving into storage at the Jubail refinery, which is currently processing lighter Saudis grades until the coker is brought online in 4Q13. Saudi crude for direct burn averaged around 595 kb/d in June, down about 185 kb/d from year ago levels, latest JODI data show. Demand for crude for power use this year has been reduced by an increase in use of natural gas and fuel oil. Crude for direct burn at power plants for 1H13 is down 50 kb/d to an average 415 kb/d compared with the same period in 2012.
8.0
8.5
9.0
9.5
10.0
10.5
Jan Mar May Jul Sep Nov Jan
mb/d Saudi Arabia Crude Production
2010 2011 2012 2013
-50%
0%
50%
100%
150%
200%
0
200
400
600
800
1000
Jan-09 Jan-10 Jan-11 Jan-12 Jan-13
kb/d Saudi Implied Crude Oil Direct Burn
Implied crude burn % Chg vs Year Ago

SUPPLY INTERNATIONAL ENERGY AGENCY ‐ OIL MARKET REPORT
18 12 SEPTEMBER 2013
Iraqi crude oil output edged higher in August, up by just over 100 kb/d to 3.17 mb/d. July output was revised up by 70 kb/d to 3.06 mb/d, largely due to higher‐than‐forecast crude burn at power stations. Total exports rose about 165 kb/d to 2.47 mb/d in August, with southern shipments exceptionally robust while northern volumes remained constrained. Exports of Basrah crude rose by 140 kb/d to 2.29 mb/d as State Oil Marketing Co (SOMO) ramped up volumes ahead of planned maintenance work at the southern Basrah and Khor Al‐Amaya shipping terminals in September.
2.2
2.4
2.6
2.8
3.0
3.2
3.4
Jan Mar May Jul Sep Nov Jan
mb/d Iraq Crude Production
2010 2011 2012 2013
0.0
0.5
1.0
1.5
2.0
Jan 12 Apr 12 Jul 12 Oct 12 Jan 13 Apr 13 Jul 13
mb/d Basrah Oil Exports
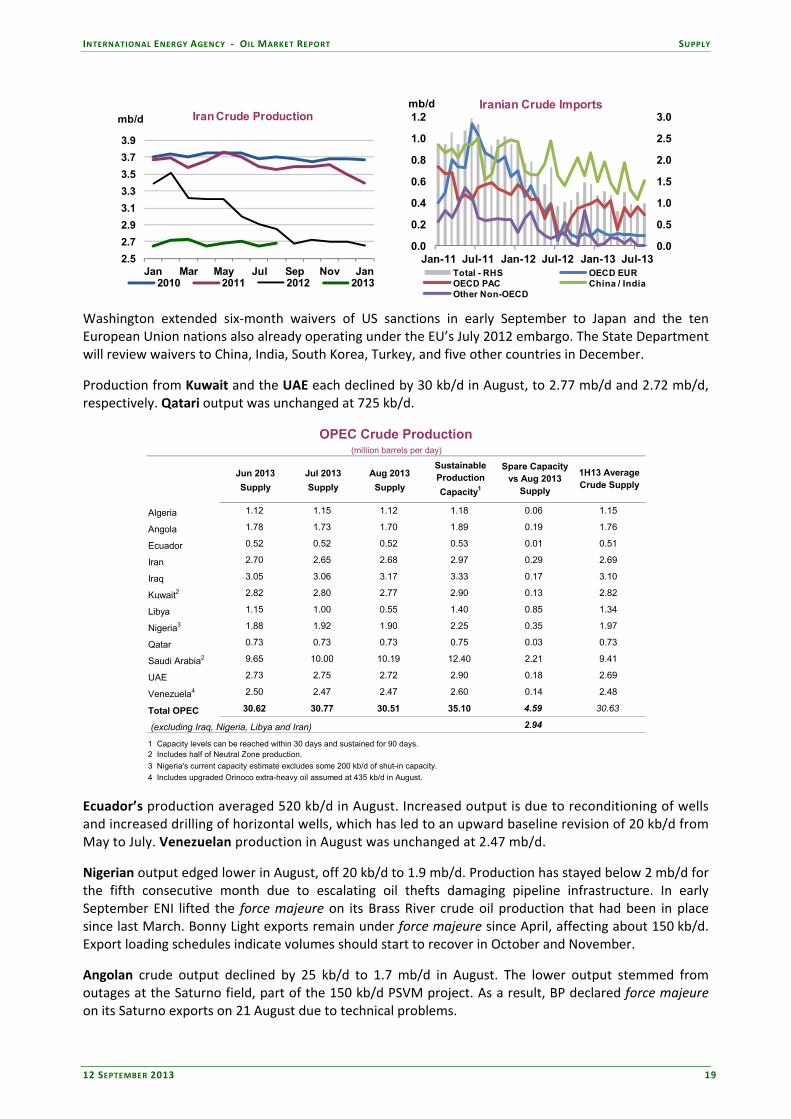
Far East Europe US Conflicting reports for the outlook for southern exports in September and through the end of the year have forced traders and refiners to seek replacement barrels, especially in Asia where 70% of Basrah crude is normally processed. Officials initially told regular buyers that planned infrastructure work at the Gulf export terminals would cut shipments by as much as 500 kb/d in September but reversed course in mid‐August and said the project would be postponed. However, contractors said in September it was not possible to scale back and alter plans for the terminal work. That said, the 8 September work start date has been delayed 4‐5 days due to unexpected technical issues. SOMO nominations were cut to 1.8 mb/d from 2.3 mb/d, or about 500 kb/d. Amid all the confusion regular buyers of Iraqi crude are lining up alternative supplies, which in turn has elevated price differentials for competing crudes such as Urals, Azeri and other sour grades in Europe as well as Middle East grades such as Abu Dhabi’s Murban. Northern exports of Kirkuk crude were only marginally higher in August, up around 25 kb/d to 180 kb/d. Militant attacks on the key pipeline running to the Mediterranean port of Ceyhan continue to disrupt export flows, with volumes nearly halved from a 2013 peak of 330 kb/d in March. In addition, shipments from the Kurdistan region to the Kirkuk‐Ceyhan crude pipeline remain shut‐off. The ongoing dispute over payment and contract terms between Baghdad and the Kurdistan Regional Government (KRG) has been complicated by the KRG’s decision to go ahead with new pipeline projects to let exports bypass the Kirkuk‐Ceyhan line controlled by the central government. A further 40‐50 kb/d of crude and condensates is moving via trucks through Turkey. Crude production in the KRG area was estimated at 140 kb/d in August. Iran’s crude oil production rose to 2.68 mb/d in August, up 30 kb/d from July levels. Preliminary data show total crude imports from Iran averaged 985 kb/d in August, up just under 100 kb/d from July levels. Data for July imports were revised down to 900 kb/d compared with 1.16 mb/d reported last month. In August China, Japan, South Korea, Turkey, the UAE and Syria imported Iranian crude, tanker data show. Import volumes are based on data submitted by OECD countries, non‐OECD statistics from customs agencies, tanker movements and news reports. After payment problems stalled liftings in July, preliminary data show India posted the largest month‐on‐month increase in August, up 125 kb/d to around 165 kb/d. Japanese imports from Iran rose by about 50 kb/d to 225 kb/d in August while China increased volumes to 440 kb/d from around 400 kb/d in July. Last month, Syria imported crude for the third time this year, at around 30 kb/d.
INTERNATIONAL ENERGY AGENCY ‐ OIL MARKET REPORT SUPPLY
12 SEPTEMBER 2013 19
2.5
2.7
2.9
3.1
3.3
3.5
3.7
3.9
Jan Mar May Jul Sep Nov Jan
mb/d Iran Crude Production
2010 2011 2012 2013
0.0
0.5
1.0
1.5
2.0
2.5
3.0
0.0
0.2
0.4
0.6
0.8
1.0
1.2
Jan-11 Jul-11 Jan-12 Jul-12 Jan-13 Jul-13
mb/d Iranian Crude Imports
Total - RHS OECD EUROECD PAC China / IndiaOther Non-OECD
Washington extended six‐month waivers of US sanctions in early September to Japan and the ten European Union nations also already operating under the EU’s July 2012 embargo. The State Department will review waivers to China, India, South Korea, Turkey, and five other countries in December.
Production from Kuwait and the UAE each declined by 30 kb/d in August, to 2.77 mb/d and 2.72 mb/d, respectively. Qatari output was unchanged at 725 kb/d.
Jun 2013 Jul 2013 Aug 2013
Supply Supply Supply
Algeria 1.12 1.15 1.12 1.18 0.06 1.15
Angola 1.78 1.73 1.70 1.89 0.19 1.76
Ecuador 0.52 0.52 0.52 0.53 0.01 0.51
Iran 2.70 2.65 2.68 2.97 0.29 2.69
Iraq 3.05 3.06 3.17 3.33 0.17 3.10
Kuwait2 2.82 2.80 2.77 2.90 0.13 2.82
Libya 1.15 1.00 0.55 1.40 0.85 1.34
Nigeria3 1.88 1.92 1.90 2.25 0.35 1.97
Qatar 0.73 0.73 0.73 0.75 0.03 0.73
Saudi Arabia2 9.65 10.00 10.19 12.40 2.21 9.41
UAE 2.73 2.75 2.72 2.90 0.18 2.69
Venezuela4 2.50 2.47 2.47 2.60 0.14 2.48
Total OPEC 30.62 30.77 30.51 35.10 4.59 30.63
(excluding Iraq, Nigeria, Libya and Iran) 2.94
1 Capacity levels can be reached within 30 days and sustained for 90 days.2 Includes half of Neutral Zone production.
3 Nigeria's current capacity estimate excludes some 200 kb/d of shut-in capacity.
4 Includes upgraded Orinoco extra-heavy oil assumed at 435 kb/d in August.
Sustainable Production
Capacity1
Spare Capacity vs Aug 2013
Supply
1H13 Average Crude Supply
OPEC Crude Production(million barrels per day)
Ecuador’s production averaged 520 kb/d in August. Increased output is due to reconditioning of wells and increased drilling of horizontal wells, which has led to an upward baseline revision of 20 kb/d from May to July. Venezuelan production in August was unchanged at 2.47 mb/d.
Nigerian output edged lower in August, off 20 kb/d to 1.9 mb/d. Production has stayed below 2 mb/d for the fifth consecutive month due to escalating oil thefts damaging pipeline infrastructure. In early September ENI lifted the force majeure on its Brass River crude oil production that had been in place since last March. Bonny Light exports remain under force majeure since April, affecting about 150 kb/d. Export loading schedules indicate volumes should start to recover in October and November.
Angolan crude output declined by 25 kb/d to 1.7 mb/d in August. The lower output stemmed from outages at the Saturno field, part of the 150 kb/d PSVM project. As a result, BP declared force majeure on its Saturno exports on 21 August due to technical problems.

SUPPLY INTERNATIONAL ENERGY AGENCY ‐ OIL MARKET REPORT
20 12 SEPTEMBER 2013
Libyan Oil Supplies Cascade Lower
Oil production in Libya plunged to a post‐war low of 150 kb/d at one point in early September compared with 550 kb/d on average in August and 1 mb/d in July amid crippling labour disputes, civil unrest and political infighting among tribal militias. Exports have tumbled to just 80 kb/d versus 1.2 mb/d previously, with shipments operating only from the country’s two offshore fields, Bouri and al Jurf. The burgeoning crisis, the worst since the onset of the civil war in early 2011, is weakening already‐fragile government institutions and choking off vital revenues. Striking workers have halted exports and forced the closure of the eastern region’s oil‐producing fields off and on since the end of May. Tribal groups are now pushing for federalism whereby regions control export flows and revenues.
In late August, Libya's largest western oilfields were closed after militants shut down the pipeline linking the fields to the ports. The two major fields affected were Elephant and El Sharara, which have a combined capacity of around 500 kb/d. After reaching a 2013 high of 1.42 mb/d in April, production has steadily was averaging 250 kb/d in the first week of September. This compares to an average of 1.4 mb/d in 2012, 460 kb/d in 2011 and 1.55 mb/d in 2010, pre‐civil war.
The government has set up a crisis committee tasked with negotiating a settlement among the various striking workers and tribal militias in a bid to get the oil sector functioning again. The head of the government energy committee, however, said little headway had been made between government and tribal mediators as well as with an array of protest groups. The striking workers and disgruntled civilians are demanding a multitude of changes, ranging from improved pay packages and management changes to a share of the revenues and greater regional autonomy, which have combined to complicate the already challenging negotiations.
2010 2011 2012 Jan‐13 Feb‐13 Mar‐13 Apr‐13 May‐13 Jun‐13 Jul‐13 Aug‐13
Crude Oil 1550 458 1387 1380 1400 1360 1420 1350 1150 1000 550
NGLs 111 27 89 99 99 99 90 90 90 80 80
Total 1661 485 1476 1479 1499 1459 1510 1440 1240 1080 630
Libyan Crude and NGL Production (kb/d)
Aside from the offshore exports, Libyan terminals have been shut by port worker strikes or following occupation by members of the Petroleum Facilities Guard. Newswire reports in late August indicated that the Marsa al Brega and Marsa al Hariga terminals would return to normal by early September proved overly optimistic, and recent tanker tracking data do not support these claims. Indeed, according to tracking data, the last crude cargo to leave Libya was a 700 kb Aframax tanker which left the offshore Bouri terminal on 20 August, bound for Italy. Previous to this, the land‐based Zaiwa terminal was exporting regular cargos until 19 August. The country’s main crude export terminal at Es Sider last exported a cargo on 26 July when an Aframax left for Spain.
The country’s five domestic refineries with a combined capacity of 378 kb/d have only operated sporadically since the civil war, with prolonged shutdowns reported. The largest refinery, the 220 kb/d Ras Lanuf plant, has also been closed due to worker protests and the lack of crude, as did the 120 kb/d Zawiya refinery. Latest estimates of Libyan refinery crude throughputs were around 120 kb/d in July, with the remainder of the crude exported.
Recent import data indicate that the bulk of Libya’s crude exports head to OECD member countries, with OECD Europe taking just under 900 kb/d so far in 2013 (June is the latest month for which OECD import data are available). To date, Italy has been Libya’s largest customer. A large proportion of Libya’s exports are used by refiners in the Mediterranean basin or in other European countries with pipeline access to Mediterranean import terminals. Australia is the only OECD member taking significant long‐haul Libyan volumes, although it has cut imports steadily since February.
0.0
0.2
0.4
0.6
0.8
1.0
1.2
1.4
1.6
1.8
Jan-11 Oct-11 Jul-12 Apr-13
mb/d Libya Crude Production

INTERNATIONAL ENERGY AGENCY ‐ OIL MARKET REPORT SUPPLY
12 SEPTEMBER 2013 21
Libyan Oil Supplies Cascade Lower (continued)
Outside of the OECD, recent tanker tracking data indicate that so far in 2013, sporadic cargoes of Libyan crude have been occasionally heading to Asia, notably China, Indonesia and Thailand.
2009 2010 2011 2012 Jan‐13 Feb‐13 Mar‐13 Apr‐13 May‐13 Jun‐13% of total crude
imports (2012)
France 131 210 64 128 134 147 114 92 127 135 11.2%
Germany 167 147 56 173 170 190 195 197 183 203 9.2%
Italy 413 368 96 288 273 219 218 223 302 216 20.9%
Spain 102 138 23 98 92 109 57 57 96 67 8.3%
United Kingdom 37 55 15 59 0 86 97 96 79 59 5.5%
Other OECD Europe 135 168 38 167 243 206 121 110 144 130 3.7%
Total OECD Europe 986 1086 293 914 912 956 803 775 930 811 8.2%
Total OECD 1049 1140 312 1018 970 1026 929 858 1043 948 3.7%
OECD Crude Imports from Libya (kb/d)
Since Libyan crudes are light and sweet in nature, they have high yields of gasoline, low‐sulphur diesel and jet fuel, which make them highly sought‐after by European refiners. They are also difficult to replace since there are few crudes of similar quality. The closest quality replacement crudes for the lost Libyan streams of Es Sider, Sarir, El Shahara and Bu Attifel are Ekofisk and Brent crudes from the North Sea, BTC Blend from the FSU, Bonny and Qua Iboe from Nigeria and Algerian Saharan Blend. In the last few month, due to seasonal maintenance in the North Sea, the output of Ekofisk and Brent has been constrained, helping to propel North Sea Dated prices to their recent highs. It is also worth noting that during the 2011 Libyan civil war European refiners were forced to turn to incremental sour supplies made available by OPEC members, notably Saudi Arabia, which were not a like‐for‐like replacement for lost Libyan crudes. Additionally, the increasing sweet‐sour differentials over 2011 also drew in limited supplies to Europe of light, sweet Latin American and West African crudes, which would otherwise have been used by US Gulf Coast refiners.
Bu AttifelEl Shahara
Saharan Blend
Qua IboeBonny
SarirCusiana
Es Sider Forties
Arab Extra Light
Brazil Roncador
Arab Light
KirkukArab Medium
Basrah Light
Brent
0.0
0.5
1.0
1.5
2.0
2.5
3.0
% S
ulp
hu
r
API
Selected Crude Oil Export Streams by Quality
BTC
28 32 36 40 44 48
SUPPLY INTERNATIONAL ENERGY AGENCY ‐ OIL MARKET REPORT
22 12 SEPTEMBER 2013
-1.0
-0.5
0.0
0.5
1.0
1.5
2.0
1Q10 4Q10 3Q11 2Q12 1Q13 4Q13 3Q14
mb/d Total Non-OPEC Supply, y-o-y chg
Other North America Total
Non-OPEC Overview
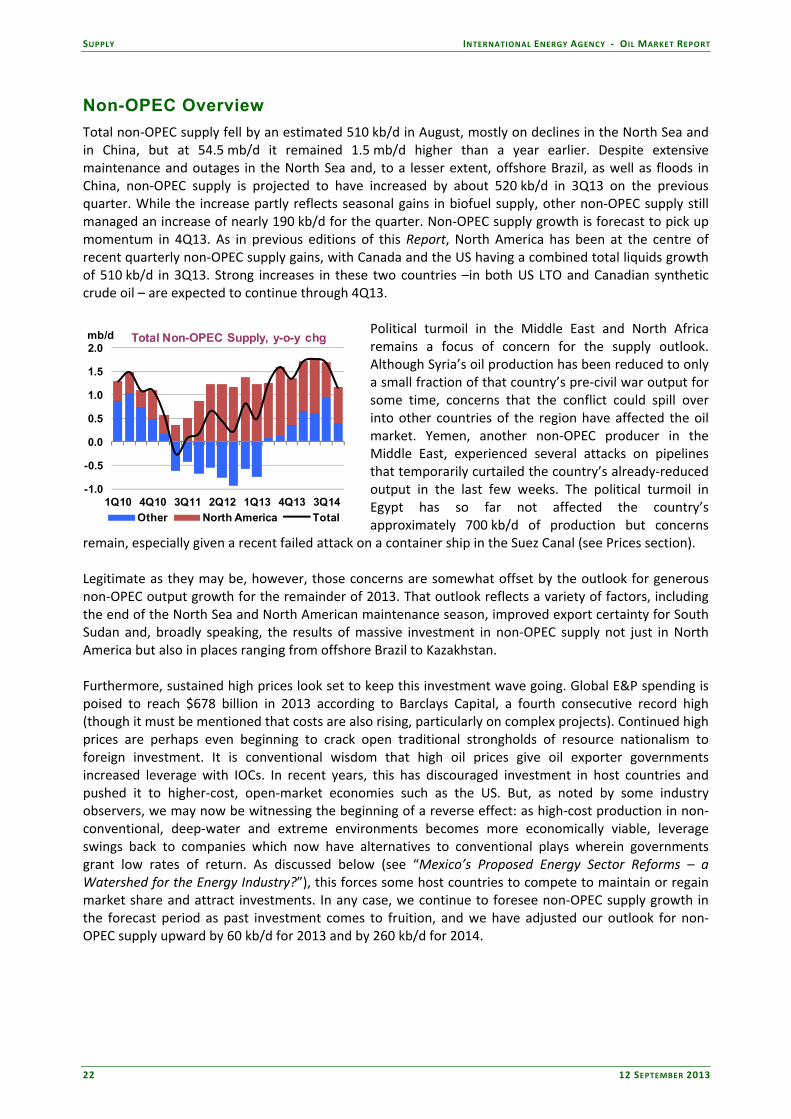
Total non‐OPEC supply fell by an estimated 510 kb/d in August, mostly on declines in the North Sea and in China, but at 54.5 mb/d it remained 1.5 mb/d higher than a year earlier. Despite extensive maintenance and outages in the North Sea and, to a lesser extent, offshore Brazil, as well as floods in China, non‐OPEC supply is projected to have increased by about 520 kb/d in 3Q13 on the previous quarter. While the increase partly reflects seasonal gains in biofuel supply, other non‐OPEC supply still managed an increase of nearly 190 kb/d for the quarter. Non‐OPEC supply growth is forecast to pick up momentum in 4Q13. As in previous editions of this Report, North America has been at the centre of recent quarterly non‐OPEC supply gains, with Canada and the US having a combined total liquids growth of 510 kb/d in 3Q13. Strong increases in these two countries –in both US LTO and Canadian synthetic crude oil – are expected to continue through 4Q13.
Political turmoil in the Middle East and North Africa remains a focus of concern for the supply outlook. Although Syria’s oil production has been reduced to only a small fraction of that country’s pre‐civil war output for some time, concerns that the conflict could spill over into other countries of the region have affected the oil market. Yemen, another non‐OPEC producer in the Middle East, experienced several attacks on pipelines that temporarily curtailed the country’s already‐reduced output in the last few weeks. The political turmoil in Egypt has so far not affected the country’s approximately 700 kb/d of production but concerns
remain, especially given a recent failed attack on a container ship in the Suez Canal (see Prices section). Legitimate as they may be, however, those concerns are somewhat offset by the outlook for generous non‐OPEC output growth for the remainder of 2013. That outlook reflects a variety of factors, including the end of the North Sea and North American maintenance season, improved export certainty for South Sudan and, broadly speaking, the results of massive investment in non‐OPEC supply not just in North America but also in places ranging from offshore Brazil to Kazakhstan. Furthermore, sustained high prices look set to keep this investment wave going. Global E&P spending is poised to reach $678 billion in 2013 according to Barclays Capital, a fourth consecutive record high (though it must be mentioned that costs are also rising, particularly on complex projects). Continued high prices are perhaps even beginning to crack open traditional strongholds of resource nationalism to foreign investment. It is conventional wisdom that high oil prices give oil exporter governments increased leverage with IOCs. In recent years, this has discouraged investment in host countries and pushed it to higher‐cost, open‐market economies such as the US. But, as noted by some industry observers, we may now be witnessing the beginning of a reverse effect: as high‐cost production in non‐conventional, deep‐water and extreme environments becomes more economically viable, leverage swings back to companies which now have alternatives to conventional plays wherein governments grant low rates of return. As discussed below (see “Mexico’s Proposed Energy Sector Reforms – a Watershed for the Energy Industry?”), this forces some host countries to compete to maintain or regain market share and attract investments. In any case, we continue to foresee non‐OPEC supply growth in the forecast period as past investment comes to fruition, and we have adjusted our outlook for non‐OPEC supply upward by 60 kb/d for 2013 and by 260 kb/d for 2014.

INTERNATIONAL ENERGY AGENCY ‐ OIL MARKET REPORT SUPPLY
12 SEPTEMBER 2013 23
OECD
North America
US – July preliminary; Alaska actual, other states estimated: US crude oil production averaged 1.1 mb/d higher in July 2013 than in July 2012, at 7.5 mb/d. Preliminary weekly figures for August show production holding steady, with declines in Alaska compensated by continued growth in tight oil at the Eagle Ford (where over 5,700 oil and gas wells have been drilled since 2008) and Permian basins in Texas. Likewise, 3Q13 crude oil production is forecast at 7.5 mb/d. Disruption risks in the US Gulf of Mexico at the peak of the hurricane season make for a forecast of a slight decline in September. On the other hand, the development of new shale plays, such as the Mississippian‐Woodford Trend in Oklahoma and Kansas, augurs continued production growth into the medium term, when some existing shale oil plays may begin to decline.
Pipeline and rail transport capacity continues to expand and thereby accommodate production growth, with about 500 kb/d of crude oil pipeline capacity added in the US in 2013. The 700 kb/d‐capacity Gulf Coast pipeline from the Cushing hub to Houston is targeted for completion by the end of the year. Alaska crude production fell below 500 kb/d in June and is forecast to remain below that level through 2014. Additional US West Coast refineries, such as the Puget Sound plant in Washington state, are exploring the possibility of rail transport of North Dakota crude to make up for declining Alaska tanker shipments. Tesoro already has a
120 kb/d rail offloading facility at its Anacortes refinery, also in Washington state. Including biofuels (ethanol and biodiesel), the US is set to become the leading non‐OPEC liquids producer as of 3Q13. Stripping out biofuels and refinery gains, however, puts the US 3Q13 total liquids production forecast at 10.3 mb/d, second only to that of Russia, which it trails by just 0.5 mb/d. Strong growth of US natural gas liquids production, estimated at 140 kb/d y‐o‐y for 3Q13, looms large in these gains. NGL production is forecast to show quarterly growth through 4Q14, when it is expected to reach about 2.75 mb/d. Five gas processing plants have come online this year drawing on the Marcellus/Utica play, and seven more are scheduled to come online by the end of 2013, increasing processing capacity by 110 million cubic metres per day. While there is currently adequate demand to absorb additional propane and butane supply, finding an outlet for the additional ethane coming from liquids‐rich Marcellus Shales has proved a challenge, as ethane rejection into dry gas now exceeds pipeline capacity to handle it. Two new infrastructure projects are designed to address this constraint: the 50 kb/d‐capacity Mariner West (I and II) ethane pipeline to petrochemical facilities in Sarnia, Ontario (Canada), which began being filled in August, and the 190 kb/d‐capacity Atex ethane pipeline to the Texas Gulf Coast, which is expected to come online in 1Q14. Canada – Newfoundland July actual, others June actual: Despite a slight decline in conventional crude oil production in June due to maintenance at Hibernia offshore (down 50 kb/d for the month) and slight declines in Alberta and Saskatchewan, total liquids production increased by about 70 kb/d for the month on strength of expanded bitumen and synthetics production. With maintenance at White Rose only knocking off 10 kb/d in July and forecast growth in bitumen of 60 kb/d, liquids production is expected to have increased by nearly 300 kb/d m‐o‐m as most synthetics operators boosted output. Even with maintenance, Syncrude Mildred Lake still achieved 180 kb/d for the month. We are forecasting that Canadian oil production will have surged to a new record of 4.1 mb/d in August, slightly above the previous record output of December 2012. Production of synthetic crude oil led the gains and, at
-0.4-0.20.00.20.40.60.81.01.21.4
1Q12 3Q12 1Q13 3Q13 1Q14 3Q14
mb/d US Total Oil Supply - Yearly Change
Alaska California TexasOther Lower-48 Gulf of Mexico NGLsNorth Dakota Other Total

SUPPLY INTERNATIONAL ENERGY AGENCY ‐ OIL MARKET REPORT
24 12 SEPTEMBER 2013
0.0
0.5
1.0
1.5
2.0
2.5
1Q11 1Q12 1Q13 1Q14
mb/d Canadian Oil Sands Output
Synthetic Crude In Situ Bitumen
1.05 mb/d, also reached a new record, as several plants returned from June and July maintenance and work on Suncor’s upgrader 2 unit was delayed until September. Crude oil production (excluding synthetics but including mined bitumen) is forecast at 2.4 mb/d for 3Q13, up by more than 300 kb/d y‐o‐y. Maintenance offshore Newfoundland began in June, cutting production of Hibernia by 50 kb/d for that month, and White Rose output by 10 kb/d in July. Extensive maintenance on the Terra Nova FPSO (which produced 60 kb/d in July) began this month. Given the record output of synthetic crude oil, including Suncor’s projects exceeding 400 kb/d for the first time ever in August, our forecast for Canadian total liquids production has been increased by over 80 kb/d for 2014 compared with last month’s Report. Total Canadian supply is now expected to reach an average of 4.2 mb/d for 2014 (a 200 kb/d y‐o‐y rise). In anticipation of this and other output increases, one investment bank has calculated that total planned capital spending on rail terminals, tanker cars, and associated infrastructure in Western Canada in the years 2014‐2015 will reach about $5.7 billion. Mexico – July actual: Pemex data shows that crude oil production in July was 2.48 mb/d, a decline of about 40 kb/d m‐o‐m. Weekly numbers show the mainstay offshore KMZ complex 30 kb/d lower for the month. Our expectation is of continued gradual decline in crude oil production until the end of the forecast period, with 2013 down 40 kb/d y‐o‐y and 2014 50 kb/d lower. The decline is expected to be halted only in the last quarter of 2014, as Pemex plans to have a record 47 jack‐up rigs in place in the shallow water GOM by mid‐2014. Pemex has had some success drilling in the deepwater Perdido fold‐belt play, where it has discovered an estimated 480 million barrels of oil, but last month the government announced a program of reforms in the energy sector designed to increase oil production in the medium term that would, if successfully implemented, bring other companies to the Mexican deepwater.
Mexico’s Proposed Energy Sector Reforms – A Watershed for the Energy Industry?
On 12 August 2013, Mexican President Enrique Peña Nieto announced plans to change the country’s constitution (which greatly restricts foreign and private‐sector participation in the energy sector) so as to allow a number of proposed reforms to the oil and gas, as well as electricity, sectors. Mexico’s oil sector has been famously closed off to non‐Pemex ownership participation since 1938, when foreign oil companies were expropriated by the state and the 100%‐state‐owned oil company Petróleos Mexicanos (Pemex) was created. Pemex became the country’s largest company, and has since then single‐handedly developed Mexico’s large oil and gas industry.
These reforms, in terms of the oil sector, do have the potential to change the production outlook for the country if things go according to the government’s plans. While we will not release another Medium‐term Oil Market Outlook until next year, the successful implementation of the main reforms below would be a key factor in lifting our oil production outlook for the latter half of this decade. In terms of the reforms delivering economic benefits for Mexico, any reduction in revenues in the short run from Pemex has to be balanced with the need to maintain, if not expand, oil‐derived revenues in the long run.
Although Mexico became a net importer in the 1950s, new discoveries in the 1970s and their successful exploitation, including the giant Cantarell field, subsequently made the country a major world producer and exporter. Pemex is also one of the most important contributors to the budget of the federal government, providing about 40% of receipts in recent years. However, since 2004, oil production has declined while domestic consumption continues to grow, eating into net exports. Deprived of much of its oil revenues, Pemex has been forced to take on large amounts of debt. The company also maintains a monopoly in the downstream sector extending to retail sales.

INTERNATIONAL ENERGY AGENCY ‐ OIL MARKET REPORT SUPPLY
12 SEPTEMBER 2013 25
Mexico’s Proposed Energy Sector Reforms (continued)
There has been concern in Mexico for some time about the implications of declining production and revenues (particularly if prices were to return to the average of the last decade), as well as cross‐subsidies for the downstream sector and the need to import natural gas and gasoline from the US. Likewise, the fact that Pemex has been unable to develop the country’s deepwater offshore as has been done in Brazil and the US Gulf of Mexico has also been noticed by the government. Figure 1 shows the enormous development of the US GOM, including deepwater, whereas the Mexican GOM has only a few (though large) shallow‐water developments.
This map is without prejudice to the status of or sovereignty over any territory, to the delimitation of international frontiers and boundaries and to the name of any territory, city or area.
MEXICO
MEXICO
USAUSA
Major oil and/or gas pipeline
Selected wells
Gulf of Mexico
Figure 1 Source: IEA
Geology, of course, does not observe national borders, and the shale boom that has transformed the US oil and gas industry has so far passed Mexico by. Formations such as Eagle Ford in Texas, which produces some 1 mb/d of light tight oil and large amounts of gas, extend into Mexico (the Boquillas formation in the Burgos Basin), yet only a small amount of gas has been developed for production by Pemex on the Mexican side of the border (see Figure 2), with most wells still in the exploratory stage.
Given the need for expertise and investment to develop deepwater and shale resources, as well as more generally to enhance the sector (including the downstream), the government has proposed a number of concrete reforms aiming to:
Achieve replacement rates for proven reserves of oil and gas in excess of 100%
Obtain crude oil production of 3 mb/d by 2018 and 3.5 mb/d by 2025
Obtain natural gas production of 226 million cubic metres per day (mcm/d) in 2018 and 295 mcm/d in 2025 (2012 production was 130 mcm/d)
The following are the main reform proposals affecting the oil sector:
Companies other than Pemex would be allowed to participate in the sector through the use of profit‐sharing contracts [contratos de utilidad compartida] that would not give companies explicit ownership of reserves but rather a revenue share from the government. Such contracts are expected to give a better rate of return than service contracts that are currently available and allow companies to report them in their financial statements as assets with expected cash flows.
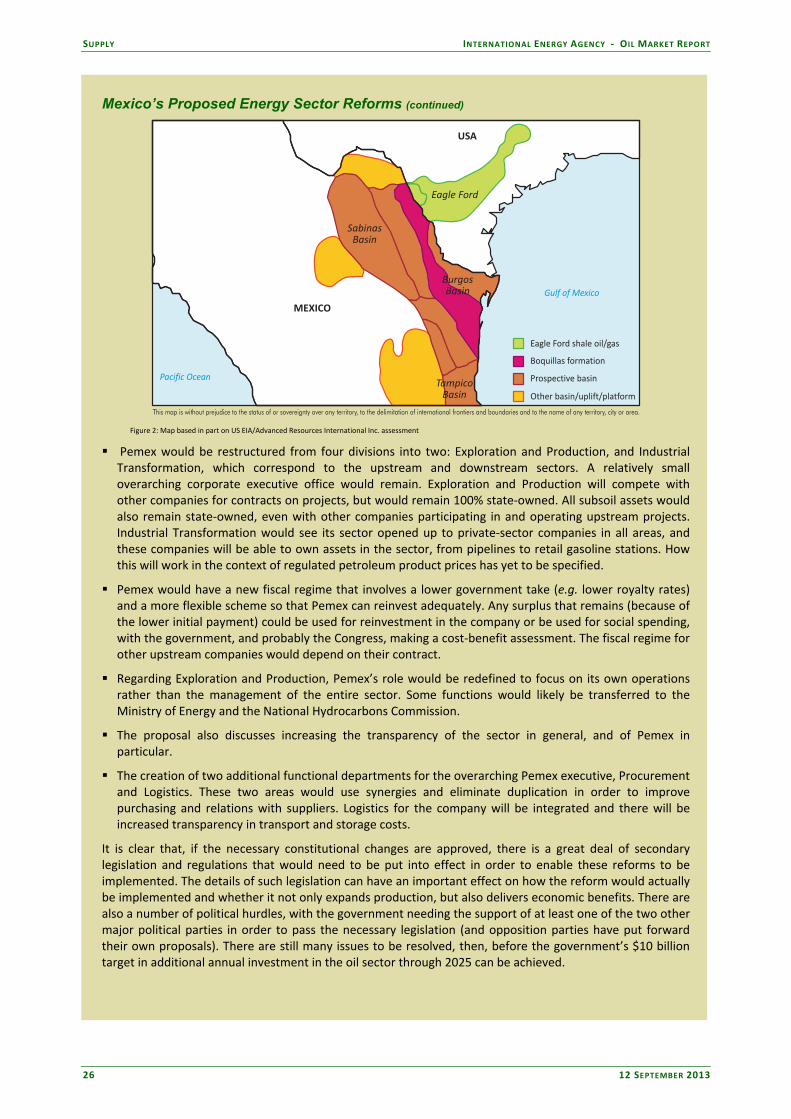
SUPPLY INTERNATIONAL ENERGY AGENCY ‐ OIL MARKET REPORT
26 12 SEPTEMBER 2013
Mexico’s Proposed Energy Sector Reforms (continued)
MEXICO
Gulf of Mexico
Boquillas formation
Pacific Ocean
This map is without prejudice to the status of or sovereignty over any territory, to the delimitation of international frontiers and boundaries and to the name of any territory, city or area.
BurgosBasin
SabinasBasin
USA
Other basin/uplift/platform
TampicoBasin
Eagle Ford
Eagle Ford shale oil/gas
Prospective basin
Figure 2: Map based in part on US EIA/Advanced Resources International Inc. assessment
Pemex would be restructured from four divisions into two: Exploration and Production, and Industrial Transformation, which correspond to the upstream and downstream sectors. A relatively small overarching corporate executive office would remain. Exploration and Production will compete with other companies for contracts on projects, but would remain 100% state‐owned. All subsoil assets would also remain state‐owned, even with other companies participating in and operating upstream projects. Industrial Transformation would see its sector opened up to private‐sector companies in all areas, and these companies will be able to own assets in the sector, from pipelines to retail gasoline stations. How this will work in the context of regulated petroleum product prices has yet to be specified.
Pemex would have a new fiscal regime that involves a lower government take (e.g. lower royalty rates) and a more flexible scheme so that Pemex can reinvest adequately. Any surplus that remains (because of the lower initial payment) could be used for reinvestment in the company or be used for social spending, with the government, and probably the Congress, making a cost‐benefit assessment. The fiscal regime for other upstream companies would depend on their contract.
Regarding Exploration and Production, Pemex’s role would be redefined to focus on its own operations rather than the management of the entire sector. Some functions would likely be transferred to the Ministry of Energy and the National Hydrocarbons Commission.
The proposal also discusses increasing the transparency of the sector in general, and of Pemex in particular.
The creation of two additional functional departments for the overarching Pemex executive, Procurement and Logistics. These two areas would use synergies and eliminate duplication in order to improve purchasing and relations with suppliers. Logistics for the company will be integrated and there will be increased transparency in transport and storage costs.
It is clear that, if the necessary constitutional changes are approved, there is a great deal of secondary legislation and regulations that would need to be put into effect in order to enable these reforms to be implemented. The details of such legislation can have an important effect on how the reform would actually be implemented and whether it not only expands production, but also delivers economic benefits. There are also a number of political hurdles, with the government needing the support of at least one of the two other major political parties in order to pass the necessary legislation (and opposition parties have put forward their own proposals). There are still many issues to be resolved, then, before the government’s $10 billion target in additional annual investment in the oil sector through 2025 can be achieved.

INTERNATIONAL ENERGY AGENCY ‐ OIL MARKET REPORT SUPPLY
12 SEPTEMBER 2013 27
North Sea
Preliminary production figures indicate that Norwegian total liquids production exceeded expectations in July, rising by about 270 kb/d to nearly 2 mb/d as Teeside fields came back online and NGL production reached its highest level since December 2012, at over 310 kb/d. Maintenance – both planned and unplanned – is expected to take August total liquids production back down to 1.5 mb/d, however, including crude oil production of 1.2 mb/d. On the Sleipner‐Frigg system, Marathon shut the Alvheim field for nine days of maintenance, as well as the Vilje and Volund fields feeding into the Alvheim FPSO. Statoil has announced that equipment problems at Troll have not been resolved, affecting mostly gas output, but also NGL and condensate output on Norway’s largest gas field. The Kvitebjorn gas field, another significant producer of NGLs and condensate, remained offline for most of August because of equipment problems when returning from scheduled maintenance that had begun in July. Visund in the Statfjord‐Gullfaks area also had an unplanned outage in August. Hence, 3Q13 total liquids production is forecast at 1.7 mb/d, about 50 kb/d lower than 3Q12, and production for the year is expected to be over 100 kb/d lower y‐o‐y. The UK sector, on the other hand, looks set to decline even faster in percentage terms in 2013. As noted in a recent report by industry association Oil & Gas UK, platforms in the UK offshore oil and gas sector have only been producing about 60% of the time in recent years, compared to 80% of the time in 2004, due to the need for greater maintenance and the increased incidence of unplanned outages. Another important factor affecting output is that when mature fields come back from maintenance or other outages, they take longer on average to ramp up production again. Although new fields are being developed or redeveloped, such as Balloch and Gryphon that came online in May, and Alma now expected for 1Q14, these are comparatively small (10 kb/d, 20 kb/d and 20 kb/d, respectively) and fail to offset steep declines at many mature fields. Alma has been delayed by a quarter. July crude oil production is expected to be about 800 kb/d, a 3% increase on June. However, outages such as a five‐day shutdown of the Forties pipeline at the beginning of August and technical problems that halted production at Huntington, as well as other planned maintenance, indicate lower production for 3Q13, such that total liquids will fall by about 100 kb/d compared with 2Q13, and 20 kb/d below 3Q12, to just under 800 kb/d.
BFOE production is estimated at 720 kb/d for August and 770 kb/d for September. Although loadings in the past have often lagged production levels by a month, lately loadings have more closely matched the same month’s production. However, a number of delays to loading programmes for August and September, and already‐announced revisions to the October schedule, show that initial loading plans are still not always indicative of actual production figures for the month. Scheduled September BFOE loadings have already been revised downward by
60 kb/d. BFOE has remained well below 900 kb/d since June, putting price pressure on the Brent marker.
Non-OECD
Latin America
Brazil – July preliminary: Brazilian crude oil production fell by over 100 kb/d in July, to 1.97 mb/d, falling short of expectations for continued monthly growth. Supplies posted strong growth in June, and Petrobras had indicated that, with a reduction of the maintenance experienced in 1H13 and new units coming online in 4Q13, production remained on track to meet its objective of 2 mb/d total liquids for
500
600
700
800
900
1,000
1,100
May-12 Sep-12 Jan-13 May-13 Sep-13
BFOE Loadings & Production
BFOE loadings* BFOE production*Source: Reuters

SUPPLY INTERNATIONAL ENERGY AGENCY ‐ OIL MARKET REPORT
28 12 SEPTEMBER 2013
2013. (About 93% of Brazilian oil production is operated by Petrobras.) Production declines in July stemmed in part from Marlim Sul, Brazil’s largest oilfield, which declined by 40 kb/d m‐o‐m, as the P‐40 platform had 15 days of scheduled maintenance. A number of other offshore fields had smaller drops. Despite steady output of total liquids in 3Q13 compared with 2Q13’s 2.1 mb/d, we still expect 4Q13 to show strong growth of nearly 150 kb/d. The Cidade de Paraty FPSO in operation on the Lula field is expected to add another 40 kb/d by 4Q13. Other projects to add production include the Papa Terra P‐63 FPSO expected to come online in October and the P‐55 platform on the Roncador field in December. In August, a Canadian company began the first test drills of a shale oil play in Brazil at the onshore Recôncavo basin.
Asia
China – July preliminary: After y‐o‐y 1H13 growth of nearly 90 kb/d, Chinese oil production slumped by 200 kb/d m‐o‐m in July to 4.1 mb/d as a massive flood in Shaanxi affected PetroChina’s (CNPC) Changqing field as well as production from China’s fourth‐largest oil company, Shaanxi Yanchang
Petroleum, which has its base of operations in the province. A major CNPC oil pipeline ruptured as well because of the floods. It is expected that production will show a further drop in August, as major floods in Heilongjiang province affected China’s largest oilfield, Daqing. About 1 300 wells were shut down on the field, and 680 new wells will have their production start delayed. August production is forecast to fall to just under 4.0 mb/d, marking the first time since October 2011 that production has fallen below this level. CNOOC continues to invest in smaller offshore fields such as Weizhou 12‐8W and Wenchang 19‐1N in the Western
South China Sea, and the Suizhong 36‐1 Phase II and Qikou 18‐1 projects in Bohai Bay. These developments, which are expected to come online in 4Q13, will compensate in part for continued declines at mature onshore fields.
Africa
South Sudan: Since last month’s Report, economic and political agreements have been reached between the governments of South Sudan and Sudan (3 September) such that the export pipeline to the Sudanese oil terminal at Port Sudan is expected to remain open and unimpeded. Crude oil production in South Sudan had been cut to about 140 kb/d prior to 3 September agreement in order to protect equipment and reservoirs in anticipation of a possible pipeline closure. South Sudan government ministers have announced that production will quickly ramp up – to 200 kb/d by October and eventually 350 kb/d by the end of 2013. However, given the various rapid shut‐ins for political reasons and other less‐than‐optimal treatment of field reservoirs historically, this target may be overly optimistic in the absence of additional investment. Hence, we are forecasting a more gradual ramp‐up in the coming months. Another positive development for greater oil flows is that the two governments seem to have resolved payment issues, and South Sudan has reported that it has received $300 million from Sudan for crude sales since April. South Sudan, however, continues to explore potential alternative new pipeline export routes through neighbouring countries to the south.
1.80
2.00
2.20
2.40
2.60
Jan Mar May Jul Sep Nov Jan
mb/d Brazil -Total Supply
2011 20122013 2014 forecast2013 forecast
3.8
4.0
4.2
4.4
Jan Mar May Jul Sep Nov Jan
mb/d China Total Supply
2010 20112012 2013 forecast2013

INTERNATIONAL ENERGY AGENCY ‐ OIL MARKET REPORT SUPPLY
12 SEPTEMBER 2013 29
Former Soviet Union
Russia – August preliminary: Total liquids production increased by over 100 kb/d m‐o‐m in August, with much of that increase coming from condensates and NGLs. Crude oil production rose slightly, to about 10.1mb/d, though with the increase in Saudi production in August, Russia has dropped to being the world’s second‐largest crude oil producer for the month. Notable developments in August include a return from maintenance on Sakhalin 1; a return to normal levels of condensate production by Gazprom; the launch of the Trebs field by Bashneft; and a 60 kb/d increase in NGL production as natural gas production increased. Gazprom’s oil unit, Gazprom Neft, has managed to increase production 10 kb/d y‐o‐y despite some mature fields in its portfolio, as fields in the Orenburg region have boosted output. Most large Russian producers are managing to maintain production at remarkably even levels month‐to‐month, and our forecast is for total liquids production to remain at 10.8 mb/d for every quarter of the forecast period. September crude oil production is forecast to dip slightly as Sakhalin 2 undergoes maintenance taking at least 50 kb/d offline. Gazprom is expected to further boost condensate/NGL production next month, and subsidiary Gazprom Neft brought online the Novy Port oil field in the gas‐rich Yamal Peninsula in July.
Looking further ahead, given stagnant production expected for 2014, two projects are underway to attempt to exploit Russia’s very large but nearly untouched shale oil reserves. According to a US government study, Russia’s estimated recoverable shale oil resources of 75 billion barrels are the largest in the world. Russian producers have teamed with foreign companies to bring expertise on shale oil development. Gazprom Neft recently announced first crude flows from a pilot project in its Krasnoleninsky deposit in West Siberia and is studying the shale oil potential of the Verkhne‐Salymskoye field with Royal Dutch Shell. Rosneft is working with ExxonMobil and Norway’s Statoil on another
deposit. The Russian government has announced sizable reductions in the Mineral Extraction Tax on unconventional fields to stimulate production, starting this month, though challenges remain, such as a lack of small risk‐taking companies, geology that is potentially more difficult than North American plays, and a lack of infrastructure and equipment. Kazakhstan – July preliminary: Kazkahstan’s production achieved 1.7 mb/d in July, a 30 kb/d increase over June led by a 45 kb/d rise at Tengiz. Some maintenance is believed to have taken place in August on the Chevron‐operated project, which will lower the country’s output for the month. Hence, 3Q13 production is forecast at 1.6 mb/d. The development of the Kashagan field, one of the world’s largest (13 billion barrels of reserves) but most complex, has long been at the centre of the country’s oil industry. Initially targeted for 2005 but having experienced numerous delays and cost overruns, political and economic pressure to start production is enormous. It is generally considered to be the most expensive oil project ever, with costs over $100 billion. ENI, a shareholder in the operating consortium, announced that production will finally begin this month. As the consortium will lose the right to certain compensation under its agreement with the government if production is not started by 1 October, it will likely achieve at least a low level of production by the deadline, even if at non‐commercial levels initially. An additional indication that production is imminent is that the operating consortium reportedly had reached an agreement to use the Atyrau‐Samara pipeline to export the crude, starting this month. We are forecasting a lower level of production for the first full month, October, than the 75 kb/d indicated by ENI. The consortium plans for Phase 1 to reach design capacity of 370 kb/d by the end of 2014. Given past experience with Kashagan, our forecast remains conservative, at only 10 kb/d for the first month, but may be adjusted depending on production developments. Successful development of Kashagan will be key to the FSU achieving net production growth in 2014, instead of a flat level as is currently forecast.
-100
0
100
200
300
400
500
2009 2010 2011 2012 2013 2014
kb/d Total FSU Supply - Annual Change
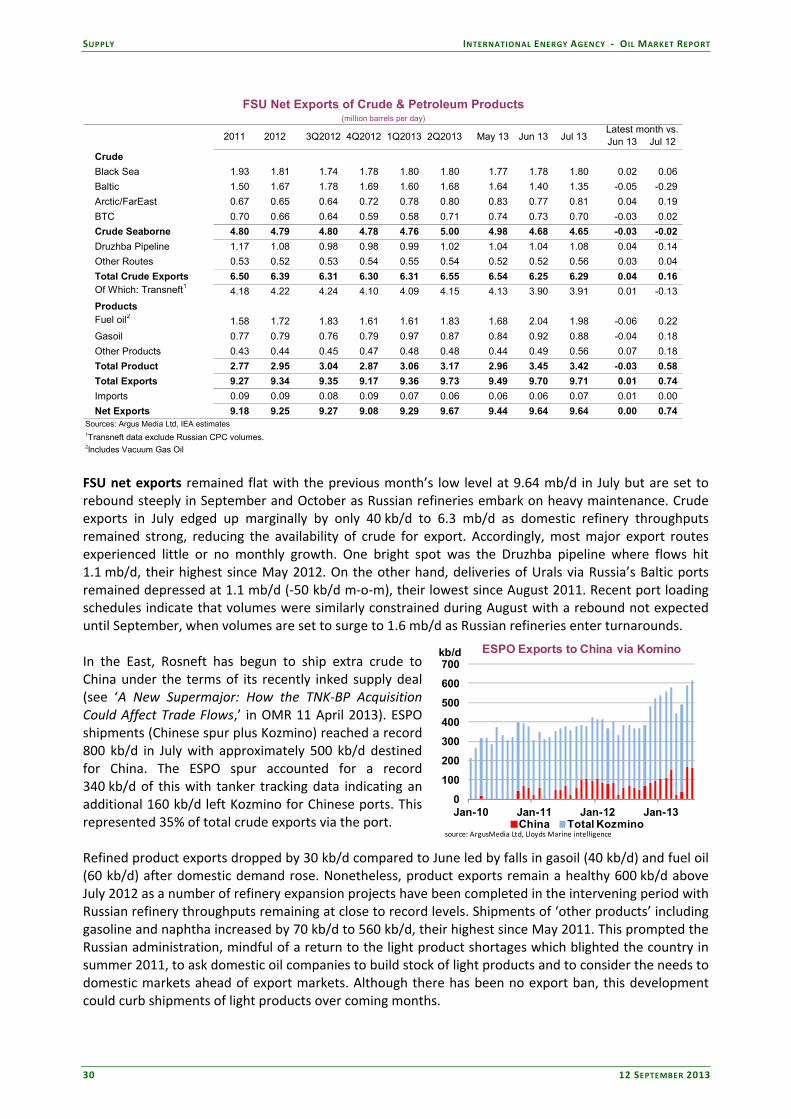
SUPPLY INTERNATIONAL ENERGY AGENCY ‐ OIL MARKET REPORT
30 12 SEPTEMBER 2013
Latest month vs. Jun 13 Jul 12
Crude
Black Sea 1.93 1.81 1.74 1.78 1.80 1.80 1.77 1.78 1.80 0.02 0.06
Baltic 1.50 1.67 1.78 1.69 1.60 1.68 1.64 1.40 1.35 -0.05 -0.29
Arctic/FarEast 0.67 0.65 0.64 0.72 0.78 0.80 0.83 0.77 0.81 0.04 0.19
BTC 0.70 0.66 0.64 0.59 0.58 0.71 0.74 0.73 0.70 -0.03 0.02
Crude Seaborne 4.80 4.79 4.80 4.78 4.76 5.00 4.98 4.68 4.65 -0.03 -0.02
Druzhba Pipeline 1.17 1.08 0.98 0.98 0.99 1.02 1.04 1.04 1.08 0.04 0.14
Other Routes 0.53 0.52 0.53 0.54 0.55 0.54 0.52 0.52 0.56 0.03 0.04
Total Crude Exports 6.50 6.39 6.31 6.30 6.31 6.55 6.54 6.25 6.29 0.04 0.16 Of Which: Transneft1 4.18 4.22 4.24 4.10 4.09 4.15 4.13 3.90 3.91 0.01 -0.13
ProductsFuel oil2 1.58 1.72 1.83 1.61 1.61 1.83 1.68 2.04 1.98 -0.06 0.22
Gasoil 0.77 0.79 0.76 0.79 0.97 0.87 0.84 0.92 0.88 -0.04 0.18
Other Products 0.43 0.44 0.45 0.47 0.48 0.48 0.44 0.49 0.56 0.07 0.18
Total Product 2.77 2.95 3.04 2.87 3.06 3.17 2.96 3.45 3.42 -0.03 0.58
Total Exports 9.27 9.34 9.35 9.17 9.36 9.73 9.49 9.70 9.71 0.01 0.74
Imports 0.09 0.09 0.08 0.09 0.07 0.06 0.06 0.06 0.07 0.01 0.00
Net Exports 9.18 9.25 9.27 9.08 9.29 9.67 9.44 9.64 9.64 0.00 0.74 Sources: Argus Media Ltd, IEA estimates1Transneft data exclude Russian CPC volumes.2Includes Vacuum Gas Oil
Jul 13
FSU Net Exports of Crude & Petroleum Products(million barrels per day)
2011 2012 3Q2012 4Q2012 1Q2013 2Q2013 May 13 Jun 13
FSU net exports remained flat with the previous month’s low level at 9.64 mb/d in July but are set to rebound steeply in September and October as Russian refineries embark on heavy maintenance. Crude exports in July edged up marginally by only 40 kb/d to 6.3 mb/d as domestic refinery throughputs remained strong, reducing the availability of crude for export. Accordingly, most major export routes experienced little or no monthly growth. One bright spot was the Druzhba pipeline where flows hit 1.1 mb/d, their highest since May 2012. On the other hand, deliveries of Urals via Russia’s Baltic ports remained depressed at 1.1 mb/d (‐50 kb/d m‐o‐m), their lowest since August 2011. Recent port loading schedules indicate that volumes were similarly constrained during August with a rebound not expected until September, when volumes are set to surge to 1.6 mb/d as Russian refineries enter turnarounds. In the East, Rosneft has begun to ship extra crude to China under the terms of its recently inked supply deal (see ‘A New Supermajor: How the TNK‐BP Acquisition Could Affect Trade Flows,’ in OMR 11 April 2013). ESPO shipments (Chinese spur plus Kozmino) reached a record 800 kb/d in July with approximately 500 kb/d destined for China. The ESPO spur accounted for a record 340 kb/d of this with tanker tracking data indicating an additional 160 kb/d left Kozmino for Chinese ports. This represented 35% of total crude exports via the port. Refined product exports dropped by 30 kb/d compared to June led by falls in gasoil (40 kb/d) and fuel oil (60 kb/d) after domestic demand rose. Nonetheless, product exports remain a healthy 600 kb/d above July 2012 as a number of refinery expansion projects have been completed in the intervening period with Russian refinery throughputs remaining at close to record levels. Shipments of ‘other products’ including gasoline and naphtha increased by 70 kb/d to 560 kb/d, their highest since May 2011. This prompted the Russian administration, mindful of a return to the light product shortages which blighted the country in summer 2011, to ask domestic oil companies to build stock of light products and to consider the needs to domestic markets ahead of export markets. Although there has been no export ban, this development could curb shipments of light products over coming months.
0
100
200
300
400
500
600
700
Jan-10 Jan-11 Jan-12 Jan-13
kb/d ESPO Exports to China via Komino
China Total Kozminosource: ArgusMedia Ltd, Lloyds Marine intelligence

INTERNATIONAL ENERGY AGENCY ‐ OIL MARKET REPORT OECD STOCKS
12 SEPTEMBER 2013 31
OECD STOCKS
Summary
OECD commercial total oil inventories built by 8.0 mb to stand at 2 659 mb by end‐July. Since this rise was weaker than the five‐year average build for the month, the deficit of OECD holdings to five‐year average levels widened to 65.0 mb, marking the largest deficit since October 2011.
Refined product inventories built seasonally by 23.4 mb to cover 30.7 days of forward demand at end‐July, a rise of 0.6 days on end‐June and 0.2 days above twelve months previous.
Preliminary data suggest that OECD inventories drew by a counter‐seasonal 14.2 mb in August as a stronger‐than‐seasonal 19.3 mb fall in crude oil stocks outweighed a weaker‐than‐seasonal 5.1 mb build in refined products.
Crude stocks at the Cushing, Oklahoma storage hub plunged by a further 5.4 mb in August. Stocks at the terminal now stand at 34.8 mb, their lowest level since February 2012.
-100
-50
0
50
100
Jul 11 Jan 12 Jul 12 Jan 13 Jul 13
mbOECD Industry Total Oil Stocks
Relative to Five-Year Average
Asia Oceania AmericasEurope OECD
900
950
1,000
1,050
Jan Mar May Jul Sep Nov Jan
mbOECD Crude Oil Stocks
Range 2008-2012 Avg 2008-2012
2012 2013
OECD Inventory Position at End-July and Revisions to Preliminary Data
OECD commercial total oil inventories built by 8.0 mb to stand at 2 659 mb by end‐July. Since this rise was weaker than the 21.6 mb five‐year average build for the month, the deficit of OECD holdings to five‐year average levels widened to 65.0 mb, from 51.4 mb at end‐June. The deficit now stands at its widest since October 2011. Total oil stocks rose by 9.8 mb and 5.0 mb in OECD Europe and OECD Asia Oceania, respectively, led by seasonal builds in refined products. Meanwhile in OECD Americas, following six‐year‐high refinery runs, stock builds were tempered by a steep 19.0 mb draw in crude oil and a counter‐seasonal 3.0 mb draw in NGLs and feedstocks holdings. Despite elevated refinery activity, strong seasonal demand and lofty exports tempered regional refined product builds.
Am Europe As. Ocean Total Am Europe As. Ocean Total Am Europe As. Ocean Total
Crude Oil -18.9 8.8 -0.7 -10.9 -0.61 0.28 -0.02 -0.35 -0.20 -0.04 0.01 -0.23
Gasoline 1.4 -3.1 -0.1 -1.8 0.05 -0.10 0.00 -0.06 0.00 -0.08 0.00 -0.09
Middle Distillates 4.1 4.9 5.4 14.4 0.13 0.16 0.18 0.47 0.03 -0.10 -0.03 -0.10
Residual Fuel Oil -0.4 -1.7 1.3 -0.7 -0.01 -0.05 0.04 -0.02 0.00 -0.03 -0.01 -0.03
Other Products 10.1 1.1 0.3 11.5 0.33 0.03 0.01 0.37 0.34 -0.05 -0.02 0.27
Total Products 15.2 1.3 6.9 23.4 0.49 0.04 0.22 0.75 0.37 -0.26 -0.06 0.04
Other Oils1 -3.0 -0.3 -1.3 -4.6 -0.10 -0.01 -0.04 -0.15 0.10 -0.02 0.02 0.10
Total Oil -6.8 9.8 5.0 8.0 -0.22 0.32 0.16 0.26 0.28 -0.33 -0.04 -0.09
1 Other o ils includes NGLs, feedstocks and other hydrocarbons.
(million barrels) (million barrels per day) (million barrels per day)
Preliminary Industry Stock Change in July 2013 and Second Quarter 2013July 2013 (preliminary) Second Quarter 2013
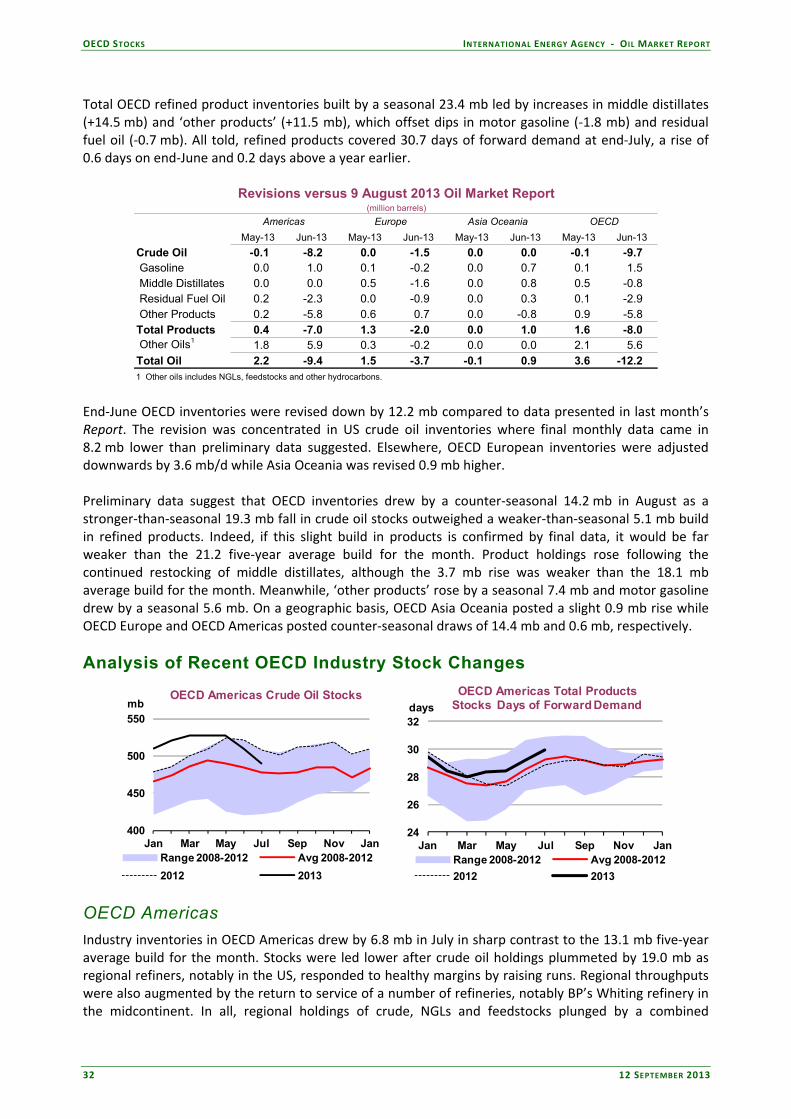
OECD STOCKS INTERNATIONAL ENERGY AGENCY ‐ OIL MARKET REPORT
32 12 SEPTEMBER 2013
Total OECD refined product inventories built by a seasonal 23.4 mb led by increases in middle distillates (+14.5 mb) and ‘other products’ (+11.5 mb), which offset dips in motor gasoline (‐1.8 mb) and residual fuel oil (‐0.7 mb). All told, refined products covered 30.7 days of forward demand at end‐July, a rise of 0.6 days on end‐June and 0.2 days above a year earlier.
(million barrels)
Americas Europe Asia Oceania OECD
May-13 Jun-13 May-13 Jun-13 May-13 Jun-13 May-13 Jun-13
Crude Oil -0.1 -8.2 0.0 -1.5 0.0 0.0 -0.1 -9.7 Gasoline 0.0 1.0 0.1 -0.2 0.0 0.7 0.1 1.5 Middle Distillates 0.0 0.0 0.5 -1.6 0.0 0.8 0.5 -0.8 Residual Fuel Oil 0.2 -2.3 0.0 -0.9 0.0 0.3 0.1 -2.9 Other Products 0.2 -5.8 0.6 0.7 0.0 -0.8 0.9 -5.8 Total Products 0.4 -7.0 1.3 -2.0 0.0 1.0 1.6 -8.0 Other Oils1 1.8 5.9 0.3 -0.2 0.0 0.0 2.1 5.6 Total Oil 2.2 -9.4 1.5 -3.7 -0.1 0.9 3.6 -12.2 1 Other oils includes NGLs, feedstocks and other hydrocarbons.
Revisions versus 9 August 2013 Oil Market Report
End‐June OECD inventories were revised down by 12.2 mb compared to data presented in last month’s Report. The revision was concentrated in US crude oil inventories where final monthly data came in 8.2 mb lower than preliminary data suggested. Elsewhere, OECD European inventories were adjusted downwards by 3.6 mb/d while Asia Oceania was revised 0.9 mb higher. Preliminary data suggest that OECD inventories drew by a counter‐seasonal 14.2 mb in August as a stronger‐than‐seasonal 19.3 mb fall in crude oil stocks outweighed a weaker‐than‐seasonal 5.1 mb build in refined products. Indeed, if this slight build in products is confirmed by final data, it would be far weaker than the 21.2 five‐year average build for the month. Product holdings rose following the continued restocking of middle distillates, although the 3.7 mb rise was weaker than the 18.1 mb average build for the month. Meanwhile, ‘other products’ rose by a seasonal 7.4 mb and motor gasoline drew by a seasonal 5.6 mb. On a geographic basis, OECD Asia Oceania posted a slight 0.9 mb rise while OECD Europe and OECD Americas posted counter‐seasonal draws of 14.4 mb and 0.6 mb, respectively.
Analysis of Recent OECD Industry Stock Changes
400
450
500
550
Jan Mar May Jul Sep Nov Jan
mbOECD Americas Crude Oil Stocks
Range 2008-2012 Avg 2008-2012
2012 2013
24
26
28
30
32
Jan Mar May Jul Sep Nov Jan
days
OECD Americas Total Products Stocks Days of Forward Demand
Range 2008-2012 Avg 2008-2012
2012 2013
OECD Americas
Industry inventories in OECD Americas drew by 6.8 mb in July in sharp contrast to the 13.1 mb five‐year average build for the month. Stocks were led lower after crude oil holdings plummeted by 19.0 mb as regional refiners, notably in the US, responded to healthy margins by raising runs. Regional throughputs were also augmented by the return to service of a number of refineries, notably BP’s Whiting refinery in the midcontinent. In all, regional holdings of crude, NGLs and feedstocks plunged by a combined
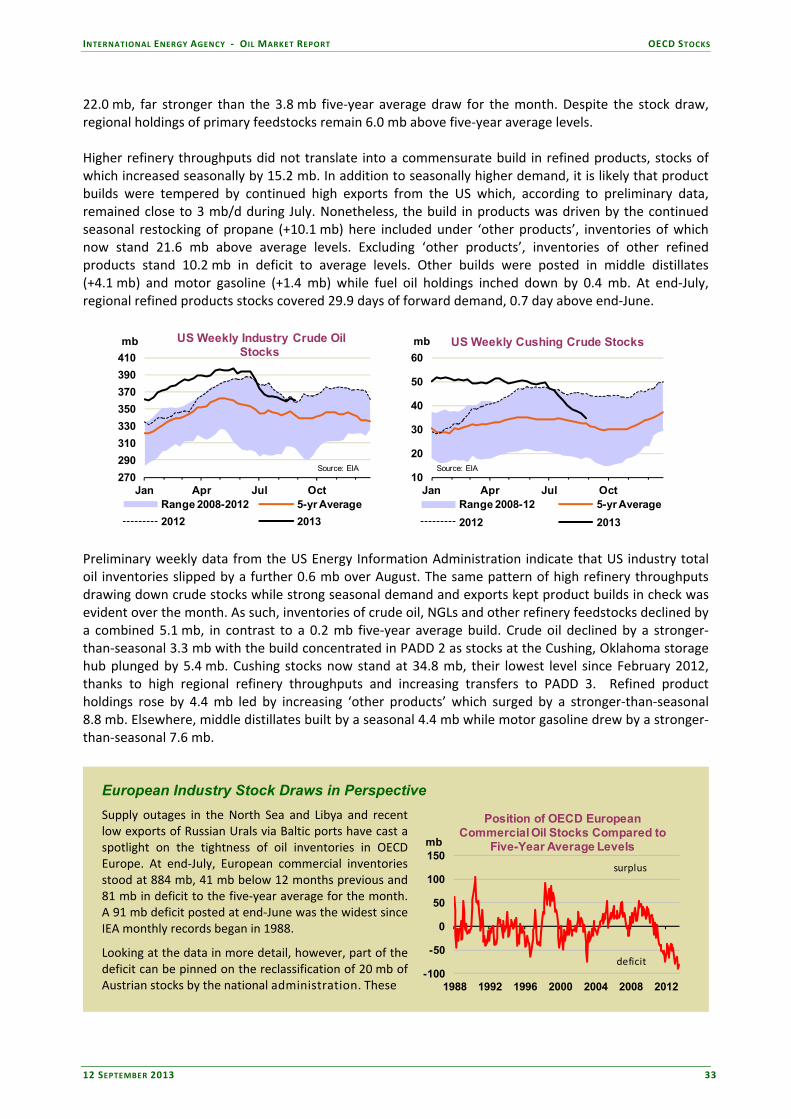
INTERNATIONAL ENERGY AGENCY ‐ OIL MARKET REPORT OECD STOCKS
12 SEPTEMBER 2013 33
22.0 mb, far stronger than the 3.8 mb five‐year average draw for the month. Despite the stock draw, regional holdings of primary feedstocks remain 6.0 mb above five‐year average levels. Higher refinery throughputs did not translate into a commensurate build in refined products, stocks of which increased seasonally by 15.2 mb. In addition to seasonally higher demand, it is likely that product builds were tempered by continued high exports from the US which, according to preliminary data, remained close to 3 mb/d during July. Nonetheless, the build in products was driven by the continued seasonal restocking of propane (+10.1 mb) here included under ‘other products’, inventories of which now stand 21.6 mb above average levels. Excluding ‘other products’, inventories of other refined products stand 10.2 mb in deficit to average levels. Other builds were posted in middle distillates (+4.1 mb) and motor gasoline (+1.4 mb) while fuel oil holdings inched down by 0.4 mb. At end‐July, regional refined products stocks covered 29.9 days of forward demand, 0.7 day above end‐June.
270
290
310
330
350
370
390
410
Jan Apr Jul Oct
mb US Weekly Industry Crude Oil Stocks
Range 2008-2012 5-yr Average
2012 2013
Source: EIA
10
20
30
40
50
60
Jan Apr Jul Oct
mb US Weekly Cushing Crude Stocks
Range 2008-12 5-yr Average
2012 2013
Source: EIA
Preliminary weekly data from the US Energy Information Administration indicate that US industry total oil inventories slipped by a further 0.6 mb over August. The same pattern of high refinery throughputs drawing down crude stocks while strong seasonal demand and exports kept product builds in check was evident over the month. As such, inventories of crude oil, NGLs and other refinery feedstocks declined by a combined 5.1 mb, in contrast to a 0.2 mb five‐year average build. Crude oil declined by a stronger‐than‐seasonal 3.3 mb with the build concentrated in PADD 2 as stocks at the Cushing, Oklahoma storage hub plunged by 5.4 mb. Cushing stocks now stand at 34.8 mb, their lowest level since February 2012, thanks to high regional refinery throughputs and increasing transfers to PADD 3. Refined product holdings rose by 4.4 mb led by increasing ‘other products’ which surged by a stronger‐than‐seasonal 8.8 mb. Elsewhere, middle distillates built by a seasonal 4.4 mb while motor gasoline drew by a stronger‐than‐seasonal 7.6 mb.
European Industry Stock Draws in Perspective
Supply outages in the North Sea and Libya and recent low exports of Russian Urals via Baltic ports have cast a spotlight on the tightness of oil inventories in OECD Europe. At end‐July, European commercial inventories stood at 884 mb, 41 mb below 12 months previous and 81 mb in deficit to the five‐year average for the month. A 91 mb deficit posted at end‐June was the widest since IEA monthly records began in 1988.
Looking at the data in more detail, however, part of the deficit can be pinned on the reclassification of 20 mb of Austrian stocks by the national administration. These
-100
-50
0
50
100
150
1988 1992 1996 2000 2004 2008 2012
mb
Position of OECD European Commercial Oil Stocks Compared to
Five-Year Average Levels
surplus
deficit
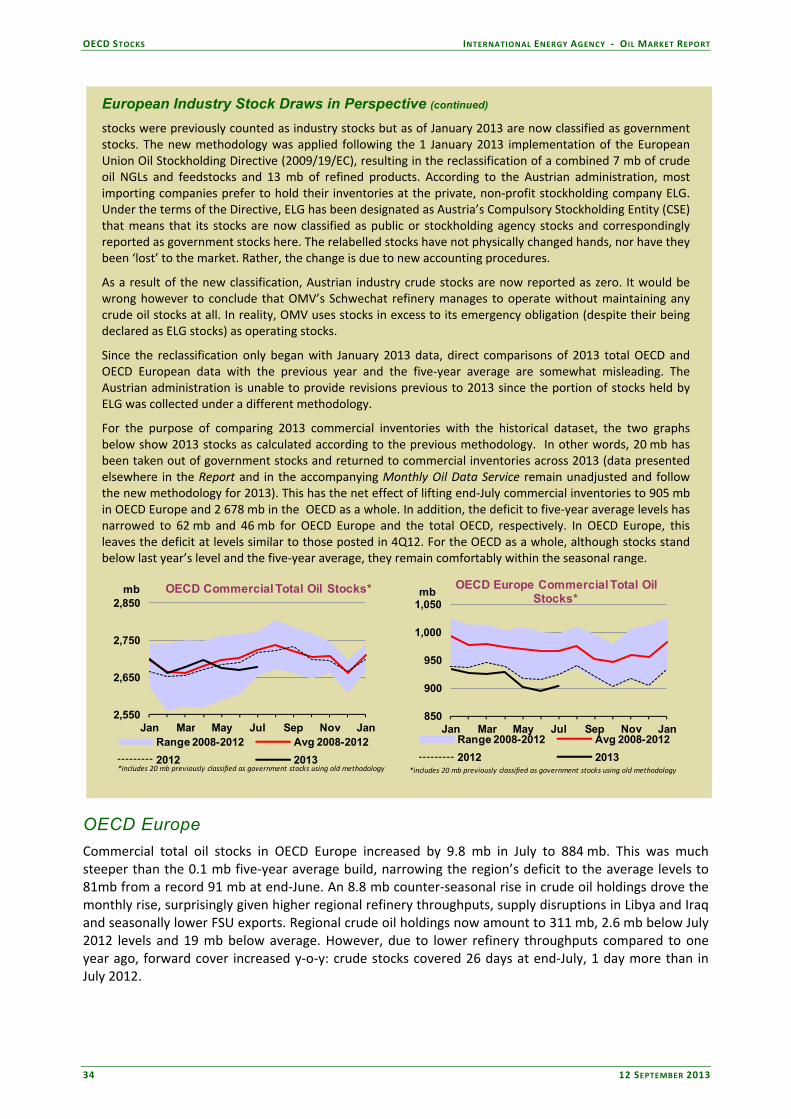
OECD STOCKS INTERNATIONAL ENERGY AGENCY ‐ OIL MARKET REPORT
34 12 SEPTEMBER 2013
European Industry Stock Draws in Perspective (continued)
stocks were previously counted as industry stocks but as of January 2013 are now classified as government stocks. The new methodology was applied following the 1 January 2013 implementation of the European Union Oil Stockholding Directive (2009/19/EC), resulting in the reclassification of a combined 7 mb of crude oil NGLs and feedstocks and 13 mb of refined products. According to the Austrian administration, most importing companies prefer to hold their inventories at the private, non‐profit stockholding company ELG. Under the terms of the Directive, ELG has been designated as Austria’s Compulsory Stockholding Entity (CSE) that means that its stocks are now classified as public or stockholding agency stocks and correspondingly reported as government stocks here. The relabelled stocks have not physically changed hands, nor have they been ‘lost’ to the market. Rather, the change is due to new accounting procedures.
As a result of the new classification, Austrian industry crude stocks are now reported as zero. It would be wrong however to conclude that OMV’s Schwechat refinery manages to operate without maintaining any crude oil stocks at all. In reality, OMV uses stocks in excess to its emergency obligation (despite their being declared as ELG stocks) as operating stocks.
Since the reclassification only began with January 2013 data, direct comparisons of 2013 total OECD and OECD European data with the previous year and the five‐year average are somewhat misleading. The Austrian administration is unable to provide revisions previous to 2013 since the portion of stocks held by ELG was collected under a different methodology.
For the purpose of comparing 2013 commercial inventories with the historical dataset, the two graphs below show 2013 stocks as calculated according to the previous methodology. In other words, 20 mb has been taken out of government stocks and returned to commercial inventories across 2013 (data presented elsewhere in the Report and in the accompanying Monthly Oil Data Service remain unadjusted and follow the new methodology for 2013). This has the net effect of lifting end‐July commercial inventories to 905 mb in OECD Europe and 2 678 mb in the OECD as a whole. In addition, the deficit to five‐year average levels has narrowed to 62 mb and 46 mb for OECD Europe and the total OECD, respectively. In OECD Europe, this leaves the deficit at levels similar to those posted in 4Q12. For the OECD as a whole, although stocks stand below last year’s level and the five‐year average, they remain comfortably within the seasonal range.
2,550
2,650
2,750
2,850
Jan Mar May Jul Sep Nov Jan
mb OECD Commercial Total Oil Stocks*
Range 2008-2012 Avg 2008-2012
2012 2013*includes 20 mb previously classified as government stocks using old methodology
850
900
950
1,000
1,050
Jan Mar May Jul Sep Nov Jan
mbOECD Europe Commercial Total Oil
Stocks*
Range 2008-2012 Avg 2008-2012
2012 2013*includes 20 mb previously classified as government stocks using old methodology
OECD Europe
Commercial total oil stocks in OECD Europe increased by 9.8 mb in July to 884 mb. This was much steeper than the 0.1 mb five‐year average build, narrowing the region’s deficit to the average levels to 81mb from a record 91 mb at end‐June. An 8.8 mb counter‐seasonal rise in crude oil holdings drove the monthly rise, surprisingly given higher regional refinery throughputs, supply disruptions in Libya and Iraq and seasonally lower FSU exports. Regional crude oil holdings now amount to 311 mb, 2.6 mb below July 2012 levels and 19 mb below average. However, due to lower refinery throughputs compared to one year ago, forward cover increased y‐o‐y: crude stocks covered 26 days at end‐July, 1 day more than in July 2012.

INTERNATIONAL ENERGY AGENCY ‐ OIL MARKET REPORT OECD STOCKS
12 SEPTEMBER 2013 35
Refined product holdings built by 1.3 mb on the month, in line with seasonal trends but significantly less than the 4.0 mb five‐year average rise. Due to falling end‐user demand, product inventories now cover 37.7 days, 0.3 day above end‐June and comfortably within the seasonal range. Product builds were tempered by a 3.1 mb dip in motor gasoline holdings, stronger then the 0.4 mb average draw for the month, after transatlantic trade remained healthy, according to anecdotal reports. Despite this monthly draw, at end‐July gasoline inventories covered 43.8 days of forward demand, 1.5 days above the five‐year average. Middle distillates inventories rose by a seasonal 4.9 mb, while in Germany consumers continued their summer refilling of heating oil residential tanks, lifting fill rates by two percentage points to 57% by early July.
290
300
310
320
330
340
350
360
Jan Mar May Jul Sep Nov Jan
mbOECD Europe Crude Oil Stocks
Range 2008-2012 Avg 2008-2012
2012 2013
35
37
39
41
43
Jan Mar May Jul Sep Nov Jan
days
OECD Europe Total Products Stocks Days of Forward Demand
Range 2008-2012 Avg 2008-2012
2012 2013 Preliminary data from Euroilstock indicate that stocks dropped by a counter‐seasonal 14.4 mb in August with all oil categories except motor gasoline posting draws. Crude oil fell by 7.0 mb, far stronger than the 0.6 mb average draw for the month while refined products fell by a combined 7.4 mb, in sharp contrast to the five‐year average 10.7 mb build for August. Middle distillates holdings plummeted by 7.1 mb compared to the 9.1 mb five‐year average build. Meanwhile, stocks of fuel oil and ‘other products’ slipped by 0.3 mb and 1.3 mb, respectively. Data pertaining to refined products held in independent storage in Northwest Europe suggest that stocks built during August with all product categories rising except naphtha.
OECD Asia Oceania
17
19
21
23
25
Jan Mar May Jul Sep Nov Jan
days
OECD Asia Oceania Total Products Stocks Days of Forward Demand
Range 2008-2012 Avg 2008-2012
2012 2013
80
85
90
95
100
105
110
115
120
Jan Apr Jul Oct
mb/dJapan Weekly Crude Stocks
Range 2008-12 5-yr Average2012 2013
Source: PAJ
Commercial inventories in OECD Asia Oceania (excluding Israel) followed a similar pattern to Europe as their seasonal restocking began in July. Total oil stocks built by 5.0 mb, leaving the region at a slight 0.8 mb deficit to the five‐year average. A 6.9 mb build in refined products pushed total stocks upwards as middle distillates, residual fuel oil and ‘other products’ rose by 5.4 mb, 1.3 mb and 0.3 mb, respectively, while motor gasoline retreated by 0.1 mb. Indeed, this underlying trend was evident across Japan and

OECD STOCKS INTERNATIONAL ENERGY AGENCY ‐ OIL MARKET REPORT
36 12 SEPTEMBER 2013
South Korea where all product categories increased except motor gasoline. All told, regional refined products now cover 21.4 days of forward demand, 0.9 days above end‐June and comfortably inside the seasonal range. Meanwhile, crude oil slipped by an unseasonal 0.7 mb with the draw concentrated in Japan (‐3.1 mb). Despite a monthly rise in crude imports, it is likely that these were outpaced by a 280 kb/d surge in refinery runs. However, it is also probable that crude stocks were run down at the 140 kb/d Sakaide refinery ahead of its permanent early‐August closure. Preliminary weekly data from the Petroleum Association of Japan (PAJ) indicate that total oil inventories there inched up by 0.9 mb by end‐August. However, this obscured the fact that crude stocks drew steadily over the month so that by end‐month they were 9 mb lower compared with end‐June. If confirmed by final data this would be the steepest draw since monthly reporting began in 1988. As in July, it is likely that this draw can be partly explained by the shuttering of the Sakaide refinery as its final stocks were likely drawn. Despite this closure, Japanese refinery runs remain high, increasing by 140 kb/d m‐o‐m in August. The increased refinery activity translated into a seasonal 8.1 mb build in refined products. All categories rose bar ‘other products’ (‐0.1 mb). Notable increases were posted for middle distillates (+6.4 mb) and residual fuel oil (+1.2 mb).
Recent Developments in Singapore and China Stocks
According to weekly data from International Enterprise, land‐based refined product inventories in Singapore increased by 6.1 mb in August, their largest monthly build in four years. A 2.8 mb hike in residual fuel oil stocks led the gains as demand for bunker fuels reportedly remained weak while arbitrage brought product into the region from the Atlantic Basin. By end‐month stocks remained 3.6 mb and 5.0 mb above the five‐year average and last year’s level, respectively. After starting the month below the seasonal range, light distillates surged by 1.6 mb over the month to stand comfortably above average levels by month‐end as cargoes were drawn in from Taiwan, India and the UAE while Southeast Asian demand remained relatively weak.
20
30
40
50
60
Jan Apr Jul Oct
mbSingapore Weekly Total Product
Stocks
Range 2008-2012 5-yr Average
2012 2013
Source: International Enterprise
(15)
(10)
(5)
0
5
10
15
Jul 12 Oct 12 Jan 13 Apr 13 Jul 13
mb China Monthly Oil Stock Change*
Crude Gasoline Gasoil Kerosene
*Since August 2010, COGP only reports percentage stock change
Source: China Oil, Gas & Petrochemicals
Data from China Oil Gas and Petrochemicals (China OGP) point to an 11.0 mb decrease in Chinese industry inventories in July (data are reported in terms of percentage stock change). Crude oil inventories declined by 1.6 % (3.5 mb) after refinery throughputs outpaced record crude oil imports (5.97 mb/d) while crude production was hit by flooding at the Changqing field (see Supply). Stocks of refined products fell by a combined 7.5 mb as motor gasoline, diesel and kerosene holdings drew by an equivalent 4.7 mb, 2.4 mb and 0.5 mb, respectively.
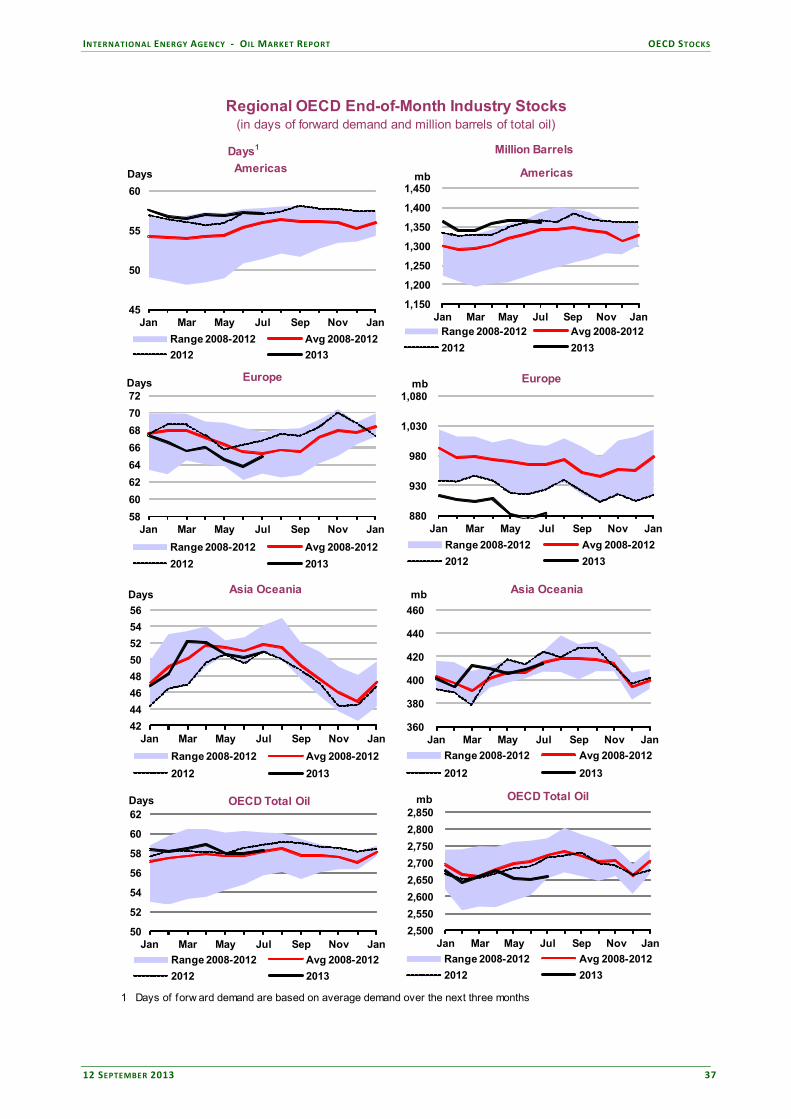
INTERNATIONAL ENERGY AGENCY ‐ OIL MARKET REPORT OECD STOCKS
12 SEPTEMBER 2013 37
1 Days of forw ard demand are based on average demand over the next three months
Days1 Million Barrels
Regional OECD End-of-Month Industry Stocks(in days of forward demand and million barrels of total oil)
50
52
54
56
58
60
62
Jan Mar May Jul Sep Nov Jan
Days OECD Total Oil
Range 2008-2012 Avg 2008-2012
2012 2013
45
50
55
60
Jan Mar May Jul Sep Nov Jan
Days Americas
Range 2008-2012 Avg 2008-2012
2012 2013
58
60
62
64
66
68
70
72
Jan Mar May Jul Sep Nov Jan
Days Europe
Range 2008-2012 Avg 2008-2012
2012 2013
42
44
46
48
50
52
54
56
Jan Mar May Jul Sep Nov Jan
Days Asia Oceania
Range 2008-2012 Avg 2008-2012
2012 2013
1,150
1,200
1,250
1,300
1,350
1,400
1,450
Jan Mar May Jul Sep Nov Jan
mb Americas
Range 2008-2012 Avg 2008-2012
2012 2013
880
930
980
1,030
1,080
Jan Mar May Jul Sep Nov Jan
mb Europe
Range 2008-2012 Avg 2008-2012
2012 2013
360
380
400
420
440
460
Jan Mar May Jul Sep Nov Jan
mb Asia Oceania
Range 2008-2012 Avg 2008-2012
2012 2013
2,500
2,550
2,600
2,650
2,700
2,750
2,800
2,850
Jan Mar May Jul Sep Nov Jan
mb OECD Total Oil
Range 2008-2012 Avg 2008-2012
2012 2013

PRICES INTERNATIONAL ENERGY AGENCY ‐ OIL MARKET REPORT
38 12 SEPTEMBER 2013
PRICES
Summary
Oil futures escalated in tandem with rising geopolitical tensions over Syria’s suspected use of chemical weapons on civilians at end August. Markets were further supported by the near total shut‐in of Libyan crude oil fields, terminals and refineries by striking industry workers, security guards and tribal militias. By 9 September crude oil prices reversed course after Russia’s proposal for Syria to surrender its chemical weapons gained traction in western capitals, with Brent last trading at around $111.60/bbl and WTI at $107.50/bbl.
Refiners looking for replacement barrels in the wake of supply shortfalls from Libya, the North Sea and Russia, among other countries, bid prompt prices to relatively lofty levels. The Brent M1‐M2 futures contract widened to $1.65/bbl in early September compared with around $1.20/bbl in August and just $0.80/bbl in July.
Spot product crack spreads posted diverging trends in August, with the US partially insulated from the recent surge in crude prices, which compressed crack spreads in Asia and Europe. Gasoline crack spreads fell in all major regions as summer peak demand ended, particularly in Asia and in the US.
Freight rates for very large crude carriers (VLCCs) experienced another lacklustre month in August as ample tonnage weighed heavily on markets. Furthermore, vessel earnings fell into negative territory as bunker costs surged in line with soaring benchmark crude prices.
80
85
90
95
100
105
110
115
120
Aug 12 Nov 12 Feb 13 May 13 Aug 13
$/bblCrude Futures
Front Month Close
NYMEX WTI ICE Brent
Source: ICE, NYMEX
98100102104106108110112114116118
M1 2 3 4 5 6 7 8 9 10 11 12
$/bblICE Brent
Forward Price Curve
10 Sep 12 11 Jul 1308 Aug 13 10 Sep 13
Source: ICE
Market Overview
Oil futures escalated in tandem with rising geopolitical tensions over Syria’s suspected use of chemical weapons on civilians at end August. Markets were further supported by the near total shut‐in of Libyan crude oil production by striking industry workers, facility guards and warring militias. Brent futures peaked at a six‐month high of around $117/bbl on 28 August, while WTI rose just over $110.50/bbl the same day. Prices turned lower on 9 September after Russia’s proposal for Syria to surrender its chemical weapons gained traction in western capitals, with Brent last trading at around $111.60/bbl, or down about $5/bbl from its August peak. WTI posted similar declines, and was last quoted at $107.50/bbl. A western military strike against Syria, if it were to occur, would have no direct impact on physical crude oil supplies but the threat of an action has sparked market fears that the conflict will spread in the region. While Syrian crude production has fallen to around 50 kb/d for some time, market attention is focussed on the potential for the Syrian conflict to spread to neighbouring producing countries, such as Iraq, or to disrupt oil flows to the Mediterranean via key transit country Turkey.

INTERNATIONAL ENERGY AGENCY ‐ OIL MARKET REPORT PRICES
12 SEPTEMBER 2013 39
The conflict in Syria has already had a knock‐on effect in Iraq, where violence has escalated to the highest level in five years as sectarian fault lines deepen. Prime Minister Nuri al‐Maliki’s government is largely viewed as aligned with President Assad’s regime while Sunni opposition leaders in Iraq are widely assumed to sympathise with Syrian rebels. Echoing the fears of many, the outgoing UN envoy to Iraq told the Security Council that Syria’s civil war has already spilled over into Iraq, saying that “the battlefields are merging” into one conflict, which could destabilize the broader Middle East. Iraqi insurgents have repeatedly attacked the northern Kirkuk‐Ceyhan pipeline, which runs to the Mediterranean port of Ceyhan, Turkey. This has caused exports from Northern Iraq to fall to five‐year lows of under 200 kb/d in July and August, compared with previous levels of close to 400 kb/d.
90
95
100
105
110
M1 2 3 4 5 6 7 8 9 10 11 12
$/bbl NYMEX WTI Forward Price Curve
10 Sep 13 11 Jul 1308 Aug 13 11 Jun 13
Source: NYMEX
1000
1100
1200
1300
1400
1500
1600
1700
70
80
90
100
110
120
Jan 12 May 12 Sep 12 Jan 13 May 13 Sep 13
IndexUS$/bbl NYMEX WTI vs S&P 500
NYMEX WTI S&P 500 (RHS)
Source: NYMEX
Markets were also on edge at the end of August after a failed attack on a container ship in the Suez Canal, a key transit corridor for crude oil and products between the Mediterranean and the Red Sea. The ongoing political and civil unrest in Egypt has rattled markets but there have been no direct threats to the Suez Canal or SUMED pipeline oil flows, which carry a combined 3.9 mb/d of crude and products. The Egyptian army said it will guarantee the safety of the canal and pipeline. While the focus of the mainstream news has been on Syria, actual, severe disruptions have curtailed Libyan supplies. Libya’s production hit a post‐war low of 150 kb/d in early September compared with 550 kb/d on average in August and 1 mb/d in July amid crippling labour disputes, civil unrest and political turmoil. The government has set up a crisis committee tasked with negotiating a settlement among the various striking workers and tribal militias in a bid to get the oil sector functioning again but to date there has been little progress (see OPEC Supply, ‘Libyan Oil Supplies Cascade Lower’).
-1.0
-0.5
0.0
0.5
1.0
1.5
2.0
Aug 12 Nov 12 Feb 13 May 13 Aug 13
$/bbl Crude FuturesFront Month Spreads
WTI M1-M2 Brent M1-M2
Contango
Source: ICE, NYMEX
-4
0
4
8
12
16
Aug 12 Nov 12 Feb 13 May 13 Aug 13
$/bblCrude Futures
Forward Spreads
WTI M1-M12 Brent M1-M12
Source: ICE, NYMEXBackwardation
Despite supply disruptions and heightened tensions in the Middle East and North Africa, from a supply perspective oil markets nonetheless still appear adequately supplied. Saudi Arabia ramped up production to a 32‐year high of 10.19 mb/d in August. Despite a m‐o‐m decline of 510 kb/d in non‐OPEC supply in August, 3Q13 non‐OPEC supply is expected to be up by 1.65 mb/d y‐o‐y. OECD stocks are currently above

PRICES INTERNATIONAL ENERGY AGENCY ‐ OIL MARKET REPORT
40 12 SEPTEMBER 2013
year ago levels and refinery activity is trending lower due to seasonal maintenance, tempering refiner demand for crude. After hitting a seasonal peak in July, global refinery crude demand is set to fall sharply through October with the onset of scheduled maintenance. The supply outages and the threat Western strikes on Syria propelled prompt prices higher. The Brent M1‐M2 futures contract widened to $1.65/bbl in early September compared with around $1.20/bbl in August, $0.80/bbl in July and just $0.25/bbl in June. Signalling market expectations of looser markets further out, the Brent M1‐M12 also widened further in early September, to near $11/bbl compared with $7.55/bbl in August and $6.15/bbl in July. As expected, the loss of Libya’s light, low‐sulphur crude has also had a significant impact on spot prices for competing grades.
Jun Jul Aug Aug-Jul % Week Commencing:Avg Chg Chg 12 Aug 19 Aug 26 Aug 02 Sep 09 Sep**
NYMEX
Light Sw eet Crude Oil 95.80 104.70 106.54 1.84 1.7 106.92 105.47 108.30 108.67 108.70
RBOB 118.16 126.20 124.55 -1.65 -1.3 124.17 124.07 127.39 119.90 117.40
No.2 Heating Oil 121.37 126.64 129.01 2.37 1.8 128.28 129.29 132.49 132.18 130.86
No.2 Heating Oil ($/mmbtu) 21.41 22.34 22.75 0.42 1.8 22.62 22.80 23.37 23.31 23.08
Henry Hub Natural Gas ($/mmbtu) 3.81 3.64 3.41 -0.23 -6.7 3.35 3.48 3.56 3.61 3.57
ICE
Brent 103.34 107.43 110.45 3.02 2.7 110.10 110.16 114.17 115.26 113.69
Gasoil 117.20 122.37 125.32 2.95 2.4 124.46 126.11 129.40 129.24 128.29
Prompt Month Differentials
NYMEX WTI - ICE Brent -7.54 -2.73 -3.91 -1.18 -3.18 -4.69 -5.87 -6.59 -4.99
NYMEX No.2 Heating Oil - WTI 25.57 21.94 22.47 0.53 21.36 23.82 24.19 23.51 22.16
NYMEX RBOB - WTI 22.36 21.50 18.01 -3.49 17.25 18.60 19.09 11.23 8.70
NYMEX 3-2-1 Crack (RBOB) 23.43 21.65 19.50 -2.15 18.62 20.34 20.79 15.32 13.19
NYMEX No.2 - Natural Gas ($/mmbtu) 17.60 18.69 19.34 0.65 19.28 19.32 19.80 19.70 19.51
ICE Gasoil - ICE Brent 13.86 14.94 14.87 -0.07 14.36 15.95 15.23 13.98 14.60
Source: ICE, NYM EX **Includes prices through 10 September
Prompt Month Oil Futures Prices(monthly and weekly averages, $ /bbl)
Futures Markets
ICE Brent hedge funds posted record net‐long positions between 30 July and 3 September as prices surged to 117/bbl in intra‐day trade, in line with rising tensions surrounding Syria. By contrast, NYMEX WTI money managers net‐long positions were down 13% on the month as the Cushing benchmark traded in a narrower range, albeit showing some signals of strength in early September.
-500-400-300-200-100
0100200300400500
104
106
108
110
112
114
116
03 Sep20 Aug06 Aug23 Jul
'000 contracts $/bbl
Net positions in ICE Brent Futures
Producers Swap DealersMoney Managers Others ReportableNon-Reportable ICE Brent
Source: ICE
-600
-400
-200
0
200
400
600
103
104
105
106
107
108
109
03 Sep20 Aug06 Aug23 Jul
'000contracts $/bbl
Net positions in WTI Futures
Producers Swap DealersMoney Managers OthersNon-Reportable WTI - Mth1
Source: CFTC, NYMEX
On the products side, New York hedge funds cautiously reduced their long exposures in RBOB gasoline while they increased Heating Oil by 17%, as prices steadily inched up during the month. Money managers
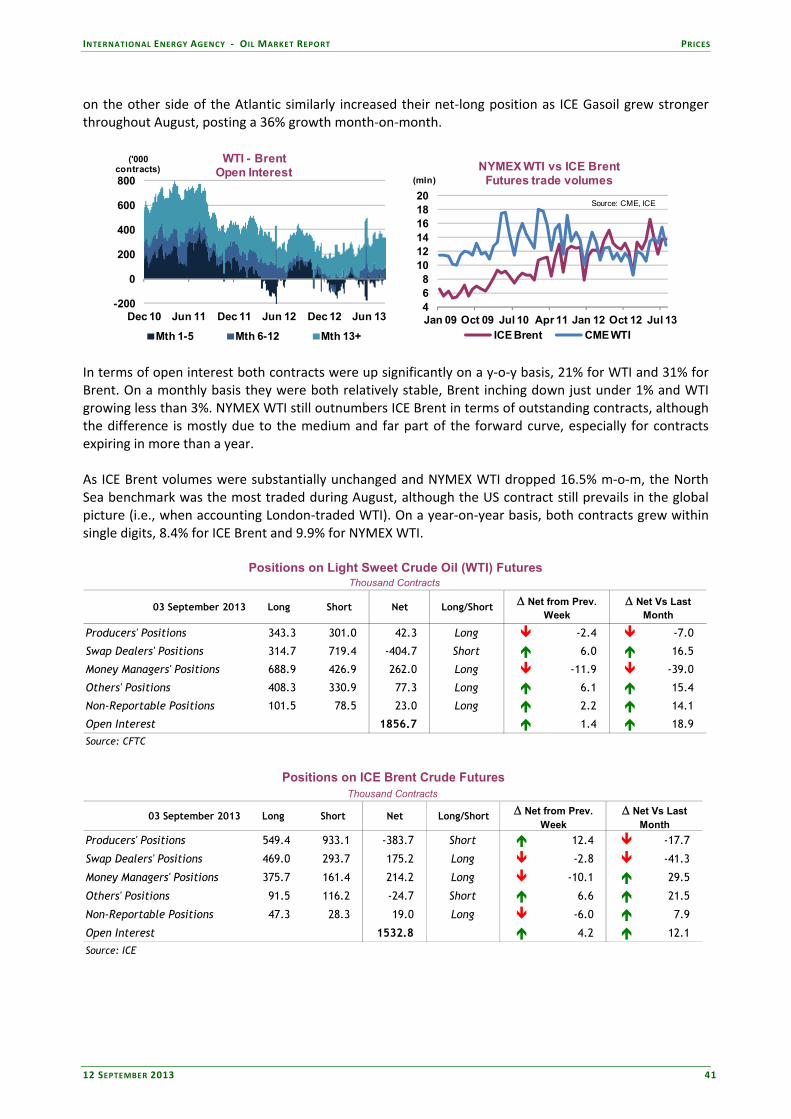
INTERNATIONAL ENERGY AGENCY ‐ OIL MARKET REPORT PRICES
12 SEPTEMBER 2013 41
on the other side of the Atlantic similarly increased their net‐long position as ICE Gasoil grew stronger throughout August, posting a 36% growth month‐on‐month.
-200
0
200
400
600
800
Dec 10 Jun 11 Dec 11 Jun 12 Dec 12 Jun 13
('000 contracts)
WTI - BrentOpen Interest
Mth 1-5 Mth 6-12 Mth 13+
468
101214161820
Jan 09 Oct 09 Jul 10 Apr 11 Jan 12 Oct 12 Jul 13
(mln)
NYMEX WTI vs ICE BrentFutures trade volumes
ICE Brent CME WTI
Source: CME, ICE
In terms of open interest both contracts were up significantly on a y‐o‐y basis, 21% for WTI and 31% for Brent. On a monthly basis they were both relatively stable, Brent inching down just under 1% and WTI growing less than 3%. NYMEX WTI still outnumbers ICE Brent in terms of outstanding contracts, although the difference is mostly due to the medium and far part of the forward curve, especially for contracts expiring in more than a year. As ICE Brent volumes were substantially unchanged and NYMEX WTI dropped 16.5% m‐o‐m, the North Sea benchmark was the most traded during August, although the US contract still prevails in the global picture (i.e., when accounting London‐traded WTI). On a year‐on‐year basis, both contracts grew within single digits, 8.4% for ICE Brent and 9.9% for NYMEX WTI.
03 September 2013 Long Short Net Long/Short Net from Prev. Week
Net Vs Last Month
Producers' Positions 343.3 301.0 42.3 Long -2.4 -7.0
Swap Dealers' Positions 314.7 719.4 -404.7 Short 6.0 16.5
Money Managers' Positions 688.9 426.9 262.0 Long -11.9 -39.0
Others' Positions 408.3 330.9 77.3 Long 6.1 15.4
Non-Reportable Positions 101.5 78.5 23.0 Long 2.2 14.1
Open Interest 1856.7 1.4 18.9
Source: CFTC
Thousand Contracts
Positions on Light Sweet Crude Oil (WTI) Futures
03 September 2013 Long Short Net Long/Short Net from Prev. Week
Net Vs Last Month
Producers' Positions 549.4 933.1 -383.7 Short 12.4 -17.7
Swap Dealers' Positions 469.0 293.7 175.2 Long -2.8 -41.3
Money Managers' Positions 375.7 161.4 214.2 Long -10.1 29.5
Others' Positions 91.5 116.2 -24.7 Short 6.6 21.5
Non-Reportable Positions 47.3 28.3 19.0 Long -6.0 7.9
Open Interest 1532.8 4.2 12.1
Source: ICE
Positions on ICE Brent Crude FuturesThousand Contracts
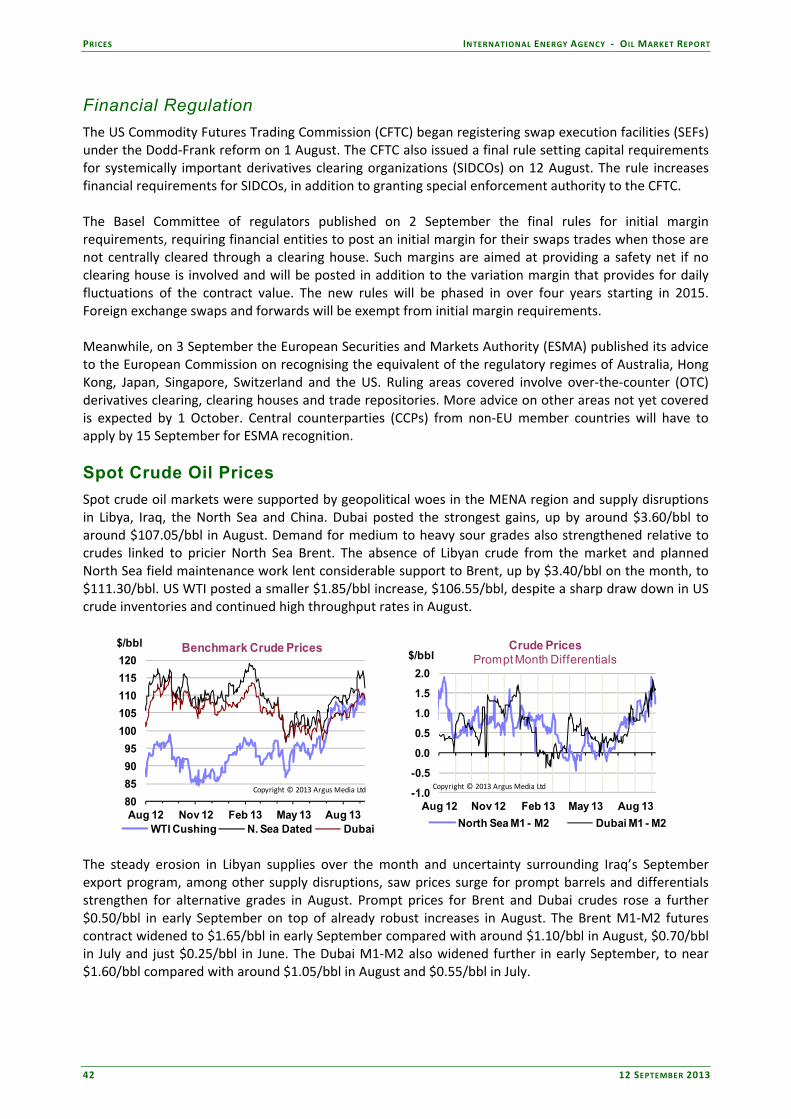
PRICES INTERNATIONAL ENERGY AGENCY ‐ OIL MARKET REPORT
42 12 SEPTEMBER 2013
Financial Regulation
The US Commodity Futures Trading Commission (CFTC) began registering swap execution facilities (SEFs) under the Dodd‐Frank reform on 1 August. The CFTC also issued a final rule setting capital requirements for systemically important derivatives clearing organizations (SIDCOs) on 12 August. The rule increases financial requirements for SIDCOs, in addition to granting special enforcement authority to the CFTC. The Basel Committee of regulators published on 2 September the final rules for initial margin requirements, requiring financial entities to post an initial margin for their swaps trades when those are not centrally cleared through a clearing house. Such margins are aimed at providing a safety net if no clearing house is involved and will be posted in addition to the variation margin that provides for daily fluctuations of the contract value. The new rules will be phased in over four years starting in 2015. Foreign exchange swaps and forwards will be exempt from initial margin requirements. Meanwhile, on 3 September the European Securities and Markets Authority (ESMA) published its advice to the European Commission on recognising the equivalent of the regulatory regimes of Australia, Hong Kong, Japan, Singapore, Switzerland and the US. Ruling areas covered involve over‐the‐counter (OTC) derivatives clearing, clearing houses and trade repositories. More advice on other areas not yet covered is expected by 1 October. Central counterparties (CCPs) from non‐EU member countries will have to apply by 15 September for ESMA recognition.
Spot Crude Oil Prices
Spot crude oil markets were supported by geopolitical woes in the MENA region and supply disruptions in Libya, Iraq, the North Sea and China. Dubai posted the strongest gains, up by around $3.60/bbl to around $107.05/bbl in August. Demand for medium to heavy sour grades also strengthened relative to crudes linked to pricier North Sea Brent. The absence of Libyan crude from the market and planned North Sea field maintenance work lent considerable support to Brent, up by $3.40/bbl on the month, to $111.30/bbl. US WTI posted a smaller $1.85/bbl increase, $106.55/bbl, despite a sharp draw down in US crude inventories and continued high throughput rates in August.
80
85
90
95
100
105
110
115
120
Aug 12 Nov 12 Feb 13 May 13 Aug 13
$/bbl Benchmark Crude Prices
WTI Cushing N. Sea Dated Dubai
Copyright © 2013 Argus Media Ltd
-1.0
-0.5
0.0
0.5
1.0
1.5
2.0
Aug 12 Nov 12 Feb 13 May 13 Aug 13
$/bblCrude Prices
Prompt Month Differentials
North Sea M1 - M2 Dubai M1 - M2
Copyright © 2013 Argus Media Ltd
The steady erosion in Libyan supplies over the month and uncertainty surrounding Iraq’s September export program, among other supply disruptions, saw prices surge for prompt barrels and differentials strengthen for alternative grades in August. Prompt prices for Brent and Dubai crudes rose a further $0.50/bbl in early September on top of already robust increases in August. The Brent M1‐M2 futures contract widened to $1.65/bbl in early September compared with around $1.10/bbl in August, $0.70/bbl in July and just $0.25/bbl in June. The Dubai M1‐M2 also widened further in early September, to near $1.60/bbl compared with around $1.05/bbl in August and $0.55/bbl in July.
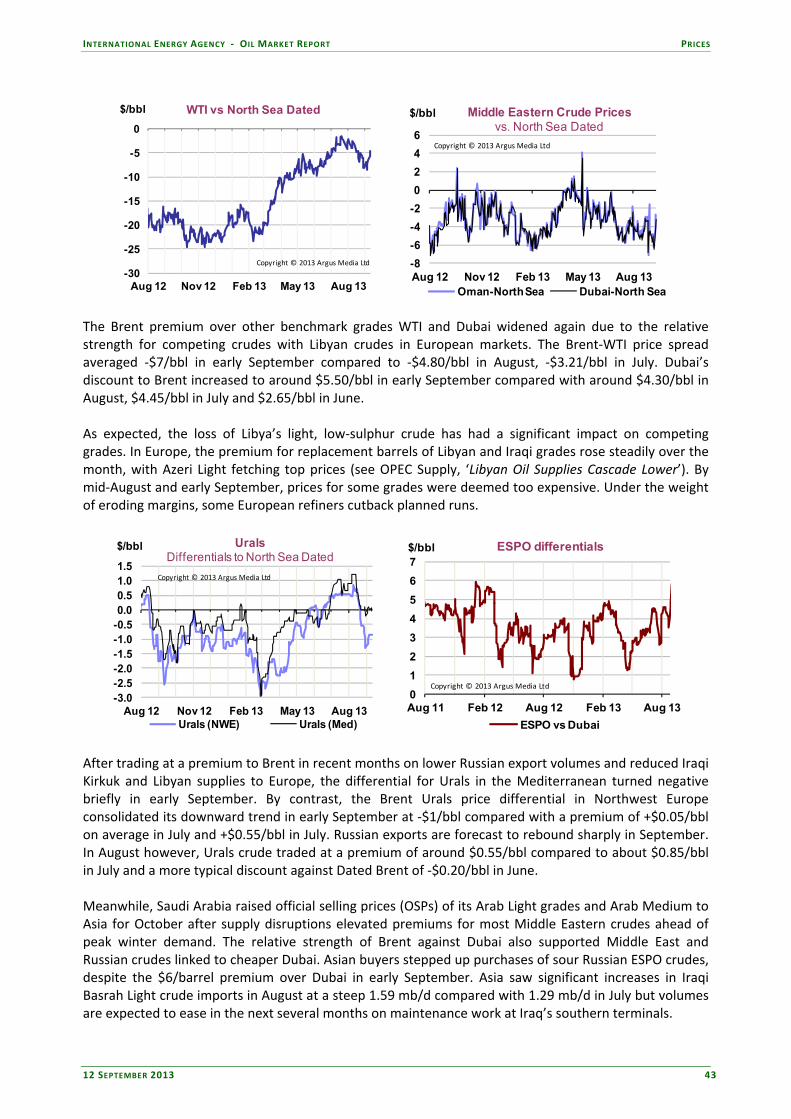
INTERNATIONAL ENERGY AGENCY ‐ OIL MARKET REPORT PRICES
12 SEPTEMBER 2013 43
-30
-25
-20
-15
-10
-5
0
Aug 12 Nov 12 Feb 13 May 13 Aug 13
$/bbl WTI vs North Sea Dated
Copyright © 2013 Argus Media Ltd
-8
-6
-4
-2
0
2
4
6
Aug 12 Nov 12 Feb 13 May 13 Aug 13
$/bbl Middle Eastern Crude Pricesvs. North Sea Dated
Oman-North Sea Dubai-North Sea
Copyright © 2013 Argus Media Ltd
The Brent premium over other benchmark grades WTI and Dubai widened again due to the relative strength for competing crudes with Libyan crudes in European markets. The Brent‐WTI price spread averaged ‐$7/bbl in early September compared to ‐$4.80/bbl in August, ‐$3.21/bbl in July. Dubai’s discount to Brent increased to around $5.50/bbl in early September compared with around $4.30/bbl in August, $4.45/bbl in July and $2.65/bbl in June. As expected, the loss of Libya’s light, low‐sulphur crude has had a significant impact on competing grades. In Europe, the premium for replacement barrels of Libyan and Iraqi grades rose steadily over the month, with Azeri Light fetching top prices (see OPEC Supply, ‘Libyan Oil Supplies Cascade Lower’). By mid‐August and early September, prices for some grades were deemed too expensive. Under the weight of eroding margins, some European refiners cutback planned runs.
-3.0-2.5-2.0-1.5-1.0-0.50.00.51.01.5
Aug 12 Nov 12 Feb 13 May 13 Aug 13
$/bbl UralsDifferentials to North Sea Dated
Urals (NWE) Urals (Med)
Copyright © 2013 Argus Media Ltd
0
1
2
3
4
5
6
7
Aug 11 Feb 12 Aug 12 Feb 13 Aug 13
$/bbl ESPO differentials
ESPO vs Dubai
Copyright © 2013 Argus Media Ltd
After trading at a premium to Brent in recent months on lower Russian export volumes and reduced Iraqi Kirkuk and Libyan supplies to Europe, the differential for Urals in the Mediterranean turned negative briefly in early September. By contrast, the Brent Urals price differential in Northwest Europe consolidated its downward trend in early September at ‐$1/bbl compared with a premium of +$0.05/bbl on average in July and +$0.55/bbl in July. Russian exports are forecast to rebound sharply in September. In August however, Urals crude traded at a premium of around $0.55/bbl compared to about $0.85/bbl in July and a more typical discount against Dated Brent of ‐$0.20/bbl in June. Meanwhile, Saudi Arabia raised official selling prices (OSPs) of its Arab Light grades and Arab Medium to Asia for October after supply disruptions elevated premiums for most Middle Eastern crudes ahead of peak winter demand. The relative strength of Brent against Dubai also supported Middle East and Russian crudes linked to cheaper Dubai. Asian buyers stepped up purchases of sour Russian ESPO crudes, despite the $6/barrel premium over Dubai in early September. Asia saw significant increases in Iraqi Basrah Light crude imports in August at a steep 1.59 mb/d compared with 1.29 mb/d in July but volumes are expected to ease in the next several months on maintenance work at Iraq’s southern terminals.

PRICES INTERNATIONAL ENERGY AGENCY ‐ OIL MARKET REPORT
44 12 SEPTEMBER 2013
Spot Product Prices
Spot product crack spreads posted diverging trends in August, with the US partially insulated from the recent surge in crude prices, which pressured crack spreads in Asia and Europe. Gasoline crack spreads fell across the board, suffering from both strong crude prices and lower US and Singapore spot prices as the driving season came to a close. Gasoline crack spreads fell in all major regions as summer peak demand ended, particularly in Asia and in the US. Notably, Singapore crack spreads fell by about $8.25/bbl to around $10/bbl due to the combined effect of stronger crude and lower gasoline prices. Lower Indonesian gasoline imports pressured prices as the country is suffering currency weakness (See Demand, ‘Emerging Market Currency Depreciation Set to Impact Demand’). US crack spreads fell more than $4.65/bbl in August but still averaged a healthy $22.70/bbl. Gasoline crack spreads in Northwest Europe were down just over $1/bbl, to $10.50/bbl as rising crude prices outpaced increased gasoline prices.
-10
0
10
20
30
40
50
Aug 12 Nov 12 Feb 13 May 13 Aug 13
$/bblGasoline
Cracks to Benchmark Crudes
NWE Prem Unl USGC 93 ConvMed Prem Unl SP Prem Unl
Copyright © 2013 Argus Media Ltd
-18
-14
-10
-6
-2
2
6
Aug 12 Nov 12 Feb 13 May 13 Aug 13
$/bblNaphtha
Cracks to Benchmark Crudes
NWE SPMed ME Gulf
Copyright © 2013 Argus Media Ltd
Naphtha crack spreads were relatively stable month‐on‐month in both Europe and Asia. However, in the Mediterranean crack spreads posted wide price swings throughout August, climbing by more than $5/bbl during the month on the back of stronger naphtha demand. Singapore naphtha crack spreads moved further into negative territory, down $0.15/bbl to ‐$5.70/bbl.
Spot Crude Oil Prices and Differentials
Table Unavailable
Available in the subscription version.
To subscribe, visit: http://www.iea.org/w/omrss/default.aspx

INTERNATIONAL ENERGY AGENCY ‐ OIL MARKET REPORT PRICES
12 SEPTEMBER 2013 45
0
5
10
15
20
25
Aug 12 Nov 12 Feb 13 May 13 Aug 13
$/bbl Gasoil/Heating OilCracks to Benchmark Crudes
NWE Gasoil 0.1% USGC Heating OilMed Gasoil 0.1% SP Gasoil 0.05%
Copyright © 2013 Argus Media Ltd
6
10
14
18
22
26
Aug 12 Nov 12 Feb 13 May 13 Aug 13
$/bbl Jet/KeroseneCracks to Benchmark Crudes
NWE Jet/kero USGC Jet/keroMed Jet Fuel SP Jet/kero
Copyright © 2013 Argus Media Ltd
Gasoil crack spreads showed diverging trends among the regions. Asian crack spreads monthly average fell by $2.51/bbl to $17.10/bbl as stronger crude prices eclipsed spot gasoil gains. Lower than expected Indian diesel consumption also pressured cracks as end‐user prices continued to rise and general economic malaise subdued demand. European crack spreads inched down $0.50‐$0.70/bbl, to $13.85/bbl in Northwest Europe and $13.15/bbl in the Mediterranean. Weighing on prices, heavy monsoon rains in India subdued domestic demand and pushed additional exports to Asia and Europe. However, US cracks on both gasoil and ultra‐low‐sulphur Diesel bucked the trend, going up around $2‐3/bbl on a monthly basis to $11.55/bbl and $16.90/bbl respectively. Jet/Kerosene crack spreads were relatively stable in all regions bar the US, where the crack spreads touched $20/bbl in mid‐August and finally settled at $15/bbl in early September. US Gulf crack spreads drew support from a series of unplanned shut downs, including Motiva’s Port Arthur refinery in Texas and the Convent refinery in Louisiana. In contrast to the US, European and Asian crack spreads were largely unchanged on a monthly average basis though trended lower by the end of August as summer travel season faded out.
-30
-25
-20
-15
-10
-5
0
Aug 12 Nov 12 Feb 13 May 13 Aug 13
$/bblHigh-Sulphur Fuel Oil
Cracks to Benchmark Crudes
NWE HSFO 3.5% Med HSFO 3.5%SP HSFO 380 4%
Copyright © 2013 Argus Media Ltd
-20
-15
-10
-5
0
5
10
15
Aug 12 Nov 12 Feb 13 May 13 Aug 13
$/bblLow-Sulphur Fuel Oil (1%)
Cracks to Benchmark Crudes
NWE LSFO 1% Med LSFO 1%Indonesia LSWR
Copyright © 2013 Argus Media Ltd
Fuel oil crack spreads fell steadily throughout August in Europe and Asia but inched higher in the US Gulf ahead of the winter season. Asian cracks consolidated their negative trend, further dipping to levels unseen in more than two years, on the back of lower bunker consumption, below‐average Japanese power sector demand and Chinese imports at a year‐to‐date low.
8
12
16
20
24
28
Aug 12 Nov 12 Feb 13 May 13 Aug 13
$/bblDiesel Fuel
Cracks to Benchmark Crudes
NWE ULSD USGC ULSDMed ULSD SP Gasoil 0.05%
Copyright © 2013 Argus Media LtdCopyright © 2013 Argus Media Ltd

PRICES INTERNATIONAL ENERGY AGENCY ‐ OIL MARKET REPORT
46 12 SEPTEMBER 2013
Freight
Rates for very large crude carriers (VLCCs) experienced another lacklustre month in August as ample tonnage weighed heavily on markets. Furthermore, vessel earnings fell into negative territory as bunker costs surged to over $600/t and $660/t for HFO and LSFO, respectively, in line with soaring benchmark crude prices. Despite healthy demand for Middle Eastern crudes, rates on the benchmark VLCC Middle East Gulf – Asia trade languished at below $10/mt throughout August and early‐September.
0
5
10
15
20
25
Jan-11 Jul-11 Jan-12 Jul-12 Jan-13 Jul-13
US$/mt Daily Crude Tanker Rates
130Kt WAF - USGC VLCC MEG-Asia
80Kt UK - UK cont 100Kt Baltic - UK
5
10
15
20
25
30
35
40
Jan-11 Jul-11 Jan-12 Jul-12 Jan-13 Jul-13
US$/mt Daily Product Tanker Rates
38Kt Carib - USAC 37Kt UKC - USAC
75Kt MEG - Jap 30Kt SP - Jap
Copyright © 2013 Argus Media Ltd
A similar picture was evident in Atlantic Basin Suezmax markets where, despite disruption in Libya and reports of extra light, sweet crude leaving West Africa bound for Europe, rates weakened month‐on‐
Spot Product Prices
Table Unavailable
Available in the subscription version.
To subscribe, visit: http://www.iea.org/w/omrss/default.aspx

INTERNATIONAL ENERGY AGENCY ‐ OIL MARKET REPORT PRICES
12 SEPTEMBER 2013 47
month. Indeed, despite, some early August strengthening to over $16.50/mt, rates on the benchmark West Africa – US Gulf Coast route retreated sharply so that by early‐September they sat below $13/mt as supply heavily outweighed demand. The only bright spot in crude tanker markets was Northwest Europe where rates uncharacteristically firmed during a period where they historically tend to trend sideways. Following a raft of cargos coming out of the Baltic terminals of Ust‐Luga and Primorsk, reportedly bound for long‐haul transatlantic destinations, regional Aframax tonnage tightened considerably. This pushed rates for the Baltic – UK trades to over $9/mt in mid‐August. However, as extra vessels entered the market in early‐September, rates slipped back to their normal levels of approximately $6/mt. Product tanker markets experienced a mixed month, generally weakening over the first half of August before rebounding from late month onwards after demand picked up. In the East, after languishing at year‐lows of $20/mt in early August, the benchmark Middle East Gulf – Japan trade surged to a year‐high of close to $32/mt by early September spurred on by tight fundamentals. However, these levels are unlikely to be sustained for long with current reports of vessels ballasting towards the Middle East Gulf from elsewhere. In the Atlantic basin, rates weakened over the first half of August to stand at year‐to‐date lows as transatlantic trade remained below par. However, after multiple gasoline cargoes entered the market in mid‐month, rates began to firm so that by early‐September rates on the benchmark UK – US Atlantic coast trade once again exceeded $17/mt.

REFINING INTERNATIONAL ENERGY AGENCY ‐ OIL MARKET REPORT
48 12 SEPTEMBER 2013
REFINING
Summary
Global refinery crude throughputs reached a seasonal peak in July, at an estimated 78.2 mb/d, up 1 mb/d from June and 1.8 mb/d above a year earlier. Monthly gains spanned all regions, bar China. Global throughputs are expected to fall steeply from August onwards, due to weaker refinery margins and the onset of seasonal maintenance. Scheduled turnarounds are especially heavy in Europe and the FSU, mitigating the effect of current feedstock supply disruptions.
The estimate of global throughputs for 3Q13 has been revised downwards by 180 kb/d since last month’s Report, largely on lower expectations of European refinery runs. Weak margins have revived talk of economic run cuts, on top of heavy planned maintenance. Global crude runs are forecast to reach 77.2 mb/d in 3Q13, up 1.1 mb/d above year‐earlier levels, before declining to 76.8 mb/d in 4Q13.
OECD crude runs rose another 450 kb/d in July, to average 38 mb/d. While all OECD regions moved higher, Japan, the US and Italy accounted for the bulk of the increase. Annual gains were reported only for the US and Japan. After a temporary respite in June, European crude intake resumed its structural decline, sliding by some 510 kb/d y‐o‐y. Margins generally deteriorated in August, prompting talk of further run cuts in both Europe and Asia.
Refinery margins fell in all regions surveyed bar the US Gulf Coast in August, as crude prices rose faster than product prices. European margins fell by nearly $1/bbl on average. Simple refiners were particularly hard‐hit and are now firmly in the red. Even steeper falls came in the US Midcontinent, as crude stock draws at Cushing supported WTI prices, and in Singapore, where only Dubai hydrocracking margins remained positive. US Gulf Coast margins rose on average in August, propped up by refinery problems in the second half of the month.
717273747576777879
Jan Mar May Jul Sep Nov Jan
mb/dGlobal RefiningCrude Throughput
Range 08-12 Average 08-122012 2013 est.2013
- 3.5
- 2.5
- 1.5
- 0.5
0.5
1.5
2.5
3.5
1Q09 1Q10 4Q10 4Q11 4Q12 4Q13
mb/d Global Throughputs vs. DemandAnnual growth
Crude Runs Oil Product Demand
Global Refinery Overview
Global refinery crude throughputs reached a seasonal peak in July, at an estimated 78.2 mb/d, and a sharp 1.8 mb/d above year earlier levels. Runs are set to fall from August onwards, as refiners scale back throughputs due both to planned maintenance and a weakening margin environment. Recent crude price increases have largely outpaced gains in refined product prices, curbing refinery margins and spurring talk of economic run cuts in Europe and Asia. At the same time, refinery maintenance in Europe and Russia is expected to slash crude demand in those regions by a combined 2 mb/d in both September and October. The scheduled shutdowns, at a time when regional crude supply faces shortfalls from Libya, Iraq and the North Sea, eases somewhat the strain of sourcing alternative feedstocks.

INTERNATIONAL ENERGY AGENCY ‐ OIL MARKET REPORT REFINING
12 SEPTEMBER 2013 49
As a result of slightly weaker reported OECD and Chinese refinery runs for July, and a somewhat more pessimistic outlook for runs in September, 3Q13 global crude run estimates have been trimmed by 180 kb/d since last month’s report. At 77.2 mb/d, global runs are still assessed an impressive 1.1 mb/d above the same quarter last year, with gains almost entirely accounted for by non‐OECD countries. The largest contributors to growth remain China (+400 kb/d), Russia (+155 kb/d), Algeria (180 kb/d), India (+145 kb/d), Venezuela (+125 kb/d), Saudi Arabia (+85 kb/d) and Brazil (+80 kb/d). In the OECD, only US refiners continue to surge ahead on the back of ”advantaged” regional crude supplies, comparatively low energy costs (cheap natural gas) and robust export demand for refined products. Preliminary weekly data show US crude intake running 390 kb/d and 535 kb/d above year‐earlier levels in July and August, respectively.
Global Refinery Crude Throughput1 2
(million barrels per day)
May 13 Jun 13 2Q2013 Jul 13 Aug 13 Sep 13 3Q2013 Oct 13 Nov 13 Dec 13 4Q2013
Americas 18.2 19.0 18.4 19.1 18.9 18.2 18.8 17.9 18.2 18.5 18.2
Europe 11.5 12.0 11.7 12.2 12.1 11.7 12.0 11.6 11.6 11.7 11.7
Asia Oceania 6.1 6.5 6.3 6.6 6.8 6.4 6.6 6.5 6.8 7.0 6.8
Total OECD 35.8 37.5 36.4 38.0 37.8 36.2 37.4 36.0 36.7 37.2 36.6
FSU 6.7 7.0 6.6 7.1 7.1 6.5 6.9 6.6 6.9 6.8 6.8
Non-OECD Europe 0.4 0.4 0.4 0.5 0.5 0.5 0.5 0.5 0.5 0.5 0.5
China 9.2 9.7 9.4 9.5 9.4 9.5 9.5 9.7 10.2 10.3 10.1
Other Asia 9.7 9.6 9.7 9.8 9.7 9.7 9.8 9.9 9.9 10.0 9.9
Latin America 4.6 4.8 4.7 4.9 4.8 4.8 4.8 4.6 4.7 4.5 4.6
Middle East 5.4 5.9 5.5 6.1 6.2 6.2 6.2 6.2 6.2 6.2 6.2
Africa 2.1 2.2 2.1 2.2 2.2 2.2 2.2 2.2 2.2 2.2 2.2
Total Non-OECD 38.2 39.6 38.4 40.2 39.7 39.5 39.8 39.6 40.5 40.5 40.2
Total 74.0 77.2 74.8 78.2 77.6 75.7 77.2 75.7 77.2 77.7 76.8
1 Preliminary and estimated runs based on capacity, know n outages, economic run cuts and global demand forecast
2 From the report dated 10 August, 2012 OECD Americas include Chile and OECD Asia Oceania includes Israel. Annual growth is expected to slow somewhat in 4Q13, to around 540 kb/d globally. OECD runs are set to continue to contract structurally, on lower end‐user demand and reduced capacity compared with a year earlier. In the Pacific and Europe refinery consolidation continues, with plants shutting permanently in both regions during the summer (Cosmo’s 140 kb/d Sakaide refinery shut in early August and ENI’s 80 kb/d Venice refinery halted operations in July before being converted into a bio‐refinery). In the non‐OECD region, runs continue to be supported by more robust demand growth than in the OECD, as well as by new refining capacity. In Saudi Arabia, the 400 kb/d Satorp plant in Jubail is ramping up runs as new units are commissioned. The plant is expected to reach full rates in early 2014. While some uncertainty surrounds the start‐up of PetroChina’s 200 kb/d grassroot Pengzhou refinery in Sichuan province (due to potential flood damage to pipelines feeding the refinery), company officials announced on 5 September, that after several delays, the plant will start up in late October. By end‐year, Sinochem’s new 240 kb/d Quanzhou refinery is also set to start trial runs. In all, 4Q13 global crude runs are estimated to average 76.8 mb/d.
Refining Margins
Refining margins fell in all regions bar the US Gulf Coast in August, as increases in product prices generally failed to keep up with gains recorded for feedstock prices. Crude oil grades, in particular North Sea and Middle Eastern grades, were supported by severe supply disruptions while product price increases were capped by the end of the summer driving season and high gasoline inventories on both sides of the Atlantic. Simple refinery margins moved more firmly into the ‘red’ in both Northwest Europe
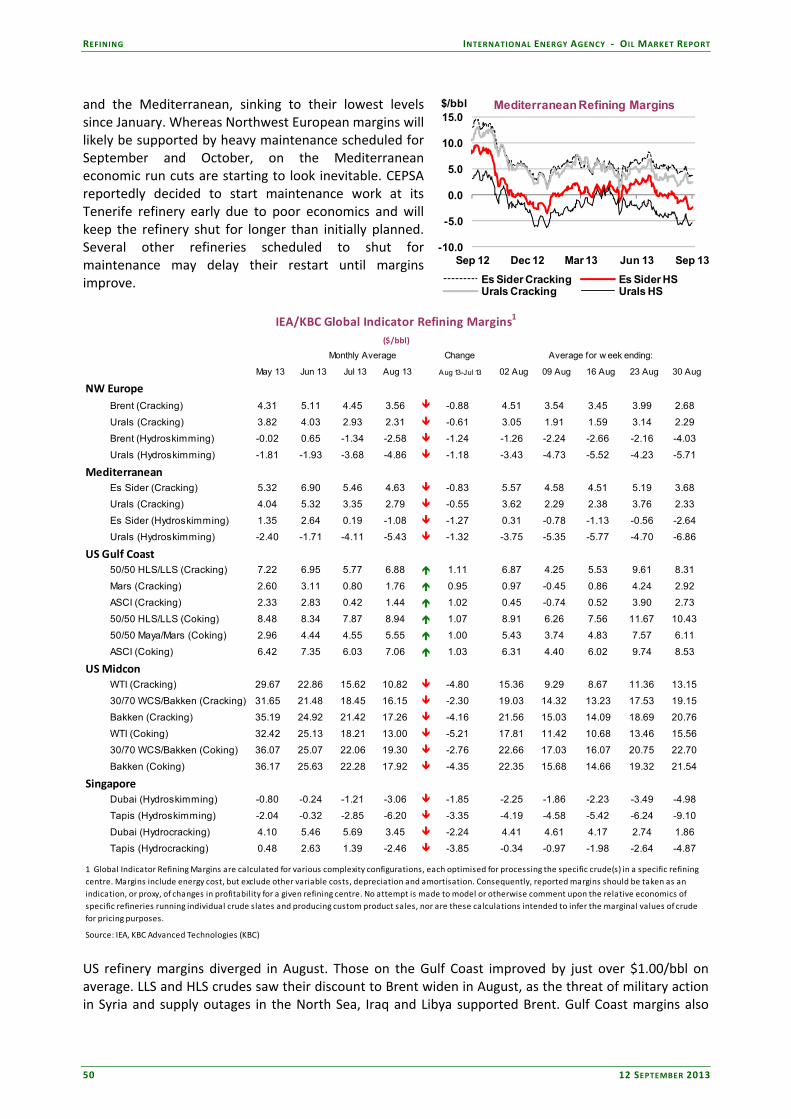
REFINING INTERNATIONAL ENERGY AGENCY ‐ OIL MARKET REPORT
50 12 SEPTEMBER 2013
and the Mediterranean, sinking to their lowest levels since January. Whereas Northwest European margins will likely be supported by heavy maintenance scheduled for September and October, on the Mediterranean economic run cuts are starting to look inevitable. CEPSA reportedly decided to start maintenance work at its Tenerife refinery early due to poor economics and will keep the refinery shut for longer than initially planned. Several other refineries scheduled to shut for maintenance may delay their restart until margins improve.
IEA/KBC Global Indicator Refining Margins1
($/bbl)
Monthly Average Change Average for w eek ending:
May 13 Jun 13 Jul 13 Aug 13 Aug 13-Jul 13 02 Aug 09 Aug 16 Aug 23 Aug 30 Aug
NW Europe
Brent (Cracking) 4.31 5.11 4.45 3.56 -0.88 4.51 3.54 3.45 3.99 2.68
Urals (Cracking) 3.82 4.03 2.93 2.31 -0.61 3.05 1.91 1.59 3.14 2.29
Brent (Hydroskimming) -0.02 0.65 -1.34 -2.58 -1.24 -1.26 -2.24 -2.66 -2.16 -4.03
Urals (Hydroskimming) -1.81 -1.93 -3.68 -4.86 -1.18 -3.43 -4.73 -5.52 -4.23 -5.71
MediterraneanEs Sider (Cracking) 5.32 6.90 5.46 4.63 -0.83 5.57 4.58 4.51 5.19 3.68
Urals (Cracking) 4.04 5.32 3.35 2.79 -0.55 3.62 2.29 2.38 3.76 2.33
Es Sider (Hydroskimming) 1.35 2.64 0.19 -1.08 -1.27 0.31 -0.78 -1.13 -0.56 -2.64
Urals (Hydroskimming) -2.40 -1.71 -4.11 -5.43 -1.32 -3.75 -5.35 -5.77 -4.70 -6.86
US Gulf Coast50/50 HLS/LLS (Cracking) 7.22 6.95 5.77 6.88 1.11 6.87 4.25 5.53 9.61 8.31
Mars (Cracking) 2.60 3.11 0.80 1.76 0.95 0.97 -0.45 0.86 4.24 2.92
ASCI (Cracking) 2.33 2.83 0.42 1.44 1.02 0.45 -0.74 0.52 3.90 2.73
50/50 HLS/LLS (Coking) 8.48 8.34 7.87 8.94 1.07 8.91 6.26 7.56 11.67 10.43
50/50 Maya/Mars (Coking) 2.96 4.44 4.55 5.55 1.00 5.43 3.74 4.83 7.57 6.11
ASCI (Coking) 6.42 7.35 6.03 7.06 1.03 6.31 4.40 6.02 9.74 8.53
US MidconWTI (Cracking) 29.67 22.86 15.62 10.82 -4.80 15.36 9.29 8.67 11.36 13.15
30/70 WCS/Bakken (Cracking) 31.65 21.48 18.45 16.15 -2.30 19.03 14.32 13.23 17.53 19.15
Bakken (Cracking) 35.19 24.92 21.42 17.26 -4.16 21.56 15.03 14.09 18.69 20.76
WTI (Coking) 32.42 25.13 18.21 13.00 -5.21 17.81 11.42 10.68 13.46 15.56
30/70 WCS/Bakken (Coking) 36.07 25.07 22.06 19.30 -2.76 22.66 17.03 16.07 20.75 22.70
Bakken (Coking) 36.17 25.63 22.28 17.92 -4.35 22.35 15.68 14.66 19.32 21.54
SingaporeDubai (Hydroskimming) -0.80 -0.24 -1.21 -3.06 -1.85 -2.25 -1.86 -2.23 -3.49 -4.98
Tapis (Hydroskimming) -2.04 -0.32 -2.85 -6.20 -3.35 -4.19 -4.58 -5.42 -6.24 -9.10
Dubai (Hydrocracking) 4.10 5.46 5.69 3.45 -2.24 4.41 4.61 4.17 2.74 1.86
Tapis (Hydrocracking) 0.48 2.63 1.39 -2.46 -3.85 -0.34 -0.97 -1.98 -2.64 -4.87
1 Global Indicator Refining Margins are calculated for various complexity configurations, each optimised for processing the specific crude(s) in a specific refining
centre. Margins include energy cost, but exclude other variable costs, depreciation and amortisation. Consequently, reported margins should be taken as an
indication, or proxy, of changes in profitability for a given refining centre. No attempt is made to model or otherwise comment upon the relative economics of
specific refineries running individual crude slates and producing custom product sales, nor are these calculations intended to infer the marginal values of crude
for pricing purposes.
Source: IEA, KBC Advanced Technologies (KBC) US refinery margins diverged in August. Those on the Gulf Coast improved by just over $1.00/bbl on average. LLS and HLS crudes saw their discount to Brent widen in August, as the threat of military action in Syria and supply outages in the North Sea, Iraq and Libya supported Brent. Gulf Coast margins also
-10.0
-5.0
0.0
5.0
10.0
15.0
Sep 12 Dec 12 Mar 13 Jun 13 Sep 13
$/bbl Mediterranean Refining Margins
Es Sider Cracking Es Sider HSUrals Cracking Urals HS
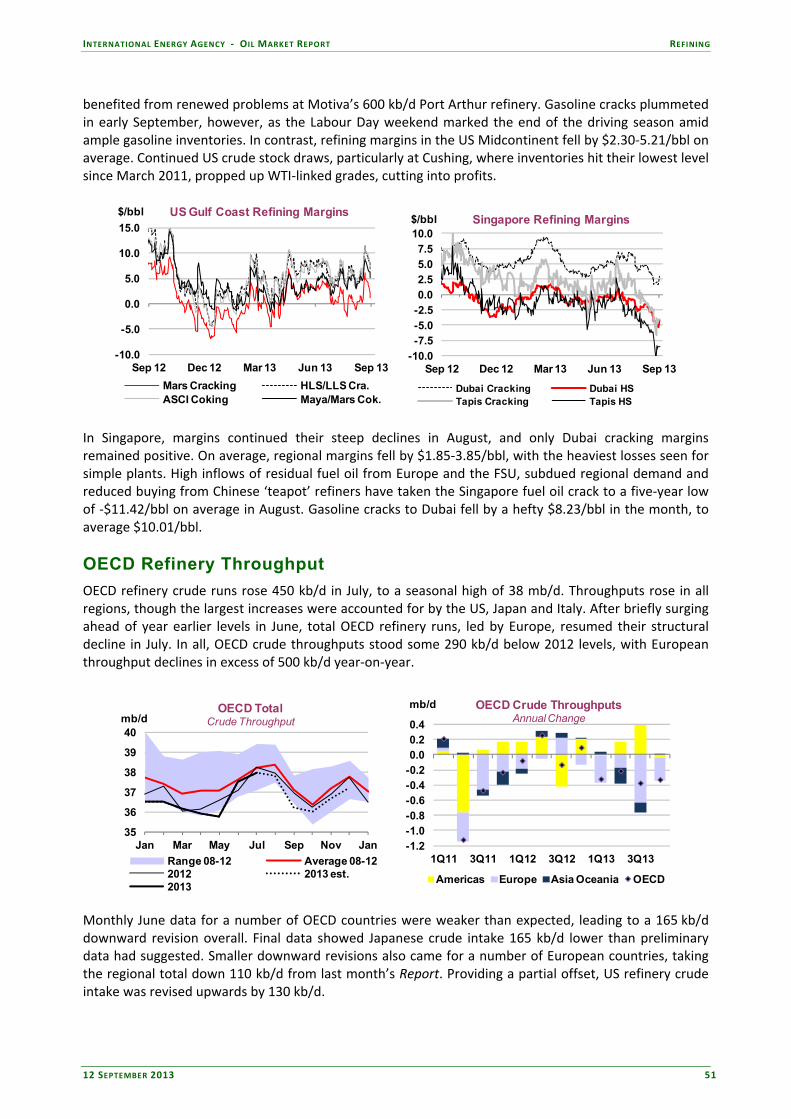
INTERNATIONAL ENERGY AGENCY ‐ OIL MARKET REPORT REFINING
12 SEPTEMBER 2013 51
benefited from renewed problems at Motiva’s 600 kb/d Port Arthur refinery. Gasoline cracks plummeted in early September, however, as the Labour Day weekend marked the end of the driving season amid ample gasoline inventories. In contrast, refining margins in the US Midcontinent fell by $2.30‐5.21/bbl on average. Continued US crude stock draws, particularly at Cushing, where inventories hit their lowest level since March 2011, propped up WTI‐linked grades, cutting into profits.
-10.0
-5.0
0.0
5.0
10.0
15.0
Sep 12 Dec 12 Mar 13 Jun 13 Sep 13
$/bbl US Gulf Coast Refining Margins
Mars Cracking HLS/LLS Cra.ASCI Coking Maya/Mars Cok.
-10.0
-7.5-5.0
-2.5
0.0
2.55.0
7.5
10.0
Sep 12 Dec 12 Mar 13 Jun 13 Sep 13
$/bbl Singapore Refining Margins
Dubai Cracking Dubai HSTapis Cracking Tapis HS
In Singapore, margins continued their steep declines in August, and only Dubai cracking margins remained positive. On average, regional margins fell by $1.85‐3.85/bbl, with the heaviest losses seen for simple plants. High inflows of residual fuel oil from Europe and the FSU, subdued regional demand and reduced buying from Chinese ‘teapot’ refiners have taken the Singapore fuel oil crack to a five‐year low of ‐$11.42/bbl on average in August. Gasoline cracks to Dubai fell by a hefty $8.23/bbl in the month, to average $10.01/bbl.
OECD Refinery Throughput
OECD refinery crude runs rose 450 kb/d in July, to a seasonal high of 38 mb/d. Throughputs rose in all regions, though the largest increases were accounted for by the US, Japan and Italy. After briefly surging ahead of year earlier levels in June, total OECD refinery runs, led by Europe, resumed their structural decline in July. In all, OECD crude throughputs stood some 290 kb/d below 2012 levels, with European throughput declines in excess of 500 kb/d year‐on‐year.
35
36
37
38
39
40
Jan Mar May Jul Sep Nov Jan
mb/dOECD Total
Crude Throughput
Range 08-12 Average 08-122012 2013 est. 2013
-1.2-1.0-0.8-0.6-0.4-0.20.00.20.4
1Q11 3Q11 1Q12 3Q12 1Q13 3Q13
mb/d OECD Crude ThroughputsAnnual Change
Americas Europe Asia Oceania OECD
Monthly June data for a number of OECD countries were weaker than expected, leading to a 165 kb/d downward revision overall. Final data showed Japanese crude intake 165 kb/d lower than preliminary data had suggested. Smaller downward revisions also came for a number of European countries, taking the regional total down 110 kb/d from last month’s Report. Providing a partial offset, US refinery crude intake was revised upwards by 130 kb/d.
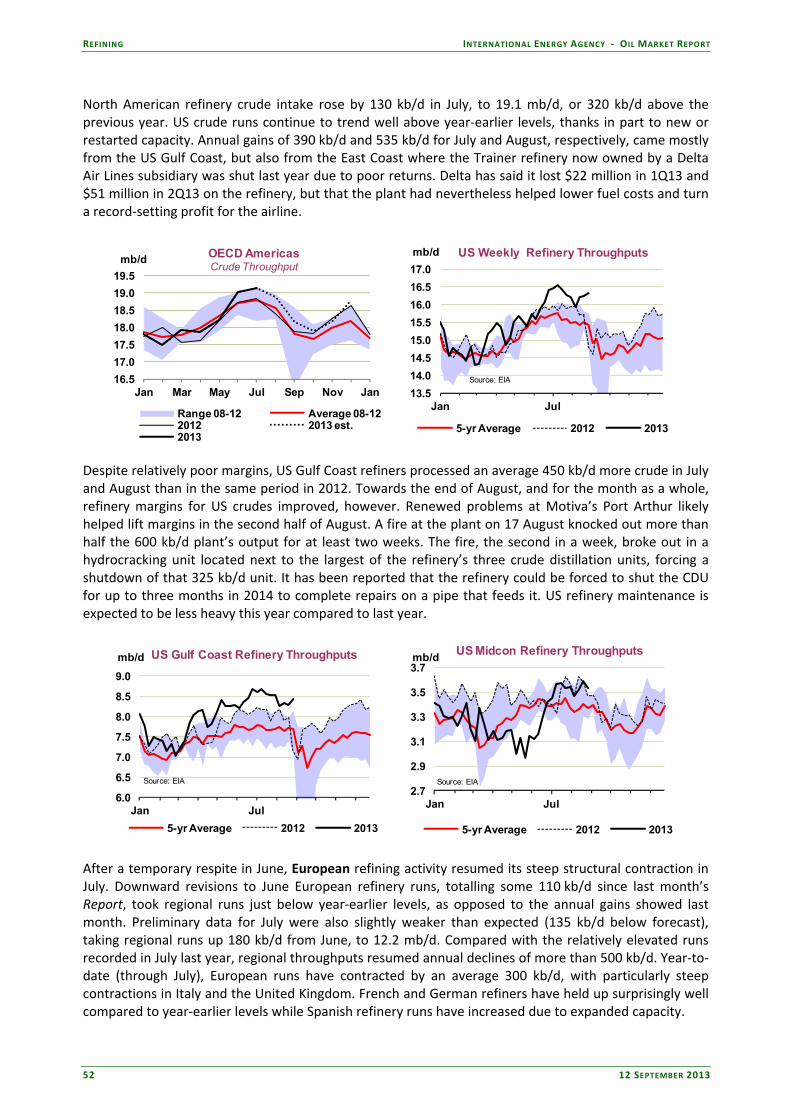
REFINING INTERNATIONAL ENERGY AGENCY ‐ OIL MARKET REPORT
52 12 SEPTEMBER 2013
North American refinery crude intake rose by 130 kb/d in July, to 19.1 mb/d, or 320 kb/d above the previous year. US crude runs continue to trend well above year‐earlier levels, thanks in part to new or restarted capacity. Annual gains of 390 kb/d and 535 kb/d for July and August, respectively, came mostly from the US Gulf Coast, but also from the East Coast where the Trainer refinery now owned by a Delta Air Lines subsidiary was shut last year due to poor returns. Delta has said it lost $22 million in 1Q13 and $51 million in 2Q13 on the refinery, but that the plant had nevertheless helped lower fuel costs and turn a record‐setting profit for the airline.
16.5
17.0
17.5
18.0
18.5
19.0
19.5
Jan Mar May Jul Sep Nov Jan
mb/d OECD AmericasCrude Throughput
Range 08-12 Average 08-122012 2013 est. 2013
13.5
14.0
14.5
15.0
15.5
16.0
16.5
17.0
Jan Jul
mb/d US Weekly Refinery Throughputs
5-yr Average 2012 2013
Source: EIA
Despite relatively poor margins, US Gulf Coast refiners processed an average 450 kb/d more crude in July and August than in the same period in 2012. Towards the end of August, and for the month as a whole, refinery margins for US crudes improved, however. Renewed problems at Motiva’s Port Arthur likely helped lift margins in the second half of August. A fire at the plant on 17 August knocked out more than half the 600 kb/d plant’s output for at least two weeks. The fire, the second in a week, broke out in a hydrocracking unit located next to the largest of the refinery’s three crude distillation units, forcing a shutdown of that 325 kb/d unit. It has been reported that the refinery could be forced to shut the CDU for up to three months in 2014 to complete repairs on a pipe that feeds it. US refinery maintenance is expected to be less heavy this year compared to last year.
6.0
6.5
7.0
7.5
8.0
8.5
9.0
Jan Jul
mb/d US Gulf Coast Refinery Throughputs
5-yr Average 2012 2013
Source: EIA
2.7
2.9
3.1
3.3
3.5
3.7
Jan Jul
mb/dUS Midcon Refinery Throughputs
5-yr Average 2012 2013
Source: EIA
After a temporary respite in June, European refining activity resumed its steep structural contraction in July. Downward revisions to June European refinery runs, totalling some 110 kb/d since last month’s Report, took regional runs just below year‐earlier levels, as opposed to the annual gains showed last month. Preliminary data for July were also slightly weaker than expected (135 kb/d below forecast), taking regional runs up 180 kb/d from June, to 12.2 mb/d. Compared with the relatively elevated runs recorded in July last year, regional throughputs resumed annual declines of more than 500 kb/d. Year‐to‐date (through July), European runs have contracted by an average 300 kb/d, with particularly steep contractions in Italy and the United Kingdom. French and German refiners have held up surprisingly well compared to year‐earlier levels while Spanish refinery runs have increased due to expanded capacity.

INTERNATIONAL ENERGY AGENCY ‐ OIL MARKET REPORT REFINING
12 SEPTEMBER 2013 53
European refinery runs were likely weak in August and will remain so through October. Preliminary data from Euroilstocks released on 10 September show European runs falling 125 kb/d in August, when refinery margins in both Northwest Europe and the Mediterranean continued to slide and in the case of simple plants remained firmly negative. From September onwards, refiners both in the North and on the Mediterranean embark on a heavy turnarounds schedule, taking just over 1 mb/d capacity offline in September and 1.2 mb/d in October. Key plants undergoing maintenance include Shell’s Pernis refinery which started work on 2 September, BP’s Rotterdam refinery, Exxon’s Antwerp plant, Preem’s Gothenborg and Lysekil refineries in Sweden, Cepsa’s Tenerife refinery and the Stanlow and Lindsey refineries in the UK. Most of these shutdowns are expected to extend into October.
11.0
11.5
12.0
12.5
13.0
13.5
14.0
Jan Mar May Jul Sep Nov Jan
mb/d OECD Europe Crude Throughput
Range 08-12 Average 08-122012 2013 est. 2013
0.0
0.5
1.0
1.5
2.0
Jan Mar May Jul Sep Nov Jan
mb/d OECD EuropeRefinery Shutdowns
Range 08-12 Average 08-12
2012 2013 Forecast Refinery crude throughputs in OECD Asia Oceania rose by 140 kb/d in July, to 6.65 mb/d, as sharply higher Japanese crude runs were partly offset by slightly lower South Korean rates. Both June and July preliminary estimates for the region were revised lower since last month’s Report. Final monthly data for Japan for June were 170 kb/d lower than preliminary data had suggested, while South Korean throughputs in July were 170 kb/d less than our previous estimate. South Korea's SK Energy started work on expanding a 74 kb/d RFCC unit at its massive 1.1 mb/d Ulsan refinery in July, resulting in lower throughputs. The work, which will raise capacity of the RFCC by 10‐20%, is expected to be completed in mid‐September. The company is also conducting maintenance at a 240 kb/d CDU from 25 August to 18 September, according to news reports.
6.0
6.5
7.0
7.5
Jan Mar May Jul Sep Nov Jan
mb/dOECD Asia Oceania
Crude Throughput
Range 08-12 Average 08-122012 2013 est. 2013
2.5
3.0
3.5
4.0
4.5
Jan Apr Jul Oct
mb/d Japan Weekly Refinery Throughput
Range 2008-12 5-yr Average2012 2013
Source: PAJ, IEA estimatesSource: PAJ, IEA estimates
Preliminary weekly data from the Petroleum Association of Japan (PAJ) show that Japanese refiners increased runs in August, to 3.58 mb/d (including NGLs processed, normally averaging 180 kb/d). The increase came despite the permanent closure of Cosmo Oil’s 140 kb/d Sakaide refinery in early August. The shutdown had been announced last year, and is part of the government’s measures to restructure the country’s ailing refinery industry amid falling domestic demand. The Ministry of Economy, Trade and Industry set rules in 2010 requiring refiners to increase their residual cracking ratio by March 2014, in essence forcing refiners to upgrade plants or reduce crude distillation capacity.

REFINING INTERNATIONAL ENERGY AGENCY ‐ OIL MARKET REPORT
54 12 SEPTEMBER 2013
Japan has already reduced crude distillation capacity by 420 kb/d since 2009, through the shutdown of Showa Shell’s 120 kb/d Ogimachi refinery in 2011 and several smaller capacity reductions over 2009 and 2010. Idemitsu Kosan plans to permantly shut a 120 kb/d CDU at its Tokuyama refinery in March 2014, while JX Nippon Oil & Energy Corp, Japan’s largest refiner, has announced it will permanently shut 200 kb/d of CDU capacity by the March 2014 deadline. It is still not clear which facility JX will shut. Tonen General is also expected to reduce capacity by around 100 kb/d next year, taking total Japanese capacity reductions to almost 1 mb/d over the 2009‐2014 period.
Refinery Crude Throughput and Utilisation in OECD Countries(million barrels per day)
Change from Utilisation rate1
Feb 13 Mar 13 Apr 13 May 13 Jun 13 Jul 13 Jun 13 Jul 12 Jul 13 Jul 12
US2 14.25 14.70 14.86 15.30 15.83 16.05 0.21 0.39 90.5% 88.5%
Canada 1.82 1.77 1.57 1.46 1.71 1.68 -0.02 -0.11 87.8% 94.9%
Chile 0.19 0.16 0.14 0.18 0.19 0.15 -0.04 -0.01 66.2% 70.8%
Mexico 1.24 1.29 1.28 1.28 1.30 1.27 -0.03 0.04 76.9% 74.3%
OECD Americas 17.50 17.92 17.86 18.21 19.02 19.15 0.13 0.32 89.0% 87.8%
France 1.21 1.12 1.20 1.22 1.28 1.28 0.00 -0.10 91.3% 88.2%
Germany 1.96 1.84 1.70 1.87 1.96 1.90 -0.05 -0.05 94.2% 91.7%
Italy 1.27 1.19 1.21 1.19 1.27 1.41 0.14 -0.19 70.0% 73.4%
Netherlands 1.00 0.94 1.03 0.99 0.99 1.03 0.04 -0.01 79.8% 80.9%
Spain 1.12 1.18 1.32 1.21 1.21 1.27 0.06 -0.05 83.8% 87.2%
United Kingdom 1.28 1.26 1.36 1.26 1.32 1.30 -0.02 -0.14 75.2% 79.5%
Other OECD Europe 3.84 4.02 3.77 3.76 3.97 3.99 0.02 0.03 80.2% 80.0%
OECD Europe 11.69 11.54 11.58 11.49 11.99 12.18 0.18 -0.51 81.5% 82.2%
Japan 3.67 3.37 3.30 2.85 2.97 3.26 0.28 0.11 72.9% 68.8%
South Korea 2.72 2.43 2.24 2.33 2.59 2.47 -0.13 -0.16 90.0% 96.2%
Other Asia Oceania 0.97 0.92 0.92 0.91 0.94 0.93 -0.01 -0.04 29.0% 79.2%
OECD Asia Oceania 7.35 6.72 6.46 6.08 6.50 6.65 0.14 -0.10 79.1% 79.1%
OECD Total 36.54 36.17 35.90 35.79 37.52 37.97 0.45 -0.29 84.6% 84.3%
1 Expressed as a percentage, based on crude throughput and current operable refining capacity
2 US50
3 OECD Americas includes Chile and OECD Asia Oceania includes Israel. OECD Europe includes Slovenia and Estonia, though neither country has a refinery
Non-OECD Refinery Throughput
Non‐OECD refinery crude runs rose sharply over June and July after maintenance was completed in the Middle East and ahead of peak summer demand. Chinese crude intake surged 440 kb/d in June, before falling back slightly in July and August. Russian refiners processed record levels in July and sustained high runs through August ahead of heavy scheduled maintenance. Brazilian refiners also touched record highs in July. Towards year‐end, the commissioning of new capacity in China and the ramp up of Satorp’s 400 kb/d Jubail refinery will underpin growth. A rebound is also expected in Venezuela and Algeria, both of which had significant capacity offline in 2012.
333435363738394041
Jan Mar May Jul Sep Nov Jan
mb/dNon-OECD Total Crude Throughput
Range 08-12 Average 08-122012 2013 est.2013
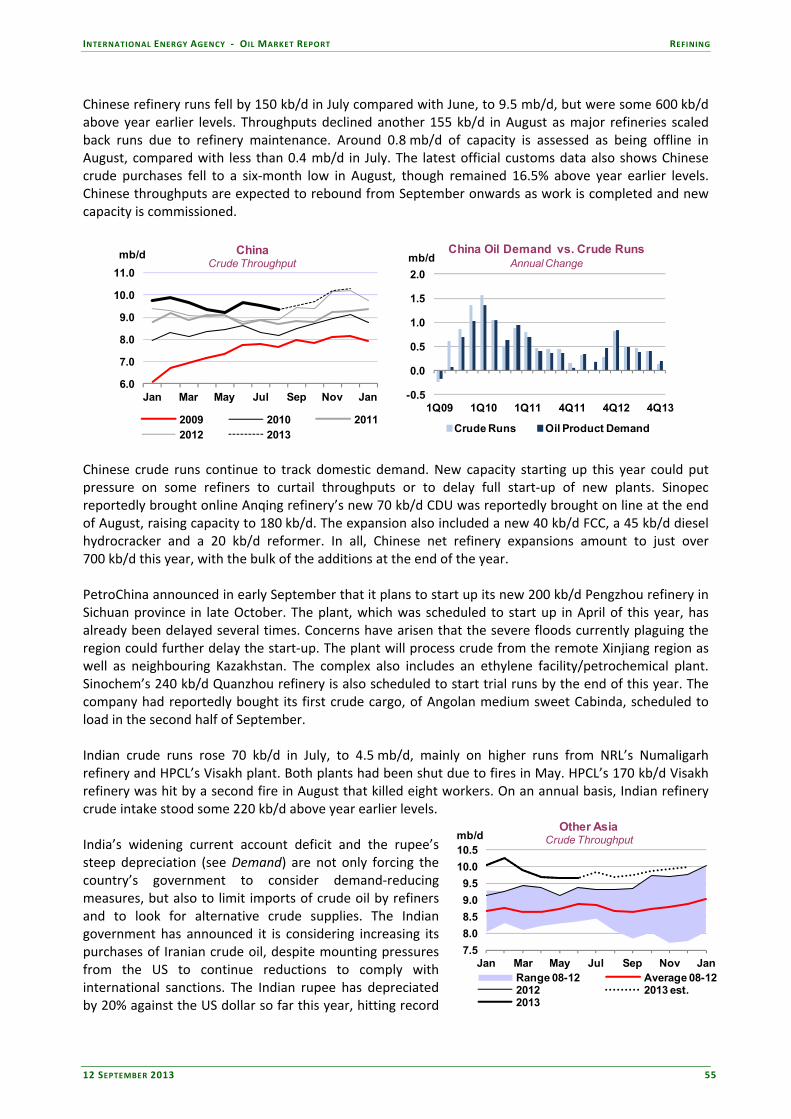
INTERNATIONAL ENERGY AGENCY ‐ OIL MARKET REPORT REFINING
12 SEPTEMBER 2013 55
Chinese refinery runs fell by 150 kb/d in July compared with June, to 9.5 mb/d, but were some 600 kb/d above year earlier levels. Throughputs declined another 155 kb/d in August as major refineries scaled back runs due to refinery maintenance. Around 0.8 mb/d of capacity is assessed as being offline in August, compared with less than 0.4 mb/d in July. The latest official customs data also shows Chinese crude purchases fell to a six‐month low in August, though remained 16.5% above year earlier levels. Chinese throughputs are expected to rebound from September onwards as work is completed and new capacity is commissioned.
6.0
7.0
8.0
9.0
10.0
11.0
Jan Mar May Jul Sep Nov Jan
mb/d ChinaCrude Throughput
2009 2010 20112012 2013
-0.5
0.0
0.5
1.0
1.5
2.0
1Q09 1Q10 1Q11 4Q11 4Q12 4Q13
mb/dChina Oil Demand vs. Crude Runs
Annual Change
Crude Runs Oil Product Demand
Chinese crude runs continue to track domestic demand. New capacity starting up this year could put pressure on some refiners to curtail throughputs or to delay full start‐up of new plants. Sinopec reportedly brought online Anqing refinery’s new 70 kb/d CDU was reportedly brought on line at the end of August, raising capacity to 180 kb/d. The expansion also included a new 40 kb/d FCC, a 45 kb/d diesel hydrocracker and a 20 kb/d reformer. In all, Chinese net refinery expansions amount to just over 700 kb/d this year, with the bulk of the additions at the end of the year. PetroChina announced in early September that it plans to start up its new 200 kb/d Pengzhou refinery in Sichuan province in late October. The plant, which was scheduled to start up in April of this year, has already been delayed several times. Concerns have arisen that the severe floods currently plaguing the region could further delay the start‐up. The plant will process crude from the remote Xinjiang region as well as neighbouring Kazakhstan. The complex also includes an ethylene facility/petrochemical plant. Sinochem’s 240 kb/d Quanzhou refinery is also scheduled to start trial runs by the end of this year. The company had reportedly bought its first crude cargo, of Angolan medium sweet Cabinda, scheduled to load in the second half of September. Indian crude runs rose 70 kb/d in July, to 4.5 mb/d, mainly on higher runs from NRL’s Numaligarh refinery and HPCL’s Visakh plant. Both plants had been shut due to fires in May. HPCL’s 170 kb/d Visakh refinery was hit by a second fire in August that killed eight workers. On an annual basis, Indian refinery crude intake stood some 220 kb/d above year earlier levels. India’s widening current account deficit and the rupee’s steep depreciation (see Demand) are not only forcing the country’s government to consider demand‐reducing measures, but also to limit imports of crude oil by refiners and to look for alternative crude supplies. The Indian government has announced it is considering increasing its purchases of Iranian crude oil, despite mounting pressures from the US to continue reductions to comply with international sanctions. The Indian rupee has depreciated by 20% against the US dollar so far this year, hitting record
7.5
8.0
8.5
9.0
9.5
10.0
10.5
Jan Mar May Jul Sep Nov Jan
mb/dOther Asia
Crude Throughput
Range 08-12 Average 08-122012 2013 est. 2013
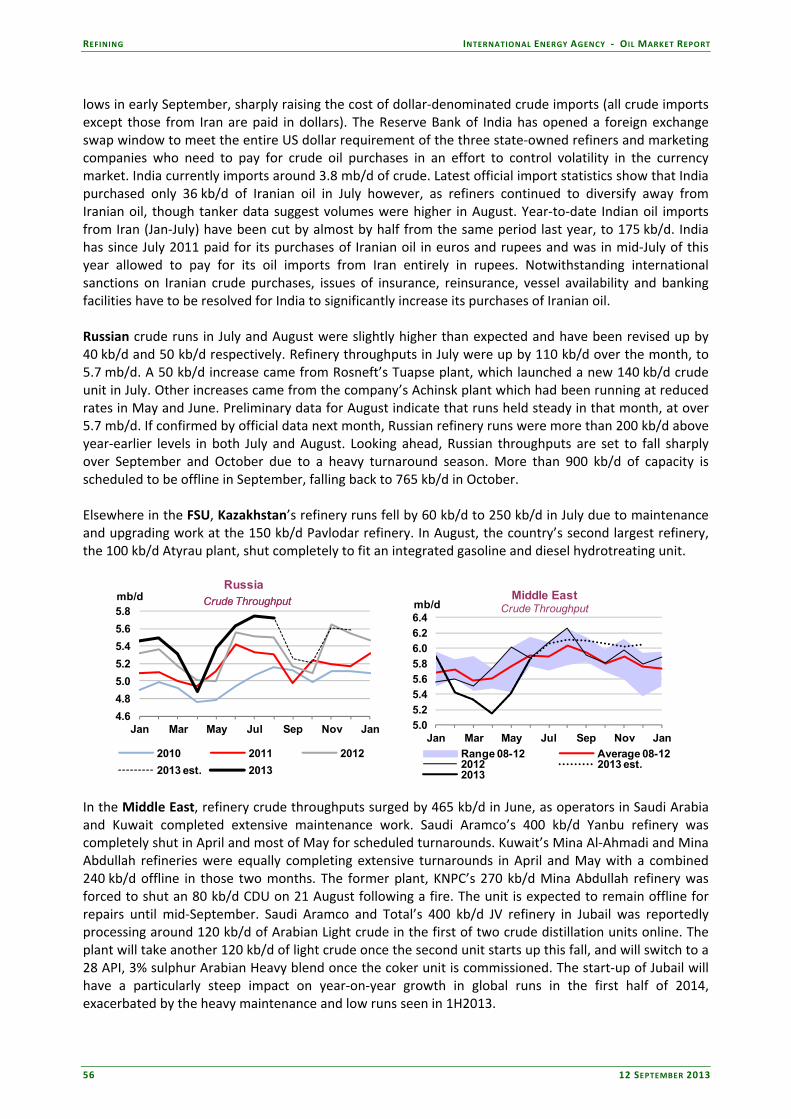
REFINING INTERNATIONAL ENERGY AGENCY ‐ OIL MARKET REPORT
56 12 SEPTEMBER 2013
lows in early September, sharply raising the cost of dollar‐denominated crude imports (all crude imports except those from Iran are paid in dollars). The Reserve Bank of India has opened a foreign exchange swap window to meet the entire US dollar requirement of the three state‐owned refiners and marketing companies who need to pay for crude oil purchases in an effort to control volatility in the currency market. India currently imports around 3.8 mb/d of crude. Latest official import statistics show that India purchased only 36 kb/d of Iranian oil in July however, as refiners continued to diversify away from Iranian oil, though tanker data suggest volumes were higher in August. Year‐to‐date Indian oil imports from Iran (Jan‐July) have been cut by almost by half from the same period last year, to 175 kb/d. India has since July 2011 paid for its purchases of Iranian oil in euros and rupees and was in mid‐July of this year allowed to pay for its oil imports from Iran entirely in rupees. Notwithstanding international sanctions on Iranian crude purchases, issues of insurance, reinsurance, vessel availability and banking facilities have to be resolved for India to significantly increase its purchases of Iranian oil. Russian crude runs in July and August were slightly higher than expected and have been revised up by 40 kb/d and 50 kb/d respectively. Refinery throughputs in July were up by 110 kb/d over the month, to 5.7 mb/d. A 50 kb/d increase came from Rosneft’s Tuapse plant, which launched a new 140 kb/d crude unit in July. Other increases came from the company’s Achinsk plant which had been running at reduced rates in May and June. Preliminary data for August indicate that runs held steady in that month, at over 5.7 mb/d. If confirmed by official data next month, Russian refinery runs were more than 200 kb/d above year‐earlier levels in both July and August. Looking ahead, Russian throughputs are set to fall sharply over September and October due to a heavy turnaround season. More than 900 kb/d of capacity is scheduled to be offline in September, falling back to 765 kb/d in October. Elsewhere in the FSU, Kazakhstan’s refinery runs fell by 60 kb/d to 250 kb/d in July due to maintenance and upgrading work at the 150 kb/d Pavlodar refinery. In August, the country’s second largest refinery, the 100 kb/d Atyrau plant, shut completely to fit an integrated gasoline and diesel hydrotreating unit.
4.6
4.8
5.0
5.2
5.4
5.6
5.8
Jan Mar May Jul Sep Nov Jan
mb/dRussia
2010 2011 2012
2013 est. 2013
Crude ThroughputCrude Throughput
5.0
5.2
5.4
5.6
5.8
6.0
6.2
6.4
Jan Mar May Jul Sep Nov Jan
mb/dMiddle East
Crude Throughput
Range 08-12 Average 08-122012 2013 est. 2013
In the Middle East, refinery crude throughputs surged by 465 kb/d in June, as operators in Saudi Arabia and Kuwait completed extensive maintenance work. Saudi Aramco’s 400 kb/d Yanbu refinery was completely shut in April and most of May for scheduled turnarounds. Kuwait’s Mina Al‐Ahmadi and Mina Abdullah refineries were equally completing extensive turnarounds in April and May with a combined 240 kb/d offline in those two months. The former plant, KNPC’s 270 kb/d Mina Abdullah refinery was forced to shut an 80 kb/d CDU on 21 August following a fire. The unit is expected to remain offline for repairs until mid‐September. Saudi Aramco and Total’s 400 kb/d JV refinery in Jubail was reportedly processing around 120 kb/d of Arabian Light crude in the first of two crude distillation units online. The plant will take another 120 kb/d of light crude once the second unit starts up this fall, and will switch to a 28 API, 3% sulphur Arabian Heavy blend once the coker unit is commissioned. The start‐up of Jubail will have a particularly steep impact on year‐on‐year growth in global runs in the first half of 2014, exacerbated by the heavy maintenance and low runs seen in 1H2013.
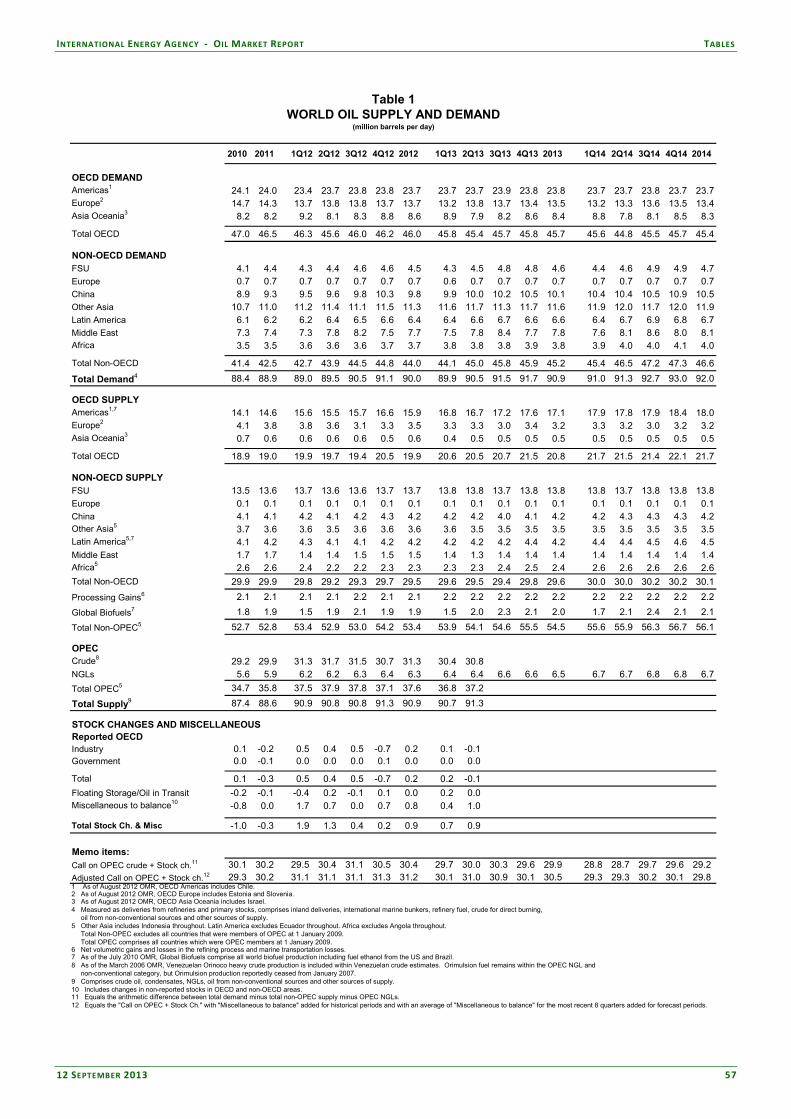
INTERNATIONAL ENERGY AGENCY ‐ OIL MARKET REPORT TABLES
12 SEPTEMBER 2013 57
Table 1 - World Oil Supply and Demand Table 1WORLD OIL SUPPLY AND DEMAND
(million barrels per day)
2010 2011 1Q12 2Q12 3Q12 4Q12 2012 1Q13 2Q13 3Q13 4Q13 2013 1Q14 2Q14 3Q14 4Q14 2014
OECD DEMANDAmericas1 24.1 24.0 23.4 23.7 23.8 23.8 23.7 23.7 23.7 23.9 23.8 23.8 23.7 23.7 23.8 23.7 23.7Europe2 14.7 14.3 13.7 13.8 13.8 13.7 13.7 13.2 13.8 13.7 13.4 13.5 13.2 13.3 13.6 13.5 13.4Asia Oceania3 8.2 8.2 9.2 8.1 8.3 8.8 8.6 8.9 7.9 8.2 8.6 8.4 8.8 7.8 8.1 8.5 8.3
Total OECD 47.0 46.5 46.3 45.6 46.0 46.2 46.0 45.8 45.4 45.7 45.8 45.7 45.6 44.8 45.5 45.7 45.4
NON-OECD DEMANDFSU 4.1 4.4 4.3 4.4 4.6 4.6 4.5 4.3 4.5 4.8 4.8 4.6 4.4 4.6 4.9 4.9 4.7Europe 0.7 0.7 0.7 0.7 0.7 0.7 0.7 0.6 0.7 0.7 0.7 0.7 0.7 0.7 0.7 0.7 0.7China 8.9 9.3 9.5 9.6 9.8 10.3 9.8 9.9 10.0 10.2 10.5 10.1 10.4 10.4 10.5 10.9 10.5Other Asia 10.7 11.0 11.2 11.4 11.1 11.5 11.3 11.6 11.7 11.3 11.7 11.6 11.9 12.0 11.7 12.0 11.9Latin America 6.1 6.2 6.2 6.4 6.5 6.6 6.4 6.4 6.6 6.7 6.6 6.6 6.4 6.7 6.9 6.8 6.7Middle East 7.3 7.4 7.3 7.8 8.2 7.5 7.7 7.5 7.8 8.4 7.7 7.8 7.6 8.1 8.6 8.0 8.1Africa 3.5 3.5 3.6 3.6 3.6 3.7 3.7 3.8 3.8 3.8 3.9 3.8 3.9 4.0 4.0 4.1 4.0
Total Non-OECD 41.4 42.5 42.7 43.9 44.5 44.8 44.0 44.1 45.0 45.8 45.9 45.2 45.4 46.5 47.2 47.3 46.6
Total Demand4 88.4 88.9 89.0 89.5 90.5 91.1 90.0 89.9 90.5 91.5 91.7 90.9 91.0 91.3 92.7 93.0 92.0
OECD SUPPLYAmericas1,7 14.1 14.6 15.6 15.5 15.7 16.6 15.9 16.8 16.7 17.2 17.6 17.1 17.9 17.8 17.9 18.4 18.0Europe2 4.1 3.8 3.8 3.6 3.1 3.3 3.5 3.3 3.3 3.0 3.4 3.2 3.3 3.2 3.0 3.2 3.2Asia Oceania3 0.7 0.6 0.6 0.6 0.6 0.5 0.6 0.4 0.5 0.5 0.5 0.5 0.5 0.5 0.5 0.5 0.5
Total OECD 18.9 19.0 19.9 19.7 19.4 20.5 19.9 20.6 20.5 20.7 21.5 20.8 21.7 21.5 21.4 22.1 21.7
NON-OECD SUPPLYFSU 13.5 13.6 13.7 13.6 13.6 13.7 13.7 13.8 13.8 13.7 13.8 13.8 13.8 13.7 13.8 13.8 13.8Europe 0.1 0.1 0.1 0.1 0.1 0.1 0.1 0.1 0.1 0.1 0.1 0.1 0.1 0.1 0.1 0.1 0.1China 4.1 4.1 4.2 4.1 4.2 4.3 4.2 4.2 4.2 4.0 4.1 4.2 4.2 4.3 4.3 4.3 4.2Other Asia5 3.7 3.6 3.6 3.5 3.6 3.6 3.6 3.6 3.5 3.5 3.5 3.5 3.5 3.5 3.5 3.5 3.5Latin America5,7 4.1 4.2 4.3 4.1 4.1 4.2 4.2 4.2 4.2 4.2 4.4 4.2 4.4 4.4 4.5 4.6 4.5Middle East 1.7 1.7 1.4 1.4 1.5 1.5 1.5 1.4 1.3 1.4 1.4 1.4 1.4 1.4 1.4 1.4 1.4Africa5 2.6 2.6 2.4 2.2 2.2 2.3 2.3 2.3 2.3 2.4 2.5 2.4 2.6 2.6 2.6 2.6 2.6
Total Non-OECD 29.9 29.9 29.8 29.2 29.3 29.7 29.5 29.6 29.5 29.4 29.8 29.6 30.0 30.0 30.2 30.2 30.1
Processing Gains6 2.1 2.1 2.1 2.1 2.2 2.1 2.1 2.2 2.2 2.2 2.2 2.2 2.2 2.2 2.2 2.2 2.2
Global Biofuels7 1.8 1.9 1.5 1.9 2.1 1.9 1.9 1.5 2.0 2.3 2.1 2.0 1.7 2.1 2.4 2.1 2.1
Total Non-OPEC5 52.7 52.8 53.4 52.9 53.0 54.2 53.4 53.9 54.1 54.6 55.5 54.5 55.6 55.9 56.3 56.7 56.1
OPECCrude8 29.2 29.9 31.3 31.7 31.5 30.7 31.3 30.4 30.8NGLs 5.6 5.9 6.2 6.2 6.3 6.4 6.3 6.4 6.4 6.6 6.6 6.5 6.7 6.7 6.8 6.8 6.7
Total OPEC5 34.7 35.8 37.5 37.9 37.8 37.1 37.6 36.8 37.2
Total Supply9 87.4 88.6 90.9 90.8 90.8 91.3 90.9 90.7 91.3
STOCK CHANGES AND MISCELLANEOUSReported OECDIndustry 0.1 -0.2 0.5 0.4 0.5 -0.7 0.2 0.1 -0.1Government 0.0 -0.1 0.0 0.0 0.0 0.1 0.0 0.0 0.0
Total 0.1 -0.3 0.5 0.4 0.5 -0.7 0.2 0.2 -0.1
Floating Storage/Oil in Transit -0.2 -0.1 -0.4 0.2 -0.1 0.1 0.0 0.2 0.0Miscellaneous to balance10 -0.8 0.0 1.7 0.7 0.0 0.7 0.8 0.4 1.0
Total Stock Ch. & Misc -1.0 -0.3 1.9 1.3 0.4 0.2 0.9 0.7 0.9
Memo items:
Call on OPEC crude + Stock ch.11 30.1 30.2 29.5 30.4 31.1 30.5 30.4 29.7 30.0 30.3 29.6 29.9 28.8 28.7 29.7 29.6 29.2Adjusted Call on OPEC + Stock ch.12 29.3 30.2 31.1 31.1 31.1 31.3 31.2 30.1 31.0 30.9 30.1 30.5 29.3 29.3 30.2 30.1 29.81 As of August 2012 OMR, OECD Americas includes Chile.2 As of August 2012 OMR, OECD Europe includes Estonia and Slovenia.3 As of August 2012 OMR, OECD Asia Oceania includes Israel.4 Measured as deliveries from refineries and primary stocks, comprises inland deliveries, international marine bunkers, refinery fuel, crude for direct burning, oil from non-conventional sources and other sources of supply.5 Other Asia includes Indonesia throughout. Latin America excludes Ecuador throughout. Africa excludes Angola throughout. Total Non-OPEC excludes all countries that were members of OPEC at 1 January 2009. Total OPEC comprises all countries which were OPEC members at 1 January 2009. 6 Net volumetric gains and losses in the refining process and marine transportation losses.7 As of the July 2010 OMR, Global Biofuels comprise all world biofuel production including fuel ethanol from the US and Brazil.8 As of the March 2006 OMR, Venezuelan Orinoco heavy crude production is included within Venezuelan crude estimates. Orimulsion fuel remains within the OPEC NGL and non-conventional category, but Orimulsion production reportedly ceased from January 2007.9 Comprises crude oil, condensates, NGLs, oil from non-conventional sources and other sources of supply.10 Includes changes in non-reported stocks in OECD and non-OECD areas.11 Equals the arithmetic difference between total demand minus total non-OPEC supply minus OPEC NGLs.12 Equals the "Call on OPEC + Stock Ch." with "Miscellaneous to balance" added for historical periods and with an average of "Miscellaneous to balance" for the most recent 8 quarters added for forecast periods.

TABLES INTERNATIONAL ENERGY AGENCY ‐ OIL MARKET REPORT
58 12 SEPTEMBER 2013
Table 1a - World Oil Supply and Demand: Changes from Last Month’s Table 1
Table 1aWORLD OIL SUPPLY AND DEMAND: CHANGES FROM LAST MONTH'S TABLE 1
(million barrels per day)
2010 2011 1Q12 2Q12 3Q12 4Q12 2012 1Q13 2Q13 3Q13 4Q13 2013 1Q14 2Q14 3Q14 4Q14 2014
OECD DEMANDAmericas - - - - - - - - -0.1 0.1 - - - - - - -Europe - - - - - - - - - 0.1 -0.1 - - - - - -Asia Oceania - - - - - - - - - 0.1 - - - - - - -
Total OECD - - - - - - - - - 0.2 -0.1 - - 0.1 0.1 - -
NON-OECD DEMANDFSU - - - - - - - - - - - - - - - - -Europe - - - - - - - - - - - - - - - - -China - - - - - - - - - 0.1 - - - - - - -Other Asia - - - - -0.1 -0.1 - -0.1 0.1 -0.1 -0.1 - - - -0.1 -0.1 -Latin America - - - - - - - - - - - - - - - - -Middle East - - - - - - - - - - - - - - - - -Africa - - 0.1 0.1 0.1 0.1 0.1 0.1 0.1 0.1 0.1 0.1 0.1 0.1 0.1 0.1 0.1
Total Non-OECD - 0.1 - 0.2 0.1 - 0.1 - 0.1 - - - 0.1 0.1 - - -
Total Demand - 0.1 - 0.2 0.1 - 0.1 - 0.1 0.3 -0.1 0.1 - 0.1 0.1 0.1 0.1
OECD SUPPLYAmericas - - - - - - - - -0.1 0.1 - - 0.1 0.1 0.1 0.1 0.1Europe - - - - - - - 0.1 0.1 - - - - - - - -Asia Oceania - - - - - - - - - - - - - - - - -
Total OECD - - - - - - - 0.1 - 0.2 0.1 0.1 0.1 0.1 0.1 0.1 0.1
NON-OECD SUPPLYFSU - - - - - - - - - 0.2 0.1 0.1 0.1 0.1 0.1 0.1 0.1Europe - - - - - - - - - - - - - - - - -China - - - - - - - - - -0.2 -0.1 -0.1 - - - - -Other Asia - - - - - - - - - - - - - - - - -Latin America - - - - - - - - - - - - - - - - -Middle East - - - - - - - - - - - - - - - - -Africa - - - - - - - - - - - - 0.1 0.1 0.1 - 0.1
Total Non-OECD - - - - - - - - - -0.1 - - 0.1 0.2 0.1 0.1 0.1
Processing Gains - - - - - - - - - - - - - - - - -
Global Biofuels - - - - - - - - - -0.1 - - - - - - -
Total Non-OPEC - - - - -0.1 -0.1 - - - - 0.1 - 0.3 0.3 0.3 0.3 0.3
OPECCrude - - - - - - - - -NGLs - - - - - - - - - - - - - - - - -
Total OPEC - - - - - - - - -
Total Supply - - - - -0.1 -0.1 - 0.1 -
STOCK CHANGES AND MISCELLANEOUSREPORTED OECDIndustry - - - - - - - - -0.2Government - - - - - - - - -
Total - - - - - - - - -0.2
Floating Storage/Oil in Transit - - - - - - - - -Miscellaneous to balance - -0.1 -0.1 -0.2 -0.1 -0.1 -0.1 - 0.1
Total Stock Ch. & Misc - -0.1 -0.1 -0.2 -0.1 -0.1 -0.1 - -0.1
Memo items:Call on OPEC crude + Stock ch. - 0.1 0.1 0.2 0.1 0.1 0.1 - 0.1 0.2 -0.1 - -0.2 -0.1 -0.2 -0.2 -0.2Adjusted Call on OPEC + Stock ch. - - - - - - - - 0.2 0.2 -0.2 - -0.3 -0.2 -0.2 -0.3 -0.2When submitting their monthly oil statistics, OECD Member countries periodically update data for prior periods. Similar updates to non-OECD data can occur.
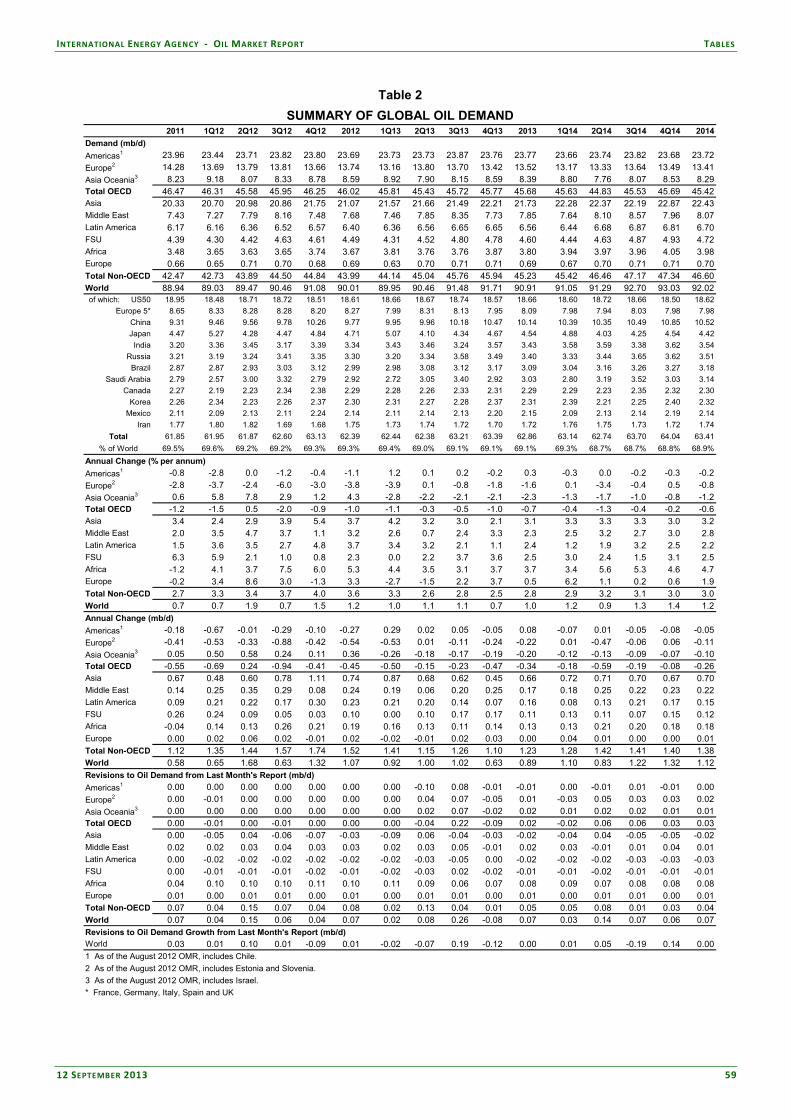
INTERNATIONAL ENERGY AGENCY ‐ OIL MARKET REPORT TABLES
12 SEPTEMBER 2013 59
Table 2 - Summary of Global Oil Demand Table 2
SUMMARY OF GLOBAL OIL DEMAND2011 1Q12 2Q12 3Q12 4Q12 2012 1Q13 2Q13 3Q13 4Q13 2013 1Q14 2Q14 3Q14 4Q14 2014
Demand (mb/d)
Americas1 23.96 23.44 23.71 23.82 23.80 23.69 23.73 23.73 23.87 23.76 23.77 23.66 23.74 23.82 23.68 23.72
Europe2 14.28 13.69 13.79 13.81 13.66 13.74 13.16 13.80 13.70 13.42 13.52 13.17 13.33 13.64 13.49 13.41
Asia Oceania3 8.23 9.18 8.07 8.33 8.78 8.59 8.92 7.90 8.15 8.59 8.39 8.80 7.76 8.07 8.53 8.29Total OECD 46.47 46.31 45.58 45.95 46.25 46.02 45.81 45.43 45.72 45.77 45.68 45.63 44.83 45.53 45.69 45.42Asia 20.33 20.70 20.98 20.86 21.75 21.07 21.57 21.66 21.49 22.21 21.73 22.28 22.37 22.19 22.87 22.43Middle East 7.43 7.27 7.79 8.16 7.48 7.68 7.46 7.85 8.35 7.73 7.85 7.64 8.10 8.57 7.96 8.07Latin America 6.17 6.16 6.36 6.52 6.57 6.40 6.36 6.56 6.65 6.65 6.56 6.44 6.68 6.87 6.81 6.70FSU 4.39 4.30 4.42 4.63 4.61 4.49 4.31 4.52 4.80 4.78 4.60 4.44 4.63 4.87 4.93 4.72Africa 3.48 3.65 3.63 3.65 3.74 3.67 3.81 3.76 3.76 3.87 3.80 3.94 3.97 3.96 4.05 3.98Europe 0.66 0.65 0.71 0.70 0.68 0.69 0.63 0.70 0.71 0.71 0.69 0.67 0.70 0.71 0.71 0.70Total Non-OECD 42.47 42.73 43.89 44.50 44.84 43.99 44.14 45.04 45.76 45.94 45.23 45.42 46.46 47.17 47.34 46.60World 88.94 89.03 89.47 90.46 91.08 90.01 89.95 90.46 91.48 91.71 90.91 91.05 91.29 92.70 93.03 92.02of which: US50 18.95 18.48 18.71 18.72 18.51 18.61 18.66 18.67 18.74 18.57 18.66 18.60 18.72 18.66 18.50 18.62
Europe 5* 8.65 8.33 8.28 8.28 8.20 8.27 7.99 8.31 8.13 7.95 8.09 7.98 7.94 8.03 7.98 7.98
China 9.31 9.46 9.56 9.78 10.26 9.77 9.95 9.96 10.18 10.47 10.14 10.39 10.35 10.49 10.85 10.52
Japan 4.47 5.27 4.28 4.47 4.84 4.71 5.07 4.10 4.34 4.67 4.54 4.88 4.03 4.25 4.54 4.42
India 3.20 3.36 3.45 3.17 3.39 3.34 3.43 3.46 3.24 3.57 3.43 3.58 3.59 3.38 3.62 3.54
Russia 3.21 3.19 3.24 3.41 3.35 3.30 3.20 3.34 3.58 3.49 3.40 3.33 3.44 3.65 3.62 3.51
Brazil 2.87 2.87 2.93 3.03 3.12 2.99 2.98 3.08 3.12 3.17 3.09 3.04 3.16 3.26 3.27 3.18
Saudi Arabia 2.79 2.57 3.00 3.32 2.79 2.92 2.72 3.05 3.40 2.92 3.03 2.80 3.19 3.52 3.03 3.14
Canada 2.27 2.19 2.23 2.34 2.38 2.29 2.28 2.26 2.33 2.31 2.29 2.29 2.23 2.35 2.32 2.30
Korea 2.26 2.34 2.23 2.26 2.37 2.30 2.31 2.27 2.28 2.37 2.31 2.39 2.21 2.25 2.40 2.32
Mexico 2.11 2.09 2.13 2.11 2.24 2.14 2.11 2.14 2.13 2.20 2.15 2.09 2.13 2.14 2.19 2.14
Iran 1.77 1.80 1.82 1.69 1.68 1.75 1.73 1.74 1.72 1.70 1.72 1.76 1.75 1.73 1.72 1.74
Total 61.85 61.95 61.87 62.60 63.13 62.39 62.44 62.38 63.21 63.39 62.86 63.14 62.74 63.70 64.04 63.41
% of World 69.5% 69.6% 69.2% 69.2% 69.3% 69.3% 69.4% 69.0% 69.1% 69.1% 69.1% 69.3% 68.7% 68.7% 68.8% 68.9%
Annual Change (% per annum)
Americas1 -0.8 -2.8 0.0 -1.2 -0.4 -1.1 1.2 0.1 0.2 -0.2 0.3 -0.3 0.0 -0.2 -0.3 -0.2
Europe2 -2.8 -3.7 -2.4 -6.0 -3.0 -3.8 -3.9 0.1 -0.8 -1.8 -1.6 0.1 -3.4 -0.4 0.5 -0.8
Asia Oceania3 0.6 5.8 7.8 2.9 1.2 4.3 -2.8 -2.2 -2.1 -2.1 -2.3 -1.3 -1.7 -1.0 -0.8 -1.2Total OECD -1.2 -1.5 0.5 -2.0 -0.9 -1.0 -1.1 -0.3 -0.5 -1.0 -0.7 -0.4 -1.3 -0.4 -0.2 -0.6Asia 3.4 2.4 2.9 3.9 5.4 3.7 4.2 3.2 3.0 2.1 3.1 3.3 3.3 3.3 3.0 3.2Middle East 2.0 3.5 4.7 3.7 1.1 3.2 2.6 0.7 2.4 3.3 2.3 2.5 3.2 2.7 3.0 2.8Latin America 1.5 3.6 3.5 2.7 4.8 3.7 3.4 3.2 2.1 1.1 2.4 1.2 1.9 3.2 2.5 2.2FSU 6.3 5.9 2.1 1.0 0.8 2.3 0.0 2.2 3.7 3.6 2.5 3.0 2.4 1.5 3.1 2.5Africa -1.2 4.1 3.7 7.5 6.0 5.3 4.4 3.5 3.1 3.7 3.7 3.4 5.6 5.3 4.6 4.7Europe -0.2 3.4 8.6 3.0 -1.3 3.3 -2.7 -1.5 2.2 3.7 0.5 6.2 1.1 0.2 0.6 1.9Total Non-OECD 2.7 3.3 3.4 3.7 4.0 3.6 3.3 2.6 2.8 2.5 2.8 2.9 3.2 3.1 3.0 3.0World 0.7 0.7 1.9 0.7 1.5 1.2 1.0 1.1 1.1 0.7 1.0 1.2 0.9 1.3 1.4 1.2Annual Change (mb/d)
Americas1 -0.18 -0.67 -0.01 -0.29 -0.10 -0.27 0.29 0.02 0.05 -0.05 0.08 -0.07 0.01 -0.05 -0.08 -0.05
Europe2 -0.41 -0.53 -0.33 -0.88 -0.42 -0.54 -0.53 0.01 -0.11 -0.24 -0.22 0.01 -0.47 -0.06 0.06 -0.11
Asia Oceania3 0.05 0.50 0.58 0.24 0.11 0.36 -0.26 -0.18 -0.17 -0.19 -0.20 -0.12 -0.13 -0.09 -0.07 -0.10Total OECD -0.55 -0.69 0.24 -0.94 -0.41 -0.45 -0.50 -0.15 -0.23 -0.47 -0.34 -0.18 -0.59 -0.19 -0.08 -0.26Asia 0.67 0.48 0.60 0.78 1.11 0.74 0.87 0.68 0.62 0.45 0.66 0.72 0.71 0.70 0.67 0.70Middle East 0.14 0.25 0.35 0.29 0.08 0.24 0.19 0.06 0.20 0.25 0.17 0.18 0.25 0.22 0.23 0.22Latin America 0.09 0.21 0.22 0.17 0.30 0.23 0.21 0.20 0.14 0.07 0.16 0.08 0.13 0.21 0.17 0.15FSU 0.26 0.24 0.09 0.05 0.03 0.10 0.00 0.10 0.17 0.17 0.11 0.13 0.11 0.07 0.15 0.12Africa -0.04 0.14 0.13 0.26 0.21 0.19 0.16 0.13 0.11 0.14 0.13 0.13 0.21 0.20 0.18 0.18Europe 0.00 0.02 0.06 0.02 -0.01 0.02 -0.02 -0.01 0.02 0.03 0.00 0.04 0.01 0.00 0.00 0.01Total Non-OECD 1.12 1.35 1.44 1.57 1.74 1.52 1.41 1.15 1.26 1.10 1.23 1.28 1.42 1.41 1.40 1.38World 0.58 0.65 1.68 0.63 1.32 1.07 0.92 1.00 1.02 0.63 0.89 1.10 0.83 1.22 1.32 1.12Revisions to Oil Demand from Last Month's Report (mb/d)
Americas1 0.00 0.00 0.00 0.00 0.00 0.00 0.00 -0.10 0.08 -0.01 -0.01 0.00 -0.01 0.01 -0.01 0.00
Europe2 0.00 -0.01 0.00 0.00 0.00 0.00 0.00 0.04 0.07 -0.05 0.01 -0.03 0.05 0.03 0.03 0.02
Asia Oceania3 0.00 0.00 0.00 0.00 0.00 0.00 0.00 0.02 0.07 -0.02 0.02 0.01 0.02 0.02 0.01 0.01Total OECD 0.00 -0.01 0.00 -0.01 0.00 0.00 0.00 -0.04 0.22 -0.09 0.02 -0.02 0.06 0.06 0.03 0.03Asia 0.00 -0.05 0.04 -0.06 -0.07 -0.03 -0.09 0.06 -0.04 -0.03 -0.02 -0.04 0.04 -0.05 -0.05 -0.02Middle East 0.02 0.02 0.03 0.04 0.03 0.03 0.02 0.03 0.05 -0.01 0.02 0.03 -0.01 0.01 0.04 0.01Latin America 0.00 -0.02 -0.02 -0.02 -0.02 -0.02 -0.02 -0.03 -0.05 0.00 -0.02 -0.02 -0.02 -0.03 -0.03 -0.03FSU 0.00 -0.01 -0.01 -0.01 -0.02 -0.01 -0.02 -0.03 0.02 -0.02 -0.01 -0.01 -0.02 -0.01 -0.01 -0.01Africa 0.04 0.10 0.10 0.10 0.11 0.10 0.11 0.09 0.06 0.07 0.08 0.09 0.07 0.08 0.08 0.08Europe 0.01 0.00 0.01 0.01 0.00 0.01 0.00 0.01 0.01 0.00 0.01 0.00 0.01 0.01 0.00 0.01Total Non-OECD 0.07 0.04 0.15 0.07 0.04 0.08 0.02 0.13 0.04 0.01 0.05 0.05 0.08 0.01 0.03 0.04World 0.07 0.04 0.15 0.06 0.04 0.07 0.02 0.08 0.26 -0.08 0.07 0.03 0.14 0.07 0.06 0.07Revisions to Oil Demand Growth from Last Month's Report (mb/d)World 0.03 0.01 0.10 0.01 -0.09 0.01 -0.02 -0.07 0.19 -0.12 0.00 0.01 0.05 -0.19 0.14 0.001 As of the August 2012 OMR, includes Chile.
2 As of the August 2012 OMR, includes Estonia and Slovenia.
3 As of the August 2012 OMR, includes Israel.
* France, Germany, Italy, Spain and UK
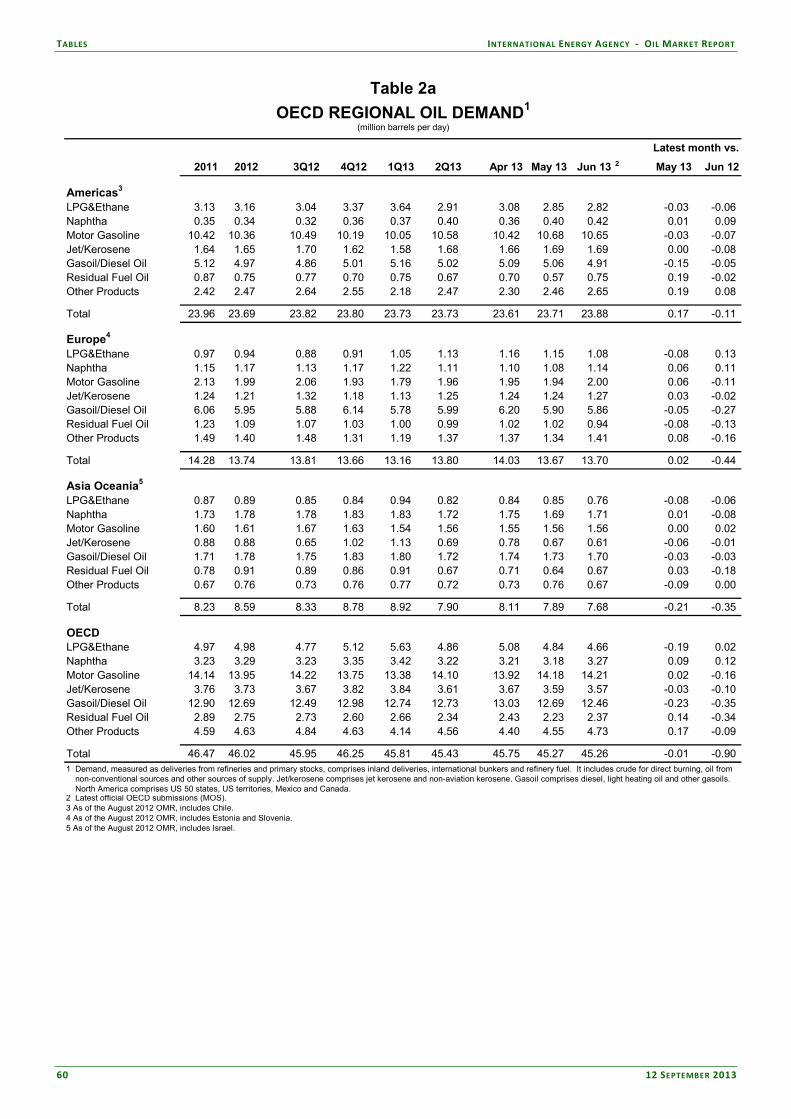
TABLES INTERNATIONAL ENERGY AGENCY ‐ OIL MARKET REPORT
60 12 SEPTEMBER 2013
Table 2a - OECD Regional Oil Demand
Table 2a
OECD REGIONAL OIL DEMAND1
(million barrels per day)
2011 2012 3Q12 4Q12 1Q13 2Q13 Apr 13 May 13 Jun 13 2 May 13 Jun 12
Americas3
LPG&Ethane 3.13 3.16 3.04 3.37 3.64 2.91 3.08 2.85 2.82 -0.03 -0.06 Naphtha 0.35 0.34 0.32 0.36 0.37 0.40 0.36 0.40 0.42 0.01 0.09 Motor Gasoline 10.42 10.36 10.49 10.19 10.05 10.58 10.42 10.68 10.65 -0.03 -0.07 Jet/Kerosene 1.64 1.65 1.70 1.62 1.58 1.68 1.66 1.69 1.69 0.00 -0.08 Gasoil/Diesel Oil 5.12 4.97 4.86 5.01 5.16 5.02 5.09 5.06 4.91 -0.15 -0.05 Residual Fuel Oil 0.87 0.75 0.77 0.70 0.75 0.67 0.70 0.57 0.75 0.19 -0.02 Other Products 2.42 2.47 2.64 2.55 2.18 2.47 2.30 2.46 2.65 0.19 0.08
Total 23.96 23.69 23.82 23.80 23.73 23.73 23.61 23.71 23.88 0.17 -0.11
Europe4
LPG&Ethane 0.97 0.94 0.88 0.91 1.05 1.13 1.16 1.15 1.08 -0.08 0.13 Naphtha 1.15 1.17 1.13 1.17 1.22 1.11 1.10 1.08 1.14 0.06 0.11 Motor Gasoline 2.13 1.99 2.06 1.93 1.79 1.96 1.95 1.94 2.00 0.06 -0.11 Jet/Kerosene 1.24 1.21 1.32 1.18 1.13 1.25 1.24 1.24 1.27 0.03 -0.02 Gasoil/Diesel Oil 6.06 5.95 5.88 6.14 5.78 5.99 6.20 5.90 5.86 -0.05 -0.27 Residual Fuel Oil 1.23 1.09 1.07 1.03 1.00 0.99 1.02 1.02 0.94 -0.08 -0.13 Other Products 1.49 1.40 1.48 1.31 1.19 1.37 1.37 1.34 1.41 0.08 -0.16
Total 14.28 13.74 13.81 13.66 13.16 13.80 14.03 13.67 13.70 0.02 -0.44
Asia Oceania5
LPG&Ethane 0.87 0.89 0.85 0.84 0.94 0.82 0.84 0.85 0.76 -0.08 -0.06 Naphtha 1.73 1.78 1.78 1.83 1.83 1.72 1.75 1.69 1.71 0.01 -0.08 Motor Gasoline 1.60 1.61 1.67 1.63 1.54 1.56 1.55 1.56 1.56 0.00 0.02 Jet/Kerosene 0.88 0.88 0.65 1.02 1.13 0.69 0.78 0.67 0.61 -0.06 -0.01 Gasoil/Diesel Oil 1.71 1.78 1.75 1.83 1.80 1.72 1.74 1.73 1.70 -0.03 -0.03 Residual Fuel Oil 0.78 0.91 0.89 0.86 0.91 0.67 0.71 0.64 0.67 0.03 -0.18 Other Products 0.67 0.76 0.73 0.76 0.77 0.72 0.73 0.76 0.67 -0.09 0.00
Total 8.23 8.59 8.33 8.78 8.92 7.90 8.11 7.89 7.68 -0.21 -0.35
OECDLPG&Ethane 4.97 4.98 4.77 5.12 5.63 4.86 5.08 4.84 4.66 -0.19 0.02 Naphtha 3.23 3.29 3.23 3.35 3.42 3.22 3.21 3.18 3.27 0.09 0.12 Motor Gasoline 14.14 13.95 14.22 13.75 13.38 14.10 13.92 14.18 14.21 0.02 -0.16 Jet/Kerosene 3.76 3.73 3.67 3.82 3.84 3.61 3.67 3.59 3.57 -0.03 -0.10 Gasoil/Diesel Oil 12.90 12.69 12.49 12.98 12.74 12.73 13.03 12.69 12.46 -0.23 -0.35 Residual Fuel Oil 2.89 2.75 2.73 2.60 2.66 2.34 2.43 2.23 2.37 0.14 -0.34 Other Products 4.59 4.63 4.84 4.63 4.14 4.56 4.40 4.55 4.73 0.17 -0.09
Total 46.47 46.02 45.95 46.25 45.81 45.43 45.75 45.27 45.26 -0.01 -0.90 1 Demand, measured as deliveries from refineries and primary stocks, comprises inland deliveries, international bunkers and refinery fuel. It includes crude for direct burning, oil from non-conventional sources and other sources of supply. Jet/kerosene comprises jet kerosene and non-aviation kerosene. Gasoil comprises diesel, light heating oil and other gasoils. North America comprises US 50 states, US territories, Mexico and Canada. 2 Latest official OECD submissions (MOS).3 As of the August 2012 OMR, includes Chile.4 As of the August 2012 OMR, includes Estonia and Slovenia.5 As of the August 2012 OMR, includes Israel.
Latest month vs.
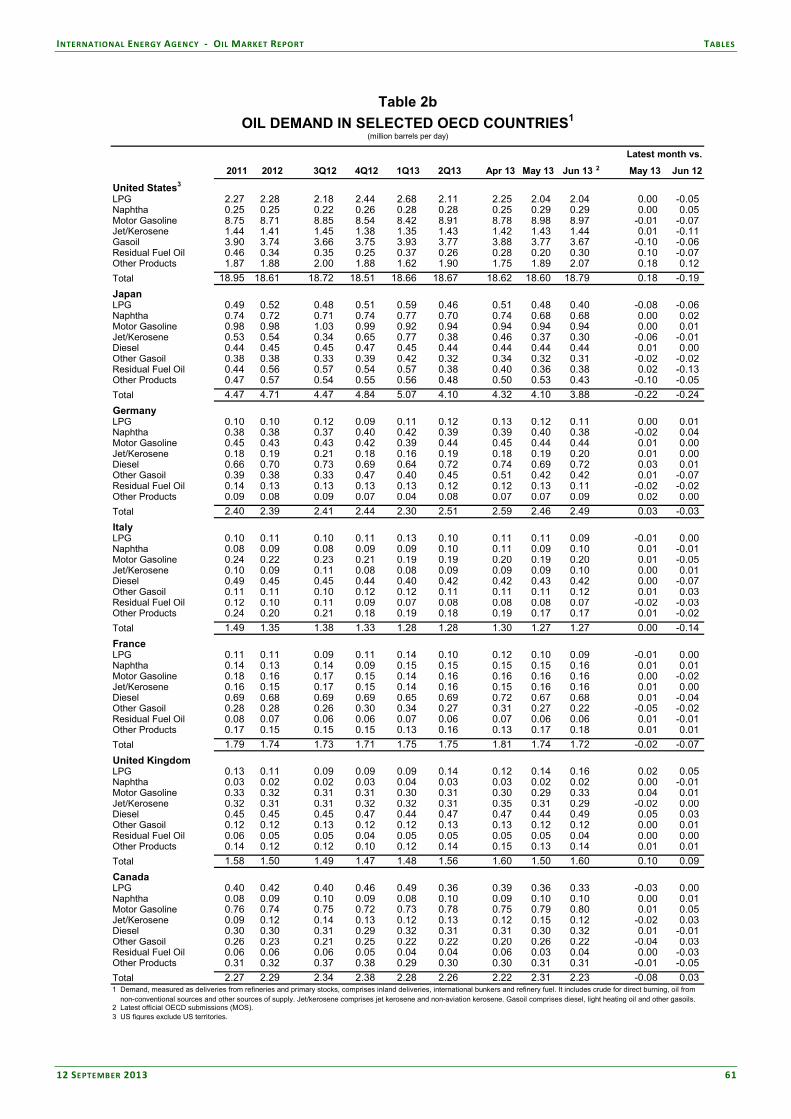
INTERNATIONAL ENERGY AGENCY ‐ OIL MARKET REPORT TABLES
12 SEPTEMBER 2013 61
Table 2b - OECD Oil Demand and % Growth in Demand in Selected OECD Countries Table 2b
OIL DEMAND IN SELECTED OECD COUNTRIES1
(million barrels per day)
2011 2012 3Q12 4Q12 1Q13 2Q13 Apr 13 May 13 Jun 13 2 May 13 Jun 12
United States3
LPG 2.27 2.28 2.18 2.44 2.68 2.11 2.25 2.04 2.04 0.00 -0.05 Naphtha 0.25 0.25 0.22 0.26 0.28 0.28 0.25 0.29 0.29 0.00 0.05 Motor Gasoline 8.75 8.71 8.85 8.54 8.42 8.91 8.78 8.98 8.97 -0.01 -0.07 Jet/Kerosene 1.44 1.41 1.45 1.38 1.35 1.43 1.42 1.43 1.44 0.01 -0.11 Gasoil 3.90 3.74 3.66 3.75 3.93 3.77 3.88 3.77 3.67 -0.10 -0.06 Residual Fuel Oil 0.46 0.34 0.35 0.25 0.37 0.26 0.28 0.20 0.30 0.10 -0.07 Other Products 1.87 1.88 2.00 1.88 1.62 1.90 1.75 1.89 2.07 0.18 0.12
Total 18.95 18.61 18.72 18.51 18.66 18.67 18.62 18.60 18.79 0.18 -0.19
JapanLPG 0.49 0.52 0.48 0.51 0.59 0.46 0.51 0.48 0.40 -0.08 -0.06 Naphtha 0.74 0.72 0.71 0.74 0.77 0.70 0.74 0.68 0.68 0.00 0.02 Motor Gasoline 0.98 0.98 1.03 0.99 0.92 0.94 0.94 0.94 0.94 0.00 0.01 Jet/Kerosene 0.53 0.54 0.34 0.65 0.77 0.38 0.46 0.37 0.30 -0.06 -0.01 Diesel 0.44 0.45 0.45 0.47 0.45 0.44 0.44 0.44 0.44 0.01 0.00 Other Gasoil 0.38 0.38 0.33 0.39 0.42 0.32 0.34 0.32 0.31 -0.02 -0.02 Residual Fuel Oil 0.44 0.56 0.57 0.54 0.57 0.38 0.40 0.36 0.38 0.02 -0.13 Other Products 0.47 0.57 0.54 0.55 0.56 0.48 0.50 0.53 0.43 -0.10 -0.05
Total 4.47 4.71 4.47 4.84 5.07 4.10 4.32 4.10 3.88 -0.22 -0.24
GermanyLPG 0.10 0.10 0.12 0.09 0.11 0.12 0.13 0.12 0.11 0.00 0.01 Naphtha 0.38 0.38 0.37 0.40 0.42 0.39 0.39 0.40 0.38 -0.02 0.04 Motor Gasoline 0.45 0.43 0.43 0.42 0.39 0.44 0.45 0.44 0.44 0.01 0.00 Jet/Kerosene 0.18 0.19 0.21 0.18 0.16 0.19 0.18 0.19 0.20 0.01 0.00 Diesel 0.66 0.70 0.73 0.69 0.64 0.72 0.74 0.69 0.72 0.03 0.01 Other Gasoil 0.39 0.38 0.33 0.47 0.40 0.45 0.51 0.42 0.42 0.01 -0.07 Residual Fuel Oil 0.14 0.13 0.13 0.13 0.13 0.12 0.12 0.13 0.11 -0.02 -0.02 Other Products 0.09 0.08 0.09 0.07 0.04 0.08 0.07 0.07 0.09 0.02 0.00
Total 2.40 2.39 2.41 2.44 2.30 2.51 2.59 2.46 2.49 0.03 -0.03
ItalyLPG 0.10 0.11 0.10 0.11 0.13 0.10 0.11 0.11 0.09 -0.01 0.00 Naphtha 0.08 0.09 0.08 0.09 0.09 0.10 0.11 0.09 0.10 0.01 -0.01 Motor Gasoline 0.24 0.22 0.23 0.21 0.19 0.19 0.20 0.19 0.20 0.01 -0.05 Jet/Kerosene 0.10 0.09 0.11 0.08 0.08 0.09 0.09 0.09 0.10 0.00 0.01 Diesel 0.49 0.45 0.45 0.44 0.40 0.42 0.42 0.43 0.42 0.00 -0.07 Other Gasoil 0.11 0.11 0.10 0.12 0.12 0.11 0.11 0.11 0.12 0.01 0.03 Residual Fuel Oil 0.12 0.10 0.11 0.09 0.07 0.08 0.08 0.08 0.07 -0.02 -0.03 Other Products 0.24 0.20 0.21 0.18 0.19 0.18 0.19 0.17 0.17 0.01 -0.02
Total 1.49 1.35 1.38 1.33 1.28 1.28 1.30 1.27 1.27 0.00 -0.14
FranceLPG 0.11 0.11 0.09 0.11 0.14 0.10 0.12 0.10 0.09 -0.01 0.00 Naphtha 0.14 0.13 0.14 0.09 0.15 0.15 0.15 0.15 0.16 0.01 0.01 Motor Gasoline 0.18 0.16 0.17 0.15 0.14 0.16 0.16 0.16 0.16 0.00 -0.02 Jet/Kerosene 0.16 0.15 0.17 0.15 0.14 0.16 0.15 0.16 0.16 0.01 0.00 Diesel 0.69 0.68 0.69 0.69 0.65 0.69 0.72 0.67 0.68 0.01 -0.04 Other Gasoil 0.28 0.28 0.26 0.30 0.34 0.27 0.31 0.27 0.22 -0.05 -0.02 Residual Fuel Oil 0.08 0.07 0.06 0.06 0.07 0.06 0.07 0.06 0.06 0.01 -0.01 Other Products 0.17 0.15 0.15 0.15 0.13 0.16 0.13 0.17 0.18 0.01 0.01
Total 1.79 1.74 1.73 1.71 1.75 1.75 1.81 1.74 1.72 -0.02 -0.07
United KingdomLPG 0.13 0.11 0.09 0.09 0.09 0.14 0.12 0.14 0.16 0.02 0.05 Naphtha 0.03 0.02 0.02 0.03 0.04 0.03 0.03 0.02 0.02 0.00 -0.01 Motor Gasoline 0.33 0.32 0.31 0.31 0.30 0.31 0.30 0.29 0.33 0.04 0.01 Jet/Kerosene 0.32 0.31 0.31 0.32 0.32 0.31 0.35 0.31 0.29 -0.02 0.00 Diesel 0.45 0.45 0.45 0.47 0.44 0.47 0.47 0.44 0.49 0.05 0.03 Other Gasoil 0.12 0.12 0.13 0.12 0.12 0.13 0.13 0.12 0.12 0.00 0.01 Residual Fuel Oil 0.06 0.05 0.05 0.04 0.05 0.05 0.05 0.05 0.04 0.00 0.00 Other Products 0.14 0.12 0.12 0.10 0.12 0.14 0.15 0.13 0.14 0.01 0.01
Total 1.58 1.50 1.49 1.47 1.48 1.56 1.60 1.50 1.60 0.10 0.09
CanadaLPG 0.40 0.42 0.40 0.46 0.49 0.36 0.39 0.36 0.33 -0.03 0.00 Naphtha 0.08 0.09 0.10 0.09 0.08 0.10 0.09 0.10 0.10 0.00 0.01 Motor Gasoline 0.76 0.74 0.75 0.72 0.73 0.78 0.75 0.79 0.80 0.01 0.05 Jet/Kerosene 0.09 0.12 0.14 0.13 0.12 0.13 0.12 0.15 0.12 -0.02 0.03 Diesel 0.30 0.30 0.31 0.29 0.32 0.31 0.31 0.30 0.32 0.01 -0.01 Other Gasoil 0.26 0.23 0.21 0.25 0.22 0.22 0.20 0.26 0.22 -0.04 0.03 Residual Fuel Oil 0.06 0.06 0.06 0.05 0.04 0.04 0.06 0.03 0.04 0.00 -0.03 Other Products 0.31 0.32 0.37 0.38 0.29 0.30 0.30 0.31 0.31 -0.01 -0.05
Total 2.27 2.29 2.34 2.38 2.28 2.26 2.22 2.31 2.23 -0.08 0.03 1 Demand, measured as deliveries from refineries and primary stocks, comprises inland deliveries, international bunkers and refinery fuel. It includes crude for direct burning, oil from non-conventional sources and other sources of supply. Jet/kerosene comprises jet kerosene and non-aviation kerosene. Gasoil comprises diesel, light heating oil and other gasoils. 2 Latest official OECD submissions (MOS).3 US figures exclude US territories.
Latest month vs.

TABLES INTERNATIONAL ENERGY AGENCY ‐ OIL MARKET REPORT
62 12 SEPTEMBER 2013
Table 3WORLD OIL PRODUCTION
(million barrels per day)
2012 2013 2014 1Q13 2Q13 3Q13 4Q13 1Q14 Jun 13 Jul 13 Aug 13
OPECCrude Oil Saudi Arabia 9.51 9.01 9.29 9.39 9.74 9.93 Iran 3.00 2.70 2.68 2.70 2.65 2.68 Iraq 2.95 3.03 3.16 3.05 3.06 3.17 UAE 2.65 2.67 2.72 2.73 2.75 2.72 Kuwait 2.46 2.55 2.56 2.56 2.54 2.51 Neutral Zone 0.54 0.52 0.52 0.52 0.52 0.52 Qatar 0.74 0.74 0.73 0.73 0.73 0.73 Angola 1.78 1.76 1.76 1.78 1.73 1.70 Nigeria 2.10 2.00 1.94 1.88 1.92 1.90 Libya 1.39 1.38 1.31 1.15 1.00 0.55 Algeria 1.17 1.15 1.14 1.12 1.15 1.12 Ecuador 0.50 0.50 0.51 0.52 0.52 0.52 Venezuela 2.50 2.44 2.52 2.50 2.47 2.47
Total Crude Oil 31.30 30.44 30.83 30.62 30.77 30.51 Total NGLs1 6.28 6.49 6.74 6.35 6.40 6.57 6.63 6.70 6.40 6.57 6.57
Total OPEC 37.58 36.79 37.22 37.01 37.34 37.08
NON-OPEC2
OECDAmericas6 15.86 17.07 18.00 16.81 16.68 17.17 17.62 17.88 16.61 17.16 17.37 United States5 9.17 10.16 10.91 9.81 10.05 10.28 10.49 10.67 10.01 10.31 10.34 Mexico 2.92 2.87 2.84 2.91 2.88 2.86 2.85 2.86 2.89 2.85 2.88 Canada 3.76 4.03 4.24 4.07 3.74 4.02 4.27 4.33 3.70 3.99 4.14 Chile 0.01 0.01 0.01 0.02 0.01 0.01 0.01 0.01 0.01 0.01 0.01 Europe7 3.46 3.25 3.18 3.33 3.27 3.03 3.36 3.34 3.11 3.37 2.84 UK 0.94 0.86 0.85 0.89 0.88 0.78 0.91 0.91 0.83 0.84 0.77 Norway 1.91 1.81 1.79 1.83 1.82 1.70 1.88 1.86 1.69 1.96 1.52 Others 0.60 0.58 0.54 0.61 0.58 0.56 0.57 0.56 0.58 0.57 0.55 Asia Oceania8 0.56 0.50 0.51 0.45 0.49 0.54 0.52 0.46 0.51 0.53 0.54 Australia 0.48 0.42 0.44 0.37 0.42 0.46 0.45 0.38 0.43 0.46 0.46 Others 0.08 0.08 0.07 0.08 0.08 0.08 0.08 0.07 0.08 0.08 0.08
Total OECD 19.88 20.82 21.69 20.59 20.45 20.74 21.51 21.68 20.23 21.06 20.75
NON-OECD
Former USSR 13.66 13.79 13.78 13.84 13.79 13.74 13.78 13.77 13.86 13.79 13.66 Russia 10.73 10.82 10.81 10.82 10.86 10.81 10.80 10.82 10.88 10.77 10.89 Others 2.92 2.97 2.97 3.02 2.94 2.93 2.99 2.96 2.98 3.02 2.77
Asia 7.77 7.68 7.76 7.80 7.76 7.52 7.64 7.75 7.80 7.56 7.43 China 4.18 4.15 4.25 4.20 4.24 4.04 4.14 4.23 4.28 4.08 3.98 Malaysia 0.67 0.67 0.69 0.69 0.65 0.65 0.68 0.69 0.67 0.66 0.63 India 0.91 0.91 0.88 0.90 0.89 0.92 0.91 0.89 0.90 0.92 0.93 Indonesia 0.89 0.84 0.80 0.87 0.87 0.83 0.82 0.82 0.85 0.83 0.83 Others 1.12 1.11 1.13 1.14 1.12 1.08 1.09 1.11 1.11 1.08 1.08
Europe 0.14 0.14 0.13 0.14 0.14 0.13 0.13 0.13 0.14 0.14 0.13
Latin America 4.18 4.23 4.47 4.15 4.17 4.22 4.36 4.40 4.24 4.16 4.25 Brazil5 2.16 2.15 2.34 2.07 2.10 2.15 2.28 2.29 2.20 2.07 2.17 Argentina 0.66 0.63 0.61 0.64 0.64 0.63 0.62 0.62 0.64 0.65 0.62 Colombia 0.95 1.02 1.10 1.01 1.00 1.02 1.04 1.07 0.97 1.02 1.03 Others 0.42 0.42 0.41 0.43 0.43 0.42 0.41 0.42 0.43 0.42 0.42
Middle East3 1.46 1.39 1.37 1.43 1.34 1.40 1.38 1.37 1.39 1.42 1.41 Oman 0.92 0.95 0.96 0.94 0.94 0.97 0.96 0.95 0.97 0.98 0.98 Syria 0.17 0.07 0.04 0.11 0.07 0.06 0.05 0.05 0.06 0.06 0.06 Yemen 0.18 0.16 0.16 0.18 0.12 0.16 0.17 0.17 0.15 0.17 0.17 Others 0.18 0.21 0.20 0.21 0.21 0.21 0.21 0.21 0.21 0.21 0.21
Africa 2.29 2.37 2.60 2.28 2.33 2.39 2.49 2.57 2.40 2.44 2.33 Egypt 0.73 0.71 0.66 0.73 0.72 0.70 0.68 0.67 0.72 0.71 0.71 Gabon 0.25 0.24 0.24 0.23 0.23 0.24 0.24 0.24 0.25 0.25 0.24 Others 1.31 1.43 1.70 1.32 1.38 1.44 1.57 1.65 1.44 1.48 1.38
Total Non-OECD 29.49 29.59 30.10 29.65 29.54 29.40 29.78 29.99 29.84 29.51 29.23
Processing Gains4 2.14 2.18 2.21 2.18 2.16 2.20 2.18 2.21 2.20 2.22 2.22
Global Biofuels5 1.86 1.95 2.10 1.48 1.97 2.30 2.06 1.72 1.96 2.23 2.32
TOTAL NON-OPEC 53.36 54.55 56.11 53.89 54.11 54.64 55.53 55.60 54.23 55.02 54.51
TOTAL SUPPLY 90.94 90.69 91.33 91.24 92.36 91.59 1 Includes condensates reported by OPEC countries, oil from non-conventional sources, e.g. Venezuelan Orimulsion (but not Orinoco extra-heavy oil),
and non-oil inputs to Saudi Arabian MTBE. Orimulsion production reportedly ceased from January 2007.
2 Comprises crude oil, condensates, NGLs and oil from non-conventional sources
3 Includes small amounts of production from Jordan and Bahrain.
4 Net volumetric gains and losses in refining and marine transportation losses.
5 As of the July 2010 OMR, Global Biofuels comprise all world biofuel production including fuel ethanol from the US and Brazil.
6 As of the August 2012 OMR, includes Chile.
7 As of the August 2012 OMR, includes Estonia and Slovenia.
8 As of the August 2012 OMR, includes Israel.

INTERNATIONAL ENERGY AGENCY ‐ OIL MARKET REPORT TABLES
12 SEPTEMBER 2013 63
ble 4 - OECD Industry Stocks and Quarterly Stock Changes/OECD Government-Controlled Stocks and Quarterly Stock Ch Land in Selected
OECD INDUSTRY STOCKS1 AND QUARTERLY STOCK CHANGES
RECENT MONTHLY STOCKS2 PRIOR YEARS' STOCKS2STOCK CHANGES
in Million Barrels in Million Barrels in mb/d
Mar2013 Apr2013 May2013 Jun2013 Jul2013* Jul2010 Jul2011 Jul2012 3Q2012 4Q2012 1Q2013 2Q2013
OECD AmericasCrude 527.0 527.7 527.6 509.2 490.3 498.2 488.5 507.5 -0.10 -0.10 0.28 -0.20 Motor Gasoline 260.0 258.4 256.4 260.2 261.6 253.9 249.1 244.4 -0.06 0.32 -0.06 0.00 Middle Distillate 192.9 195.8 196.0 195.3 199.3 247.3 230.9 199.0 0.16 0.08 -0.20 0.03 Residual Fuel Oil 45.5 49.0 47.0 45.9 45.4 50.1 46.4 45.5 -0.01 -0.03 0.03 0.00 Total Products3
664.7 675.2 683.4 698.2 713.4 730.3 703.7 691.4 0.27 0.09 -0.43 0.37
Total4 1341.6 1358.0 1366.4 1366.8 1360.0 1386.9 1356.0 1368.1 0.26 -0.22 -0.24 0.28
OECD EuropeCrude 306.7 320.4 315.8 302.6 311.4 336.2 312.5 314.0 -0.12 -0.04 0.05 -0.04 Motor Gasoline 96.3 93.9 85.3 88.6 85.5 95.8 93.2 92.7 0.06 -0.01 0.08 -0.08 Middle Distillate 255.5 249.2 244.3 246.8 251.8 289.7 273.0 261.0 0.13 -0.06 0.03 -0.10 Residual Fuel Oil 80.0 81.9 76.7 77.0 75.3 87.4 77.8 78.0 0.03 0.01 0.04 -0.03 Total Products3
536.2 525.4 505.8 512.3 513.5 573.3 552.0 543.2 0.19 -0.06 0.12 -0.26
Total4 904.5 908.0 882.2 874.3 884.1 977.9 931.9 924.9 0.05 -0.16 0.20 -0.33
OECD Asia OceaniaCrude 166.8 161.1 167.0 168.0 167.4 169.3 165.3 176.2 0.00 -0.13 0.09 0.01 Motor Gasoline 27.9 27.4 27.7 27.5 27.3 24.4 25.4 27.3 0.02 -0.04 0.04 0.00 Middle Distillate 63.9 62.2 57.8 60.9 66.4 59.5 67.2 64.6 0.08 -0.09 0.04 -0.03 Residual Fuel Oil 20.1 20.4 20.7 19.7 21.0 20.0 21.2 20.9 0.02 -0.02 0.00 -0.01 Total Products3 173.4 171.7 164.7 167.5 174.4 168.4 177.6 173.1 0.20 -0.16 0.03 -0.06
Total4 412.7 410.2 405.9 409.5 414.5 407.5 414.3 424.3 0.16 -0.33 0.18 -0.04
Total OECDCrude 1000.5 1009.2 1010.4 979.9 969.0 1003.6 966.3 997.7 -0.22 -0.27 0.41 -0.23 Motor Gasoline 384.3 379.7 369.4 376.3 374.5 374.1 367.7 364.3 0.01 0.27 0.05 -0.09 Middle Distillate 512.4 507.2 498.1 503.0 517.5 596.5 571.2 524.7 0.36 -0.07 -0.14 -0.10 Residual Fuel Oil 145.6 151.3 144.4 142.4 141.7 157.5 145.5 144.4 0.03 -0.03 0.07 -0.03 Total Products3
1374.2 1372.3 1354.0 1378.0 1401.4 1472.0 1433.3 1407.6 0.65 -0.12 -0.28 0.04
Total4 2658.8 2676.2 2654.5 2650.6 2658.6 2772.3 2702.3 2717.3 0.46 -0.72 0.14 -0.09
OECD GOVERNMENT-CONTROLLED STOCKS5 AND QUARTERLY STOCK CHANGES
RECENT MONTHLY STOCKS2 PRIOR YEARS' STOCKS2STOCK CHANGES
in Million Barrels in Million Barrels in mb/d
Mar2013 Apr2013 May2013 Jun2013 Jul2013* Jul2010 Jul2011 Jul2012 3Q2012 4Q2012 1Q2013 2Q2013
OECD AmericasCrude 696.0 696.0 696.0 696.0 696.0 726.6 718.2 696.0 -0.01 0.00 0.01 0.00 Products 1.0 1.0 1.0 1.0 1.0 2.0 0.0 1.0 0.00 0.00 0.00 0.00
OECD EuropeCrude 204.7 204.6 204.2 207.0 206.9 185.3 183.4 194.2 0.03 0.01 0.01 0.03 Products 262.7 258.9 258.9 259.1 259.6 238.5 240.9 233.7 0.02 0.03 0.06 -0.04
OECD Asia OceaniaCrude 389.6 389.6 389.5 386.1 386.1 388.9 389.1 393.4 0.00 0.00 -0.04 -0.04 Products 21.0 21.0 21.0 21.0 21.0 20.0 18.5 20.0 0.00 0.00 0.01 0.00
Total OECDCrude 1290.2 1290.1 1289.7 1289.1 1289.0 1300.7 1290.8 1283.6 0.02 0.02 -0.03 -0.01 Products 284.7 280.9 280.9 281.1 281.6 260.5 259.4 254.7 0.02 0.03 0.07 -0.04
Total4 1578.3 1574.1 1574.8 1574.5 1574.8 1562.6 1551.6 1539.5 0.04 0.05 0.04 -0.04
* estimated1 Stocks are primary national territory stocks on land (excluding utility stocks and including pipeline and entrepot stocks where known) and include stocks held by industry to meet IEA, EU and national emergency reserve commitments and are subject to government control in emergencies. 2 Closing stock levels.3 Total products includes gasoline, middle distillates, fuel oil and other products. 4 Total includes NGLs, refinery feedstocks, additives/oxygenates and other hydrocarbons. 5 Includes government-owned stocks and stock holding organisation stocks held for emergency purposes.
Table 4
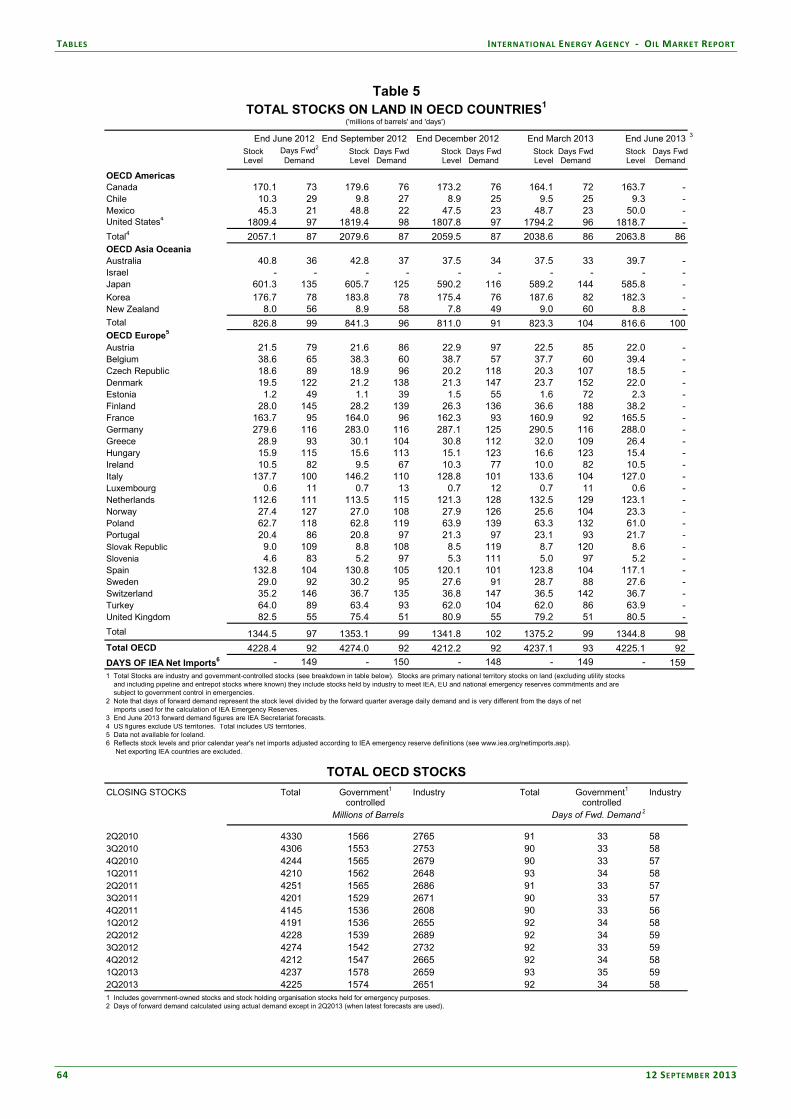
TABLES INTERNATIONAL ENERGY AGENCY ‐ OIL MARKET REPORT
64 12 SEPTEMBER 2013
Table 5 - Total Stocks on Land in OECD Countries/Total OECD Stocks
Table 5TOTAL STOCKS ON LAND IN OECD COUNTRIES1
('millions of barrels' and 'days')
3
Stock Days Fwd2Stock Days Fwd Stock Days Fwd Stock Days Fwd Stock Days Fwd
Level Demand Level Demand Level Demand Level Demand Level Demand
OECD AmericasCanada 170.1 73 179.6 76 173.2 76 164.1 72 163.7 -Chile 10.3 29 9.8 27 8.9 25 9.5 25 9.3 -Mexico 45.3 21 48.8 22 47.5 23 48.7 23 50.0 -United States4 1809.4 97 1819.4 98 1807.8 97 1794.2 96 1818.7 -
Total4 2057.1 87 2079.6 87 2059.5 87 2038.6 86 2063.8 86OECD Asia OceaniaAustralia 40.8 36 42.8 37 37.5 34 37.5 33 39.7 -Israel - - - - - - - - - -Japan 601.3 135 605.7 125 590.2 116 589.2 144 585.8 -Korea 176.7 78 183.8 78 175.4 76 187.6 82 182.3 -New Zealand 8.0 56 8.9 58 7.8 49 9.0 60 8.8 -Total 826.8 99 841.3 96 811.0 91 823.3 104 816.6 100OECD Europe5
Austria 21.5 79 21.6 86 22.9 97 22.5 85 22.0 -Belgium 38.6 65 38.3 60 38.7 57 37.7 60 39.4 -Czech Republic 18.6 89 18.9 96 20.2 118 20.3 107 18.5 -Denmark 19.5 122 21.2 138 21.3 147 23.7 152 22.0 -Estonia 1.2 49 1.1 39 1.5 55 1.6 72 2.3 -Finland 28.0 145 28.2 139 26.3 136 36.6 188 38.2 -France 163.7 95 164.0 96 162.3 93 160.9 92 165.5 -Germany 279.6 116 283.0 116 287.1 125 290.5 116 288.0 -Greece 28.9 93 30.1 104 30.8 112 32.0 109 26.4 -Hungary 15.9 115 15.6 113 15.1 123 16.6 123 15.4 -Ireland 10.5 82 9.5 67 10.3 77 10.0 82 10.5 -Italy 137.7 100 146.2 110 128.8 101 133.6 104 127.0 -Luxembourg 0.6 11 0.7 13 0.7 12 0.7 11 0.6 -Netherlands 112.6 111 113.5 115 121.3 128 132.5 129 123.1 -Norway 27.4 127 27.0 108 27.9 126 25.6 104 23.3 -Poland 62.7 118 62.8 119 63.9 139 63.3 132 61.0 -Portugal 20.4 86 20.8 97 21.3 97 23.1 93 21.7 -Slovak Republic 9.0 109 8.8 108 8.5 119 8.7 120 8.6 -Slovenia 4.6 83 5.2 97 5.3 111 5.0 97 5.2 -Spain 132.8 104 130.8 105 120.1 101 123.8 104 117.1 -Sweden 29.0 92 30.2 95 27.6 91 28.7 88 27.6 -Switzerland 35.2 146 36.7 135 36.8 147 36.5 142 36.7 -Turkey 64.0 89 63.4 93 62.0 104 62.0 86 63.9 -United Kingdom 82.5 55 75.4 51 80.9 55 79.2 51 80.5 -
Total 1344.5 97 1353.1 99 1341.8 102 1375.2 99 1344.8 98
Total OECD 4228.4 92 4274.0 92 4212.2 92 4237.1 93 4225.1 92
DAYS OF IEA Net Imports6 - 149 - 150 - 148 - 149 - 1591 Total Stocks are industry and government-controlled stocks (see breakdown in table below). Stocks are primary national territory stocks on land (excluding utility stocks and including pipeline and entrepot stocks where known) they include stocks held by industry to meet IEA, EU and national emergency reserves commitments and are subject to government control in emergencies.2 Note that days of forward demand represent the stock level divided by the forward quarter average daily demand and is very different from the days of net imports used for the calculation of IEA Emergency Reserves.3 End June 2013 forward demand figures are IEA Secretariat forecasts. 4 US figures exclude US territories. Total includes US territories.5 Data not available for Iceland.6 Reflects stock levels and prior calendar year's net imports adjusted according to IEA emergency reserve definitions (see www.iea.org/netimports.asp). Net exporting IEA countries are excluded.
TOTAL OECD STOCKS
CLOSING STOCKS Total Industry Total Industry
2Q2010 4330 1566 2765 91 33 583Q2010 4306 1553 2753 90 33 584Q2010 4244 1565 2679 90 33 571Q2011 4210 1562 2648 93 34 582Q2011 4251 1565 2686 91 33 573Q2011 4201 1529 2671 90 33 574Q2011 4145 1536 2608 90 33 561Q2012 4191 1536 2655 92 34 582Q2012 4228 1539 2689 92 34 593Q2012 4274 1542 2732 92 33 594Q2012 4212 1547 2665 92 34 581Q2013 4237 1578 2659 93 35 592Q2013 4225 1574 2651 92 34 581 Includes government-owned stocks and stock holding organisation stocks held for emergency purposes.2 Days of forward demand calculated using actual demand except in 2Q2013 (when latest forecasts are used).
End June 2013End September 2012 End June 2012 End December 2012 End March 2013
controlledGovernment1
controlledDays of Fwd. Demand 2Millions of Barrels
Government1
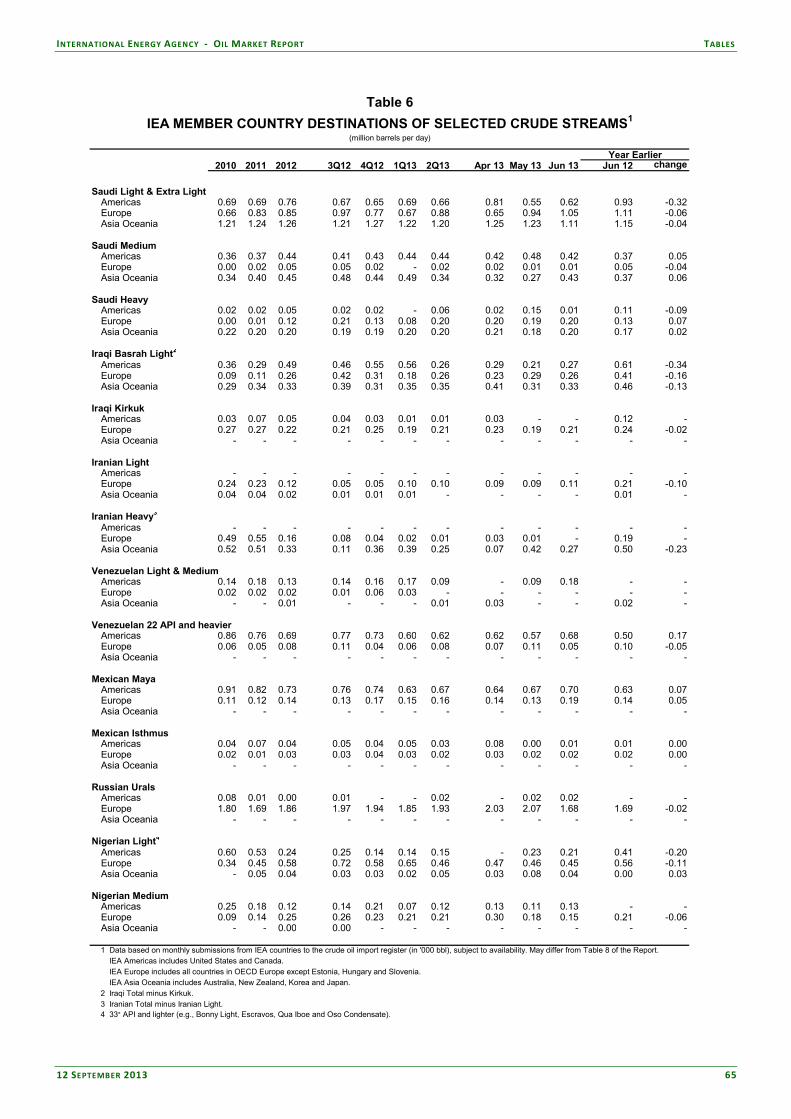
INTERNATIONAL ENERGY AGENCY ‐ OIL MARKET REPORT TABLES
12 SEPTEMBER 2013 65
Table 6 - IEA Member Country Destinations of Selected Crude Streams Table 6
IEA MEMBER COUNTRY DESTINATIONS OF SELECTED CRUDE STREAMS1
(million barrels per day)
Year Earlier2010 2011 2012 3Q12 4Q12 1Q13 2Q13 Apr 13 May 13 Jun 13 Jun 12 change
Saudi Light & Extra LightAmericas 0.69 0.69 0.76 0.67 0.65 0.69 0.66 0.81 0.55 0.62 0.93 -0.32Europe 0.66 0.83 0.85 0.97 0.77 0.67 0.88 0.65 0.94 1.05 1.11 -0.06Asia Oceania 1.21 1.24 1.26 1.21 1.27 1.22 1.20 1.25 1.23 1.11 1.15 -0.04
Saudi MediumAmericas 0.36 0.37 0.44 0.41 0.43 0.44 0.44 0.42 0.48 0.42 0.37 0.05Europe 0.00 0.02 0.05 0.05 0.02 - 0.02 0.02 0.01 0.01 0.05 -0.04Asia Oceania 0.34 0.40 0.45 0.48 0.44 0.49 0.34 0.32 0.27 0.43 0.37 0.06
Saudi HeavyAmericas 0.02 0.02 0.05 0.02 0.02 - 0.06 0.02 0.15 0.01 0.11 -0.09Europe 0.00 0.01 0.12 0.21 0.13 0.08 0.20 0.20 0.19 0.20 0.13 0.07Asia Oceania 0.22 0.20 0.20 0.19 0.19 0.20 0.20 0.21 0.18 0.20 0.17 0.02
Iraqi Basrah Light2
Americas 0.36 0.29 0.49 0.46 0.55 0.56 0.26 0.29 0.21 0.27 0.61 -0.34Europe 0.09 0.11 0.26 0.42 0.31 0.18 0.26 0.23 0.29 0.26 0.41 -0.16Asia Oceania 0.29 0.34 0.33 0.39 0.31 0.35 0.35 0.41 0.31 0.33 0.46 -0.13
Iraqi KirkukAmericas 0.03 0.07 0.05 0.04 0.03 0.01 0.01 0.03 - - 0.12 -Europe 0.27 0.27 0.22 0.21 0.25 0.19 0.21 0.23 0.19 0.21 0.24 -0.02Asia Oceania - - - - - - - - - - - -
Iranian LightAmericas - - - - - - - - - - - -Europe 0.24 0.23 0.12 0.05 0.05 0.10 0.10 0.09 0.09 0.11 0.21 -0.10Asia Oceania 0.04 0.04 0.02 0.01 0.01 0.01 - - - - 0.01 -
Iranian Heavy3
Americas - - - - - - - - - - - -Europe 0.49 0.55 0.16 0.08 0.04 0.02 0.01 0.03 0.01 - 0.19 -Asia Oceania 0.52 0.51 0.33 0.11 0.36 0.39 0.25 0.07 0.42 0.27 0.50 -0.23
Venezuelan Light & MediumAmericas 0.14 0.18 0.13 0.14 0.16 0.17 0.09 - 0.09 0.18 - -Europe 0.02 0.02 0.02 0.01 0.06 0.03 - - - - - -Asia Oceania - - 0.01 - - - 0.01 0.03 - - 0.02 -
Venezuelan 22 API and heavierAmericas 0.86 0.76 0.69 0.77 0.73 0.60 0.62 0.62 0.57 0.68 0.50 0.17Europe 0.06 0.05 0.08 0.11 0.04 0.06 0.08 0.07 0.11 0.05 0.10 -0.05Asia Oceania - - - - - - - - - - - -
Mexican MayaAmericas 0.91 0.82 0.73 0.76 0.74 0.63 0.67 0.64 0.67 0.70 0.63 0.07Europe 0.11 0.12 0.14 0.13 0.17 0.15 0.16 0.14 0.13 0.19 0.14 0.05Asia Oceania - - - - - - - - - - - -
Mexican IsthmusAmericas 0.04 0.07 0.04 0.05 0.04 0.05 0.03 0.08 0.00 0.01 0.01 0.00Europe 0.02 0.01 0.03 0.03 0.04 0.03 0.02 0.03 0.02 0.02 0.02 0.00Asia Oceania - - - - - - - - - - - -
Russian UralsAmericas 0.08 0.01 0.00 0.01 - - 0.02 - 0.02 0.02 - -Europe 1.80 1.69 1.86 1.97 1.94 1.85 1.93 2.03 2.07 1.68 1.69 -0.02Asia Oceania - - - - - - - - - - - -
Nigerian Light4
Americas 0.60 0.53 0.24 0.25 0.14 0.14 0.15 - 0.23 0.21 0.41 -0.20Europe 0.34 0.45 0.58 0.72 0.58 0.65 0.46 0.47 0.46 0.45 0.56 -0.11Asia Oceania - 0.05 0.04 0.03 0.03 0.02 0.05 0.03 0.08 0.04 0.00 0.03
Nigerian MediumAmericas 0.25 0.18 0.12 0.14 0.21 0.07 0.12 0.13 0.11 0.13 - -Europe 0.09 0.14 0.25 0.26 0.23 0.21 0.21 0.30 0.18 0.15 0.21 -0.06Asia Oceania - - 0.00 0.00 - - - - - - - -
1 Data based on monthly submissions from IEA countries to the crude oil import register (in '000 bbl), subject to availability. May differ from Table 8 of the Report. IEA Americas includes United States and Canada. IEA Europe includes all countries in OECD Europe except Estonia, Hungary and Slovenia. IEA Asia Oceania includes Australia, New Zealand, Korea and Japan.2 Iraqi Total minus Kirkuk.3 Iranian Total minus Iranian Light.4 33° API and lighter (e.g., Bonny Light, Escravos, Qua Iboe and Oso Condensate).
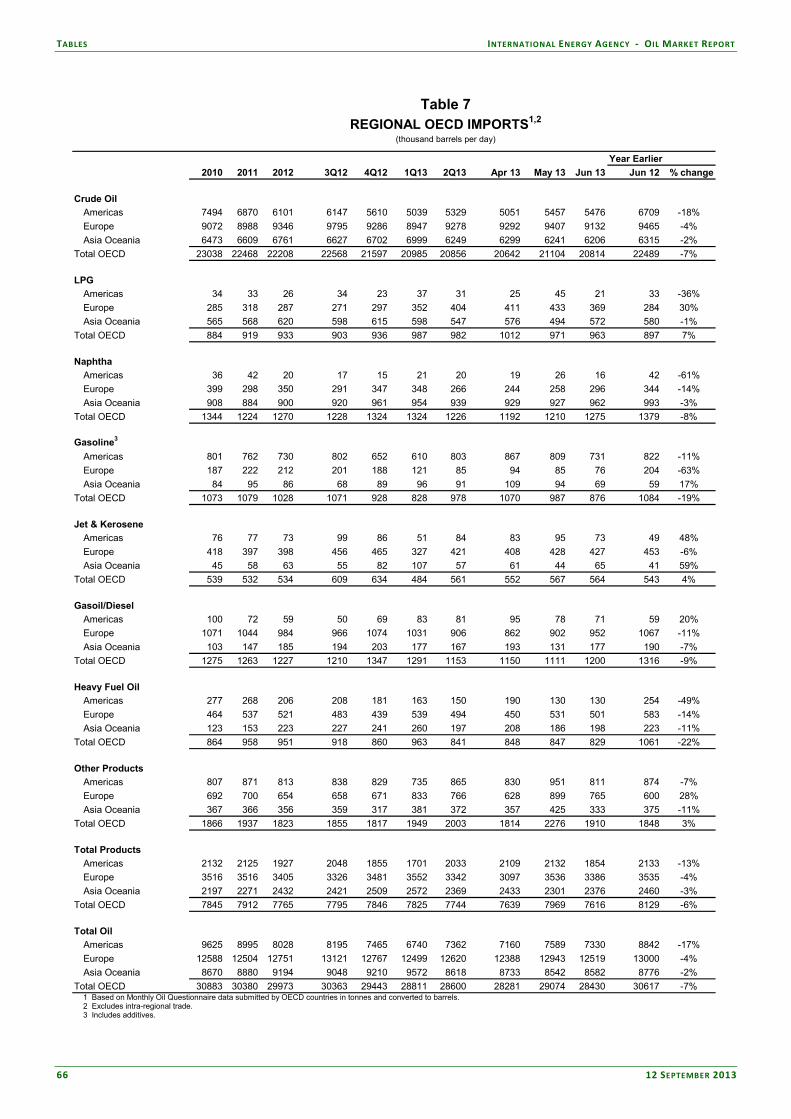
TABLES INTERNATIONAL ENERGY AGENCY ‐ OIL MARKET REPORT
66 12 SEPTEMBER 2013
Table 7 - Regional OECD Imports Table 16 - Refined Product Yields Based on Total Input
Table 7REGIONAL OECD IMPORTS1,2
(thousand barrels per day)
Year Earlier
2010 2011 2012 3Q12 4Q12 1Q13 2Q13 Apr 13 May 13 Jun 13 Jun 12 % change
Crude Oil
Americas 7494 6870 6101 6147 5610 5039 5329 5051 5457 5476 6709 -18%
Europe 9072 8988 9346 9795 9286 8947 9278 9292 9407 9132 9465 -4%
Asia Oceania 6473 6609 6761 6627 6702 6999 6249 6299 6241 6206 6315 -2%
Total OECD 23038 22468 22208 22568 21597 20985 20856 20642 21104 20814 22489 -7%
LPG
Americas 34 33 26 34 23 37 31 25 45 21 33 -36%
Europe 285 318 287 271 297 352 404 411 433 369 284 30%
Asia Oceania 565 568 620 598 615 598 547 576 494 572 580 -1%
Total OECD 884 919 933 903 936 987 982 1012 971 963 897 7%
Naphtha
Americas 36 42 20 17 15 21 20 19 26 16 42 -61%
Europe 399 298 350 291 347 348 266 244 258 296 344 -14%
Asia Oceania 908 884 900 920 961 954 939 929 927 962 993 -3%
Total OECD 1344 1224 1270 1228 1324 1324 1226 1192 1210 1275 1379 -8%
Gasoline3
Americas 801 762 730 802 652 610 803 867 809 731 822 -11%
Europe 187 222 212 201 188 121 85 94 85 76 204 -63%
Asia Oceania 84 95 86 68 89 96 91 109 94 69 59 17%
Total OECD 1073 1079 1028 1071 928 828 978 1070 987 876 1084 -19%
Jet & Kerosene
Americas 76 77 73 99 86 51 84 83 95 73 49 48%
Europe 418 397 398 456 465 327 421 408 428 427 453 -6%
Asia Oceania 45 58 63 55 82 107 57 61 44 65 41 59%
Total OECD 539 532 534 609 634 484 561 552 567 564 543 4%
Gasoil/Diesel
Americas 100 72 59 50 69 83 81 95 78 71 59 20%
Europe 1071 1044 984 966 1074 1031 906 862 902 952 1067 -11%
Asia Oceania 103 147 185 194 203 177 167 193 131 177 190 -7%
Total OECD 1275 1263 1227 1210 1347 1291 1153 1150 1111 1200 1316 -9%
Heavy Fuel Oil
Americas 277 268 206 208 181 163 150 190 130 130 254 -49%
Europe 464 537 521 483 439 539 494 450 531 501 583 -14%
Asia Oceania 123 153 223 227 241 260 197 208 186 198 223 -11%
Total OECD 864 958 951 918 860 963 841 848 847 829 1061 -22%
Other Products
Americas 807 871 813 838 829 735 865 830 951 811 874 -7%
Europe 692 700 654 658 671 833 766 628 899 765 600 28%
Asia Oceania 367 366 356 359 317 381 372 357 425 333 375 -11%
Total OECD 1866 1937 1823 1855 1817 1949 2003 1814 2276 1910 1848 3%
Total Products
Americas 2132 2125 1927 2048 1855 1701 2033 2109 2132 1854 2133 -13%
Europe 3516 3516 3405 3326 3481 3552 3342 3097 3536 3386 3535 -4%
Asia Oceania 2197 2271 2432 2421 2509 2572 2369 2433 2301 2376 2460 -3%
Total OECD 7845 7912 7765 7795 7846 7825 7744 7639 7969 7616 8129 -6%
Total Oil
Americas 9625 8995 8028 8195 7465 6740 7362 7160 7589 7330 8842 -17%
Europe 12588 12504 12751 13121 12767 12499 12620 12388 12943 12519 13000 -4%
Asia Oceania 8670 8880 9194 9048 9210 9572 8618 8733 8542 8582 8776 -2%
Total OECD 30883 30380 29973 30363 29443 28811 28600 28281 29074 28430 30617 -7%1 Based on Monthly Oil Questionnaire data submitted by OECD countries in tonnes and converted to barrels. 2 Excludes intra-regional trade.3 Includes additives.
©© OOEECCDD//IIEEAA 22001133.. AAllll RRiigghhttss RReesseerrvveedd
The International Energy Agency (IEA) makes every attempt to ensure, but does not guarantee, the accuracy and completeness of the information or the clarity of content of the Oil Market Report (hereafter the OMR). The IEA shall not be liable to any party for any inaccuracy, error or omission contained or provided in this OMR or for any loss, or damage, whether or not due to reliance placed by that party on information in this OMR.
The Executive Director and Secretariat of the IEA are responsible for the publication of the OMR. Although some of the data are supplied by IEA Member‐country governments, largely on the basis of information they in turn receive from oil companies, neither these governments nor these oil companies necessarily share the Secretariat’s views or conclusions as expressed in the OMR. The OMR is prepared for general circulation and is distributed for general information only. Neither the information nor any opinion expressed in the OMR constitutes an offer, or an invitation to make an offer, to buy or sell any securities or any options, futures or other derivatives related to such securities.
This OMR is the copyright of the OECD/IEA and is subject to terms and conditions of use. These terms and conditions are available on the IEA website at http://www.iea.org/oilmar/licenceomr.html. In relation to the Subscriber Edition (as defined in the OMR's online terms and conditions), all Argus information is sourced from Copyright © 2013 Argus Media Limited and is published here with the permission of Argus. The spot crude and product price assessments are based on daily Argus prices, converted when appropriate to US$ per barrel according to the Argus specification of products. Argus Media Limited reserves all rights in relation to all Argus information. Any reproduction of Argus information requires the express prior written permission of Argus. Argus shall not be liable to any party for any inaccuracy, error or omission contained or provided in Argus information contained in this OMR or for any loss, or damage, whether or not due to reliance placed by that party on information in this OMR.

Next Issue: 11 October 2013
OMR Contacts
Editor and Head, Oil Industry and Markets Division
Antoine Halff
Analysts
Toril Bosoni (Refining)
Charles Esser (Non-OPEC Supply)
Diane Munro (OPEC Supply and Prices)
Matt Parry (Demand)
Andrew Wilson (Stocks/Statistics)
Statistics
Valerio Pilia
Editorial Assistant
Annette Hardcastle
Contact: (+33) 0*1 40 57 66 67 [email protected] * 0 - only within France
Media Enquiries
IEA Press Office (+33) 0* 1 40 57 65 54 [email protected]
User’s Guide and Glossary to the IEA Oil Market Report For information on the data sources, definitions, technical terms and general approach used in preparing the Oil Market Report (OMR), Medium-Term Oil Market Report (MTOMR) and Annual Statistical Supplement (current issue of the Statistical Supplement dated 9 August 2013), readers are referred to the Users’ Guide at www.oilmarketreport.org/glossary.asp. It should be noted that the spot crude and product price assessments are based on daily Argus prices, converted when appropriate to US$ per barrel according to the Argus specification of products (Copyright © 2013 Argus Media Limited - all rights reserved).
Subscription and Delivery Enquiries Oil Market Report Subscriptions International Energy Agency BP 586-75726 PARIS Cedex 15, France (+33) 0* 1 40 57 67 72 [email protected] (+33) 0* 1 40 57 66 90
The Oil Market Report is published under the responsibility of the Executive Director and Secretariat of the International Energy Agency. Although some of the data are supplied by Member-country Governments, largely on the basis of information received from oil companies, neither governments nor companies necessarily share the Secretariat’s views or conclusions as expressed therein. © OECD/IEA 2013