Embed Size (px)
Citation preview
i
Aspects of Bowfin and Northern Sunfish Biology and Ecology
by
David Sanderson-Kilchenstein
A thesis submitted to the Department of Environmental Science and Biology of the
State University of New York College at Brockport in partial fulfillment of the
requirements for the degree of Master of Science
December 2015

ii
Aspects of Bowfin and Northern Sunfish Biology and Ecology
by
David Sanderson-Kilchenstein
APPROVED BY:
James Haynes, Advisor Date
Jacques Rinchard, Reader Date
Douglas Wilcox, Reader Date
Christopher Norment, Department Chair Date
Jacques Rinchard, Graduate Coordinator
Date
iii
Abstract
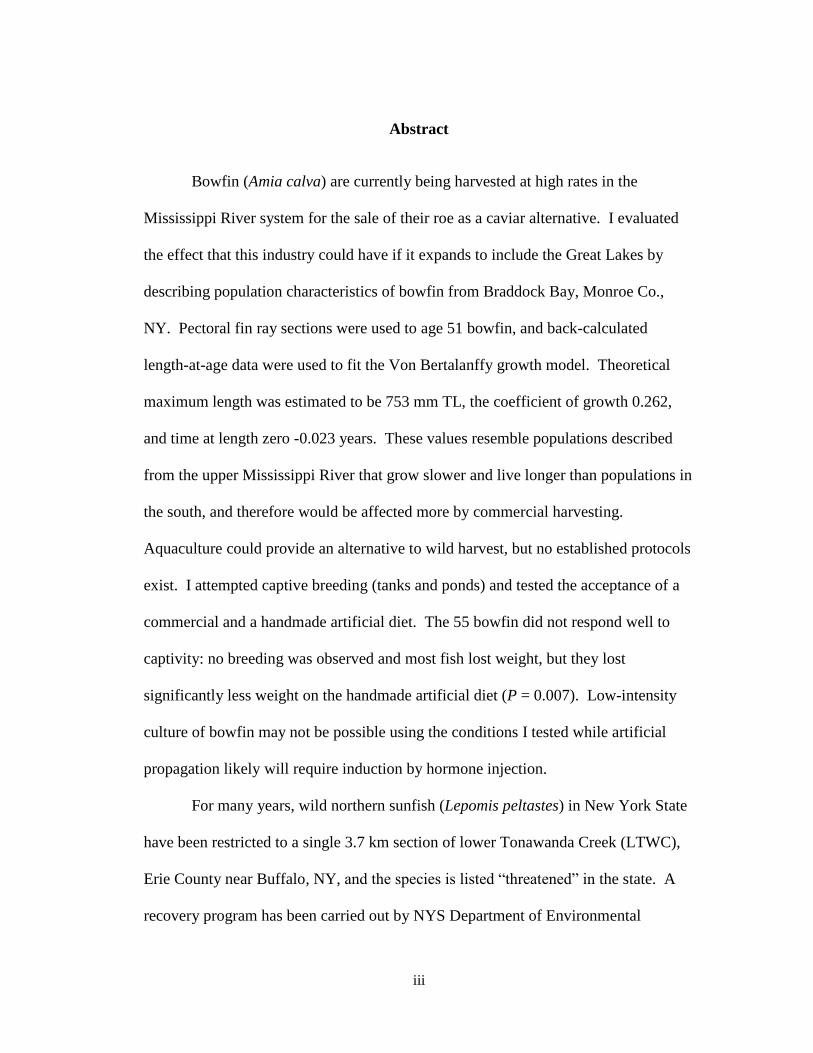
Bowfin (Amia calva) are currently being harvested at high rates in the
Mississippi River system for the sale of their roe as a caviar alternative. I evaluated
the effect that this industry could have if it expands to include the Great Lakes by
describing population characteristics of bowfin from Braddock Bay, Monroe Co.,
NY. Pectoral fin ray sections were used to age 51 bowfin, and back-calculated
length-at-age data were used to fit the Von Bertalanffy growth model. Theoretical
maximum length was estimated to be 753 mm TL, the coefficient of growth 0.262,
and time at length zero -0.023 years. These values resemble populations described
from the upper Mississippi River that grow slower and live longer than populations in
the south, and therefore would be affected more by commercial harvesting.
Aquaculture could provide an alternative to wild harvest, but no established protocols
exist. I attempted captive breeding (tanks and ponds) and tested the acceptance of a
commercial and a handmade artificial diet. The 55 bowfin did not respond well to
captivity: no breeding was observed and most fish lost weight, but they lost
significantly less weight on the handmade artificial diet (P = 0.007). Low-intensity
culture of bowfin may not be possible using the conditions I tested while artificial
propagation likely will require induction by hormone injection.
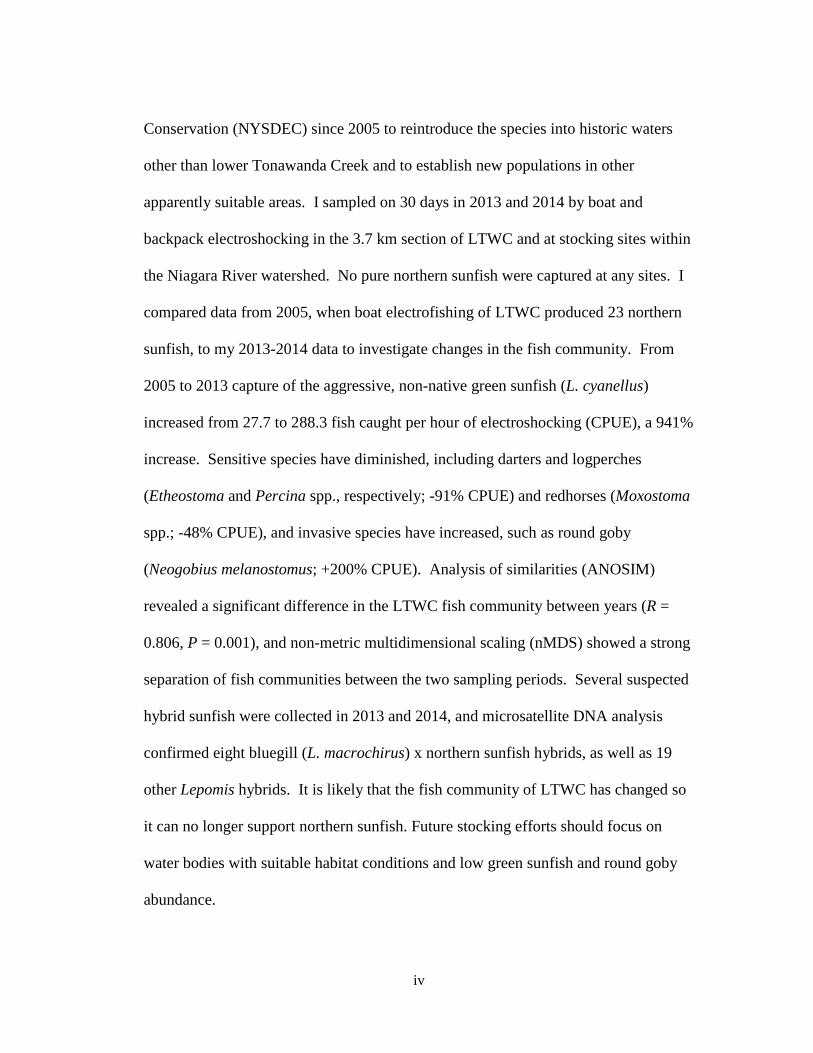
For many years, wild northern sunfish (Lepomis peltastes) in New York State
have been restricted to a single 3.7 km section of lower Tonawanda Creek (LTWC),
Erie County near Buffalo, NY, and the species is listed “threatened” in the state. A
recovery program has been carried out by NYS Department of Environmental
iv
Conservation (NYSDEC) since 2005 to reintroduce the species into historic waters
other than lower Tonawanda Creek and to establish new populations in other
apparently suitable areas. I sampled on 30 days in 2013 and 2014 by boat and
backpack electroshocking in the 3.7 km section of LTWC and at stocking sites within
the Niagara River watershed. No pure northern sunfish were captured at any sites. I
compared data from 2005, when boat electrofishing of LTWC produced 23 northern
sunfish, to my 2013-2014 data to investigate changes in the fish community. From
2005 to 2013 capture of the aggressive, non-native green sunfish (L. cyanellus)
increased from 27.7 to 288.3 fish caught per hour of electroshocking (CPUE), a 941%
increase. Sensitive species have diminished, including darters and logperches
(Etheostoma and Percina spp., respectively; -91% CPUE) and redhorses (Moxostoma
spp.; -48% CPUE), and invasive species have increased, such as round goby
(Neogobius melanostomus; +200% CPUE). Analysis of similarities (ANOSIM)
revealed a significant difference in the LTWC fish community between years (R =
0.806, P = 0.001), and non-metric multidimensional scaling (nMDS) showed a strong
separation of fish communities between the two sampling periods. Several suspected
hybrid sunfish were collected in 2013 and 2014, and microsatellite DNA analysis
confirmed eight bluegill (L. macrochirus) x northern sunfish hybrids, as well as 19
other Lepomis hybrids. It is likely that the fish community of LTWC has changed so
it can no longer support northern sunfish. Future stocking efforts should focus on
water bodies with suitable habitat conditions and low green sunfish and round goby
abundance.

v
Dedication
This thesis is dedicated to, first, my parents for their undying love, support,
and guidance: my mother who taught me to thirst for knowledge and my father who
taught me to explore natural phenomena. Second, I also dedicate this thesis to the
love of my life, Noelle Hatton, who not only helped with both chapter’s field and lab
work, but has unwaveringly stood by me through the writing process.

vi
Acknowledgements
I would like to acknowledge my advisor, Dr. James Haynes, for encouraging
me to develop a thesis project that captured my interests, for providing an
immeasurable amount of support and guidance, and for his patience. I would also
like to acknowledge my committee member Dr. Jacques Rinchard for providing the
facility and major components of my bowfin project’s setup, as well as his support
and guidance. Lastly, I would like to thank my committee member, Dr. Douglas
Wilcox, for providing financial support and scientific input, as well as lending me
much of the field gear for capturing my bowfin.
Bowfin Research: I would also like to acknowledge my interns for their hard
work and valuable scientific input, and for contributing a combined 398 hours of
service: Anthony Marsocci, Noelle Hatton, Corey Calby, Erik Long, Shane Barney,
Colleen Kolb, Taylor Ouderkirk, Lauren Brewer, and Miranda Papp. I am also
grateful for the hard work of many other volunteers without whom this project would
not have happened: Matt Piche, Jacob van Slooten, Joshua Perry, Evan Rea, Robert
Cornish, Lier Yo, Kelly Owens, Amberlee Todd, and William Giese. A special
acknowledgement is due for Andie Graham who traipsed through two feet of snow
for three days, including Christmas, to carry out experimental duties. I would also
like to acknowledge Frank Lawrence for providing access to Long Pond, Dr. Allyse
Ferrera of Nicholls State University, Thibodaux, Louisiana for her expert opinion on
some questionably-gendered bowfin, and Dr. Michael Quist of the University of
Idaho, Moscow, Idaho for his expert opinion and advice on determining the ages of

vii
my bowfin. I thank the employees and managers of Lowes, Brockport, New York,
for their creative thinking, patience, and helpful assistance, and lastly, I thank Bruce
Butcher of Sandy Creek Marina for donating roughly 1.5 tons of gravel to my project.
Northern Sunfish Research: I would first like to acknowledge NYSDEC Fish
Biologists Douglas Carlson, for his mentorship of me through this project, and Scott
Wells, for his valuable input. I would also like to gratefully acknowledge funding
from the Niagara River Habitat Enhancement and Restoration Fund, with special
thanks for the HERF committee chair, Timothy DePriest (NYSDEC), who also
assisted in the field on a very cold, rainy day. Furthermore, I would like to give a
huge acknowledgement to the many field assistants who were willing to traverse
rapids and dive chest-deep in muck with me: Anthony Marsocci, Catherine Jirovec,
Noelle Hatton, Andrea Graham, Coral Reina, Gregory Lawrence, Scott Buckingham,
Jonathan Bateman, Matthew Piche, Robert Cornish, Alyssa Vogel, Dena VanCurran,
Sage Hallenbeck, Mathew Pavalitis, Alexander Silva, and James Hatton. I also thank
Jeffery Maharan who lent the use of and arduously guided his personal inflatable
river raft for a day of sampling down Tonawanda Creek, and the Erie County
Department of Parks, Recreation, and Forestry for allowing us to sample in Cayuga
Creek in Como Lake Park. I owe deep thanks to Katherine Bailey for assistance in
using and understanding multivariate statistics software, and to Kelly Owens for her
amazing fish photography.

viii
Table of Contents
Abstract ........................................................................................................................ iii
Dedication ..................................................................................................................... v
Acknowledgements ...................................................................................................... vi
Bowfin research ........................................................................................................ vi
Northern sunfish research ........................................................................................ vii
List of Tables .............................................................................................................. xii
Bowfin chapter ........................................................................................................ xii
Northern sunfish chapter ......................................................................................... xii
List of Figures ............................................................................................................ xiii
Bowfin chapter ....................................................................................................... xiii
Northern sunfish chapter ........................................................................................ xiii
List of Appendices ...................................................................................................... xv
Bowfin chapter ........................................................................................................ xv
Northern sunfish chapter ......................................................................................... xv
General Introduction .................................................................................................. xvi
Chapter 1: Population Characteristics of Bowfin (Amia calva) from a Great Lakes
Coastal Wetland, with an Investigation of Captive Breeding and Artificial Diet ...... 1
Introduction ................................................................................................................... 1
Commercial harvest ................................................................................................... 1
Need for aquaculture ................................................................................................. 2

ix
Life history ................................................................................................................ 2
Population characteristics .......................................................................................... 3
Bowfin in captivity .................................................................................................... 5
Objectives .................................................................................................................. 6
Methods......................................................................................................................... 7
Bowfin collections ..................................................................................................... 7
Population characteristics .......................................................................................... 9
Captive breeding study ............................................................................................ 11
Artificial diet study .................................................................................................. 14
Results and Discussion ............................................................................................... 17
Bowfin collections ................................................................................................... 17
Population characteristics ........................................................................................ 17
Water quality of the indoor system ......................................................................... 19
Captive breeding ...................................................................................................... 19
Artificial diet ........................................................................................................... 20
Conclusions ................................................................................................................. 21
Literature Cited ........................................................................................................... 23
Tables… ...................................................................................................................... 26
Figures......................................................................................................................... 33
Appendices .................................................................................................................. 46

x
Chapter 2: Status of the Last Wild Population of Northern Sunfish (Lepomis
peltastes) in New York State: Changes in the Fish Community and Hybridization
with Bluegill (L. macrochirus) in Tonawanda Creek, Erie County ......................... 70
Introduction ................................................................................................................. 70
Species description................................................................................................... 71
Hybridization among sunfish ................................................................................... 72
Objectives ................................................................................................................ 74
Methods....................................................................................................................... 74
Study location .......................................................................................................... 74
Sampling .................................................................................................................. 75
Fish community comparisons .................................................................................. 77
Green sunfish population assessment ...................................................................... 81
Hybrid sunfish identification ................................................................................... 82
Results ......................................................................................................................... 83
Sampling effort and CPUE ...................................................................................... 83
Green sunfish population assessment ...................................................................... 86
Hybrid sunfish identification ................................................................................... 86
Discussion ................................................................................................................... 87
Sampling methods .................................................................................................... 87
Changes in the fish community of lower Tonawanda Creek ................................... 88
Lepomis hybridizaton ............................................................................................... 90
Other factors potentially contributing to the decline of L. peltastes ........................ 91
Conclusion .................................................................................................................. 92

xi
Literature Cited ........................................................................................................... 94
Tables .......................................................................................................................... 98
Figures........................................................................................................................112
Appendices .................................................................................................................120

xii
List of Tables
Chapter 1: Population Characteristics of Bowfin (Amia calva) from a Great Lakes
Coastal Wetland, with an Investigation of Captive Breeding and Artificial Diet
Table 1. Water parameters of Pond 1 and Pond 2. ..................................................... 26
Table 2. Laboratory analysis of two artificial diets ................................................... 27
Table 3. Catch per unit effort (CPUE) of bowfin ...................................................... 29
Table 4. Total Length, weight, and ages of female and male bowfin ........................ 30
Table 5. Estimated parameters of the von Bertalanffy growth equation ................... 31
Table 6. Percent consumption of two artificial diets and a live prey diet ................ 332
Chapter 2: Status of the Last Wild Population of Northern Sunfish (Lepomis
peltastes) in New York State: Changes in the Fish Community and Hybridization
with Bluegill (L. macrochirus) in Tonawanda Creek, Erie County
Table 1. Key used for field identification of sunfish ................................................. 98
Table 2. Description of sites sampled 2013 and 2014 ..............................................100
Table 3. Summary of all sampling effort in 2005, 2013, and 2014 ..........................102
Table 4. Average catch per unit effort 2005 and 2013 .............................................104
Table 5. Comparison of Simpson’s index of diversity .............................................107
Table 6. Similarity of percentages of CPUE catch data ............................................108
Table 7. Results of a Schnabel method mark-recapture study on green sunfish ......109
Table 8. Summary of DNA analysis on 27 hybrid specimens ..................................110

xiii
List of Figures
Chapter 1: Population Characteristics of Bowfin (Amia calva) from a Great Lakes
Coastal Wetland, with an Investigation of Captive Breeding and Artificial Diet
Figure 1. Maps of sampling locations ........................................................................ 33
Figure 2. Images of the method used to section pectoral fin rays .............................. 34
Figure 3. Layout of the Recirculating Aquaculture System ...................................... 35
Figure 4. Layout of the partial flow-through Recirculating Aquaculture System ..... 36
Figure 5. Layout of the fully flow-through tank system ............................................ 37
Figure 6. Water quality of the indoor system 24 October 2012 to 1 April 2013 ....... 38
Figure 7. Water quality of the indoor system 2 April to 25 September 2013 ............ 39
Figure 8. Photographs taken 24 October 2012 of Pond 1 and Pond 2 ....................... 40
Figure 9. Mean back-calculated length-at-age of female and male bowfin ............... 41
Figure 10. Mean back-calculated length-at-age of bowfin populations .................... 42
Figure 11. Percent annual growth of bowfin populations .......................................... 43
Figure 12. Percent consumption of two artificial diets and live prey diet ................. 44
Figure 13. Percent change in initial weight and total diet consumed ........................ 45
Chapter 2: Status of the Last Wild Population of Northern Sunfish (Lepomis
peltastes) in New York State: Changes in the Fish Community and Hybridization
with Bluegill (L. macrochirus) in Tonawanda Creek, Erie County
Figure 1. Map of Northern and longear sunfish ranges ............................................112
xiv
Figure 2. Map of historic and stocked waters in New York State ............................113
Figure 3. Photographs of the co-occurring species of sunfish .................................114
Figure 4. Map of study sites in western New York ..................................................115
Figure 5. Non-metric multidimensional scaling plot of CPUE 2005 and 2013 ........116
Figure 6. Photographs of juvenile pure bred and hybrid sunfish from LTWC .........117
Figure 7. Photographs of mid-sized pure bred and hybrid sunfish from LTWC ......118
Figure 8. Photographs of adult pure bred and hybrid sunfish from LTWC ..............119

xv
List of Appendices
Chapter 1: Population Characteristics of Bowfin (Amia calva) from a Great Lakes
Coastal Wetland, with an Investigation of Captive Breeding and Artificial Diet
Appendix A. Use log of all 55 bowfin captured for this study .................................. 46
Appendix B. Catch data for all overnight fyke-net–sets ............................................ 50
Appendix C. Feeding log ........................................................................................... 55
Appendix D. Back-calculated length-at-age estimates for bowfin ............................ 66
Chapter 2: Status of the Last Wild Population of Northern Sunfish (Lepomis
peltastes) in New York State: Changes in the Fish Community and Hybridization
with Bluegill (L. macrochirus) in Tonawanda Creek, Erie County
Appendix A. List of all species captured 2005, 2013, and 2014 ..............................120
Appendix B. Raw capture data 2005, 2013, and 2014 ..............................................124
Appendix C. Photographs of hybrid and pure sunfish [Digital] .....................................
........................................ http://digitalcommons.brockport.edu/env_theses/101
xvi
General Introduction
Separate studies were conducted on two species of fish native to western New
York and endemic to North America—bowfin (Amiidae: Amia calva) and northern
sunfish (Centrarchidae: Lepomis peltastes). Though seemingly disparate, both studies
were designed to aid in native fish conservation at different stages of threat and
decline: the bowfin being an abundant, pre-restoration species potentially subject to
high commercial exploitation for their roe ("caviar") and the northern sunfish being
nearly-state extirpated, post-restoration. As non-game fish species, bowfin and
northern sunfish have received little attention historically—bowfin are found to be
unpalatable by many, and northern sunfish are too small to be an important food or
game fish.
Bowfin have recently gained much attention in the lower Mississippi River
and in Georgia due to a quickly expanding industry for the harvest and sale of their
roe (Porter et al. 2013). In order for a fishery to remain sustainable, information on
population characteristics is needed, such as growth, recruitment, fecundity, etc., and
these evaluations are only now being made in Louisiana (Davis 2006), Georgia
(Porter et al. 2013), and Wisconsin/Iowa/Illinois (Koch et al. 2009). Scientists
recently have postulated that this industry could expand to include the Great Lakes
(Dabrowski n.d.), but no reliable studies exist on any bowfin populations.
Northern sunfish once occupied eight waters of the Lake Erie and Lake
Ontario basins in New York State. For many years they have only been detected in a

xvii
single reach of lower Tonawanda Creek (LTWC) of the upper Niagara River
watershed, Erie County, and a recovery plan was initiated in 2005 by the NYS
Department of Environmental Conservation to reintroduce them in historical waters
and establish new populations within their historic range. The plan began with a full
assessment of LTWC (Wells 2009) which captured 23 individuals that were used to
stock production ponds, along with northern sunfish transported from the Moira River
in Ontario, Canada, and the Huron River in Michigan. From 2006 to 2013, over
19,000 northern sunfish were stocked, and sporadic sampling detected recruitment
occurring in several of the stocked locations. More extensive sampling has been
needed to reassess the last wild population in LTWC and to thoroughly evaluate the
success of the restocking efforts in the Niagara River watershed.
1
Chapter 1
Population Characteristics of Bowfin (Amia calva) from a Great Lakes Coastal
Wetland, with an Investigation of Captive Breeding and Artificial Diet
Introduction
The bowfin (Amia calva Linnaeus, 1776) is a top-level predatory fish, feeding
primarily on small fish and crustaceans, commonly found in freshwater marshes and
backwaters throughout the majority of the Mississippi River drainage, many Atlantic
drainages from Florida to the Hudson River, and the Great Lakes and St. Lawrence
drainages (Scott & Crossman 1973). They can grow to nearly a meter in length,
breathe air through a vascularized lung, and live up to 30 years (Page & Burr 2011).
They are primitive ray-finned fish and the only extant species within the order
Amiiformes. In their northern range, they were considered an unpalatable competitor
of sportfish and were targeted for eradication by fisheries managers until the 1970s
(Miles 1913; Scarnecchia 1992). In their southern range, however, they have been a
component of Creole cuisine and are now being harvested for the sale of their roe.
Commercial harvest
Commercial interest in bowfin roe began in the southern U.S. in the early
1990s and is growing rapidly (Koch et al. 2009a) because the trade of sturgeon caviar
is highly limited and relies on overseas imports. Paddlefish (Polyodon spatula), gars
(Lepisosteidae), and now bowfin provide a domestic source of roe that is marketed as
2
a black caviar alternative. Bowfin are abundant throughout most of their range and
commercial harvest is unrestricted in all states except Louisiana. The industry for
bowfin roe has expanded to include Georgia (Porter et al. 2013) and may eventually
include the Great Lakes region (Dabrowski n.d.). However, very little is understood
about the ecological role of this large predatory fish or what the effect of commercial
harvesting would be in their northern range.
Need for aquaculture
The demand for bowfin roe is such that its culture likely would be profitable.
In 2003, the commercial catch in Louisiana totaled 92,000 kg of whole bowfins for
flesh and roe, the latter selling for $80/kg (Koch et al. 2009a). Koch et al. (2009a)
projected population dynamics of the species under current and predicted harvest
rates in the Upper Mississippi River (UMR) system. They warned that like sturgeon
the bowfin’s long lifespan and high juvenile mortality make the species vulnerable to
over-exploitation. Aquaculture would alleviate the ecological burden of wild harvest
and meet the high demand for a caviar alternative.
Life history
Adult bowfins display distinct sexual dimorphism year-round; males have a
black spot outlined in yellow, termed the ‘ocellus’ or eye-spot, on the upper caudal
peduncle, while females either lack the spot or have only a faint dot. Males and
females mature at age 2 in Louisiana (Davis 2006) and between ages 3 and 5 in

3
Quebec (Cartier & Magnin 1967). During the breeding season, the paired fins, anal
fin, and bellies become bright green in males (Scott & Crossman 1973; Page & Burr
2011). In Lower Michigan, the breeding season of bowfin in small inland lakes near
the Huron River is from late April to early June, when water temperatures are 16° to
19° C. Males build a bowl-shaped nest 30 to 90 cm in diameter, 10 to 20 cm deep
along the shores of marshes. Although male-male aggression occurs, nest densities
can be as high as seven per 6 m x 9 m area. Males construct nests by chewing the
stalks of submerged plants and fanning away muck. On rare occasions they will
utilize naturally occurring features, such as exposed fibrous roots, with no further
preparation. Females then deposit eggs that stick to the stubble or exposed roots.
Males remain guarding the nests and may mate with several females. The larvae
hatch within 8-10 days and are 8 mm long, at which point they attach themselves to
surrounding vegetation with the use of an adhesive pad located dorsally on the head.
After the yolk is depleted (15–19 days after fertilization), the hatchlings forage in
tightly-packed schools led by the male parent (Reighard 1903). Schools contain
between a few dozen to a few thousand young-of-the-year (YOY). The YOY fledge
the schools when they are 100 mm total length (TL; Scott & Crossman 1973).
Population characteristics
Bowfin in the Upper Mississippi River grow more slowly and larger, live
longer and mature later than southern populations in Louisiana and Georgia (Koch et
al. 2009a; Porter et al. 2013). This latitudinal gradient suggests that populations in

4
the Great Lakes should resemble those in the UMR. Slower growth rates, later
maturities and longer life spans increase the risk of over-exploitation. Data are
needed on populations from the Great Lakes to evaluate the potential impact of
commercial harvesting.
Four populations of bowfin have been described recently—two from the UMR
(Pools 11 and 13; Koch et al. 2009a), one from the upper Barataria estuary of
southeast Louisiana (Davis 2006), and one from a reservoir in south Georgia, Lake
Lindsay Grace (Porter et al. 2013). Additionally, Holland (1964) reported on a
population from the Mingo Swamp in southeastern Missouri (Figure 1A). These
studies used the gular plate (Holland 1964; Davis 2006) and first pectoral fin ray
sections (Koch et al. 2009a; Porter et al. 2013) to estimate age and measure growth.
Other populations have been described from higher latitudes using scales or otoliths
for aging: Schiavone (1982) for Butterfield Lake, New York; Cooper & Shafer
(1954) for Whitmore Lake, Michigan; and Cartier & Magnin (1967) for the Montreal
region of Quebec province, Canada. Koch et al. (2009b) compared the precision of
these structures in aging bowfin of the UMR and found that scales and otoliths were
unreliable, the gular plate was satisfactory, and first pectoral ray sections were
significantly more precise. No population of bowfin from the Great Lakes region has
been described using a reliable aging method.
5
Bowfin in captivity
Survival
Bowfin have been reported to survive in mud by aestivating (Dence 1933;
Neill 1950; Green 1966), and juveniles tolerate hypoxic conditions with no reduction
in the rate of growth (Dabrowski et al. 2012a). Due to aggressive behavior and
cannibalism, Huner (1994) reported 92% mortality over an eight-month period among
50, 51-mm TL YOY bowfin placed in a rectangular tank (0.9 x 2.1 x 0.15 m). Horn
& Riggs (1973) held six bowfin (438 ± 43 mm TL) for 77 days to test the effect of
water temperature on their rate of air-breathing. All but one died when exposed to
35.2° C, which they postulated is the critical thermal maximum for the species.
Reproduction
Recently, bowfin have been induced to spawn out of season by hormone
injection (Dabrowski et al. 2012a). Huner (1994) reported successful spawning in
southern Louisiana on two occasions in an 8 ha wooded slough stocked with 12, 1.3–
1.8 kg adult bowfin immediately before the breeding season. However, other
attempts did not produce spawning: two bare-bottomed ponds, two bare-bottomed
canals for two seasons, and a vegetated pond. Green (1966) was successful in
propagating bowfin in Alabama in a 1.3 ha pond filled after a season of being dry and
allowed to become overgrown with terrestrial plants.
6
Feeding
Huner (1994) found that bowfin in captivity, both adult and YOY, rejected dry
artificial feed and accepted a handmade wet pellet of ground fish, a commercial moist
pellet, and cut-bait such as chopped beef liver and heart, chopped shad, and fresh,
dead crayfish and shrimp. Bowfin broodstock in Louisiana were reported to accept a
floating commercial alligator gar pellet, as well as cut shrimp and fish (personal
communication, Dr. Allyse Ferrara, Nicholls State University). Dabrowski et al.
(2012a) reported successful weaning of hatchlings from brine shrimp to a formulated
feed at 25 mm TL.
Growth
Young-of-the-year bowfin are one of the fastest growing freshwater fish;
female fingerlings can grow up to 10% body weight per day between 20 and 200 g
(Dabrowski et al. 2012b). In production ponds in southern Louisiana, bowfin can
reach 508 mm TL and weigh 680 g in the first year (Huner 1994).
Objectives
In sum, little is known about bowfin life history in the wild and how to
propagate them in captivity. The goal of my study was to evaluate the potential
impacts of—and develop an in-captivity alternative to—commercial harvesting. The
objectives for attaining this goal were:
To describe age and growth characteristics of bowfin from a Great Lakes
coastal wetland and compare them to data from other areas of the U.S.

7
To explore the ability of wild bowfin to survive and reproduce in the
laboratory, and
To determine whether adult bowfin would accept a prepared diet in place
of live fish.
Methods
Bowfin collections
Fifty-five bowfin were collected from coastal wetlands along the southern
shore of Lake Ontario in Monroe County, New York. Thirty-six bowfin were
captured from 20 October to 12 November 2012 using fyke nets set overnight in
Braddock Bay (n=34) and Long Pond (n=2). Rectangular fyke nets had a 4.7 mm bar
mesh with a rectangular opening of 1.3 m x 1.0 m and a 4.5 m main lead, and round
fyke nets had a 25.4 mm bar mesh with a 1.3 m round opening and a 7.6 m main lead.
Two bowfin were collected on 24 September 2012 from the mouth of Sandy Creek
using boat electroshocking, and 17 bowfin were collected on 14 June 2013 in
Braddock Bay using nighttime boat electroshocking.
Upon capture, each bowfin was weighed, measured, photographed, and both
first pectoral fin rays were collected. The 55 bowfin were divided among the various
experiments as described in Appendix A. Attempts to capture bowfin also occurred
in Buck Pond, East Creek, and Rush Creek, Monroe County, New York, but were
unsuccessful (Figure 1; Appendix B)
8
Site descriptions
Braddock Bay, Long Pond, and Buck Pond are in a wetland complex managed
by NYSDEC as the Braddock Bay Fish and Wildlife Management Area. They are
also parts of the U.S. Environmental Protection Agency-designated Rochester
Embayment Area of Concern and a U.S. Department of State Significant Coastal Fish
and Wildlife Habitat (Figure 1).
Braddock Bay is roughly 1.3 x 0.7 km and has an open connection to Lake
Ontario. Two navigable tributaries, Salmon and Buttonwood Creeks, flow from the
west into the north and south corners, respectively. The bay is surrounded by a large
margin of emergent marsh dominated by cattail, Typha spp., a few residential
properties, and two marinas. The bay consists of a mix of dredged channels, shallow
sandy bottoms, and shallow, muck-bottomed wetlands dominated by a diverse array
of submerged and floating aquatic macrophytes. Long Pond is the largest
embayment, roughly 2.4 km x 0.8 km, and is connected to the lake by a channel.
Almost the entire shoreline of Long Pond is residential property, the average depth is
greater (2.1 m), and there is far less wetland area and very little submerged aquatic
vegetation. Buck Pond is a very shallow (average depth 0.5 m), hypereutrophic
marsh with very dense submerged aquatic vegetation (CADMUS 2010). The two
bowfin captured in Sandy Creek were caught in the 1-hectare back-barrier wetland,
consisting of submerged aquatic macrophytes surrounded by cattail. East and Rush
Creeks are small tributaries draining from cattail-dominated wetlands between Sandy
Creek and Braddock Bay (Figure 1B).
9
Population characteristics
Using standard fisheries techniques, the 51 bowfin captured from Braddock
Bay were compared to previously described bowfin populations—two from the UMR
(Pools 11 and 13; Koch et al. 2009a), one from the upper Barataria estuary of
southeast Louisiana (Davis 2006), one from a reservoir in south Georgia, Lake
Lindsay Grace (Porter et al. 2013), and one from the Mingo Swamp in southeastern
Missouri (Holland 1964; Figure 1A). Using methods adapted from Koch & Quist
(2007), the first pectoral fin rays of each fish were sectioned and digitally
photographed. Age and proportional growth increments were measured using
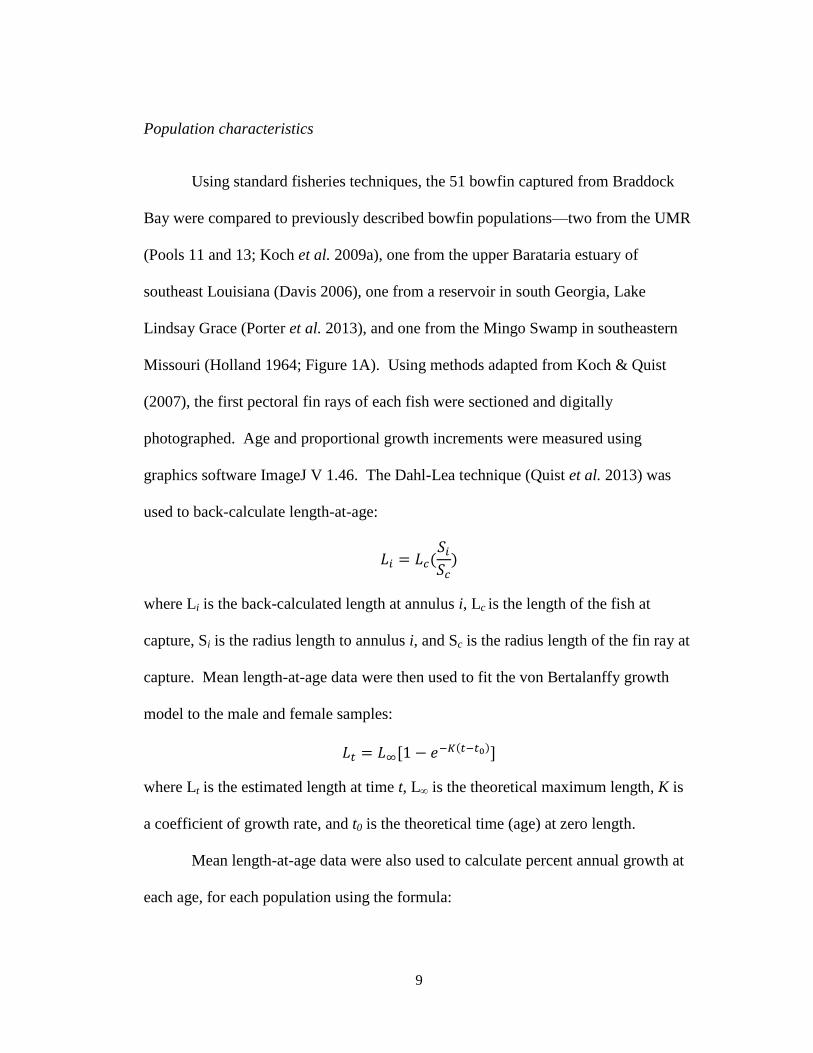
graphics software ImageJ V 1.46. The Dahl-Lea technique (Quist et al. 2013) was
used to back-calculate length-at-age:
𝐿𝑖 = 𝐿𝑐(𝑆𝑖
𝑆𝑐)
where Li is the back-calculated length at annulus i, Lc is the length of the fish at
capture, Si is the radius length to annulus i, and Sc is the radius length of the fin ray at
capture. Mean length-at-age data were then used to fit the von Bertalanffy growth
model to the male and female samples:
𝐿𝑡 = 𝐿∞[1 − 𝑒−𝐾(𝑡−𝑡0)]
where Lt is the estimated length at time t, L∞ is the theoretical maximum length, K is
a coefficient of growth rate, and t0 is the theoretical time (age) at zero length.
Mean length-at-age data were also used to calculate percent annual growth at
each age, for each population using the formula:

10
𝑀𝑒𝑎𝑛 𝐿𝑒𝑛𝑔𝑡ℎ𝑛+1 − 𝑀𝑒𝑎𝑛 𝐿𝑒𝑛𝑔𝑡ℎ𝑛
𝑀𝑒𝑎𝑛 𝐿𝑒𝑛𝑔𝑡ℎ𝑛
where n is the age. Mean length-at-age data were obtained using the Dahl-Lea
technique (Quist et al. 2013) for the Braddock Bay population; from raw data
published in Holland (1964) for the Mingo Swamp population; and data for the UMR
Pools 11 and 13 (Koch et al. 2009a), the Barataria estuary (Davis 2006), and Lake
Lindsay Grace (Porter et al. 2013) populations were provided by Dr. Michael Quist
(personal communication, University of Idaho).
Adapted low-cost method for sectioning pectoral fin rays
Each bowfin’s first pectoral fin rays were removed as close to the pectoral
girdle as possible. Ancillary bones and tissue were gently removed from the rays.
The distal end of each ray was inserted into a lump of putty, and a greased 1 cm x 1
cm x 3 cm metal tube was placed around the rays (Figure 2A). Clear epoxy was
poured into the tube to form a cast. After pushing the casts out of their tubes they
were placed into a 1 cm x 1 cm x 3 cm metal sectioning tube, which had a 2 mm
longitudinal gap along one side to allow pressure from a bench vise to hold the cast in
place (Figure 2B). Thin (0.2–0.3 mm) sections were cut with a jeweler’s saw fit with
a 4/0 (64 teeth/inch) blade. Both sides of each section were polished by wet-sanding
with 600 grit sandpaper.
The five most readable sections of each cast were fixed between two
microscope slides using clear epoxy (Figure 2C). A digital single lens reflex camera
fit with a 1x relay adapter captured images of the sections magnified 10x using a

11
compound light microscope. Some fin rays were larger than the field of view, in
which case their images were stitched using Microsoft® Image Composite Editor
V1.4.4 (http://research.microsoft.com/en-us/um/redmond/projects/ice/). The clearest
micrograph of each fish was selected, and annuli were measured down the long lobe
of the fin ray section (Figure 2D) using ImageJ V1.46 (http://imagej.nih.gov/ij/).
Captive breeding study
Five tanks and two aquaculture ponds were tested for their conduciveness to
breed bowfin from 24 October 2012 to 28 July 2013. Two 0.04 ha ponds were used
as pseudo-controls and both were stocked with two males and three females (personal
communication, Dr. Allyse Ferrara). Due to their differing sizes, tanks 1 and 2 each
housed one male and two females and tanks 3–5 each housed one male and one
female. Fish were allowed to feed ad libitum on live prey. In the event of mortality,
a dead bowfin was replaced if one of the same sex and roughly equal size was
available. Each bowfin’s size, duration of captivity, and tank/pond placement is
shown in Appendix A. At the end of the experiment all tanks and ponds were
thoroughly checked for nests, eggs, and bowfin YOY.
Recirculating aquaculture system design
A Recirculating Aquaculture System (RAS) was assembled in an unused
storage building at the College’s aquaculture ponds site. The system was self-
designed, mostly self-funded, had many problems with water quality initially, and
was redesigned twice to solve the water quality problems.
12
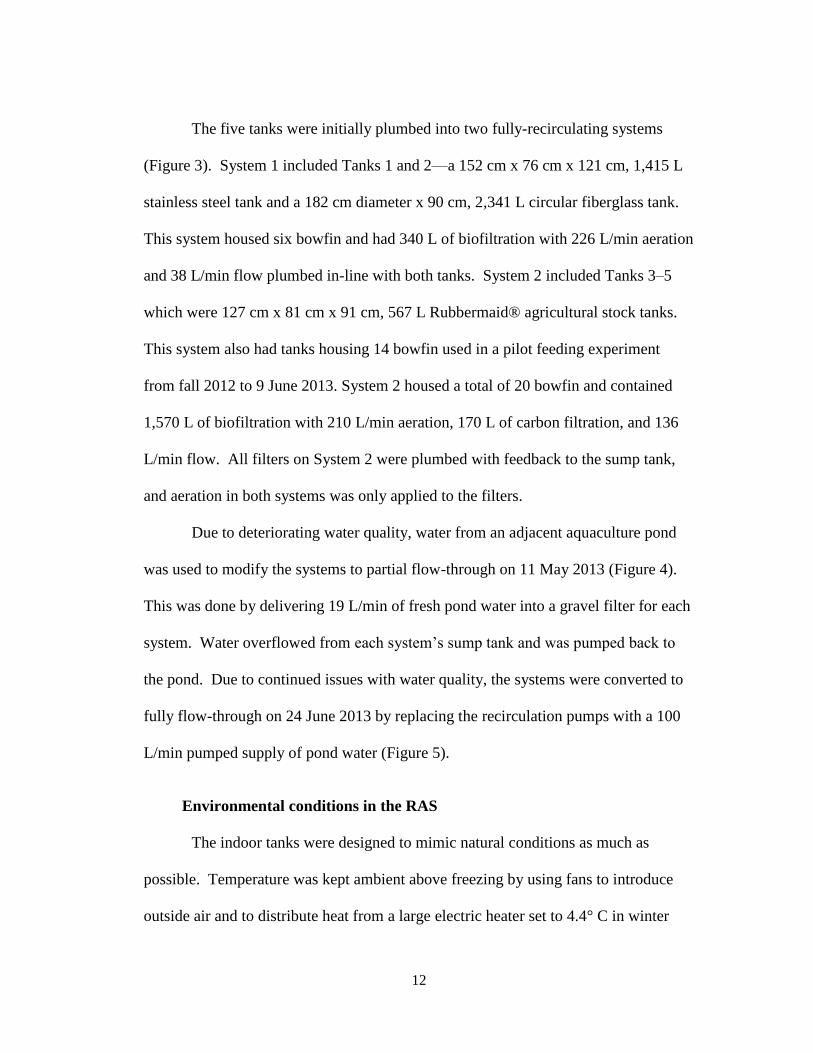
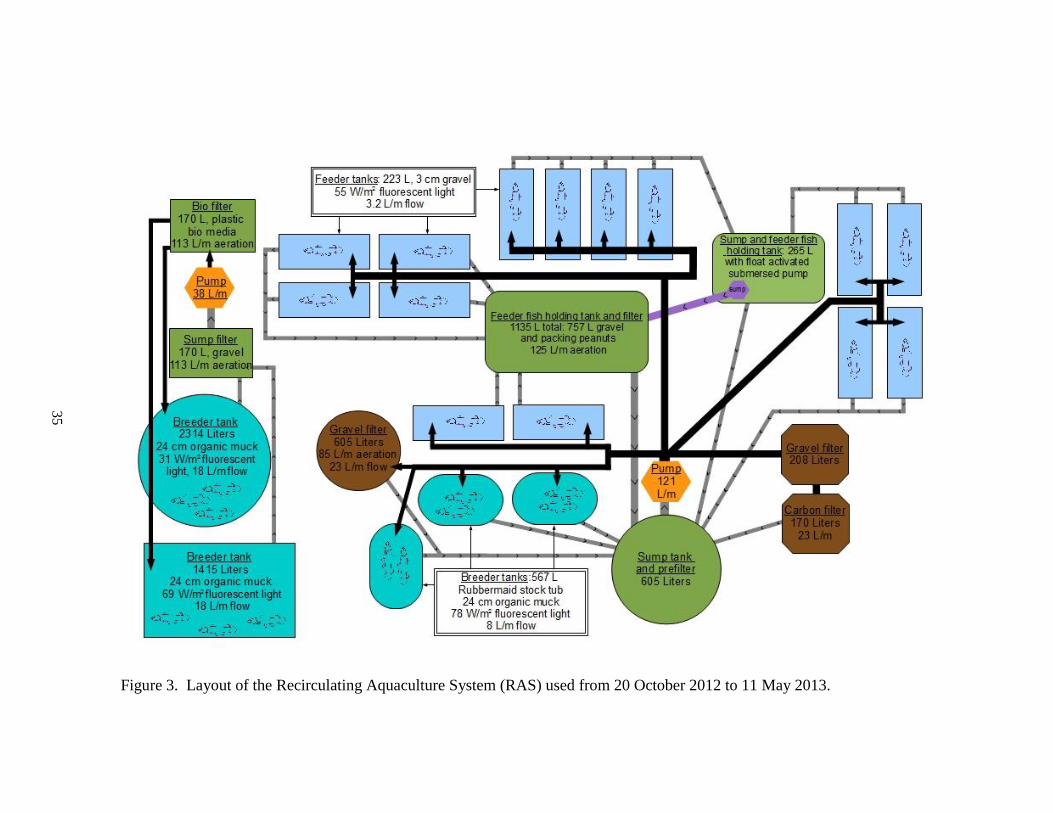
The five tanks were initially plumbed into two fully-recirculating systems
(Figure 3). System 1 included Tanks 1 and 2—a 152 cm x 76 cm x 121 cm, 1,415 L
stainless steel tank and a 182 cm diameter x 90 cm, 2,341 L circular fiberglass tank.
This system housed six bowfin and had 340 L of biofiltration with 226 L/min aeration
and 38 L/min flow plumbed in-line with both tanks. System 2 included Tanks 3–5
which were 127 cm x 81 cm x 91 cm, 567 L Rubbermaid® agricultural stock tanks.
This system also had tanks housing 14 bowfin used in a pilot feeding experiment
from fall 2012 to 9 June 2013. System 2 housed a total of 20 bowfin and contained
1,570 L of biofiltration with 210 L/min aeration, 170 L of carbon filtration, and 136
L/min flow. All filters on System 2 were plumbed with feedback to the sump tank,
and aeration in both systems was only applied to the filters.
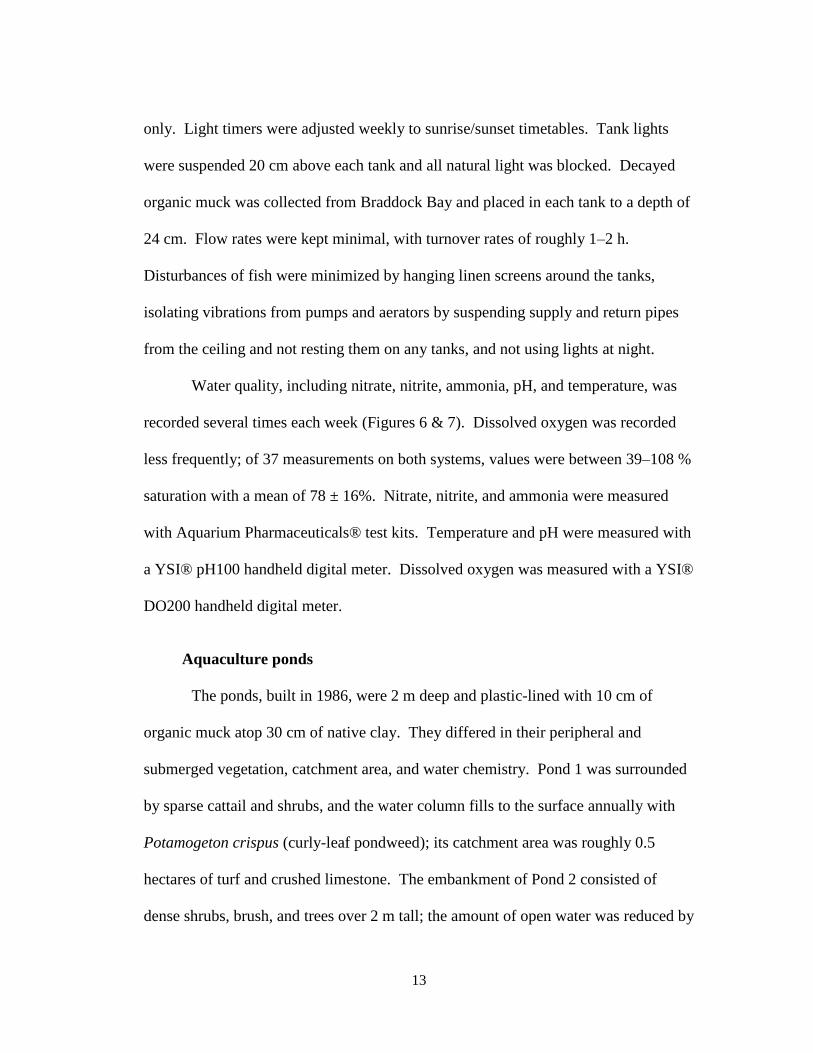
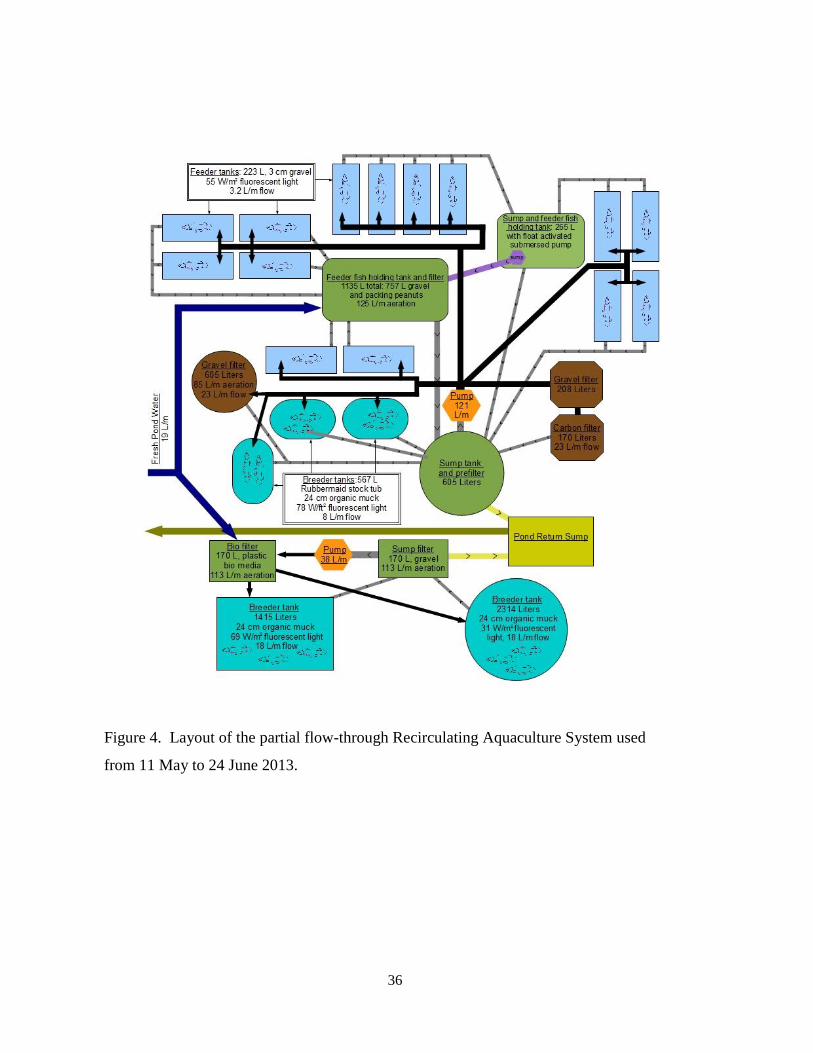
Due to deteriorating water quality, water from an adjacent aquaculture pond
was used to modify the systems to partial flow-through on 11 May 2013 (Figure 4).
This was done by delivering 19 L/min of fresh pond water into a gravel filter for each
system. Water overflowed from each system’s sump tank and was pumped back to
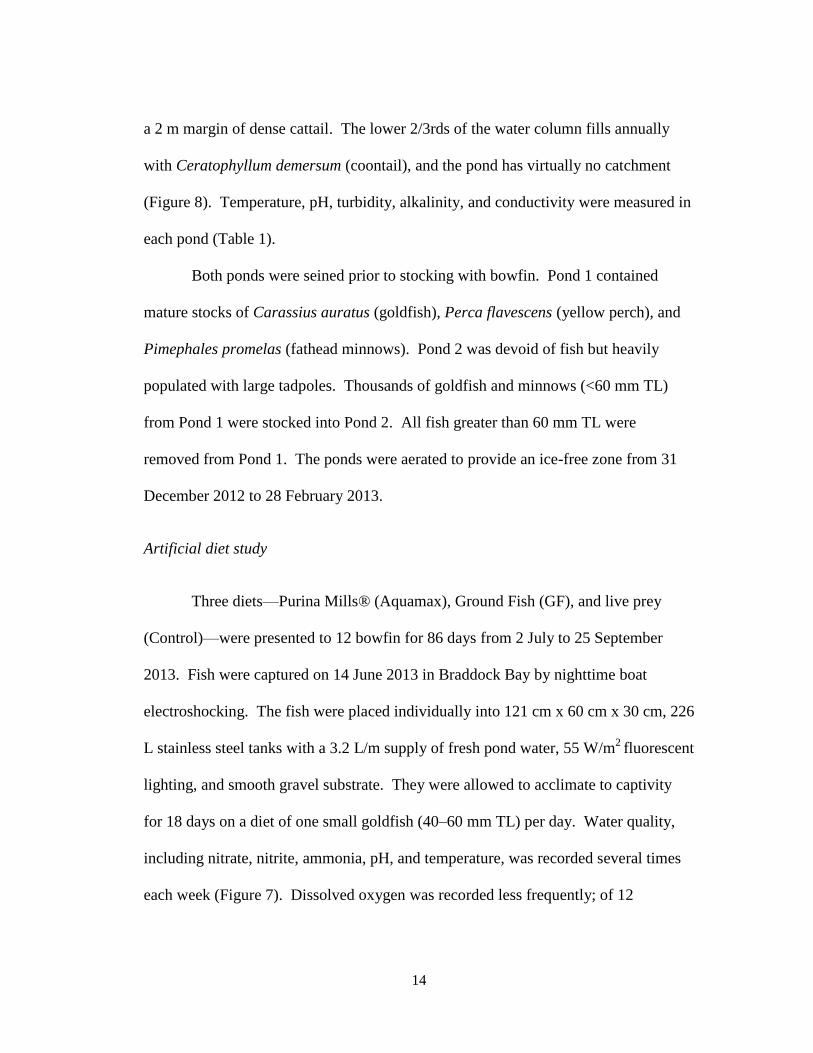
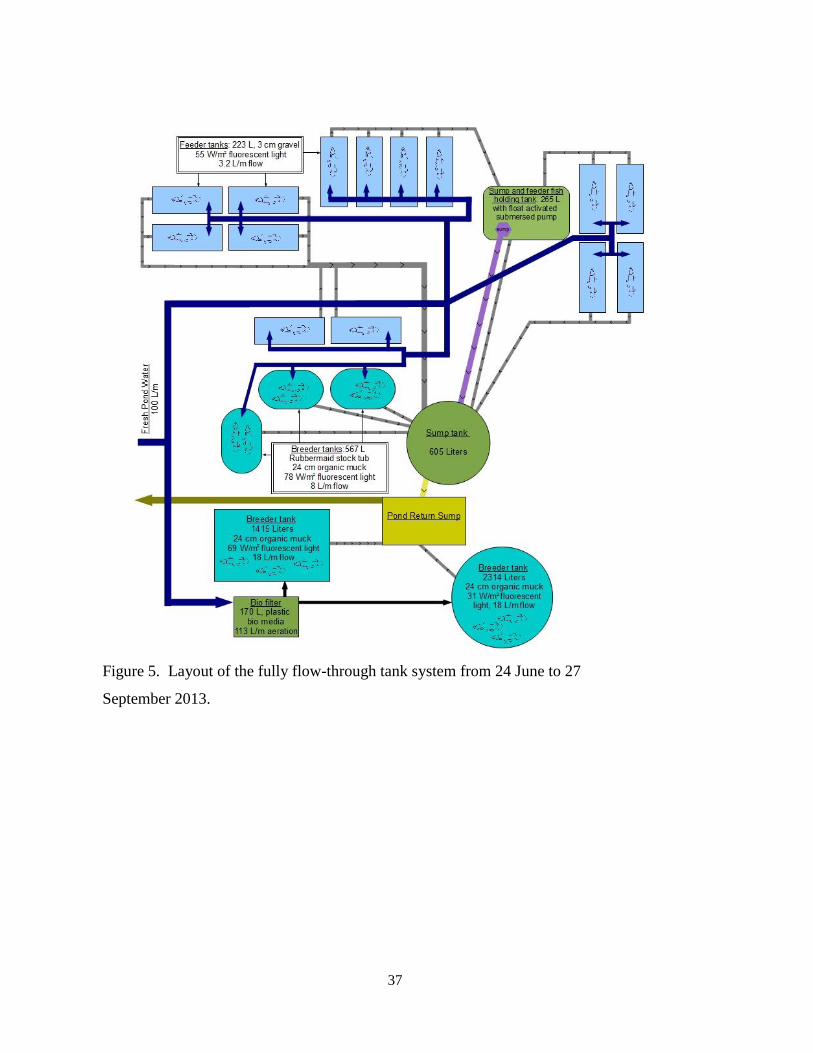
the pond. Due to continued issues with water quality, the systems were converted to
fully flow-through on 24 June 2013 by replacing the recirculation pumps with a 100
L/min pumped supply of pond water (Figure 5).
Environmental conditions in the RAS
The indoor tanks were designed to mimic natural conditions as much as
possible. Temperature was kept ambient above freezing by using fans to introduce
outside air and to distribute heat from a large electric heater set to 4.4° C in winter
13
only. Light timers were adjusted weekly to sunrise/sunset timetables. Tank lights
were suspended 20 cm above each tank and all natural light was blocked. Decayed
organic muck was collected from Braddock Bay and placed in each tank to a depth of
24 cm. Flow rates were kept minimal, with turnover rates of roughly 1–2 h.
Disturbances of fish were minimized by hanging linen screens around the tanks,
isolating vibrations from pumps and aerators by suspending supply and return pipes
from the ceiling and not resting them on any tanks, and not using lights at night.
Water quality, including nitrate, nitrite, ammonia, pH, and temperature, was
recorded several times each week (Figures 6 & 7). Dissolved oxygen was recorded
less frequently; of 37 measurements on both systems, values were between 39–108 %
saturation with a mean of 78 ± 16%. Nitrate, nitrite, and ammonia were measured
with Aquarium Pharmaceuticals® test kits. Temperature and pH were measured with
a YSI® pH100 handheld digital meter. Dissolved oxygen was measured with a YSI®
DO200 handheld digital meter.
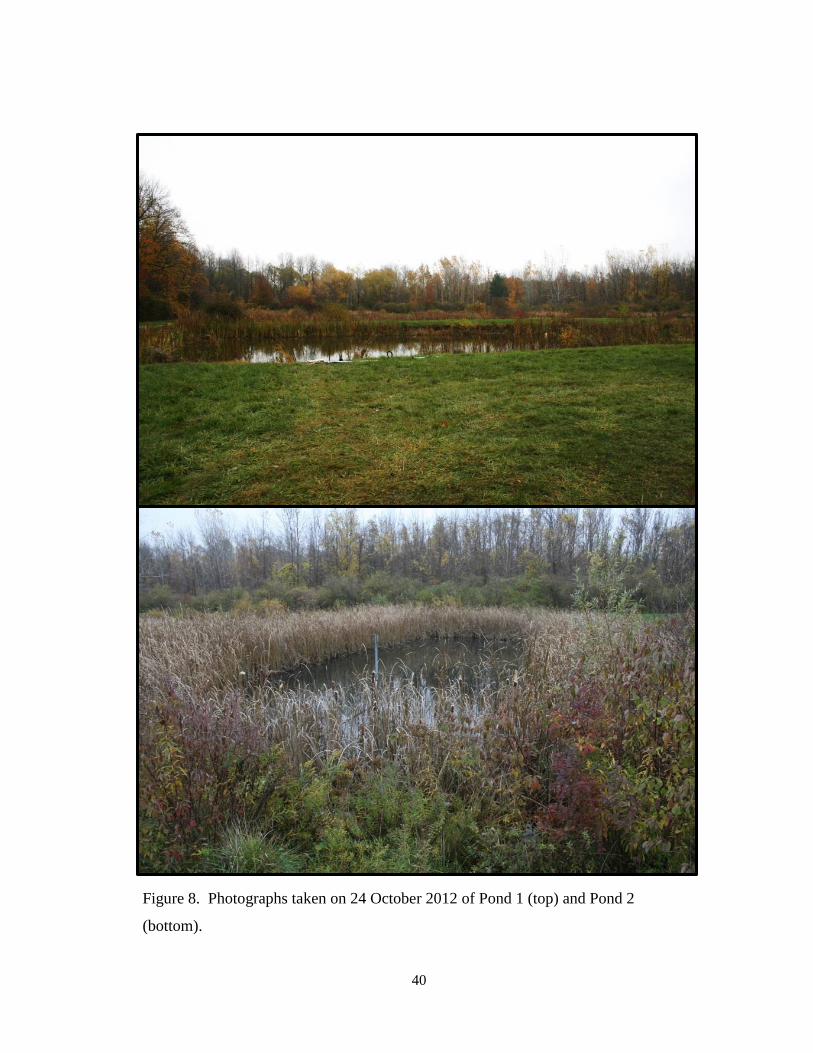
Aquaculture ponds
The ponds, built in 1986, were 2 m deep and plastic-lined with 10 cm of
organic muck atop 30 cm of native clay. They differed in their peripheral and
submerged vegetation, catchment area, and water chemistry. Pond 1 was surrounded
by sparse cattail and shrubs, and the water column fills to the surface annually with
Potamogeton crispus (curly-leaf pondweed); its catchment area was roughly 0.5
hectares of turf and crushed limestone. The embankment of Pond 2 consisted of
dense shrubs, brush, and trees over 2 m tall; the amount of open water was reduced by
14
a 2 m margin of dense cattail. The lower 2/3rds of the water column fills annually
with Ceratophyllum demersum (coontail), and the pond has virtually no catchment
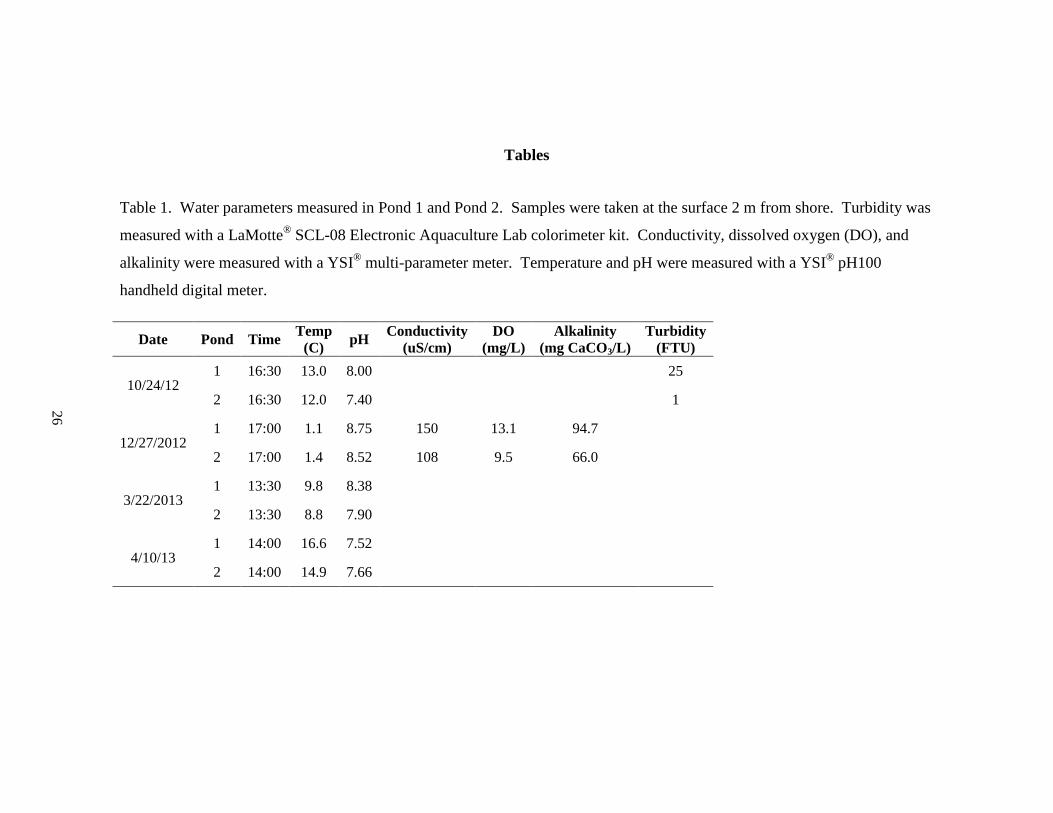
(Figure 8). Temperature, pH, turbidity, alkalinity, and conductivity were measured in
each pond (Table 1).
Both ponds were seined prior to stocking with bowfin. Pond 1 contained
mature stocks of Carassius auratus (goldfish), Perca flavescens (yellow perch), and
Pimephales promelas (fathead minnows). Pond 2 was devoid of fish but heavily
populated with large tadpoles. Thousands of goldfish and minnows (<60 mm TL)
from Pond 1 were stocked into Pond 2. All fish greater than 60 mm TL were
removed from Pond 1. The ponds were aerated to provide an ice-free zone from 31
December 2012 to 28 February 2013.
Artificial diet study
Three diets—Purina Mills® (Aquamax), Ground Fish (GF), and live prey
(Control)—were presented to 12 bowfin for 86 days from 2 July to 25 September
2013. Fish were captured on 14 June 2013 in Braddock Bay by nighttime boat
electroshocking. The fish were placed individually into 121 cm x 60 cm x 30 cm, 226
L stainless steel tanks with a 3.2 L/m supply of fresh pond water, 55 W/m2
fluorescent
lighting, and smooth gravel substrate. They were allowed to acclimate to captivity
for 18 days on a diet of one small goldfish (40–60 mm TL) per day. Water quality,
including nitrate, nitrite, ammonia, pH, and temperature, was recorded several times
each week (Figure 7). Dissolved oxygen was recorded less frequently; of 12
15
measurements, values were between 44–99% saturation with a mean of 71% (± 19%
SD). Nitrate, nitrite, and ammonia were measured with Aquarium Pharmaceuticals®
test kits. Temperature was measured using digital data loggers and pH was measured
with a YSI® pH100 handheld digital meter. Dissolved oxygen was measured with a
YSI® DO200 handheld digital meter. Percent consumption was used to compare the
acceptance of the diets; it was calculated as the number of pellets consumed ÷ number
presented for the artificial diets and as the total mass of prey consumed ÷ total mass
of prey presented for the control diet. All food and prey items were tracked for
consumption. A Kruskal-Wallis non-parametric one-way analysis of variance was
used to compare the percent change in each bowfin’s mass under the three diets,
which was found using the formula:
𝑓𝑖𝑛𝑎𝑙 𝑤𝑒𝑖𝑔ℎ𝑡 − 𝑖𝑛𝑖𝑡𝑖𝑎𝑙 𝑤𝑒𝑖𝑔ℎ𝑡
𝑖𝑛𝑖𝑡𝑖𝑎𝑙 𝑤𝑒𝑖𝑔ℎ𝑡
Diet composition
The Aquamax diet was a 19 mm extruded floating pellet with high protein,
low fat content and a mean weight of 4.5 g (± 0.68 SD, n = 351). The GF diet was a
19 mm moist pellet with a mean weight of 4.9 g (± 1.5 SD, n = 390). It was made
with 10% vitamin-enriched flour and 90% ground frozen freshwater fish, comprised
mostly of Oncorhynchus tshawytscha (Chinook salmon), Salmo trutta (brown trout),
Salmo salar (Atlantic salmon), Oncorhynchus mykiss (rainbow trout), Salvelinus
namaycush (lake trout), Catostomus and Moxostoma spp. (suckers), and Perca
flavescens (yellow perch). These two diets were analyzed for nutritional content by

16
Cumberland Valley Analytical Services, Inc. Maugansville, Maryland (Table 2). The
control diet consisted of juvenile Lepomis spp. (sunfish), goldfish, Notropis
atherinoides (emerald shiners), fathead minnows, large tadpoles, and crayfish. All
prey items were less than 70 mm TL and 40 mm in height, the latter to minimize size-
selective feeding (Mundahl et al. 1998).
Preparing the ground fish (GF) pellets
The heads, skin, and spines of frozen freshwater fish were removed prior to
grinding with a residential-grade food processor. About 25% of this product was
further blended in a commercial blender and mixed with flour. The mixture was then
squeezed into a “rope” onto trays using a meat grinder. After freezing, the rope was
cut into 3 cm-long segments. These were then placed into a forced-air laboratory
oven for 3 hours at 69° C, below the temperature at which vitamin C denatures
(NCBI 2015).
Feeding
Feeding took place in random order of tanks each day between 11:00 am and
10:30 pm. Pellets were presented one-at-a-time by tethering them to the tank lids
with string. If a pellet was consumed during the feeding process, it was replaced. A
minimum of 15 minutes had to transpire before leaving the room to allow the last fish
a chance to eat multiple pellets. The weight of each pellet was recorded. The control
diet was divided into three categories based on shape: minnows, sunfish and goldfish,
and tadpoles and crayfish. Two items of each category were kept in the tanks to
17
minimize any effect of prey preference. Total weight of prey presented was recorded
(Appendix C).
Results and Discussion
Bowfin collections
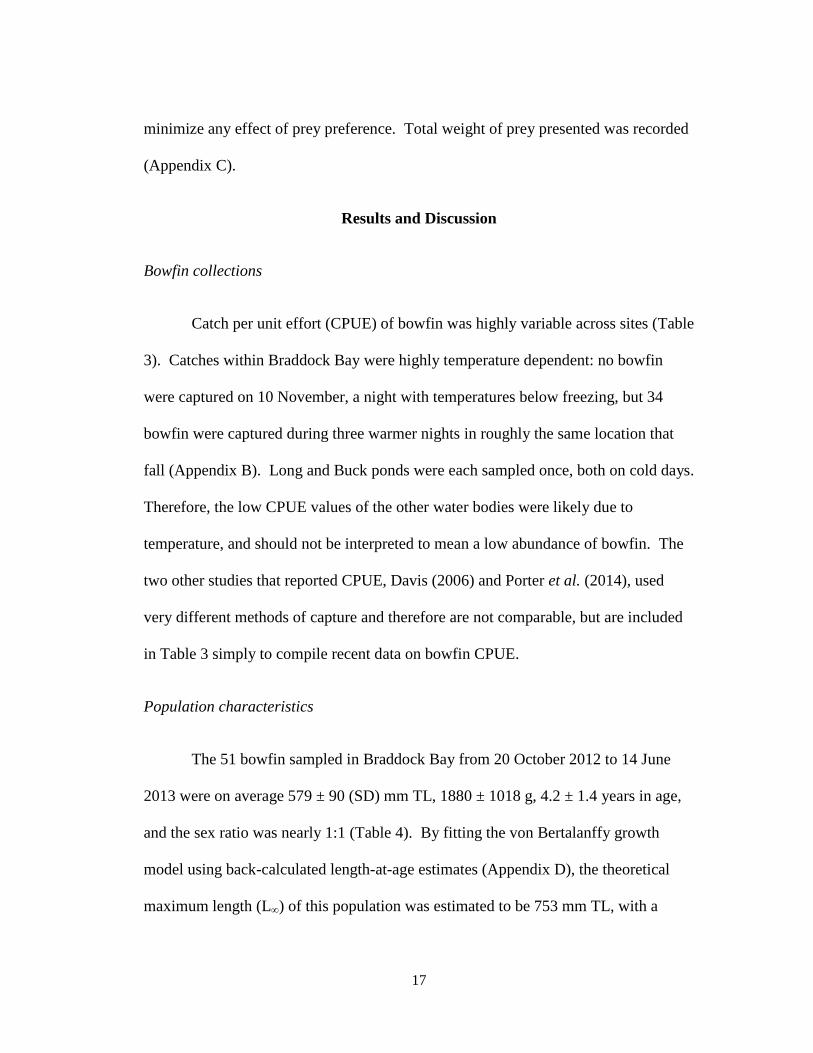
Catch per unit effort (CPUE) of bowfin was highly variable across sites (Table
3). Catches within Braddock Bay were highly temperature dependent: no bowfin
were captured on 10 November, a night with temperatures below freezing, but 34
bowfin were captured during three warmer nights in roughly the same location that
fall (Appendix B). Long and Buck ponds were each sampled once, both on cold days.
Therefore, the low CPUE values of the other water bodies were likely due to
temperature, and should not be interpreted to mean a low abundance of bowfin. The
two other studies that reported CPUE, Davis (2006) and Porter et al. (2014), used
very different methods of capture and therefore are not comparable, but are included
in Table 3 simply to compile recent data on bowfin CPUE.
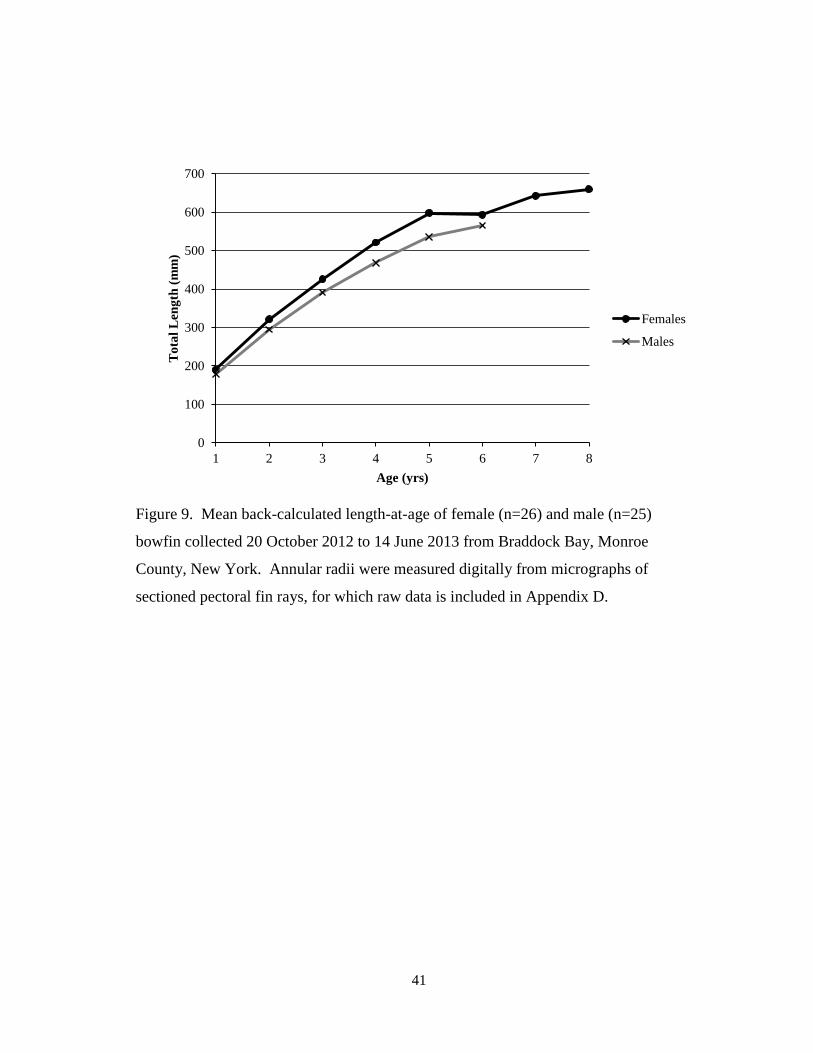
Population characteristics
The 51 bowfin sampled in Braddock Bay from 20 October 2012 to 14 June
2013 were on average 579 ± 90 (SD) mm TL, 1880 ± 1018 g, 4.2 ± 1.4 years in age,
and the sex ratio was nearly 1:1 (Table 4). By fitting the von Bertalanffy growth
model using back-calculated length-at-age estimates (Appendix D), the theoretical
maximum length (L∞) of this population was estimated to be 753 mm TL, with a
18
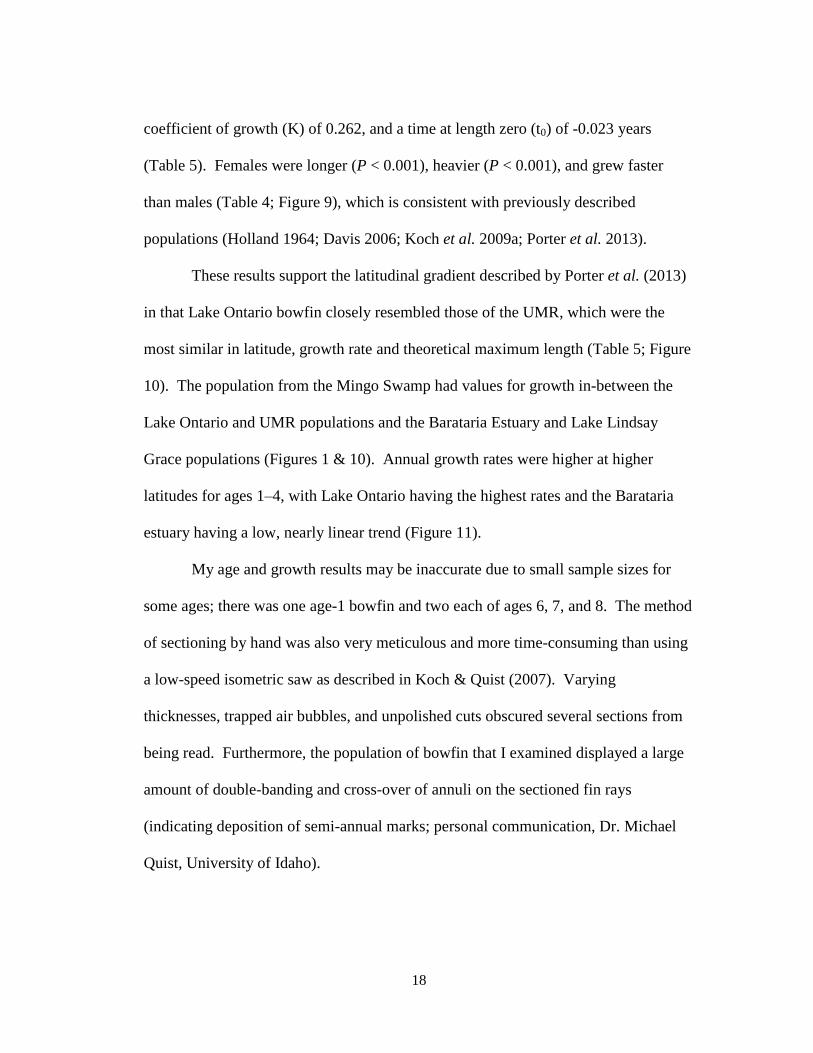
coefficient of growth (K) of 0.262, and a time at length zero (t0) of -0.023 years
(Table 5). Females were longer (P < 0.001), heavier (P < 0.001), and grew faster
than males (Table 4; Figure 9), which is consistent with previously described
populations (Holland 1964; Davis 2006; Koch et al. 2009a; Porter et al. 2013).
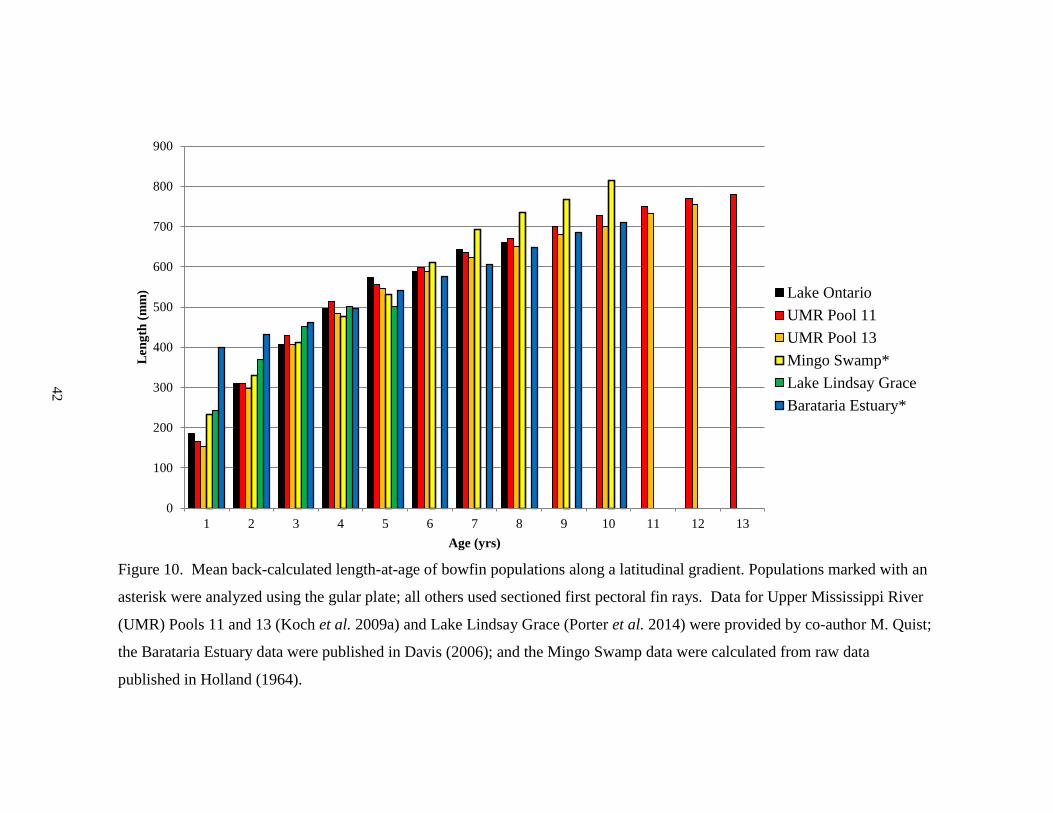
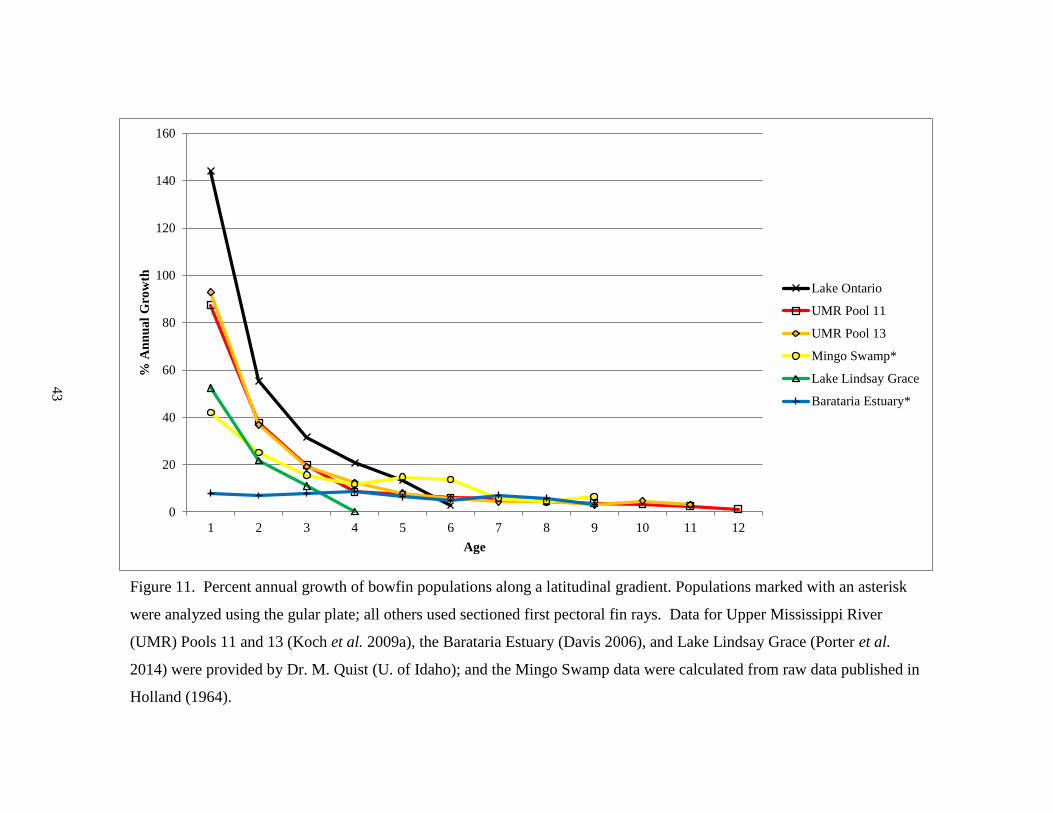
These results support the latitudinal gradient described by Porter et al. (2013)
in that Lake Ontario bowfin closely resembled those of the UMR, which were the
most similar in latitude, growth rate and theoretical maximum length (Table 5; Figure
10). The population from the Mingo Swamp had values for growth in-between the
Lake Ontario and UMR populations and the Barataria Estuary and Lake Lindsay
Grace populations (Figures 1 & 10). Annual growth rates were higher at higher
latitudes for ages 1–4, with Lake Ontario having the highest rates and the Barataria
estuary having a low, nearly linear trend (Figure 11).
My age and growth results may be inaccurate due to small sample sizes for
some ages; there was one age-1 bowfin and two each of ages 6, 7, and 8. The method
of sectioning by hand was also very meticulous and more time-consuming than using
a low-speed isometric saw as described in Koch & Quist (2007). Varying
thicknesses, trapped air bubbles, and unpolished cuts obscured several sections from
being read. Furthermore, the population of bowfin that I examined displayed a large
amount of double-banding and cross-over of annuli on the sectioned fin rays
(indicating deposition of semi-annual marks; personal communication, Dr. Michael
Quist, University of Idaho).

19
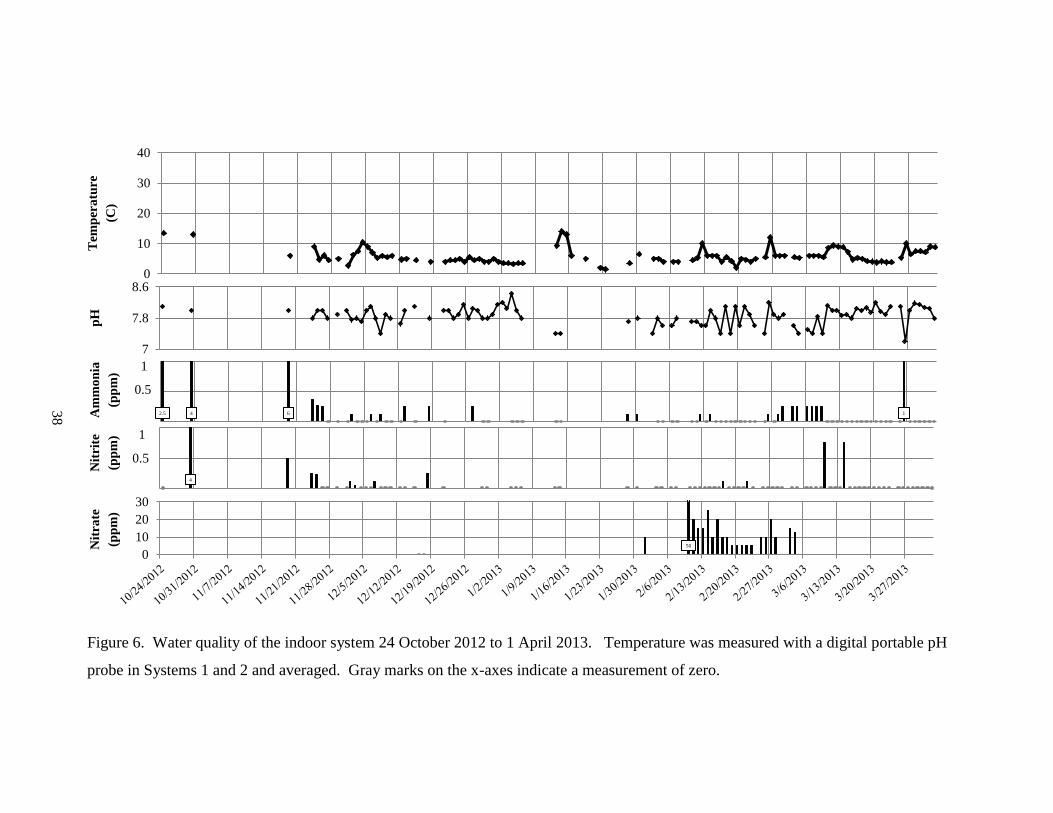
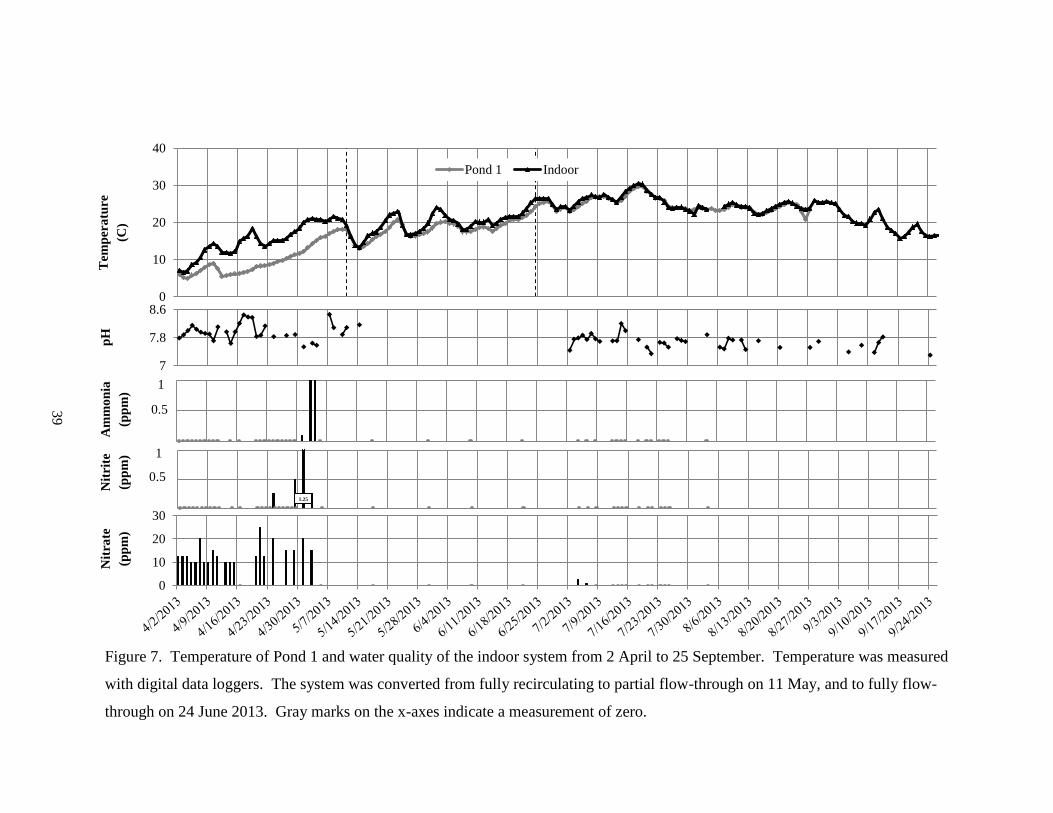
Water quality of the indoor system
The initial RAS system encountered highly fluctuating pH values and harmful
levels of ammonia, nitrite, and nitrate from its conception on 24 October 2012 to 11
May 2013 (Figures 6&7). This was likely due to an overloading of the system with
biomass, despite the large amount of biofiltration (Figure 3), from both the bowfin
themselves, totaling 39 kg (Appendix A), and the enormous amount of freshly
disturbed, oxygenating, and actively decomposing organic muck used for bowfin
substrate. The temperature of this system was also higher than Pond 1 from 2 April
to 11 May 2013 (Figure 7). The captive conditions experienced by the indoor bowfin
did not match natural conditions, which may have caused stress that led to the
mortality observed (Appendix A). Converting to a partial flow-through system on 11
May 2013 (Figure 4) somewhat alleviated these issues, and converting to a fully flow-
through system on 24 June 2013 (Figure 5) with water from an adjacent pond almost
completely alleviated these issues (Figure 7).
Captive breeding
Breeding did not occur in any tank or pond. The only possible signs of
breeding occurred 13–16 June 2013 in Pond 1 when a male was observed stirring the
sediment near the shoreline, however no nest was built. Breeding coloration was
displayed by the indoor bowfin and the males and females were often seen lying side-
by-side.
20
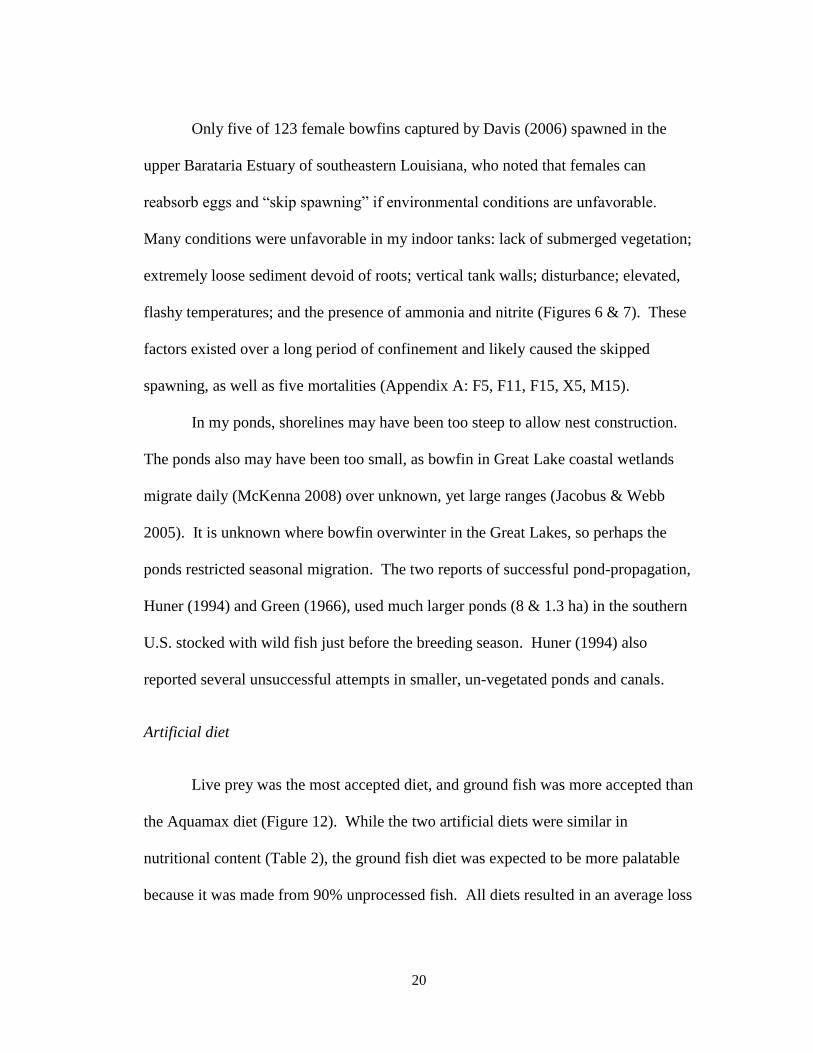
Only five of 123 female bowfins captured by Davis (2006) spawned in the
upper Barataria Estuary of southeastern Louisiana, who noted that females can
reabsorb eggs and “skip spawning” if environmental conditions are unfavorable.
Many conditions were unfavorable in my indoor tanks: lack of submerged vegetation;
extremely loose sediment devoid of roots; vertical tank walls; disturbance; elevated,
flashy temperatures; and the presence of ammonia and nitrite (Figures 6 & 7). These
factors existed over a long period of confinement and likely caused the skipped
spawning, as well as five mortalities (Appendix A: F5, F11, F15, X5, M15).
In my ponds, shorelines may have been too steep to allow nest construction.
The ponds also may have been too small, as bowfin in Great Lake coastal wetlands
migrate daily (McKenna 2008) over unknown, yet large ranges (Jacobus & Webb
2005). It is unknown where bowfin overwinter in the Great Lakes, so perhaps the
ponds restricted seasonal migration. The two reports of successful pond-propagation,
Huner (1994) and Green (1966), used much larger ponds (8 & 1.3 ha) in the southern
U.S. stocked with wild fish just before the breeding season. Huner (1994) also
reported several unsuccessful attempts in smaller, un-vegetated ponds and canals.
Artificial diet
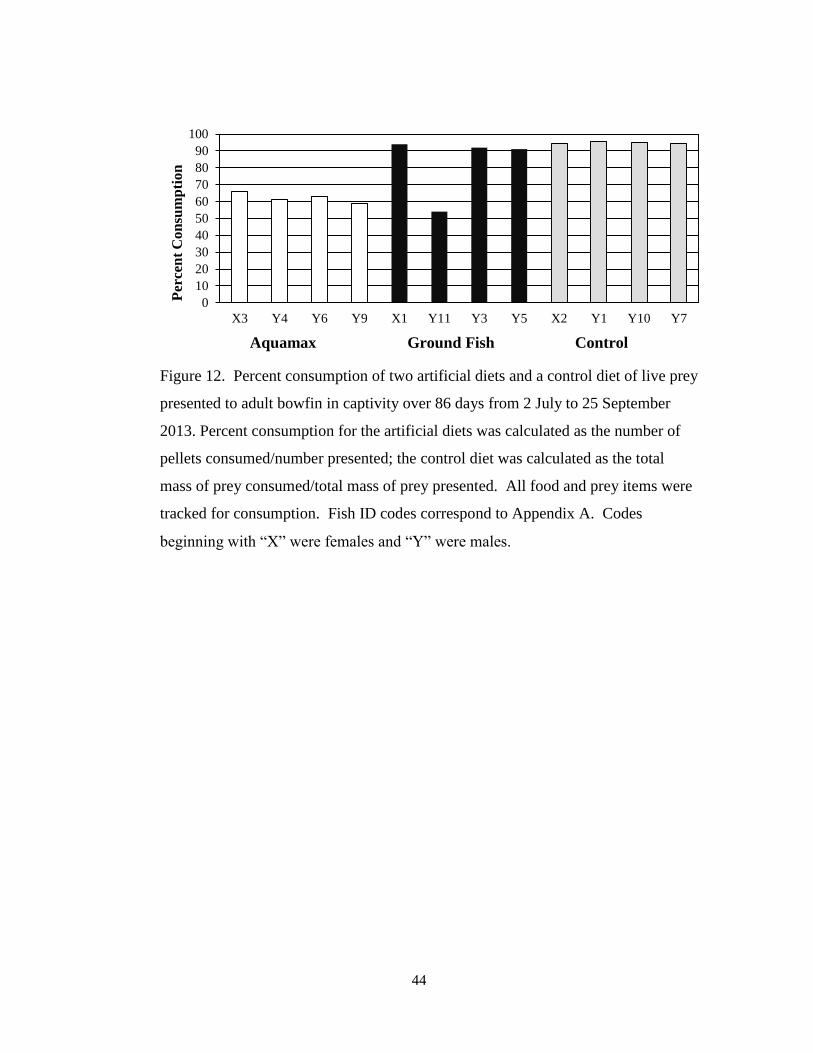
Live prey was the most accepted diet, and ground fish was more accepted than
the Aquamax diet (Figure 12). While the two artificial diets were similar in
nutritional content (Table 2), the ground fish diet was expected to be more palatable
because it was made from 90% unprocessed fish. All diets resulted in an average loss
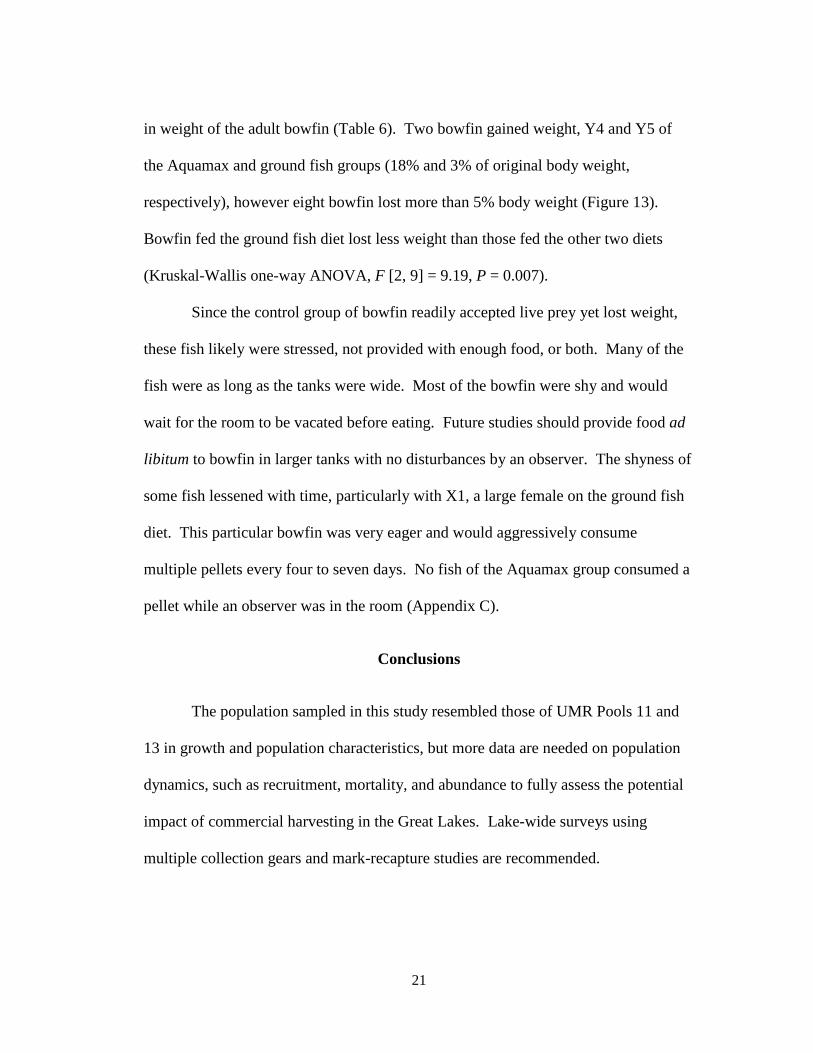
21
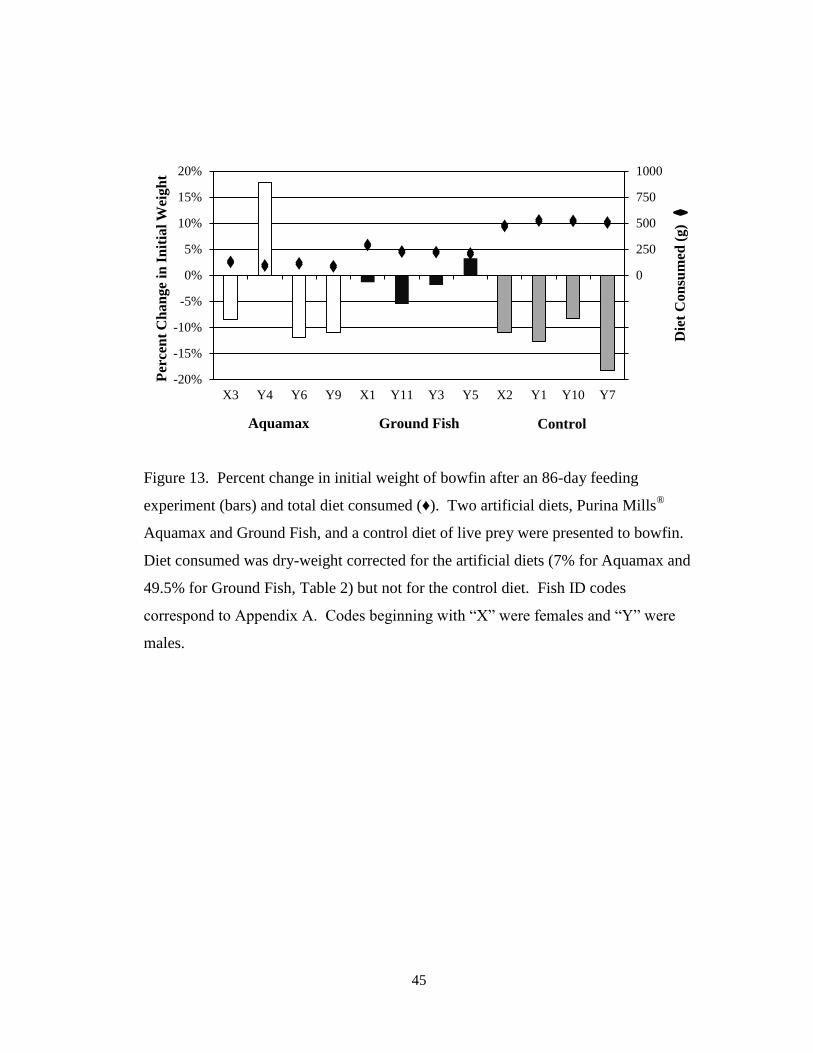
in weight of the adult bowfin (Table 6). Two bowfin gained weight, Y4 and Y5 of
the Aquamax and ground fish groups (18% and 3% of original body weight,
respectively), however eight bowfin lost more than 5% body weight (Figure 13).
Bowfin fed the ground fish diet lost less weight than those fed the other two diets
(Kruskal-Wallis one-way ANOVA, F [2, 9] = 9.19, P = 0.007).
Since the control group of bowfin readily accepted live prey yet lost weight,
these fish likely were stressed, not provided with enough food, or both. Many of the
fish were as long as the tanks were wide. Most of the bowfin were shy and would
wait for the room to be vacated before eating. Future studies should provide food ad
libitum to bowfin in larger tanks with no disturbances by an observer. The shyness of
some fish lessened with time, particularly with X1, a large female on the ground fish
diet. This particular bowfin was very eager and would aggressively consume
multiple pellets every four to seven days. No fish of the Aquamax group consumed a
pellet while an observer was in the room (Appendix C).
Conclusions
The population sampled in this study resembled those of UMR Pools 11 and
13 in growth and population characteristics, but more data are needed on population
dynamics, such as recruitment, mortality, and abundance to fully assess the potential
impact of commercial harvesting in the Great Lakes. Lake-wide surveys using
multiple collection gears and mark-recapture studies are recommended.

22
The method I used to section pectoral fin rays by hand is recommended only if
a low-speed isometric saw is not available. My method ultimately worked, but is
unsuitable for large-scale projects with a limited budget because many sections had to
be cut in order to ensure at least one readable fin ray section.
Intensive aquaculture of this species (tanks and RASs) will require induced
spawning, which Dabrowski (2012a) has recently accomplished. Container size
should be maximized and water quality kept consistent with conditions in the wild. A
moist-pellet diet would probably be the most accepted feed. Extensive culture will
require large ponds (>1 ha) with gently sloping, heavily vegetated areas 1 m or less in
depth for breeding. Very little aggression was observed, even in the indoor tanks, so
bowfin may tolerate high stocking rates. A semi-domesticated strain could possibly
be developed since a few bowfin (e.g. Y4, Y5, X1; Appendix C) adjusted to captivity
very well. Further research is needed to identify ideal diets for the maintenance of
brood stock and grow-out of hatchlings, as well as on environmental conditions that
will promote growth and reproduction of bowfin in captivity for aquaculture
purposes.
23
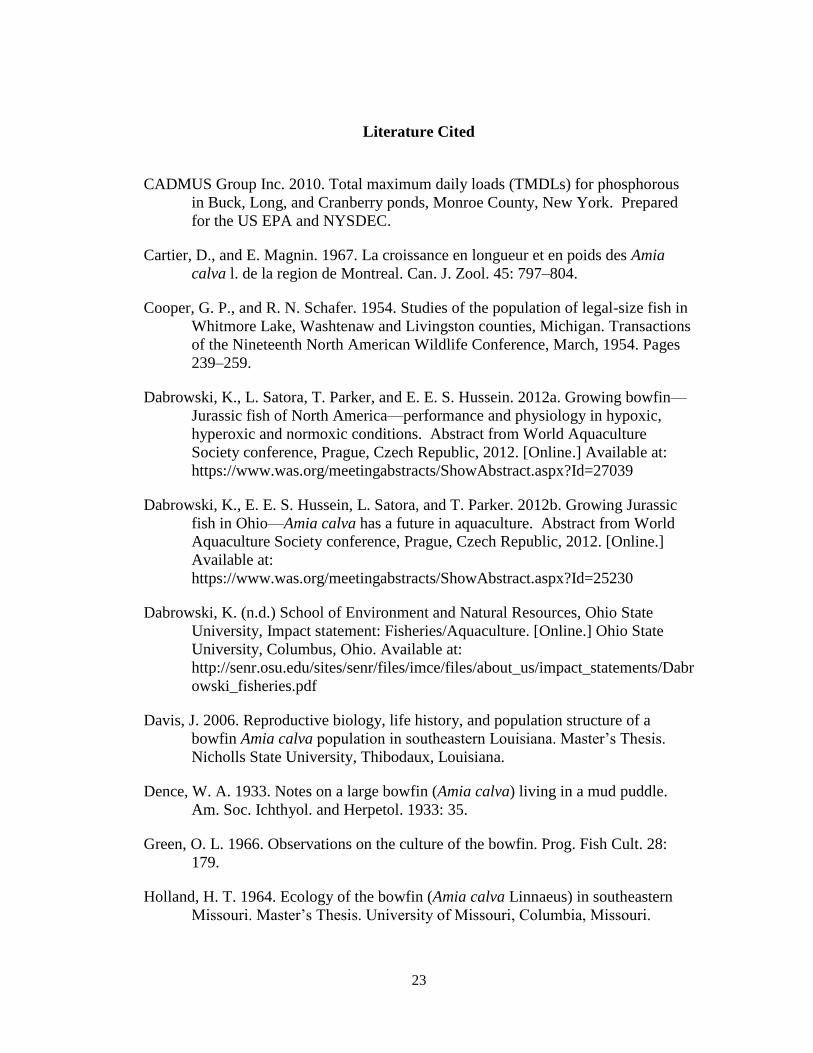
Literature Cited
CADMUS Group Inc. 2010. Total maximum daily loads (TMDLs) for phosphorous
in Buck, Long, and Cranberry ponds, Monroe County, New York. Prepared
for the US EPA and NYSDEC.
Cartier, D., and E. Magnin. 1967. La croissance en longueur et en poids des Amia
calva l. de la region de Montreal. Can. J. Zool. 45: 797–804.
Cooper, G. P., and R. N. Schafer. 1954. Studies of the population of legal-size fish in
Whitmore Lake, Washtenaw and Livingston counties, Michigan. Transactions
of the Nineteenth North American Wildlife Conference, March, 1954. Pages
239–259.
Dabrowski, K., L. Satora, T. Parker, and E. E. S. Hussein. 2012a. Growing bowfin—
Jurassic fish of North America—performance and physiology in hypoxic,
hyperoxic and normoxic conditions. Abstract from World Aquaculture
Society conference, Prague, Czech Republic, 2012. [Online.] Available at:
https://www.was.org/meetingabstracts/ShowAbstract.aspx?Id=27039
Dabrowski, K., E. E. S. Hussein, L. Satora, and T. Parker. 2012b. Growing Jurassic
fish in Ohio—Amia calva has a future in aquaculture. Abstract from World
Aquaculture Society conference, Prague, Czech Republic, 2012. [Online.]
Available at:
https://www.was.org/meetingabstracts/ShowAbstract.aspx?Id=25230
Dabrowski, K. (n.d.) School of Environment and Natural Resources, Ohio State
University, Impact statement: Fisheries/Aquaculture. [Online.] Ohio State
University, Columbus, Ohio. Available at:
http://senr.osu.edu/sites/senr/files/imce/files/about_us/impact_statements/Dabr
owski_fisheries.pdf
Davis, J. 2006. Reproductive biology, life history, and population structure of a
bowfin Amia calva population in southeastern Louisiana. Master’s Thesis.
Nicholls State University, Thibodaux, Louisiana.
Dence, W. A. 1933. Notes on a large bowfin (Amia calva) living in a mud puddle.
Am. Soc. Ichthyol. and Herpetol. 1933: 35.
Green, O. L. 1966. Observations on the culture of the bowfin. Prog. Fish Cult. 28:
179.
Holland, H. T. 1964. Ecology of the bowfin (Amia calva Linnaeus) in southeastern
Missouri. Master’s Thesis. University of Missouri, Columbia, Missouri.
24
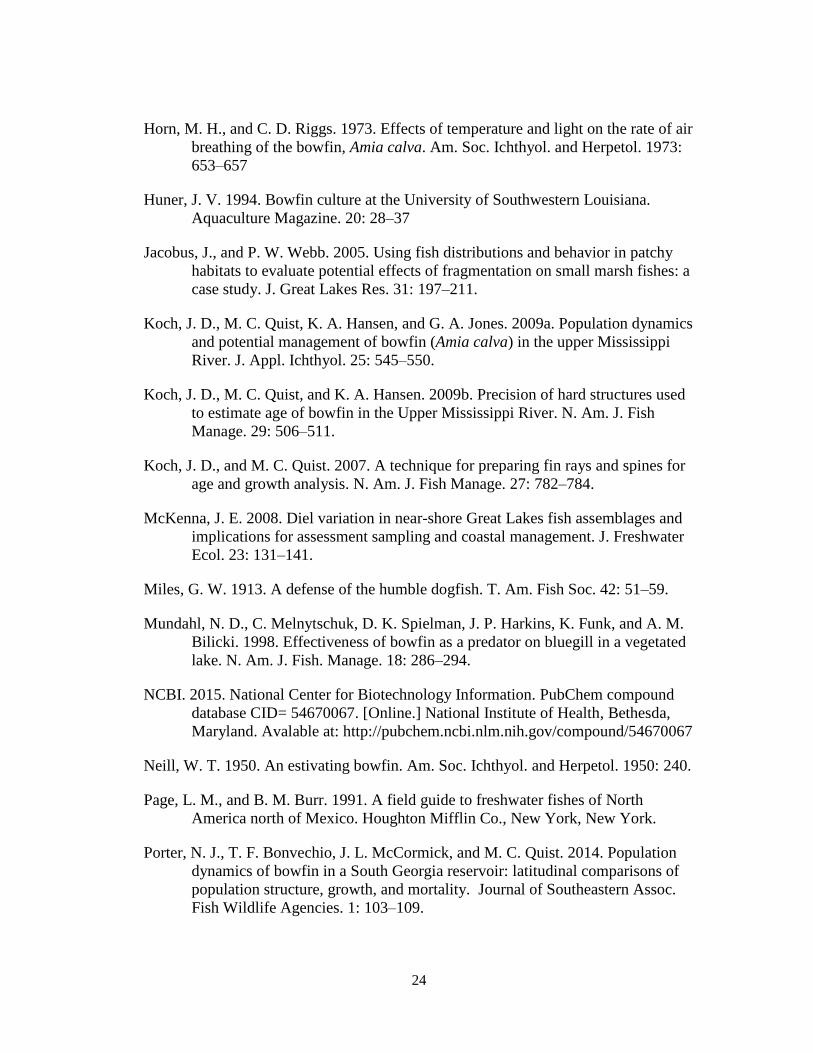
Horn, M. H., and C. D. Riggs. 1973. Effects of temperature and light on the rate of air
breathing of the bowfin, Amia calva. Am. Soc. Ichthyol. and Herpetol. 1973:
653–657
Huner, J. V. 1994. Bowfin culture at the University of Southwestern Louisiana.
Aquaculture Magazine. 20: 28–37
Jacobus, J., and P. W. Webb. 2005. Using fish distributions and behavior in patchy
habitats to evaluate potential effects of fragmentation on small marsh fishes: a
case study. J. Great Lakes Res. 31: 197–211.
Koch, J. D., M. C. Quist, K. A. Hansen, and G. A. Jones. 2009a. Population dynamics
and potential management of bowfin (Amia calva) in the upper Mississippi
River. J. Appl. Ichthyol. 25: 545–550.
Koch, J. D., M. C. Quist, and K. A. Hansen. 2009b. Precision of hard structures used
to estimate age of bowfin in the Upper Mississippi River. N. Am. J. Fish
Manage. 29: 506–511.
Koch, J. D., and M. C. Quist. 2007. A technique for preparing fin rays and spines for
age and growth analysis. N. Am. J. Fish Manage. 27: 782–784.
McKenna, J. E. 2008. Diel variation in near-shore Great Lakes fish assemblages and
implications for assessment sampling and coastal management. J. Freshwater
Ecol. 23: 131–141.
Miles, G. W. 1913. A defense of the humble dogfish. T. Am. Fish Soc. 42: 51–59.
Mundahl, N. D., C. Melnytschuk, D. K. Spielman, J. P. Harkins, K. Funk, and A. M.
Bilicki. 1998. Effectiveness of bowfin as a predator on bluegill in a vegetated
lake. N. Am. J. Fish. Manage. 18: 286–294.
NCBI. 2015. National Center for Biotechnology Information. PubChem compound
database CID= 54670067. [Online.] National Institute of Health, Bethesda,
Maryland. Avalable at: http://pubchem.ncbi.nlm.nih.gov/compound/54670067
Neill, W. T. 1950. An estivating bowfin. Am. Soc. Ichthyol. and Herpetol. 1950: 240.
Page, L. M., and B. M. Burr. 1991. A field guide to freshwater fishes of North
America north of Mexico. Houghton Mifflin Co., New York, New York.
Porter, N. J., T. F. Bonvechio, J. L. McCormick, and M. C. Quist. 2014. Population
dynamics of bowfin in a South Georgia reservoir: latitudinal comparisons of
population structure, growth, and mortality. Journal of Southeastern Assoc.
Fish Wildlife Agencies. 1: 103–109.
25
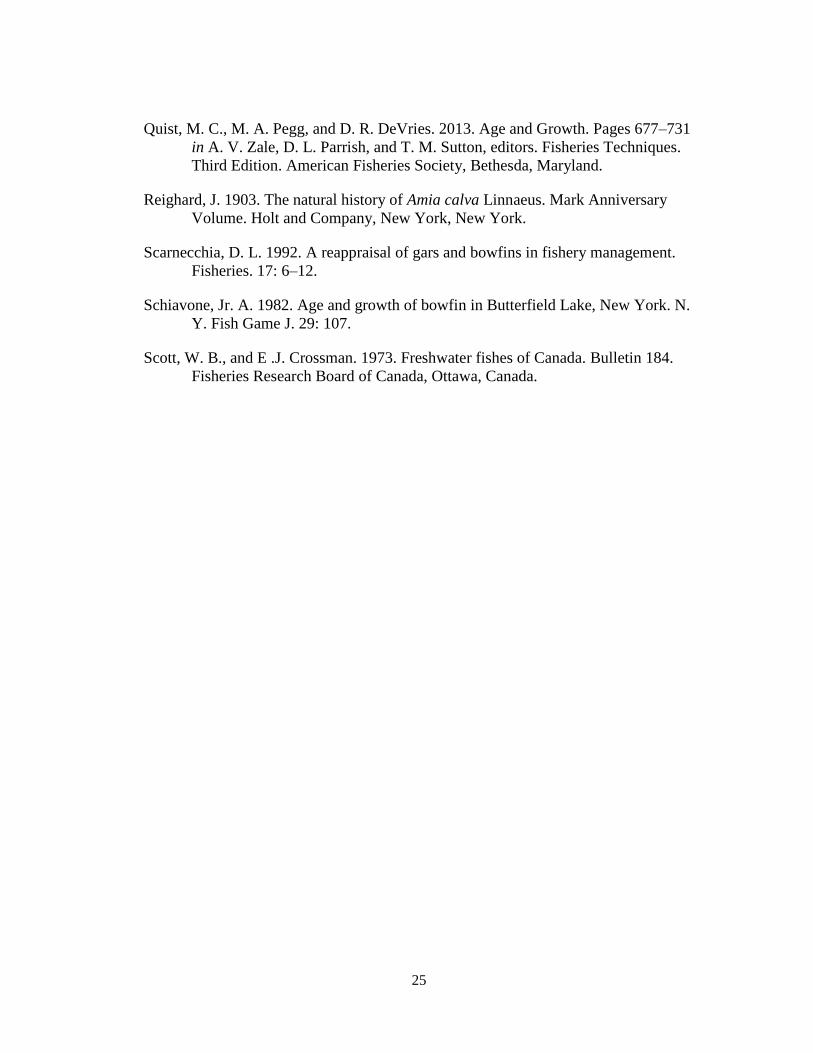
Quist, M. C., M. A. Pegg, and D. R. DeVries. 2013. Age and Growth. Pages 677–731
in A. V. Zale, D. L. Parrish, and T. M. Sutton, editors. Fisheries Techniques.
Third Edition. American Fisheries Society, Bethesda, Maryland.
Reighard, J. 1903. The natural history of Amia calva Linnaeus. Mark Anniversary
Volume. Holt and Company, New York, New York.
Scarnecchia, D. L. 1992. A reappraisal of gars and bowfins in fishery management.
Fisheries. 17: 6–12.
Schiavone, Jr. A. 1982. Age and growth of bowfin in Butterfield Lake, New York. N.
Y. Fish Game J. 29: 107.
Scott, W. B., and E .J. Crossman. 1973. Freshwater fishes of Canada. Bulletin 184.
Fisheries Research Board of Canada, Ottawa, Canada.
26
Tables
Table 1. Water parameters measured in Pond 1 and Pond 2. Samples were taken at the surface 2 m from shore. Turbidity was
measured with a LaMotte® SCL-08 Electronic Aquaculture Lab colorimeter kit. Conductivity, dissolved oxygen (DO), and
alkalinity were measured with a YSI® multi-parameter meter. Temperature and pH were measured with a YSI
® pH100
handheld digital meter.
Date Pond Time Temp
(C) pH
Conductivity
(uS/cm)
DO
(mg/L)
Alkalinity
(mg CaCO3/L)
Turbidity
(FTU)
10/24/12 1 16:30 13.0 8.00
25
2 16:30 12.0 7.40
1
12/27/2012 1 17:00 1.1 8.75 150 13.1 94.7
2 17:00 1.4 8.52 108 9.5 66.0
3/22/2013 1 13:30 9.8 8.38
2 13:30 8.8 7.90
4/10/13 1 14:00 16.6 7.52
2 14:00 14.9 7.66
27
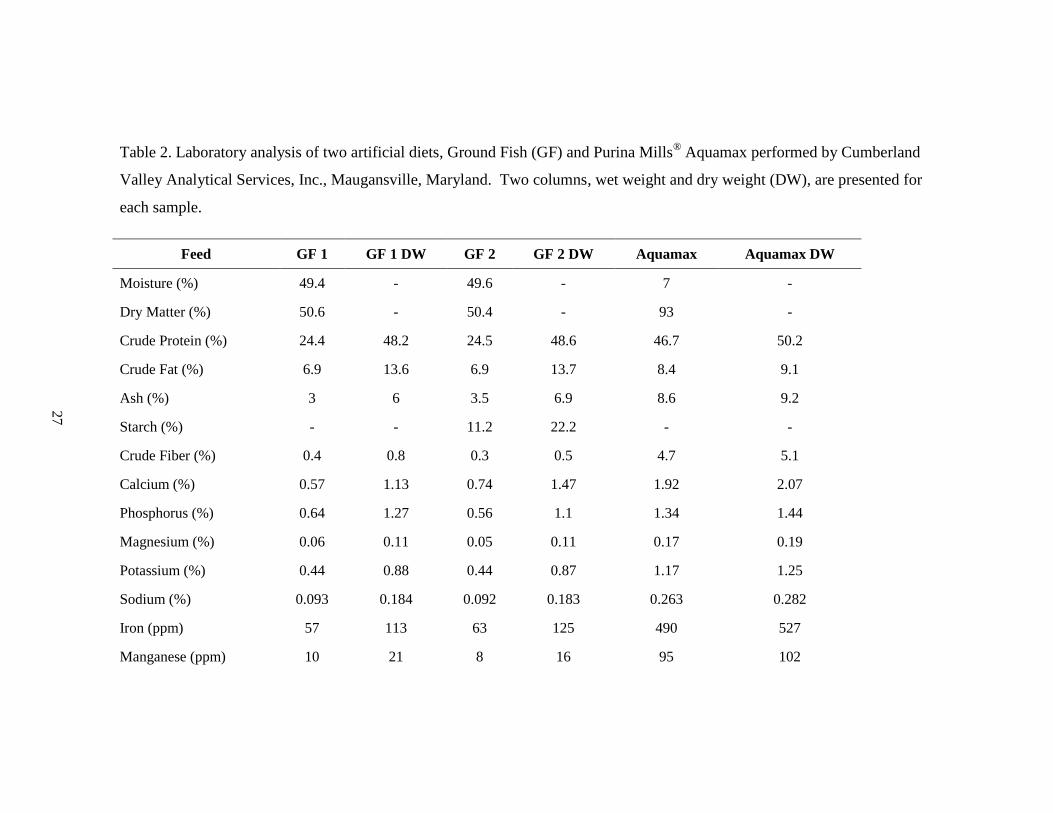
Table 2. Laboratory analysis of two artificial diets, Ground Fish (GF) and Purina Mills® Aquamax performed by Cumberland
Valley Analytical Services, Inc., Maugansville, Maryland. Two columns, wet weight and dry weight (DW), are presented for
each sample.
Feed GF 1 GF 1 DW GF 2 GF 2 DW Aquamax Aquamax DW
Moisture (%) 49.4 - 49.6 - 7 -
Dry Matter (%) 50.6 - 50.4 - 93 -
Crude Protein (%) 24.4 48.2 24.5 48.6 46.7 50.2
Crude Fat (%) 6.9 13.6 6.9 13.7 8.4 9.1
Ash (%) 3 6 3.5 6.9 8.6 9.2
Starch (%) - - 11.2 22.2 - -
Crude Fiber (%) 0.4 0.8 0.3 0.5 4.7 5.1
Calcium (%) 0.57 1.13 0.74 1.47 1.92 2.07
Phosphorus (%) 0.64 1.27 0.56 1.1 1.34 1.44
Magnesium (%) 0.06 0.11 0.05 0.11 0.17 0.19
Potassium (%) 0.44 0.88 0.44 0.87 1.17 1.25
Sodium (%) 0.093 0.184 0.092 0.183 0.263 0.282
Iron (ppm) 57 113 63 125 490 527
Manganese (ppm) 10 21 8 16 95 102
28
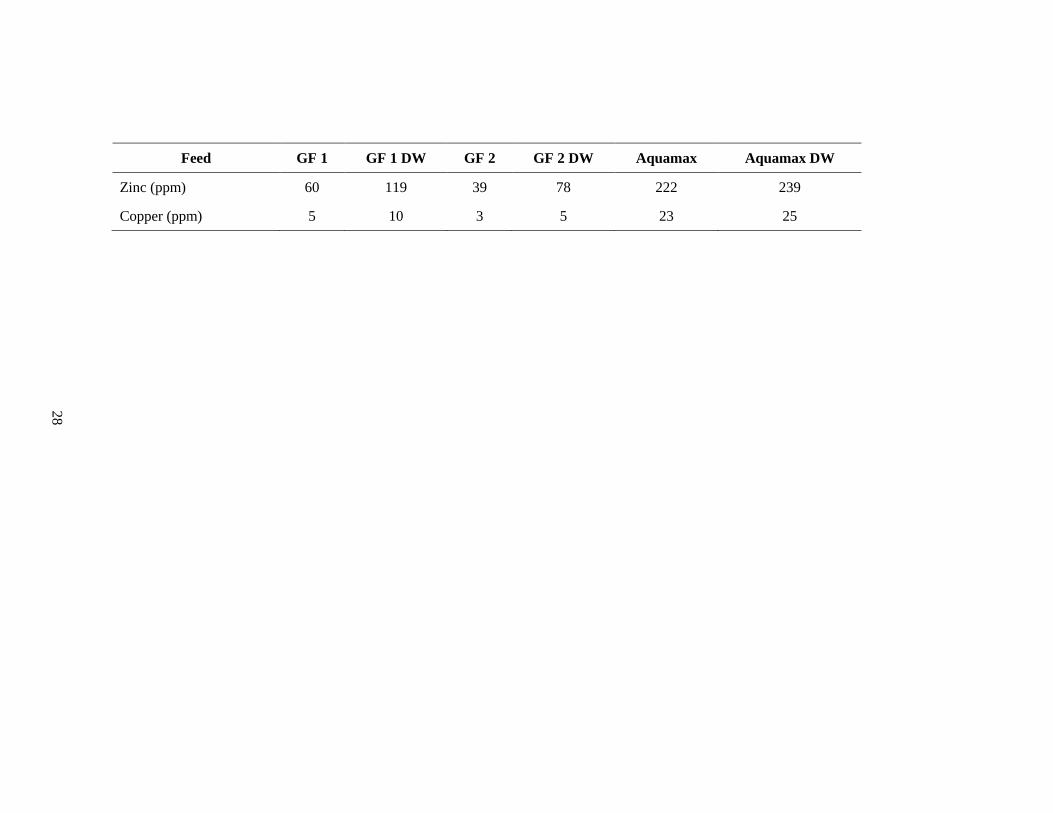
Feed GF 1 GF 1 DW GF 2 GF 2 DW Aquamax Aquamax DW
Zinc (ppm) 60 119 39 78 222 239
Copper (ppm) 5 10 3 5 23 25
29
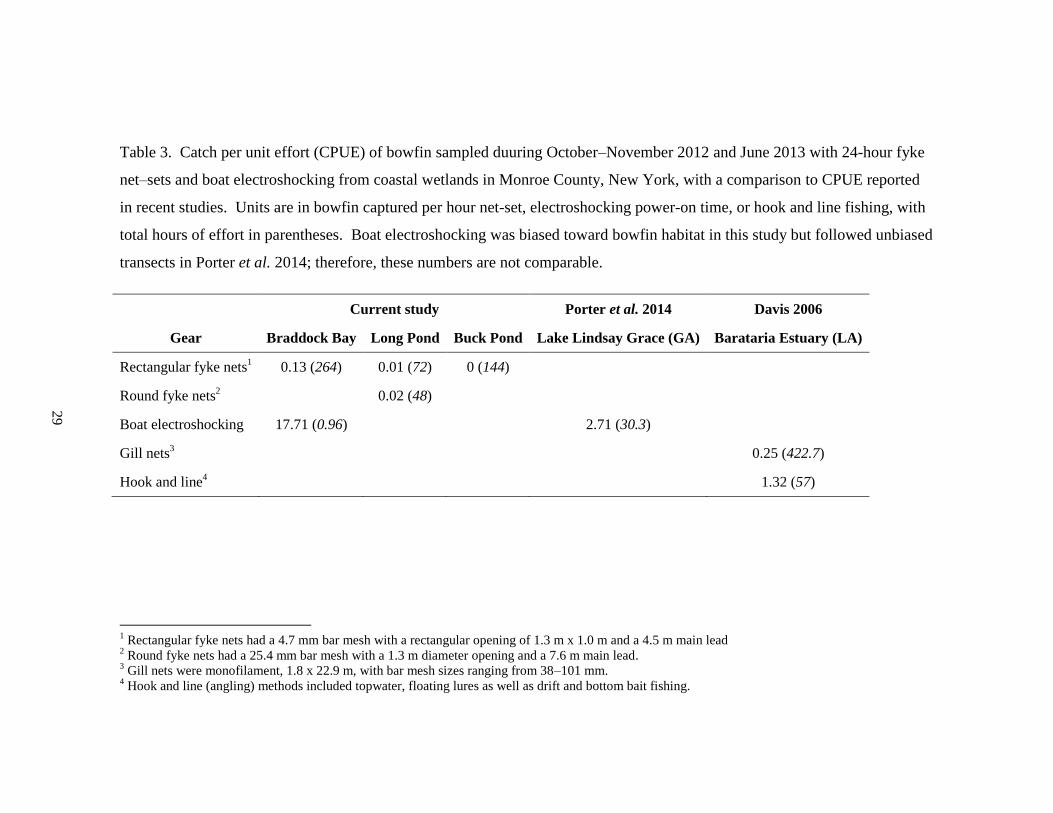
Table 3. Catch per unit effort (CPUE) of bowfin sampled duuring October–November 2012 and June 2013 with 24-hour fyke
net–sets and boat electroshocking from coastal wetlands in Monroe County, New York, with a comparison to CPUE reported
in recent studies. Units are in bowfin captured per hour net-set, electroshocking power-on time, or hook and line fishing, with
total hours of effort in parentheses. Boat electroshocking was biased toward bowfin habitat in this study but followed unbiased
transects in Porter et al. 2014; therefore, these numbers are not comparable.
Current study Porter et al. 2014 Davis 2006
Gear Braddock Bay Long Pond Buck Pond Lake Lindsay Grace (GA) Barataria Estuary (LA)
Rectangular fyke nets1 0.13 (264) 0.01 (72) 0 (144)
Round fyke nets2 0.02 (48)
Boat electroshocking 17.71 (0.96)
2.71 (30.3)
Gill nets3 0.25 (422.7)
Hook and line4 1.32 (57)
1 Rectangular fyke nets had a 4.7 mm bar mesh with a rectangular opening of 1.3 m x 1.0 m and a 4.5 m main lead
2 Round fyke nets had a 25.4 mm bar mesh with a 1.3 m diameter opening and a 7.6 m main lead.
3 Gill nets were monofilament, 1.8 x 22.9 m, with bar mesh sizes ranging from 38–101 mm.
4 Hook and line (angling) methods included topwater, floating lures as well as drift and bottom bait fishing.
30
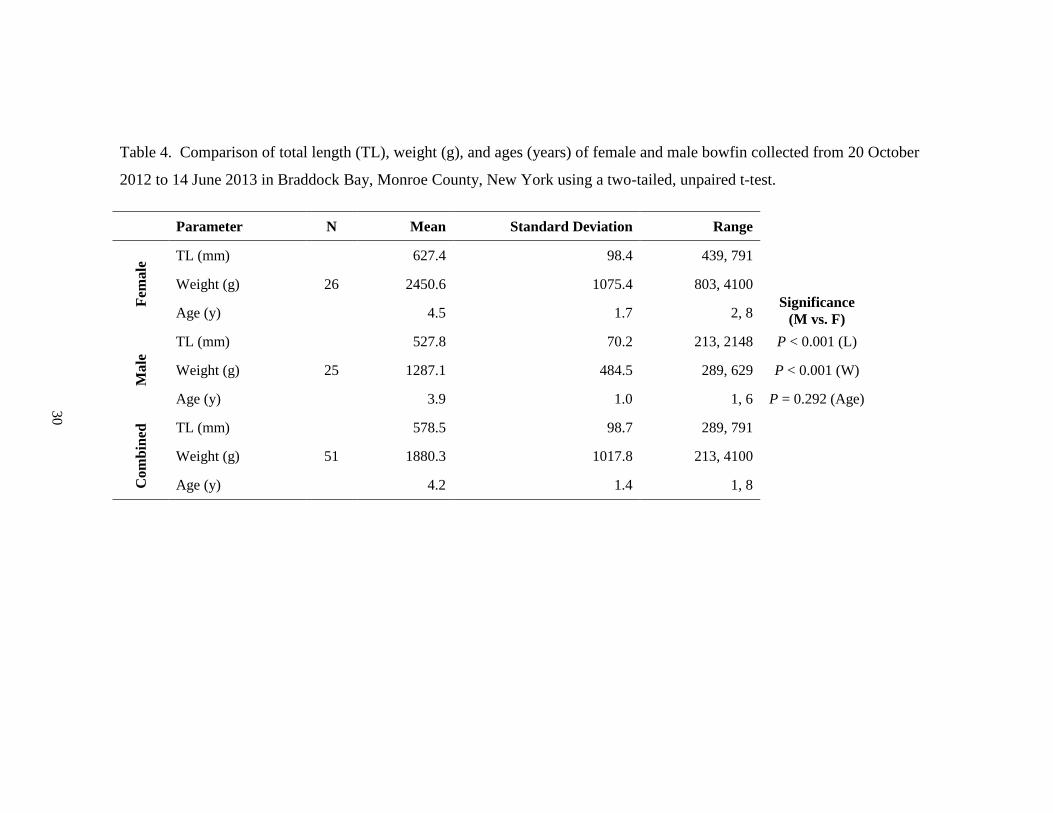
Table 4. Comparison of total length (TL), weight (g), and ages (years) of female and male bowfin collected from 20 October
2012 to 14 June 2013 in Braddock Bay, Monroe County, New York using a two-tailed, unpaired t-test.
Parameter N Mean Standard Deviation Range
Significance
(M vs. F)
Fem
ale
TL (mm)
26
627.4 98.4 439, 791
Weight (g) 2450.6 1075.4 803, 4100
Age (y) 4.5 1.7 2, 8
Male
TL (mm)
25
527.8 70.2 213, 2148 P < 0.001 (L)
Weight (g) 1287.1 484.5 289, 629 P < 0.001 (W)
Age (y) 3.9 1.0 1, 6 P = 0.292 (Age)
Co
mb
ined
TL (mm)
51
578.5 98.7 289, 791
Weight (g) 1880.3 1017.8 213, 4100
Age (y) 4.2 1.4 1, 8
31
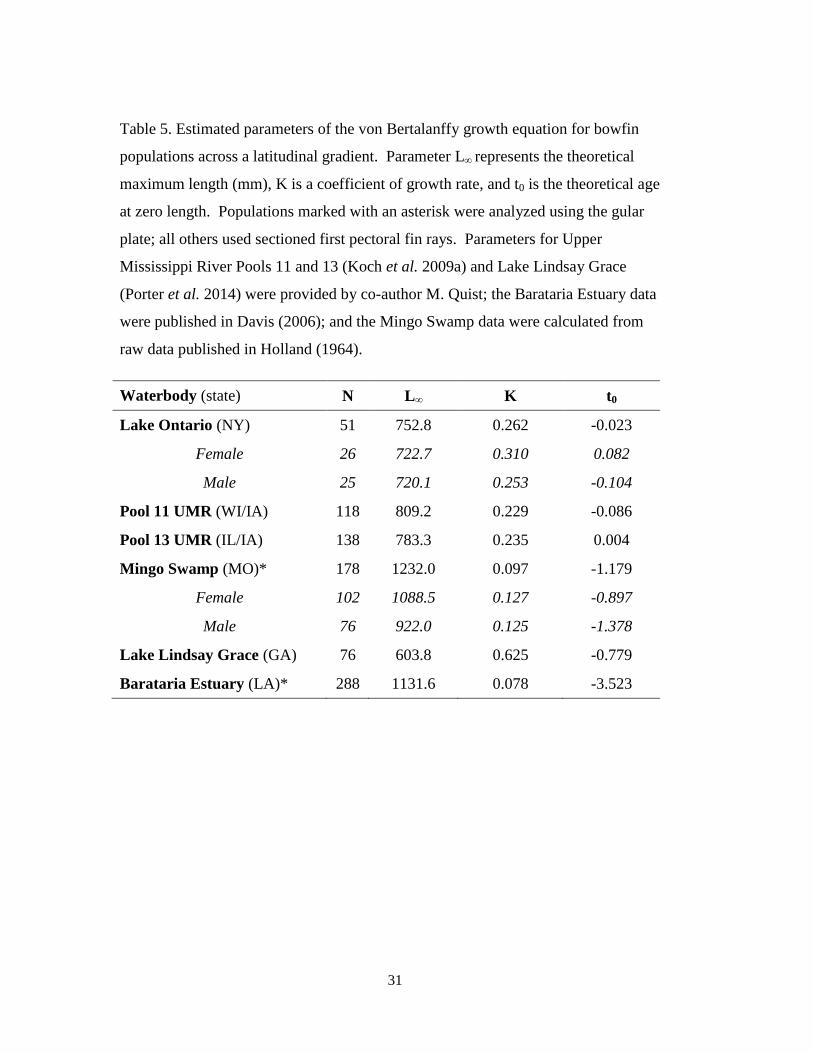
Table 5. Estimated parameters of the von Bertalanffy growth equation for bowfin
populations across a latitudinal gradient. Parameter L∞ represents the theoretical
maximum length (mm), K is a coefficient of growth rate, and t0 is the theoretical age
at zero length. Populations marked with an asterisk were analyzed using the gular
plate; all others used sectioned first pectoral fin rays. Parameters for Upper
Mississippi River Pools 11 and 13 (Koch et al. 2009a) and Lake Lindsay Grace
(Porter et al. 2014) were provided by co-author M. Quist; the Barataria Estuary data
were published in Davis (2006); and the Mingo Swamp data were calculated from
raw data published in Holland (1964).
Waterbody (state) N L∞ K t0
Lake Ontario (NY) 51 752.8 0.262 -0.023
Female 26 722.7 0.310 0.082
Male 25 720.1 0.253 -0.104
Pool 11 UMR (WI/IA) 118 809.2 0.229 -0.086
Pool 13 UMR (IL/IA) 138 783.3 0.235 0.004
Mingo Swamp (MO)*
178 1232.0 0.097 -1.179
Female 102 1088.5 0.127 -0.897
Male 76 922.0 0.125 -1.378
Lake Lindsay Grace (GA) 76 603.8 0.625 -0.779
Barataria Estuary (LA)*
288 1131.6 0.078 -3.523
32
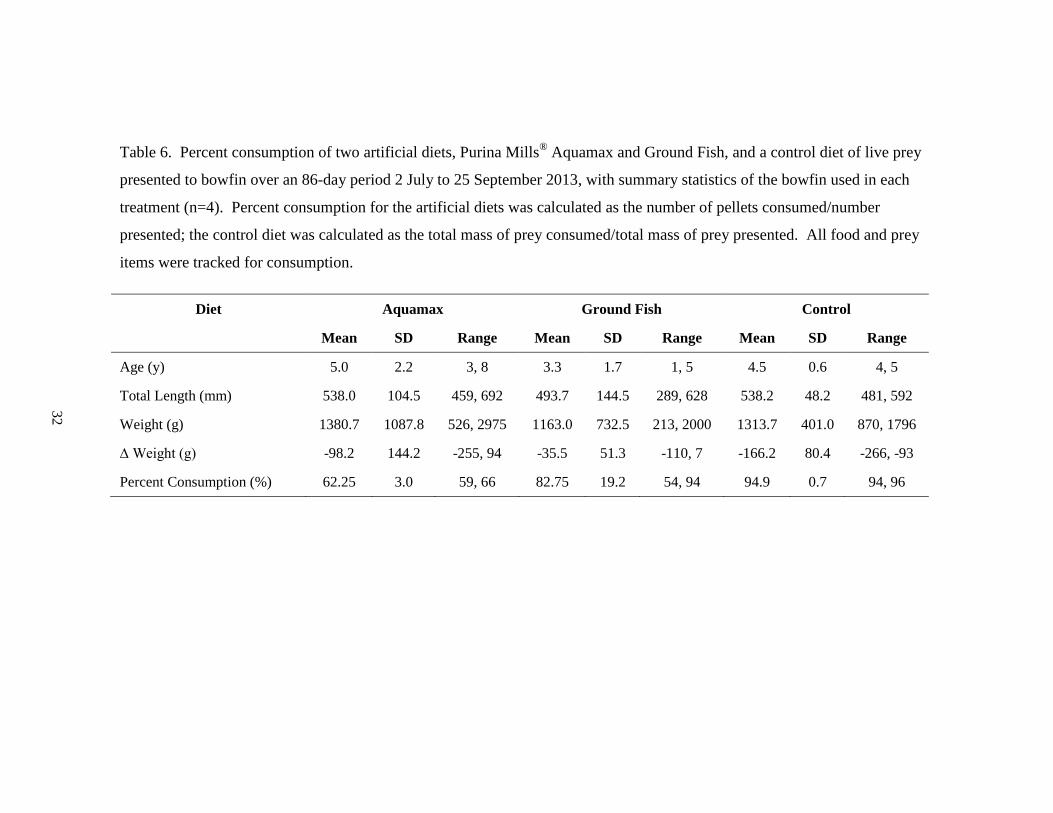
Table 6. Percent consumption of two artificial diets, Purina Mills® Aquamax and Ground Fish, and a control diet of live prey
presented to bowfin over an 86-day period 2 July to 25 September 2013, with summary statistics of the bowfin used in each
treatment (n=4). Percent consumption for the artificial diets was calculated as the number of pellets consumed/number
presented; the control diet was calculated as the total mass of prey consumed/total mass of prey presented. All food and prey
items were tracked for consumption.
Diet Aquamax Ground Fish Control
Mean SD Range Mean SD Range Mean SD Range
Age (y) 5.0 2.2 3, 8 3.3 1.7 1, 5 4.5 0.6 4, 5
Total Length (mm) 538.0 104.5 459, 692 493.7 144.5 289, 628 538.2 48.2 481, 592
Weight (g) 1380.7 1087.8 526, 2975 1163.0 732.5 213, 2000 1313.7 401.0 870, 1796
∆ Weight (g) -98.2 144.2 -255, 94 -35.5 51.3 -110, 7 -166.2 80.4 -266, -93
Percent Consumption (%) 62.25 3.0 59, 66 82.75 19.2 54, 94 94.9 0.7 94, 96
33
Figures
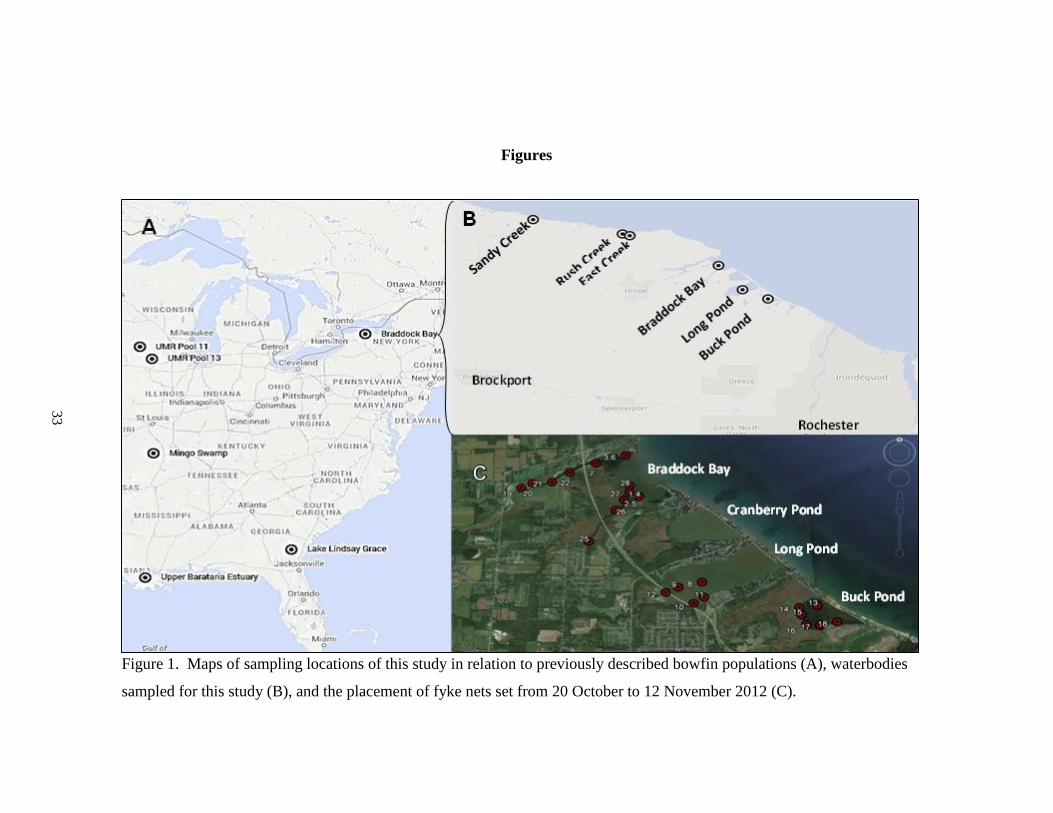
Figure 1. Maps of sampling locations of this study in relation to previously described bowfin populations (A), waterbodies
sampled for this study (B), and the placement of fyke nets set from 20 October to 12 November 2012 (C).
34
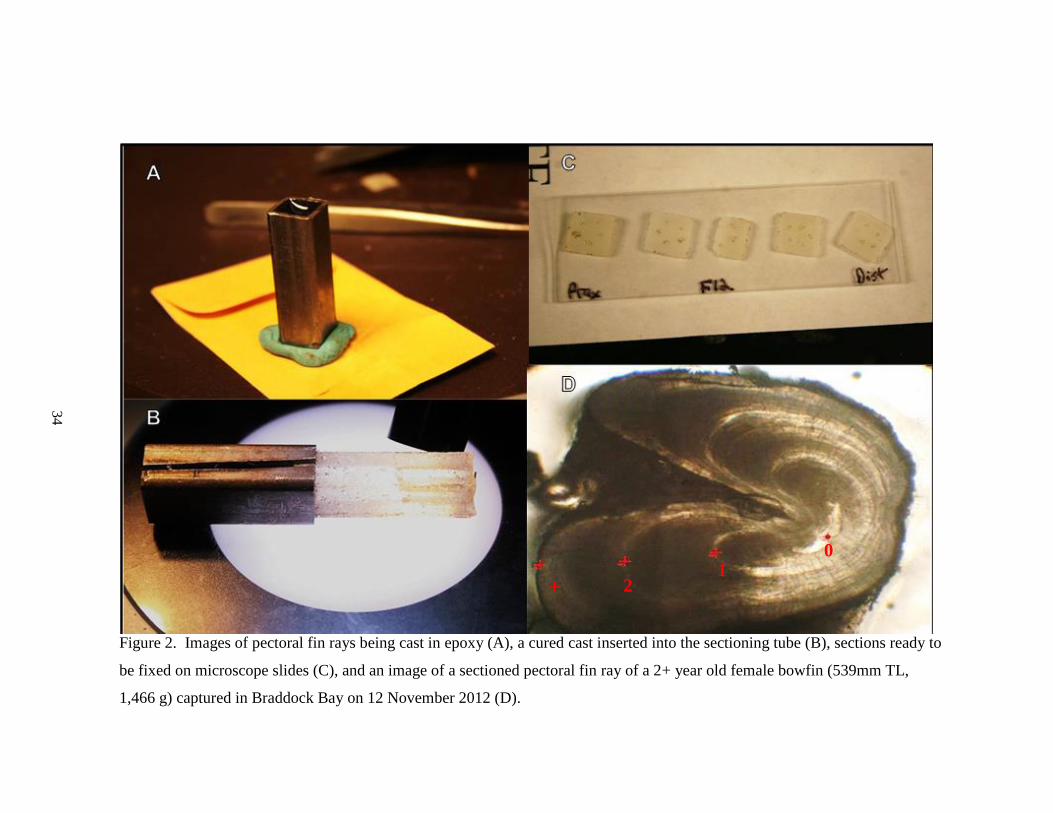
Figure 2. Images of pectoral fin rays being cast in epoxy (A), a cured cast inserted into the sectioning tube (B), sections ready to
be fixed on microscope slides (C), and an image of a sectioned pectoral fin ray of a 2+ year old female bowfin (539mm TL,
1,466 g) captured in Braddock Bay on 12 November 2012 (D).
0
1 2 +
35
Figure 3. Layout of the Recirculating Aquaculture System (RAS) used from 20 October 2012 to 11 May 2013.
36
Figure 4. Layout of the partial flow-through Recirculating Aquaculture System used
from 11 May to 24 June 2013.
37
Figure 5. Layout of the fully flow-through tank system from 24 June to 27
September 2013.
38
50
0
10
20
30
4
2.5 4 6 1
0
10
20
30
40
Figure 6. Water quality of the indoor system 24 October 2012 to 1 April 2013. Temperature was measured with a digital portable pH
probe in Systems 1 and 2 and averaged. Gray marks on the x-axes indicate a measurement of zero.
7
7.8
8.6
pH
A
mm
on
ia
(pp
m)
Nit
rite
(pp
m)
Nit
rate
(pp
m)
Tem
per
atu
re
(C)
0.5
1
0.5
1
39
0
10
20
30
1.25
0
10
20
30
40
Pond 1 Indoor
Figure 7. Temperature of Pond 1 and water quality of the indoor system from 2 April to 25 September. Temperature was measured
with digital data loggers. The system was converted from fully recirculating to partial flow-through on 11 May, and to fully flow-
through on 24 June 2013. Gray marks on the x-axes indicate a measurement of zero.
7
7.8
8.6
pH
A
mm
on
ia
(pp
m)
Nit
rite
(pp
m)
Nit
rate
(pp
m)
Tem
per
atu
re
(C)
0.5
1
0.5
1
40
Figure 8. Photographs taken on 24 October 2012 of Pond 1 (top) and Pond 2
(bottom).
41
0
100
200
300
400
500
600
700
1 2 3 4 5 6 7 8
To
tal
Len
gth
(m
m)
Age (yrs)
Females
Males
Figure 9. Mean back-calculated length-at-age of female (n=26) and male (n=25)
bowfin collected 20 October 2012 to 14 June 2013 from Braddock Bay, Monroe
County, New York. Annular radii were measured digitally from micrographs of
sectioned pectoral fin rays, for which raw data is included in Appendix D.
42
0
100
200
300
400
500
600
700
800
900
1 2 3 4 5 6 7 8 9 10 11 12 13
Len
gth
(m
m)
Age (yrs)
Lake Ontario
UMR Pool 11
UMR Pool 13
Mingo Swamp*
Lake Lindsay Grace
Barataria Estuary*
Figure 10. Mean back-calculated length-at-age of bowfin populations along a latitudinal gradient. Populations marked with an
asterisk were analyzed using the gular plate; all others used sectioned first pectoral fin rays. Data for Upper Mississippi River
(UMR) Pools 11 and 13 (Koch et al. 2009a) and Lake Lindsay Grace (Porter et al. 2014) were provided by co-author M. Quist;
the Barataria Estuary data were published in Davis (2006); and the Mingo Swamp data were calculated from raw data
published in Holland (1964).
43
0
20
40
60
80
100
120
140
160
1 2 3 4 5 6 7 8 9 10 11 12
% A
nn
ua
l G
row
th
Age
Lake Ontario
UMR Pool 11
UMR Pool 13
Mingo Swamp*
Lake Lindsay Grace
Barataria Estuary*
Figure 11. Percent annual growth of bowfin populations along a latitudinal gradient. Populations marked with an asterisk
were analyzed using the gular plate; all others used sectioned first pectoral fin rays. Data for Upper Mississippi River
(UMR) Pools 11 and 13 (Koch et al. 2009a), the Barataria Estuary (Davis 2006), and Lake Lindsay Grace (Porter et al.
2014) were provided by Dr. M. Quist (U. of Idaho); and the Mingo Swamp data were calculated from raw data published in
Holland (1964).
44
0
10
20
30
40
50
60
70
80
90
100
X3 Y4 Y6 Y9 X1 Y11 Y3 Y5 X2 Y1 Y10 Y7
Per
cen
t C
on
sum
pti
on
Figure 12. Percent consumption of two artificial diets and a control diet of live prey
presented to adult bowfin in captivity over 86 days from 2 July to 25 September
2013. Percent consumption for the artificial diets was calculated as the number of
pellets consumed/number presented; the control diet was calculated as the total
mass of prey consumed/total mass of prey presented. All food and prey items were
tracked for consumption. Fish ID codes correspond to Appendix A. Codes
beginning with “X” were females and “Y” were males.
Aquamax Ground Fish Control
45
-1000
-750
-500
-250
0
250
500
750
1000
-20%
-15%
-10%
-5%
0%
5%
10%
15%
20%
X3 Y4 Y6 Y9 X1 Y11 Y3 Y5 X2 Y1 Y10 Y7
Die
t C
on
sum
ed
(g
)
Per
cen
t C
ha
ng
e in
In
itia
l W
eig
ht
Aquamax Ground Fish Control
Figure 13. Percent change in initial weight of bowfin after an 86-day feeding
experiment (bars) and total diet consumed (♦). Two artificial diets, Purina Mills®
Aquamax and Ground Fish, and a control diet of live prey were presented to bowfin.
Diet consumed was dry-weight corrected for the artificial diets (7% for Aquamax and
49.5% for Ground Fish, Table 2) but not for the control diet. Fish ID codes
correspond to Appendix A. Codes beginning with “X” were females and “Y” were
males.
46
Appendices
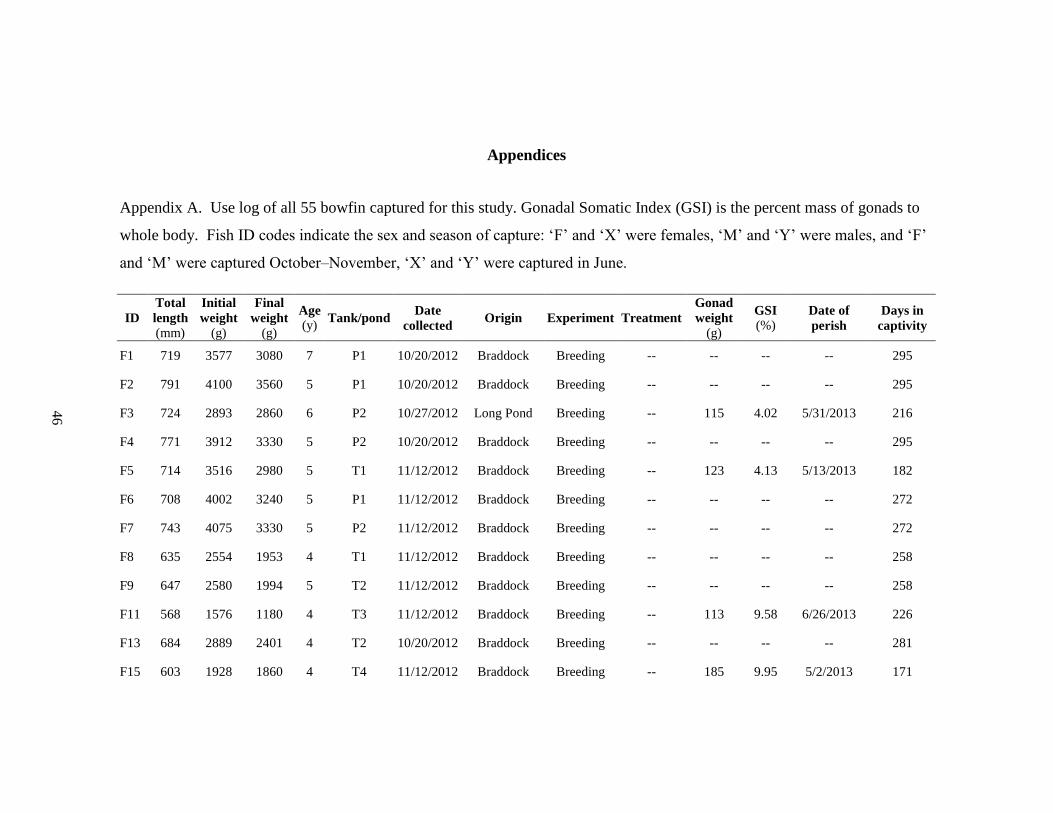
Appendix A. Use log of all 55 bowfin captured for this study. Gonadal Somatic Index (GSI) is the percent mass of gonads to
whole body. Fish ID codes indicate the sex and season of capture: ‘F’ and ‘X’ were females, ‘M’ and ‘Y’ were males, and ‘F’
and ‘M’ were captured October–November, ‘X’ and ‘Y’ were captured in June.
ID
Total
length
(mm)
Initial
weight
(g)
Final
weight
(g)
Age
(y) Tank/pond
Date
collected Origin Experiment Treatment
Gonad
weight
(g)
GSI
(%) Date of
perish
Days in
captivity
F1 719 3577 3080 7 P1 10/20/2012 Braddock Breeding -- -- -- -- 295
F2 791 4100 3560 5 P1 10/20/2012 Braddock Breeding -- -- -- -- 295
F3 724 2893 2860 6 P2 10/27/2012 Long Pond Breeding -- 115 4.02 5/31/2013 216
F4 771 3912 3330 5 P2 10/20/2012 Braddock Breeding -- -- -- -- 295
F5 714 3516 2980 5 T1 11/12/2012 Braddock Breeding -- 123 4.13 5/13/2013 182
F6 708 4002 3240 5 P1 11/12/2012 Braddock Breeding -- -- -- -- 272
F7 743 4075 3330 5 P2 11/12/2012 Braddock Breeding -- -- -- -- 272
F8 635 2554 1953 4 T1 11/12/2012 Braddock Breeding -- -- -- -- 258
F9 647 2580 1994 5 T2 11/12/2012 Braddock Breeding -- -- -- -- 258
F11 568 1576 1180 4 T3 11/12/2012 Braddock Breeding -- 113 9.58 6/26/2013 226
F13 684 2889 2401 4 T2 10/20/2012 Braddock Breeding -- -- -- -- 281
F15 603 1928 1860 4 T4 11/12/2012 Braddock Breeding -- 185 9.95 5/2/2013 171
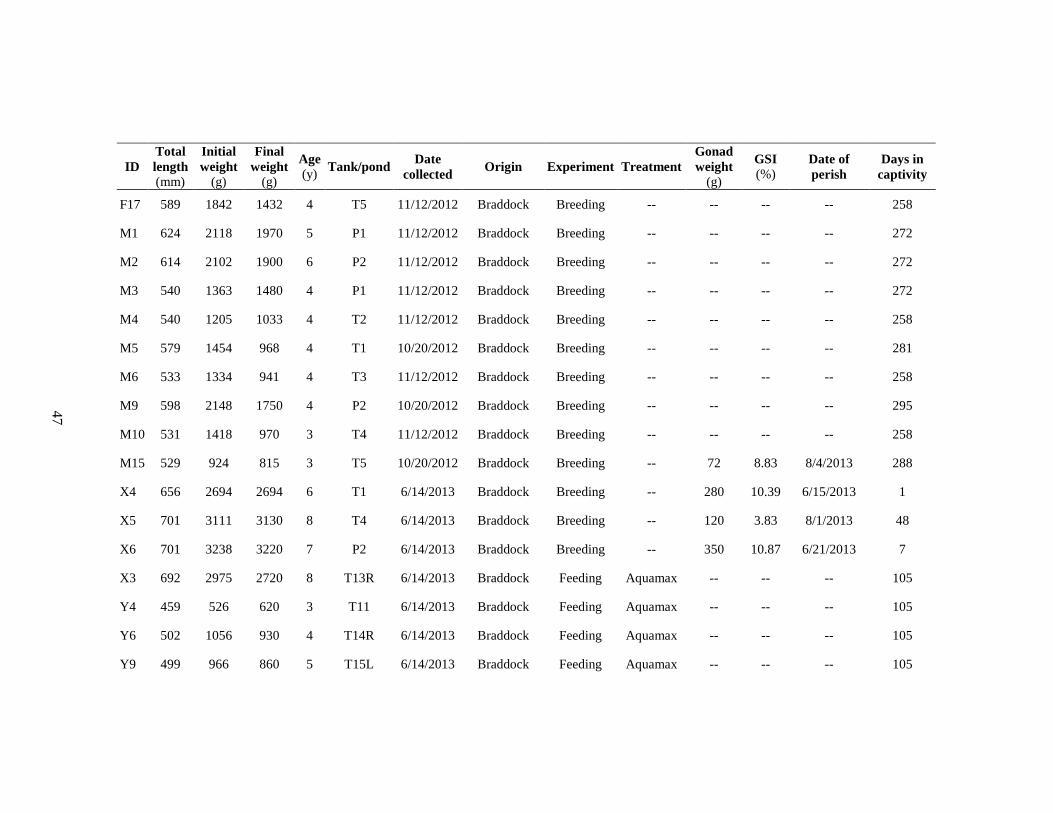
47
ID
Total
length
(mm)
Initial
weight
(g)
Final
weight
(g)
Age
(y) Tank/pond
Date
collected Origin Experiment Treatment
Gonad
weight
(g)
GSI
(%) Date of
perish
Days in
captivity
F17 589 1842 1432 4 T5 11/12/2012 Braddock Breeding -- -- -- -- 258
M1 624 2118 1970 5 P1 11/12/2012 Braddock Breeding -- -- -- -- 272
M2 614 2102 1900 6 P2 11/12/2012 Braddock Breeding -- -- -- -- 272
M3 540 1363 1480 4 P1 11/12/2012 Braddock Breeding -- -- -- -- 272
M4 540 1205 1033 4 T2 11/12/2012 Braddock Breeding -- -- -- -- 258
M5 579 1454 968 4 T1 10/20/2012 Braddock Breeding -- -- -- -- 281
M6 533 1334 941 4 T3 11/12/2012 Braddock Breeding -- -- -- -- 258
M9 598 2148 1750 4 P2 10/20/2012 Braddock Breeding -- -- -- -- 295
M10 531 1418 970 3 T4 11/12/2012 Braddock Breeding -- -- -- -- 258
M15 529 924 815 3 T5 10/20/2012 Braddock Breeding -- 72 8.83 8/4/2013 288
X4 656 2694 2694 6 T1 6/14/2013 Braddock Breeding -- 280 10.39 6/15/2013 1
X5 701 3111 3130 8 T4 6/14/2013 Braddock Breeding -- 120 3.83 8/1/2013 48
X6 701 3238 3220 7 P2 6/14/2013 Braddock Breeding -- 350 10.87 6/21/2013 7
X3 692 2975 2720 8 T13R 6/14/2013 Braddock Feeding Aquamax -- -- -- 105
Y4 459 526 620 3 T11 6/14/2013 Braddock Feeding Aquamax -- -- -- 105
Y6 502 1056 930 4 T14R 6/14/2013 Braddock Feeding Aquamax -- -- -- 105
Y9 499 966 860 5 T15L 6/14/2013 Braddock Feeding Aquamax -- -- -- 105
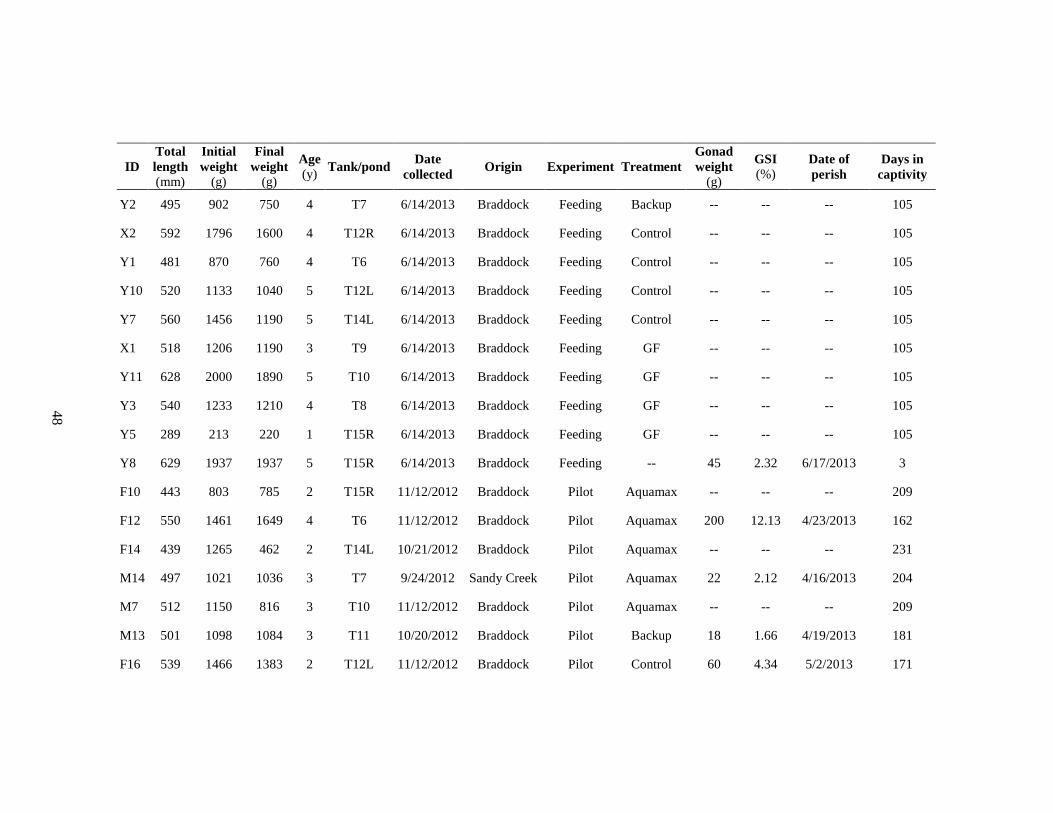
48
ID
Total
length
(mm)
Initial
weight
(g)
Final
weight
(g)
Age
(y) Tank/pond
Date
collected Origin Experiment Treatment
Gonad
weight
(g)
GSI
(%) Date of
perish
Days in
captivity
Y2 495 902 750 4 T7 6/14/2013 Braddock Feeding Backup -- -- -- 105
X2 592 1796 1600 4 T12R 6/14/2013 Braddock Feeding Control -- -- -- 105
Y1 481 870 760 4 T6 6/14/2013 Braddock Feeding Control -- -- -- 105
Y10 520 1133 1040 5 T12L 6/14/2013 Braddock Feeding Control -- -- -- 105
Y7 560 1456 1190 5 T14L 6/14/2013 Braddock Feeding Control -- -- -- 105
X1 518 1206 1190 3 T9 6/14/2013 Braddock Feeding GF -- -- -- 105
Y11 628 2000 1890 5 T10 6/14/2013 Braddock Feeding GF -- -- -- 105
Y3 540 1233 1210 4 T8 6/14/2013 Braddock Feeding GF -- -- -- 105
Y5 289 213 220 1 T15R 6/14/2013 Braddock Feeding GF -- -- -- 105
Y8 629 1937 1937 5 T15R 6/14/2013 Braddock Feeding -- 45 2.32 6/17/2013 3
F10 443 803 785 2 T15R 11/12/2012 Braddock Pilot Aquamax -- -- -- 209
F12 550 1461 1649 4 T6 11/12/2012 Braddock Pilot Aquamax 200 12.13 4/23/2013 162
F14 439 1265 462 2 T14L 10/21/2012 Braddock Pilot Aquamax -- -- -- 231
M14 497 1021 1036 3 T7 9/24/2012 Sandy Creek Pilot Aquamax 22 2.12 4/16/2013 204
M7 512 1150 816 3 T10 11/12/2012 Braddock Pilot Aquamax -- -- -- 209
M13 501 1098 1084 3 T11 10/20/2012 Braddock Pilot Backup 18 1.66 4/19/2013 181
F16 539 1466 1383 2 T12L 11/12/2012 Braddock Pilot Control 60 4.34 5/2/2013 171
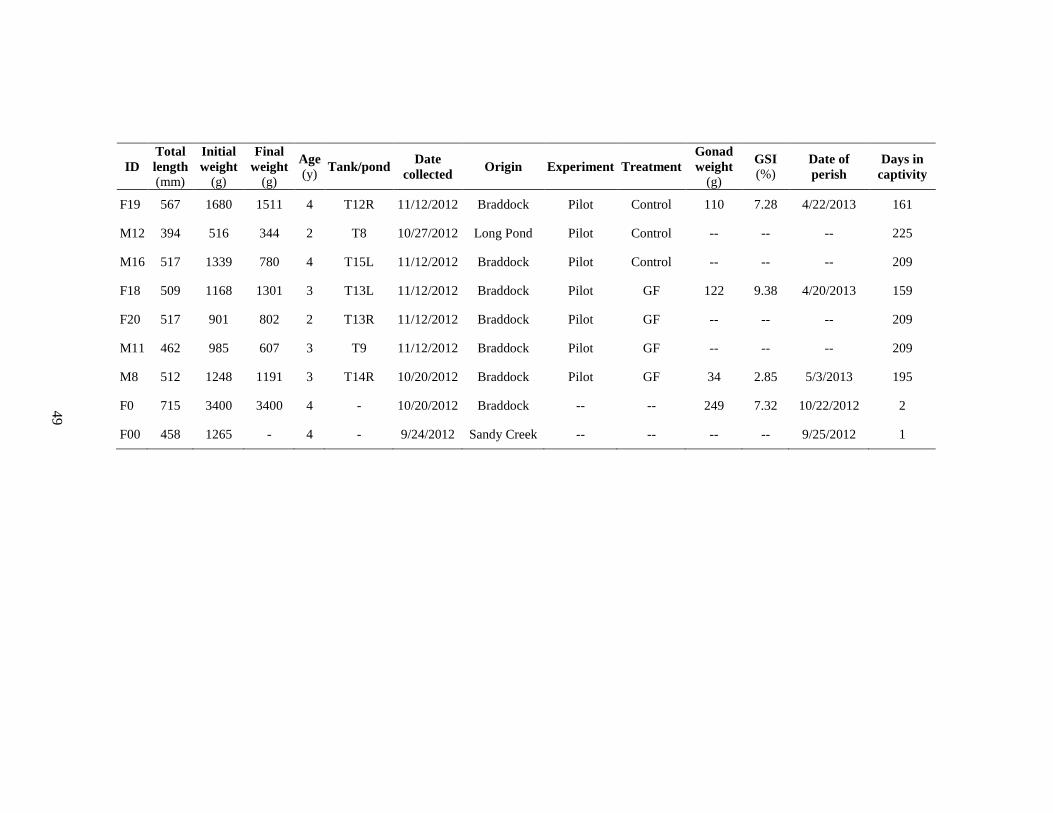
49
ID
Total
length
(mm)
Initial
weight
(g)
Final
weight
(g)
Age
(y) Tank/pond
Date
collected Origin Experiment Treatment
Gonad
weight
(g)
GSI
(%) Date of
perish
Days in
captivity
F19 567 1680 1511 4 T12R 11/12/2012 Braddock Pilot Control 110 7.28 4/22/2013 161
M12 394 516 344 2 T8 10/27/2012 Long Pond Pilot Control -- -- -- 225
M16 517 1339 780 4 T15L 11/12/2012 Braddock Pilot Control -- -- -- 209
F18 509 1168 1301 3 T13L 11/12/2012 Braddock Pilot GF 122 9.38 4/20/2013 159
F20 517 901 802 2 T13R 11/12/2012 Braddock Pilot GF -- -- -- 209
M11 462 985 607 3 T9 11/12/2012 Braddock Pilot GF -- -- -- 209
M8 512 1248 1191 3 T14R 10/20/2012 Braddock Pilot GF 34 2.85 5/3/2013 195
F0 715 3400 3400 4 - 10/20/2012 Braddock -- -- 249 7.32 10/22/2012 2
F00 458 1265 - 4 - 9/24/2012 Sandy Creek -- -- -- -- 9/25/2012 1
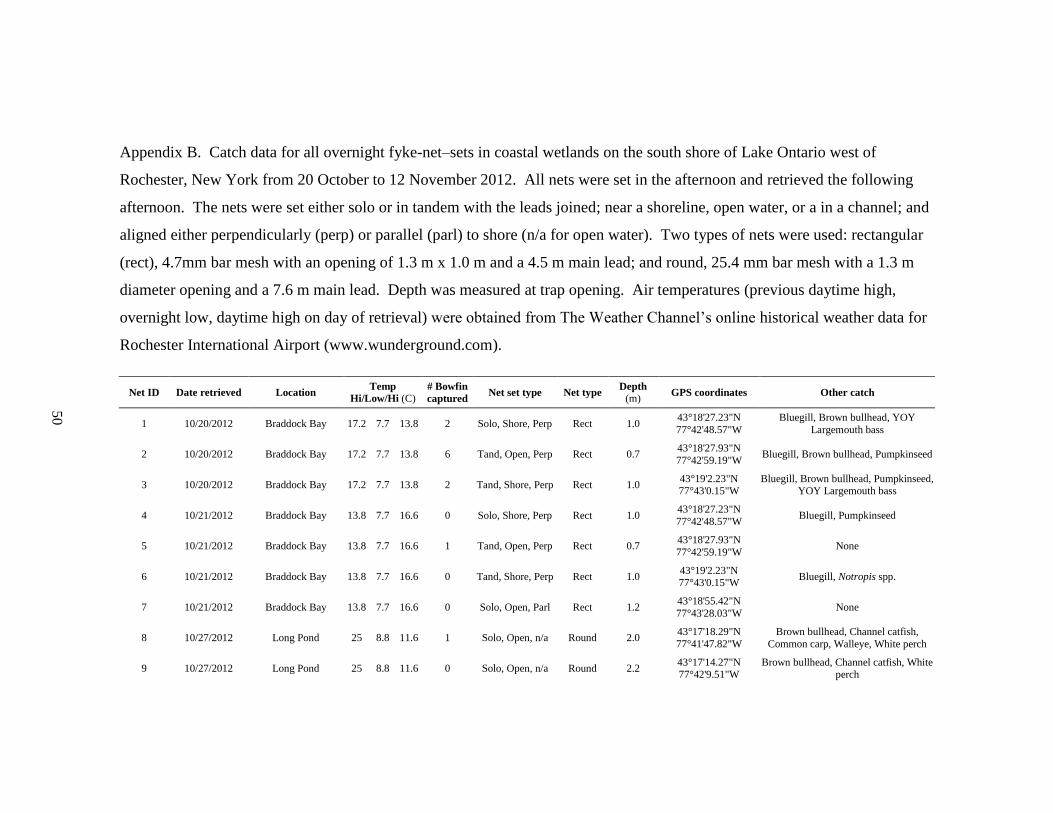
50
Appendix B. Catch data for all overnight fyke-net–sets in coastal wetlands on the south shore of Lake Ontario west of
Rochester, New York from 20 October to 12 November 2012. All nets were set in the afternoon and retrieved the following
afternoon. The nets were set either solo or in tandem with the leads joined; near a shoreline, open water, or a in a channel; and
aligned either perpendicularly (perp) or parallel (parl) to shore (n/a for open water). Two types of nets were used: rectangular
(rect), 4.7mm bar mesh with an opening of 1.3 m x 1.0 m and a 4.5 m main lead; and round, 25.4 mm bar mesh with a 1.3 m
diameter opening and a 7.6 m main lead. Depth was measured at trap opening. Air temperatures (previous daytime high,
overnight low, daytime high on day of retrieval) were obtained from The Weather Channel’s online historical weather data for
Rochester International Airport (www.wunderground.com).
Net ID Date retrieved Location Temp
Hi/Low/Hi (C) # Bowfin
captured Net set type Net type
Depth (m)
GPS coordinates Other catch
1 10/20/2012 Braddock Bay 17.2 7.7 13.8 2 Solo, Shore, Perp Rect 1.0 43°18'27.23"N
77°42'48.57"W
Bluegill, Brown bullhead, YOY
Largemouth bass
2 10/20/2012 Braddock Bay 17.2 7.7 13.8 6 Tand, Open, Perp Rect 0.7 43°18'27.93"N
77°42'59.19"W Bluegill, Brown bullhead, Pumpkinseed
3 10/20/2012 Braddock Bay 17.2 7.7 13.8 2 Tand, Shore, Perp Rect 1.0 43°19'2.23"N 77°43'0.15"W
Bluegill, Brown bullhead, Pumpkinseed, YOY Largemouth bass
4 10/21/2012 Braddock Bay 13.8 7.7 16.6 0 Solo, Shore, Perp Rect 1.0 43°18'27.23"N
77°42'48.57"W Bluegill, Pumpkinseed
5 10/21/2012 Braddock Bay 13.8 7.7 16.6 1 Tand, Open, Perp Rect 0.7 43°18'27.93"N
77°42'59.19"W None
6 10/21/2012 Braddock Bay 13.8 7.7 16.6 0 Tand, Shore, Perp Rect 1.0 43°19'2.23"N 77°43'0.15"W
Bluegill, Notropis spp.
7 10/21/2012 Braddock Bay 13.8 7.7 16.6 0 Solo, Open, Parl Rect 1.2 43°18'55.42"N
77°43'28.03"W None
8 10/27/2012 Long Pond 25 8.8 11.6 1 Solo, Open, n/a Round 2.0 43°17'18.29"N
77°41'47.82"W
Brown bullhead, Channel catfish,
Common carp, Walleye, White perch
9 10/27/2012 Long Pond 25 8.8 11.6 0 Solo, Open, n/a Round 2.2 43°17'14.27"N 77°42'9.51"W
Brown bullhead, Channel catfish, White perch
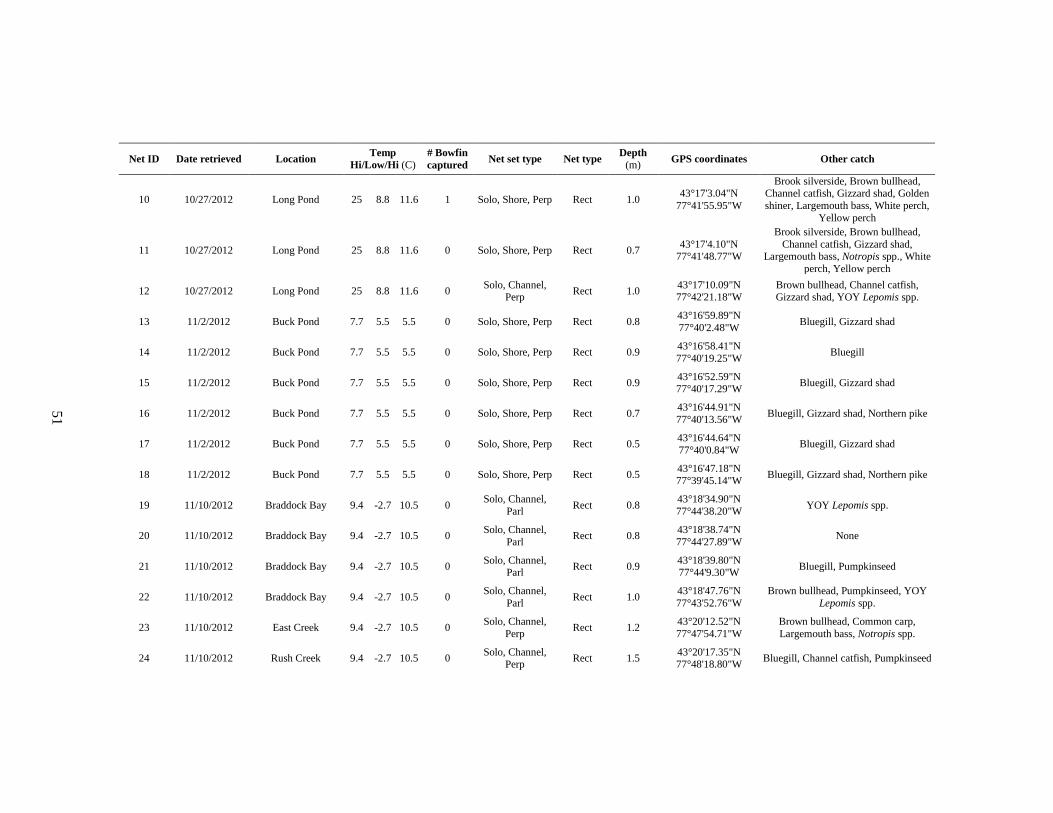
51
Net ID Date retrieved Location Temp
Hi/Low/Hi (C) # Bowfin
captured Net set type Net type
Depth (m)
GPS coordinates Other catch
10 10/27/2012 Long Pond 25 8.8 11.6 1 Solo, Shore, Perp Rect 1.0 43°17'3.04"N
77°41'55.95"W
Brook silverside, Brown bullhead, Channel catfish, Gizzard shad, Golden
shiner, Largemouth bass, White perch,
Yellow perch
11 10/27/2012 Long Pond 25 8.8 11.6 0 Solo, Shore, Perp Rect 0.7 43°17'4.10"N
77°41'48.77"W
Brook silverside, Brown bullhead,
Channel catfish, Gizzard shad, Largemouth bass, Notropis spp., White
perch, Yellow perch
12 10/27/2012 Long Pond 25 8.8 11.6 0 Solo, Channel,
Perp Rect 1.0
43°17'10.09"N 77°42'21.18"W
Brown bullhead, Channel catfish, Gizzard shad, YOY Lepomis spp.
13 11/2/2012 Buck Pond 7.7 5.5 5.5 0 Solo, Shore, Perp Rect 0.8 43°16'59.89"N
77°40'2.48"W Bluegill, Gizzard shad
14 11/2/2012 Buck Pond 7.7 5.5 5.5 0 Solo, Shore, Perp Rect 0.9 43°16'58.41"N
77°40'19.25"W Bluegill
15 11/2/2012 Buck Pond 7.7 5.5 5.5 0 Solo, Shore, Perp Rect 0.9 43°16'52.59"N 77°40'17.29"W
Bluegill, Gizzard shad
16 11/2/2012 Buck Pond 7.7 5.5 5.5 0 Solo, Shore, Perp Rect 0.7 43°16'44.91"N
77°40'13.56"W Bluegill, Gizzard shad, Northern pike
17 11/2/2012 Buck Pond 7.7 5.5 5.5 0 Solo, Shore, Perp Rect 0.5 43°16'44.64"N
77°40'0.84"W Bluegill, Gizzard shad
18 11/2/2012 Buck Pond 7.7 5.5 5.5 0 Solo, Shore, Perp Rect 0.5 43°16'47.18"N 77°39'45.14"W
Bluegill, Gizzard shad, Northern pike
19 11/10/2012 Braddock Bay 9.4 -2.7 10.5 0 Solo, Channel,
Parl Rect 0.8
43°18'34.90"N
77°44'38.20"W YOY Lepomis spp.
20 11/10/2012 Braddock Bay 9.4 -2.7 10.5 0 Solo, Channel,
Parl Rect 0.8
43°18'38.74"N
77°44'27.89"W None
21 11/10/2012 Braddock Bay 9.4 -2.7 10.5 0 Solo, Channel,
Parl Rect 0.9
43°18'39.80"N 77°44'9.30"W
Bluegill, Pumpkinseed
22 11/10/2012 Braddock Bay 9.4 -2.7 10.5 0 Solo, Channel,
Parl Rect 1.0
43°18'47.76"N
77°43'52.76"W
Brown bullhead, Pumpkinseed, YOY
Lepomis spp.
23 11/10/2012 East Creek 9.4 -2.7 10.5 0 Solo, Channel,
Perp Rect 1.2
43°20'12.52"N
77°47'54.71"W
Brown bullhead, Common carp,
Largemouth bass, Notropis spp.
24 11/10/2012 Rush Creek 9.4 -2.7 10.5 0 Solo, Channel,
Perp Rect 1.5
43°20'17.35"N 77°48'18.80"W
Bluegill, Channel catfish, Pumpkinseed
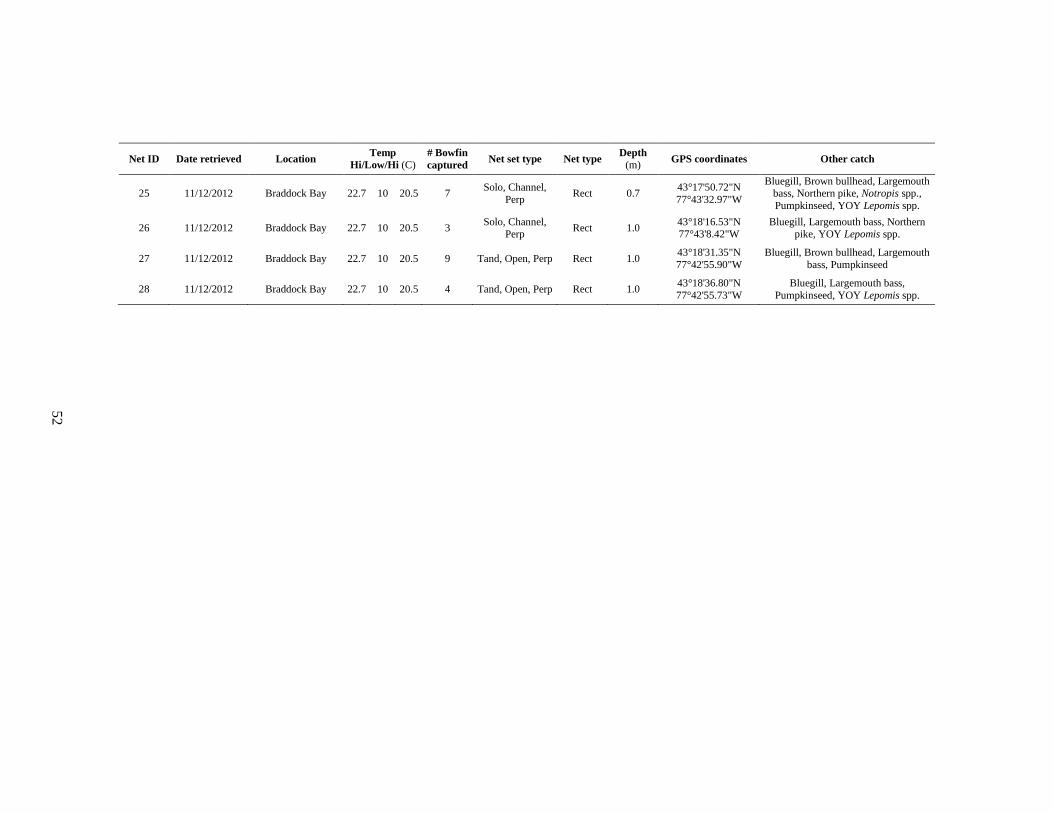
52
Net ID Date retrieved Location Temp
Hi/Low/Hi (C) # Bowfin
captured Net set type Net type
Depth (m)
GPS coordinates Other catch
25 11/12/2012 Braddock Bay 22.7 10 20.5 7 Solo, Channel,
Perp Rect 0.7
43°17'50.72"N
77°43'32.97"W
Bluegill, Brown bullhead, Largemouth bass, Northern pike, Notropis spp.,
Pumpkinseed, YOY Lepomis spp.
26 11/12/2012 Braddock Bay 22.7 10 20.5 3 Solo, Channel,
Perp Rect 1.0
43°18'16.53"N
77°43'8.42"W
Bluegill, Largemouth bass, Northern
pike, YOY Lepomis spp.
27 11/12/2012 Braddock Bay 22.7 10 20.5 9 Tand, Open, Perp Rect 1.0 43°18'31.35"N
77°42'55.90"W
Bluegill, Brown bullhead, Largemouth
bass, Pumpkinseed
28 11/12/2012 Braddock Bay 22.7 10 20.5 4 Tand, Open, Perp Rect 1.0 43°18'36.80"N
77°42'55.73"W
Bluegill, Largemouth bass,
Pumpkinseed, YOY Lepomis spp.
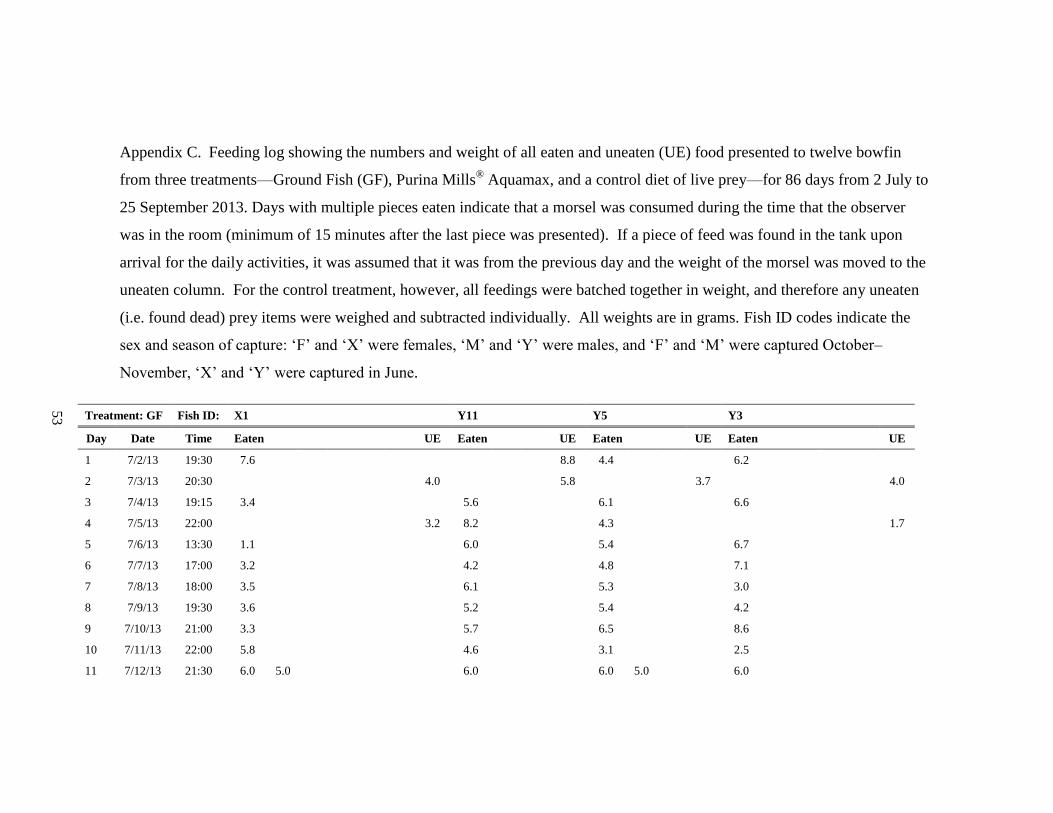
53
Appendix C. Feeding log showing the numbers and weight of all eaten and uneaten (UE) food presented to twelve bowfin
from three treatments—Ground Fish (GF), Purina Mills® Aquamax, and a control diet of live prey—for 86 days from 2 July to
25 September 2013. Days with multiple pieces eaten indicate that a morsel was consumed during the time that the observer
was in the room (minimum of 15 minutes after the last piece was presented). If a piece of feed was found in the tank upon
arrival for the daily activities, it was assumed that it was from the previous day and the weight of the morsel was moved to the
uneaten column. For the control treatment, however, all feedings were batched together in weight, and therefore any uneaten
(i.e. found dead) prey items were weighed and subtracted individually. All weights are in grams. Fish ID codes indicate the
sex and season of capture: ‘F’ and ‘X’ were females, ‘M’ and ‘Y’ were males, and ‘F’ and ‘M’ were captured October–
November, ‘X’ and ‘Y’ were captured in June.
Treatment: GF Fish ID: X1 Y11 Y5 Y3
Day Date Time Eaten UE Eaten UE Eaten UE Eaten UE
1 7/2/13 19:30 7.6
8.8 4.4
6.2
2 7/3/13 20:30
4.0
5.8
3.7
4.0
3 7/4/13 19:15 3.4
5.6
6.1
6.6
4 7/5/13 22:00
3.2 8.2
4.3
1.7
5 7/6/13 13:30 1.1
6.0
5.4
6.7
6 7/7/13 17:00 3.2
4.2
4.8
7.1
7 7/8/13 18:00 3.5
6.1
5.3
3.0
8 7/9/13 19:30 3.6
5.2
5.4
4.2
9 7/10/13 21:00 3.3
5.7
6.5
8.6
10 7/11/13 22:00 5.8
4.6
3.1
2.5
11 7/12/13 21:30 6.0 5.0
6.0
6.0 5.0
6.0
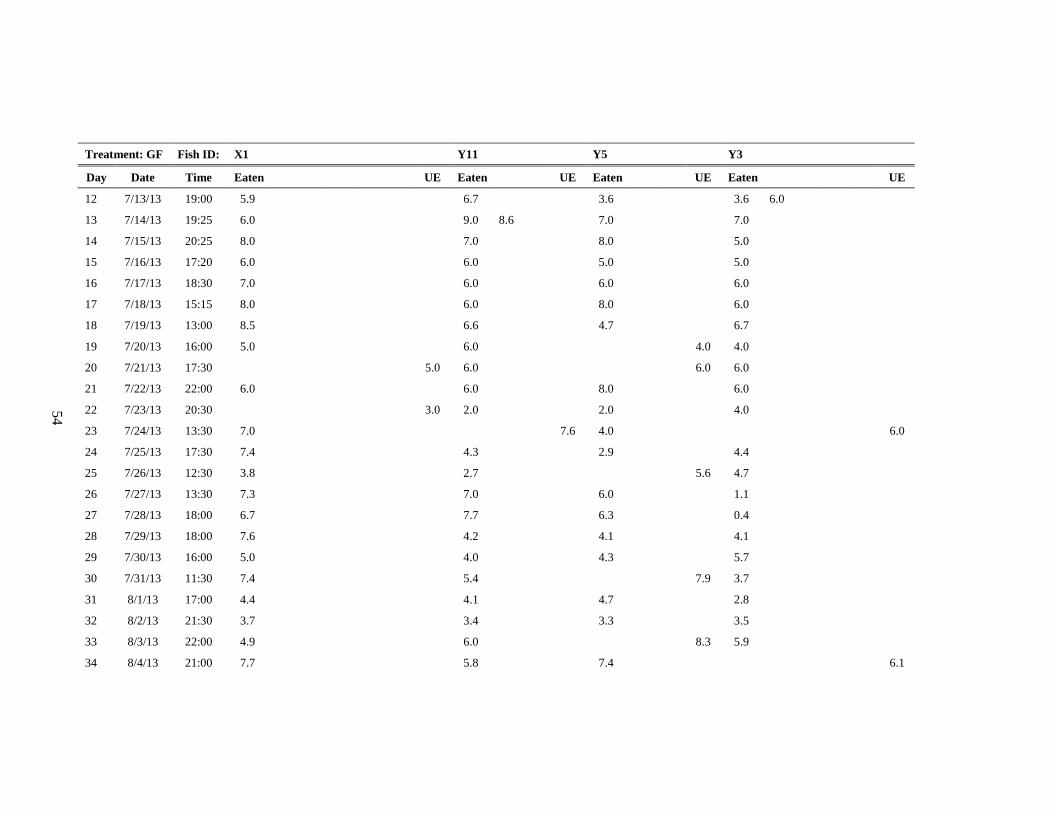
54
Treatment: GF Fish ID: X1 Y11 Y5 Y3
Day Date Time Eaten UE Eaten UE Eaten UE Eaten UE
12 7/13/13 19:00 5.9
6.7
3.6
3.6 6.0
13 7/14/13 19:25 6.0
9.0 8.6
7.0
7.0
14 7/15/13 20:25 8.0
7.0
8.0
5.0
15 7/16/13 17:20 6.0
6.0
5.0
5.0
16 7/17/13 18:30 7.0
6.0
6.0
6.0
17 7/18/13 15:15 8.0
6.0
8.0
6.0
18 7/19/13 13:00 8.5
6.6
4.7
6.7
19 7/20/13 16:00 5.0
6.0
4.0 4.0
20 7/21/13 17:30
5.0 6.0
6.0 6.0
21 7/22/13 22:00 6.0
6.0
8.0
6.0
22 7/23/13 20:30
3.0 2.0
2.0
4.0
23 7/24/13 13:30 7.0
7.6 4.0
6.0
24 7/25/13 17:30 7.4
4.3
2.9
4.4
25 7/26/13 12:30 3.8
2.7
5.6 4.7
26 7/27/13 13:30 7.3
7.0
6.0
1.1
27 7/28/13 18:00 6.7
7.7
6.3
0.4
28 7/29/13 18:00 7.6
4.2
4.1
4.1
29 7/30/13 16:00 5.0
4.0
4.3
5.7
30 7/31/13 11:30 7.4
5.4
7.9 3.7
31 8/1/13 17:00 4.4
4.1
4.7
2.8
32 8/2/13 21:30 3.7
3.4
3.3
3.5
33 8/3/13 22:00 4.9
6.0
8.3 5.9
34 8/4/13 21:00 7.7
5.8
7.4
6.1
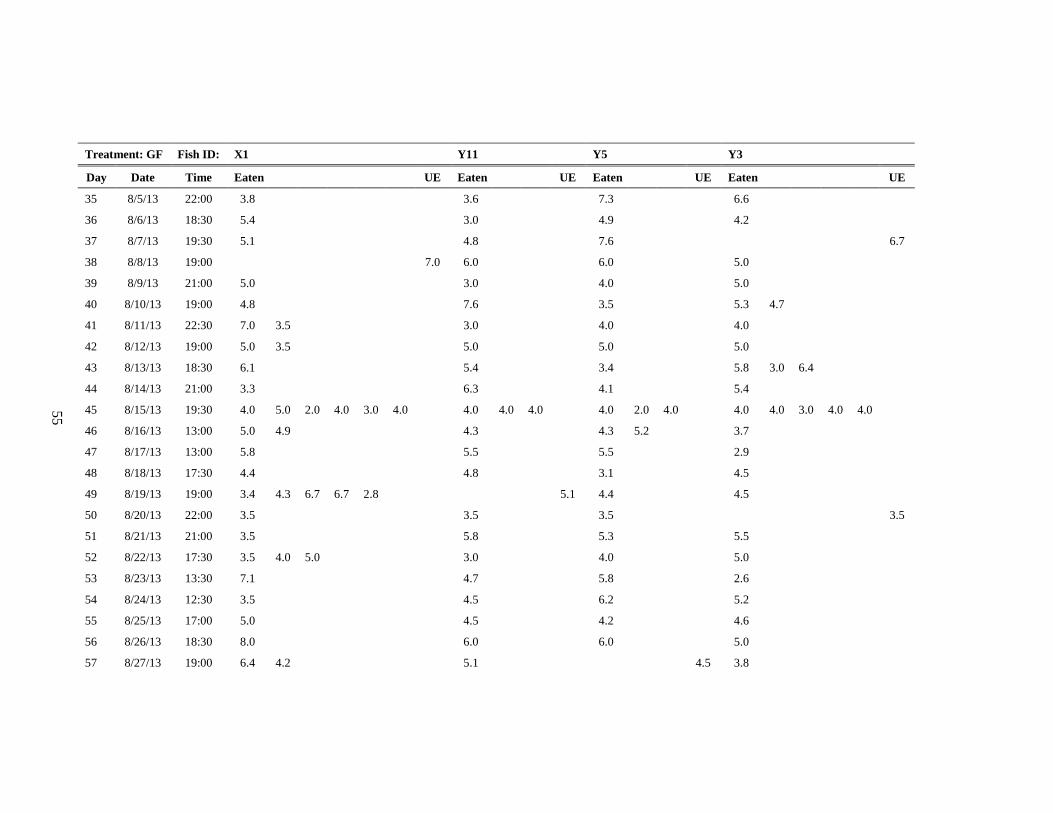
55
Treatment: GF Fish ID: X1 Y11 Y5 Y3
Day Date Time Eaten UE Eaten UE Eaten UE Eaten UE
35 8/5/13 22:00 3.8
3.6
7.3
6.6
36 8/6/13 18:30 5.4
3.0
4.9
4.2
37 8/7/13 19:30 5.1
4.8
7.6
6.7
38 8/8/13 19:00
7.0 6.0
6.0
5.0
39 8/9/13 21:00 5.0
3.0
4.0
5.0
40 8/10/13 19:00 4.8
7.6
3.5
5.3 4.7
41 8/11/13 22:30 7.0 3.5
3.0
4.0
4.0
42 8/12/13 19:00 5.0 3.5
5.0
5.0
5.0
43 8/13/13 18:30 6.1
5.4
3.4
5.8 3.0 6.4
44 8/14/13 21:00 3.3
6.3
4.1
5.4
45 8/15/13 19:30 4.0 5.0 2.0 4.0 3.0 4.0
4.0 4.0 4.0
4.0 2.0 4.0
4.0 4.0 3.0 4.0 4.0
46 8/16/13 13:00 5.0 4.9
4.3
4.3 5.2
3.7
47 8/17/13 13:00 5.8
5.5
5.5
2.9
48 8/18/13 17:30 4.4
4.8
3.1
4.5
49 8/19/13 19:00 3.4 4.3 6.7 6.7 2.8
5.1 4.4
4.5
50 8/20/13 22:00 3.5
3.5
3.5
3.5
51 8/21/13 21:00 3.5
5.8
5.3
5.5
52 8/22/13 17:30 3.5 4.0 5.0
3.0
4.0
5.0
53 8/23/13 13:30 7.1
4.7
5.8
2.6
54 8/24/13 12:30 3.5
4.5
6.2
5.2
55 8/25/13 17:00 5.0
4.5
4.2
4.6
56 8/26/13 18:30 8.0
6.0
6.0
5.0
57 8/27/13 19:00 6.4 4.2
5.1
4.5 3.8
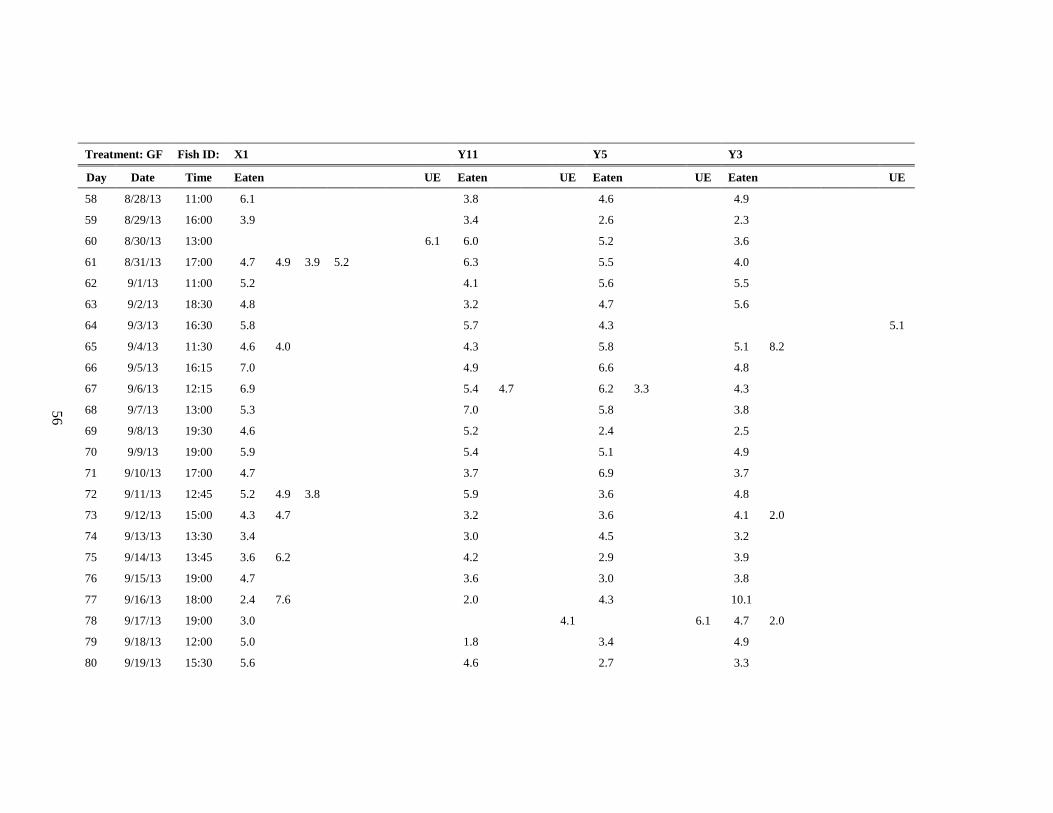
56
Treatment: GF Fish ID: X1 Y11 Y5 Y3
Day Date Time Eaten UE Eaten UE Eaten UE Eaten UE
58 8/28/13 11:00 6.1
3.8
4.6
4.9
59 8/29/13 16:00 3.9
3.4
2.6
2.3
60 8/30/13 13:00
6.1 6.0
5.2
3.6
61 8/31/13 17:00 4.7 4.9 3.9 5.2
6.3
5.5
4.0
62 9/1/13 11:00 5.2
4.1
5.6
5.5
63 9/2/13 18:30 4.8
3.2
4.7
5.6
64 9/3/13 16:30 5.8
5.7
4.3
5.1
65 9/4/13 11:30 4.6 4.0
4.3
5.8
5.1 8.2
66 9/5/13 16:15 7.0
4.9
6.6
4.8
67 9/6/13 12:15 6.9
5.4 4.7
6.2 3.3
4.3
68 9/7/13 13:00 5.3
7.0
5.8
3.8
69 9/8/13 19:30 4.6
5.2
2.4
2.5
70 9/9/13 19:00 5.9
5.4
5.1
4.9
71 9/10/13 17:00 4.7
3.7
6.9
3.7
72 9/11/13 12:45 5.2 4.9 3.8
5.9
3.6
4.8
73 9/12/13 15:00 4.3 4.7
3.2
3.6
4.1 2.0
74 9/13/13 13:30 3.4
3.0
4.5
3.2
75 9/14/13 13:45 3.6 6.2
4.2
2.9
3.9
76 9/15/13 19:00 4.7
3.6
3.0
3.8
77 9/16/13 18:00 2.4 7.6
2.0
4.3
10.1
78 9/17/13 19:00 3.0
4.1
6.1 4.7 2.0
79 9/18/13 12:00 5.0
1.8
3.4
4.9
80 9/19/13 15:30 5.6
4.6
2.7
3.3
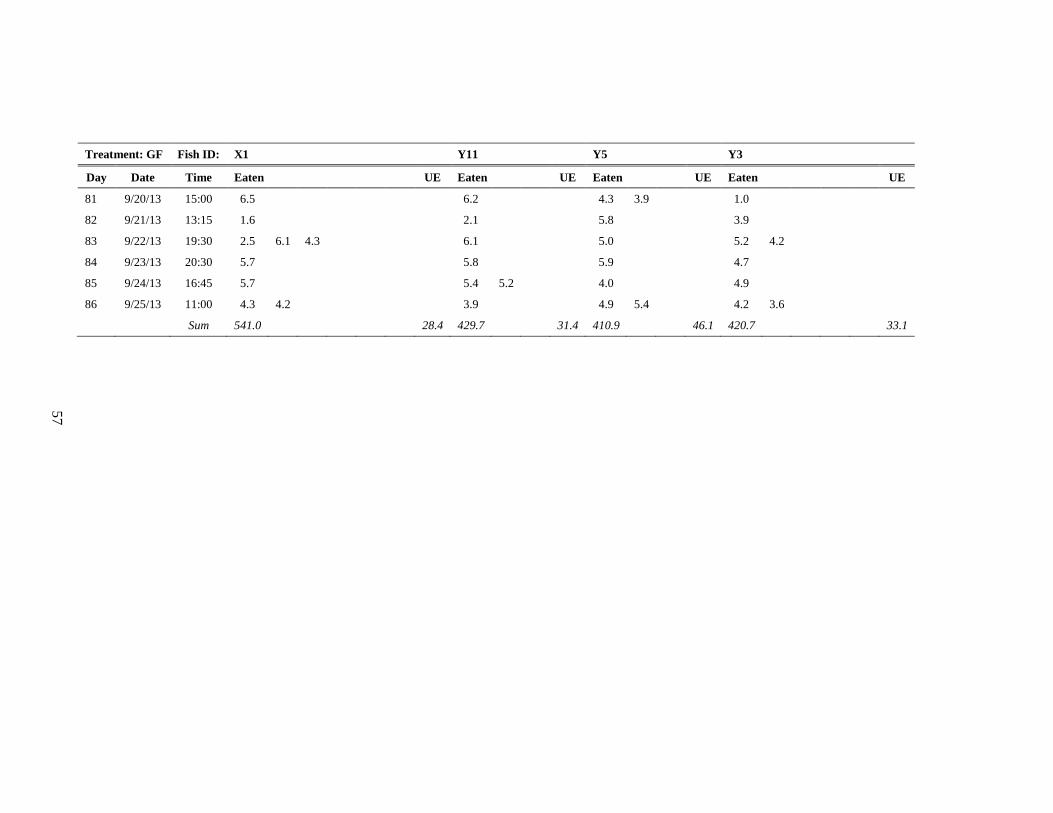
57
Treatment: GF Fish ID: X1 Y11 Y5 Y3
Day Date Time Eaten UE Eaten UE Eaten UE Eaten UE
81 9/20/13 15:00 6.5
6.2
4.3 3.9
1.0
82 9/21/13 13:15 1.6
2.1
5.8
3.9
83 9/22/13 19:30 2.5 6.1 4.3
6.1
5.0
5.2 4.2
84 9/23/13 20:30 5.7
5.8
5.9
4.7
85 9/24/13 16:45 5.7
5.4 5.2
4.0
4.9
86 9/25/13 11:00 4.3 4.2
3.9
4.9 5.4
4.2 3.6
Sum 541.0
28.4 429.7
31.4 410.9
46.1 420.7
33.1
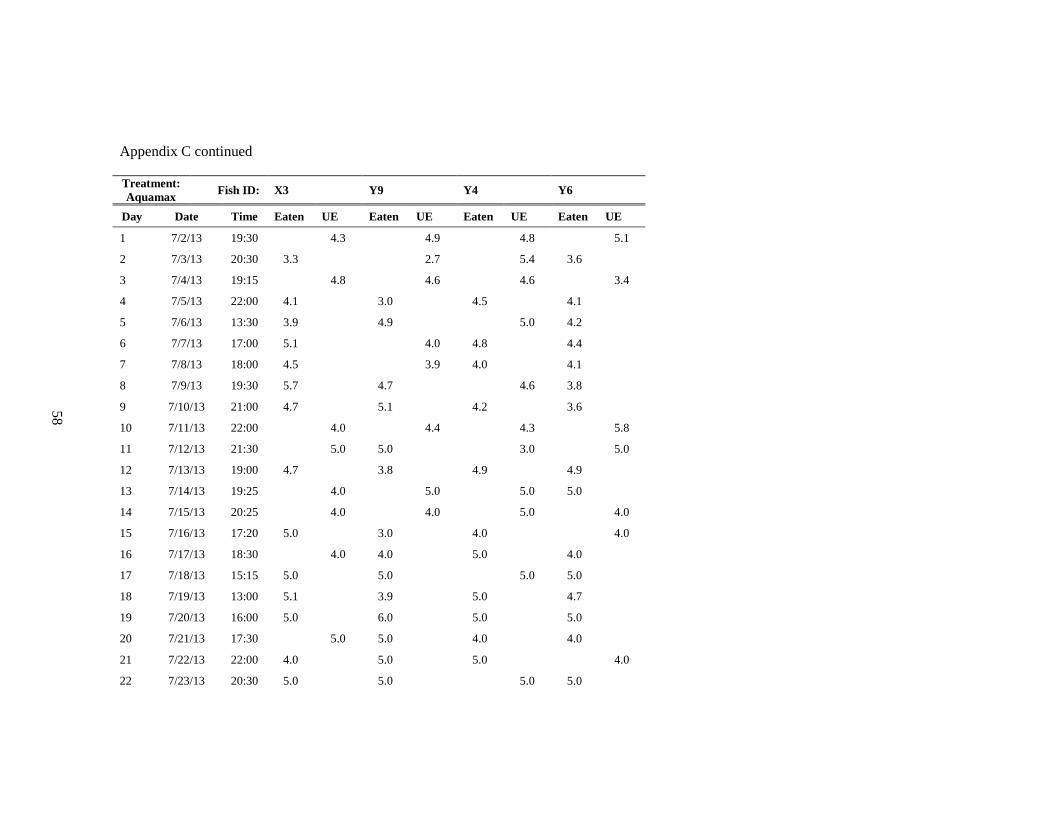
58
Appendix C continued
Treatment:
Aquamax Fish ID: X3 Y9 Y4 Y6
Day Date Time Eaten UE Eaten UE Eaten UE Eaten UE
1 7/2/13 19:30
4.3
4.9
4.8
5.1
2 7/3/13 20:30 3.3
2.7
5.4 3.6
3 7/4/13 19:15
4.8
4.6
4.6
3.4
4 7/5/13 22:00 4.1
3.0
4.5
4.1
5 7/6/13 13:30 3.9
4.9
5.0 4.2
6 7/7/13 17:00 5.1
4.0 4.8
4.4
7 7/8/13 18:00 4.5
3.9 4.0
4.1
8 7/9/13 19:30 5.7
4.7
4.6 3.8
9 7/10/13 21:00 4.7
5.1
4.2
3.6
10 7/11/13 22:00
4.0
4.4
4.3
5.8
11 7/12/13 21:30
5.0 5.0
3.0
5.0
12 7/13/13 19:00 4.7
3.8
4.9
4.9
13 7/14/13 19:25
4.0
5.0
5.0 5.0
14 7/15/13 20:25
4.0
4.0
5.0
4.0
15 7/16/13 17:20 5.0
3.0
4.0
4.0
16 7/17/13 18:30
4.0 4.0
5.0
4.0
17 7/18/13 15:15 5.0
5.0
5.0 5.0
18 7/19/13 13:00 5.1
3.9
5.0
4.7
19 7/20/13 16:00 5.0
6.0
5.0
5.0
20 7/21/13 17:30
5.0 5.0
4.0
4.0
21 7/22/13 22:00 4.0
5.0
5.0
4.0
22 7/23/13 20:30 5.0
5.0
5.0 5.0
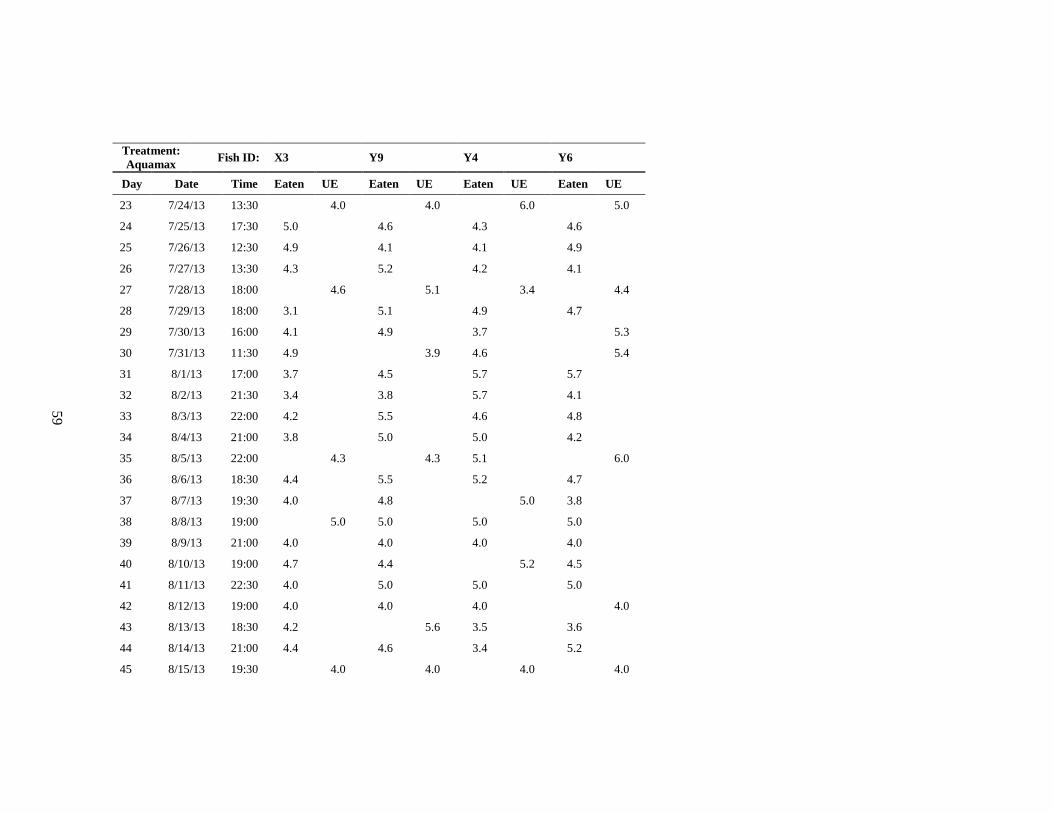
59
Treatment:
Aquamax Fish ID: X3 Y9 Y4 Y6
Day Date Time Eaten UE Eaten UE Eaten UE Eaten UE
23 7/24/13 13:30
4.0
4.0
6.0
5.0
24 7/25/13 17:30 5.0
4.6
4.3
4.6
25 7/26/13 12:30 4.9
4.1
4.1
4.9
26 7/27/13 13:30 4.3
5.2
4.2
4.1
27 7/28/13 18:00
4.6
5.1
3.4
4.4
28 7/29/13 18:00 3.1
5.1
4.9
4.7
29 7/30/13 16:00 4.1
4.9
3.7
5.3
30 7/31/13 11:30 4.9
3.9 4.6
5.4
31 8/1/13 17:00 3.7
4.5
5.7
5.7
32 8/2/13 21:30 3.4
3.8
5.7
4.1
33 8/3/13 22:00 4.2
5.5
4.6
4.8
34 8/4/13 21:00 3.8
5.0
5.0
4.2
35 8/5/13 22:00
4.3
4.3 5.1
6.0
36 8/6/13 18:30 4.4
5.5
5.2
4.7
37 8/7/13 19:30 4.0
4.8
5.0 3.8
38 8/8/13 19:00
5.0 5.0
5.0
5.0
39 8/9/13 21:00 4.0
4.0
4.0
4.0
40 8/10/13 19:00 4.7
4.4
5.2 4.5
41 8/11/13 22:30 4.0
5.0
5.0
5.0
42 8/12/13 19:00 4.0
4.0
4.0
4.0
43 8/13/13 18:30 4.2
5.6 3.5
3.6
44 8/14/13 21:00 4.4
4.6
3.4
5.2
45 8/15/13 19:30
4.0
4.0
4.0
4.0
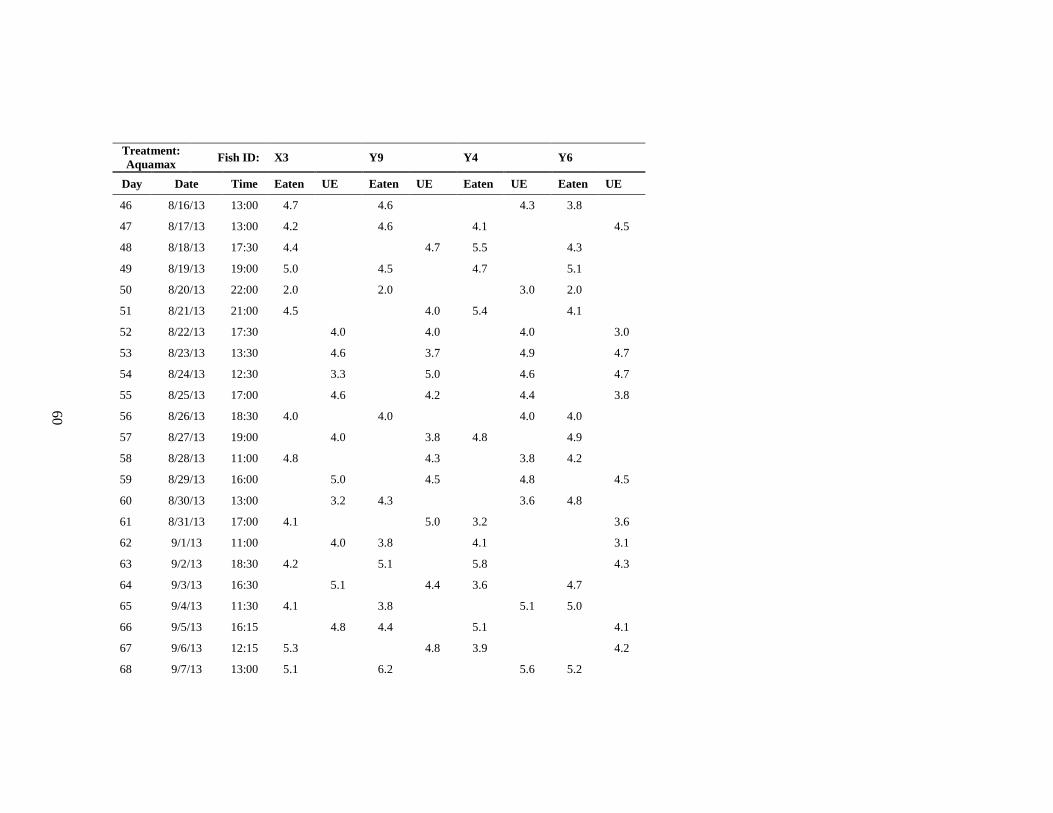
60
Treatment:
Aquamax Fish ID: X3 Y9 Y4 Y6
Day Date Time Eaten UE Eaten UE Eaten UE Eaten UE
46 8/16/13 13:00 4.7
4.6
4.3 3.8
47 8/17/13 13:00 4.2
4.6
4.1
4.5
48 8/18/13 17:30 4.4
4.7 5.5
4.3
49 8/19/13 19:00 5.0
4.5
4.7
5.1
50 8/20/13 22:00 2.0
2.0
3.0 2.0
51 8/21/13 21:00 4.5
4.0 5.4
4.1
52 8/22/13 17:30
4.0
4.0
4.0
3.0
53 8/23/13 13:30
4.6
3.7
4.9
4.7
54 8/24/13 12:30
3.3
5.0
4.6
4.7
55 8/25/13 17:00
4.6
4.2
4.4
3.8
56 8/26/13 18:30 4.0
4.0
4.0 4.0
57 8/27/13 19:00
4.0
3.8 4.8
4.9
58 8/28/13 11:00 4.8
4.3
3.8 4.2
59 8/29/13 16:00
5.0
4.5
4.8
4.5
60 8/30/13 13:00
3.2 4.3
3.6 4.8
61 8/31/13 17:00 4.1
5.0 3.2
3.6
62 9/1/13 11:00
4.0 3.8
4.1
3.1
63 9/2/13 18:30 4.2
5.1
5.8
4.3
64 9/3/13 16:30
5.1
4.4 3.6
4.7
65 9/4/13 11:30 4.1
3.8
5.1 5.0
66 9/5/13 16:15
4.8 4.4
5.1
4.1
67 9/6/13 12:15 5.3
4.8 3.9
4.2
68 9/7/13 13:00 5.1
6.2
5.6 5.2
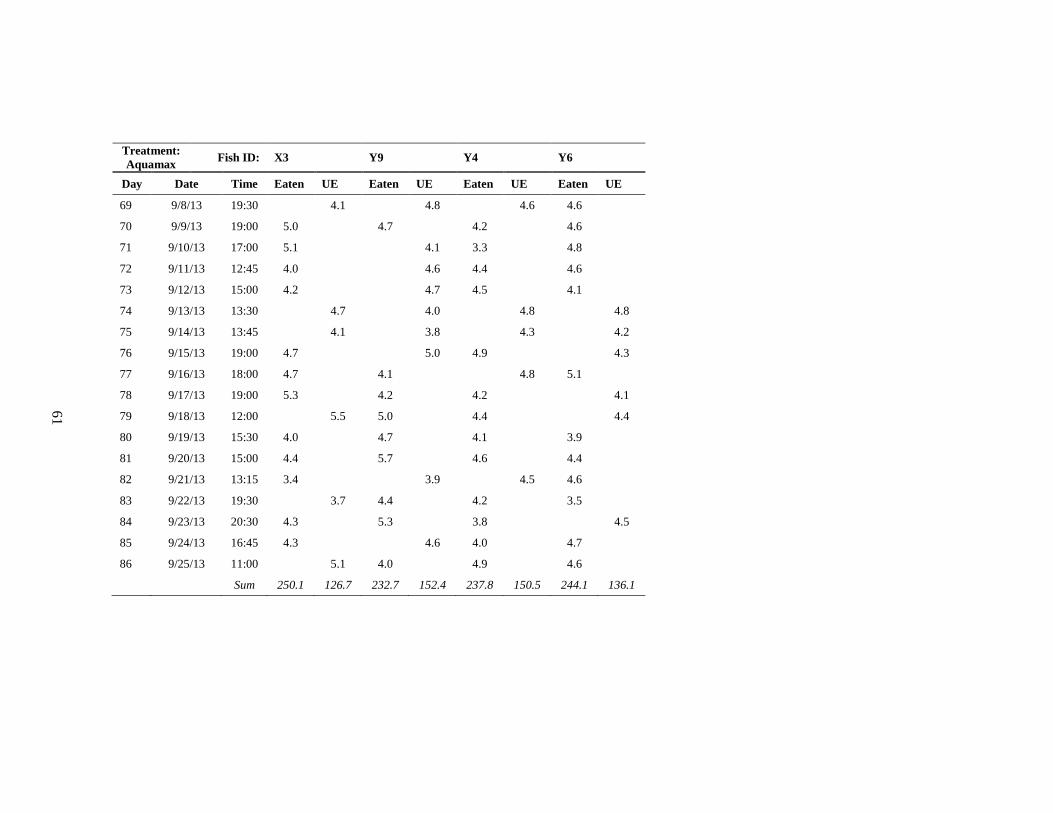
61
Treatment:
Aquamax Fish ID: X3 Y9 Y4 Y6
Day Date Time Eaten UE Eaten UE Eaten UE Eaten UE
69 9/8/13 19:30
4.1
4.8
4.6 4.6
70 9/9/13 19:00 5.0
4.7
4.2
4.6
71 9/10/13 17:00 5.1
4.1 3.3
4.8
72 9/11/13 12:45 4.0
4.6 4.4
4.6
73 9/12/13 15:00 4.2
4.7 4.5
4.1
74 9/13/13 13:30
4.7
4.0
4.8
4.8
75 9/14/13 13:45
4.1
3.8
4.3
4.2
76 9/15/13 19:00 4.7
5.0 4.9
4.3
77 9/16/13 18:00 4.7
4.1
4.8 5.1
78 9/17/13 19:00 5.3
4.2
4.2
4.1
79 9/18/13 12:00
5.5 5.0
4.4
4.4
80 9/19/13 15:30 4.0
4.7
4.1
3.9
81 9/20/13 15:00 4.4
5.7
4.6
4.4
82 9/21/13 13:15 3.4
3.9
4.5 4.6
83 9/22/13 19:30
3.7 4.4
4.2
3.5
84 9/23/13 20:30 4.3
5.3
3.8
4.5
85 9/24/13 16:45 4.3
4.6 4.0
4.7
86 9/25/13 11:00
5.1 4.0
4.9
4.6
Sum 250.1 126.7 232.7 152.4 237.8 150.5 244.1 136.1
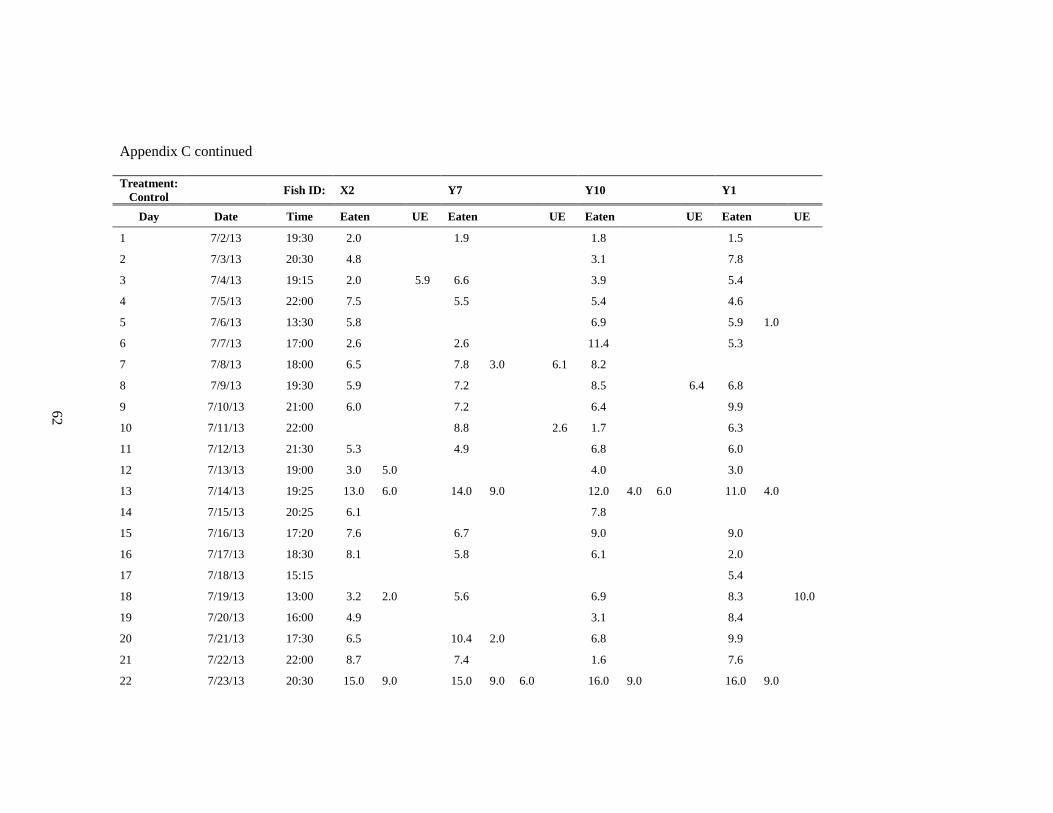
62
Appendix C continued
Treatment:
Control Fish ID: X2 Y7 Y10 Y1
Day Date Time Eaten UE Eaten UE Eaten UE Eaten UE
1 7/2/13 19:30 2.0
1.9
1.8
1.5
2 7/3/13 20:30 4.8
3.1
7.8
3 7/4/13 19:15 2.0
5.9 6.6
3.9
5.4
4 7/5/13 22:00 7.5
5.5
5.4
4.6
5 7/6/13 13:30 5.8
6.9
5.9 1.0
6 7/7/13 17:00 2.6
2.6
11.4
5.3
7 7/8/13 18:00 6.5
7.8 3.0
6.1 8.2
8 7/9/13 19:30 5.9
7.2
8.5
6.4 6.8
9 7/10/13 21:00 6.0
7.2
6.4
9.9
10 7/11/13 22:00
8.8
2.6 1.7
6.3
11 7/12/13 21:30 5.3
4.9
6.8
6.0
12 7/13/13 19:00 3.0 5.0
4.0
3.0
13 7/14/13 19:25 13.0 6.0
14.0 9.0
12.0 4.0 6.0
11.0 4.0
14 7/15/13 20:25 6.1
7.8
15 7/16/13 17:20 7.6
6.7
9.0
9.0
16 7/17/13 18:30 8.1
5.8
6.1
2.0
17 7/18/13 15:15
5.4
18 7/19/13 13:00 3.2 2.0
5.6
6.9
8.3
10.0
19 7/20/13 16:00 4.9
3.1
8.4
20 7/21/13 17:30 6.5
10.4 2.0
6.8
9.9
21 7/22/13 22:00 8.7
7.4
1.6
7.6
22 7/23/13 20:30 15.0 9.0
15.0 9.0 6.0
16.0 9.0
16.0 9.0
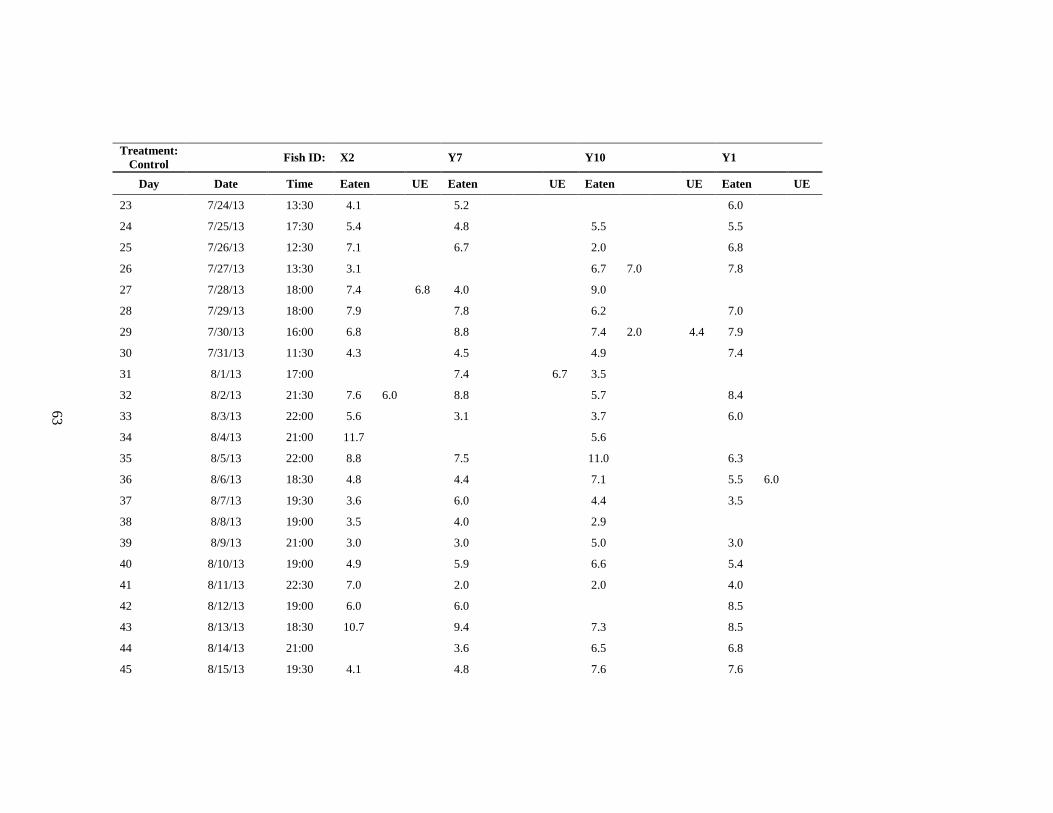
63
Treatment:
Control Fish ID: X2 Y7 Y10 Y1
Day Date Time Eaten UE Eaten UE Eaten UE Eaten UE
23 7/24/13 13:30 4.1
5.2
6.0
24 7/25/13 17:30 5.4
4.8
5.5
5.5
25 7/26/13 12:30 7.1
6.7
2.0
6.8
26 7/27/13 13:30 3.1
6.7 7.0
7.8
27 7/28/13 18:00 7.4
6.8 4.0
9.0
28 7/29/13 18:00 7.9
7.8
6.2
7.0
29 7/30/13 16:00 6.8
8.8
7.4 2.0
4.4 7.9
30 7/31/13 11:30 4.3
4.5
4.9
7.4
31 8/1/13 17:00
7.4
6.7 3.5
32 8/2/13 21:30 7.6 6.0
8.8
5.7
8.4
33 8/3/13 22:00 5.6
3.1
3.7
6.0
34 8/4/13 21:00 11.7
5.6
35 8/5/13 22:00 8.8
7.5
11.0
6.3
36 8/6/13 18:30 4.8
4.4
7.1
5.5 6.0
37 8/7/13 19:30 3.6
6.0
4.4
3.5
38 8/8/13 19:00 3.5
4.0
2.9
39 8/9/13 21:00 3.0
3.0
5.0
3.0
40 8/10/13 19:00 4.9
5.9
6.6
5.4
41 8/11/13 22:30 7.0
2.0
2.0
4.0
42 8/12/13 19:00 6.0
6.0
8.5
43 8/13/13 18:30 10.7
9.4
7.3
8.5
44 8/14/13 21:00
3.6
6.5
6.8
45 8/15/13 19:30 4.1
4.8
7.6
7.6
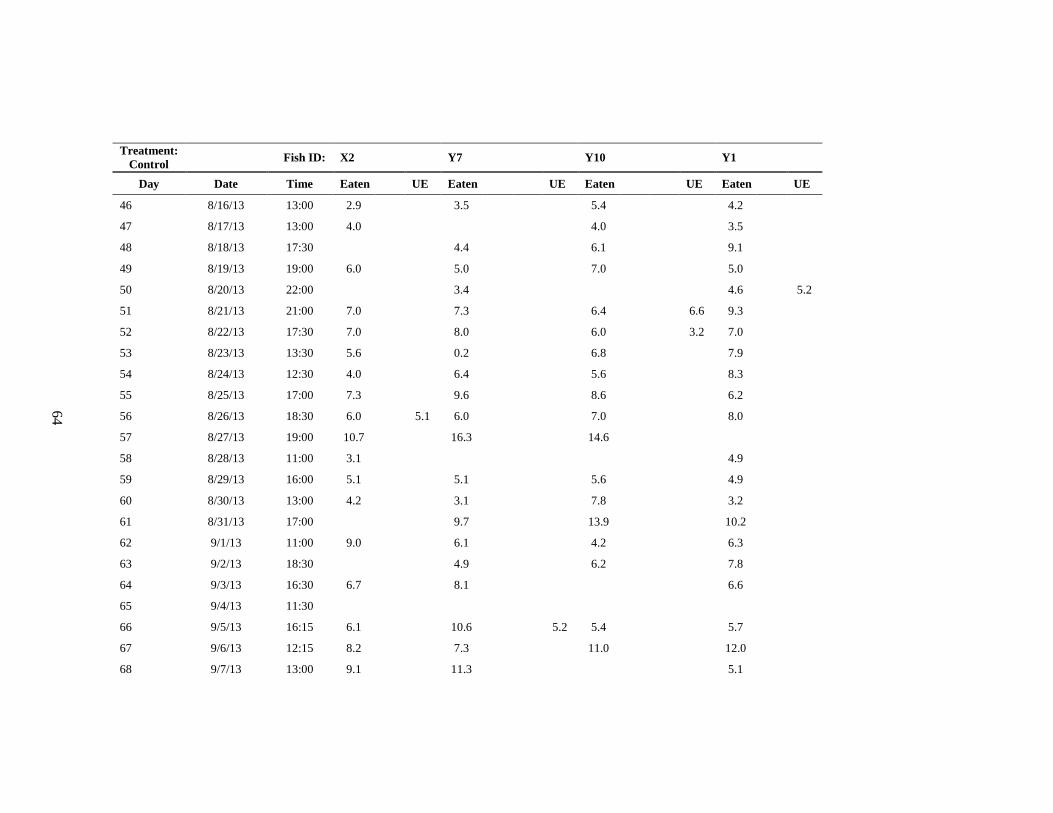
64
Treatment:
Control Fish ID: X2 Y7 Y10 Y1
Day Date Time Eaten UE Eaten UE Eaten UE Eaten UE
46 8/16/13 13:00 2.9
3.5
5.4
4.2
47 8/17/13 13:00 4.0
4.0
3.5
48 8/18/13 17:30
4.4
6.1
9.1
49 8/19/13 19:00 6.0
5.0
7.0
5.0
50 8/20/13 22:00
3.4
4.6
5.2
51 8/21/13 21:00 7.0
7.3
6.4
6.6 9.3
52 8/22/13 17:30 7.0
8.0
6.0
3.2 7.0
53 8/23/13 13:30 5.6
0.2
6.8
7.9
54 8/24/13 12:30 4.0
6.4
5.6
8.3
55 8/25/13 17:00 7.3
9.6
8.6
6.2
56 8/26/13 18:30 6.0
5.1 6.0
7.0
8.0
57 8/27/13 19:00 10.7
16.3
14.6
58 8/28/13 11:00 3.1
4.9
59 8/29/13 16:00 5.1
5.1
5.6
4.9
60 8/30/13 13:00 4.2
3.1
7.8
3.2
61 8/31/13 17:00
9.7
13.9
10.2
62 9/1/13 11:00 9.0
6.1
4.2
6.3
63 9/2/13 18:30
4.9
6.2
7.8
64 9/3/13 16:30 6.7
8.1
6.6
65 9/4/13 11:30
66 9/5/13 16:15 6.1
10.6
5.2 5.4
5.7
67 9/6/13 12:15 8.2
7.3
11.0
12.0
68 9/7/13 13:00 9.1
11.3
5.1
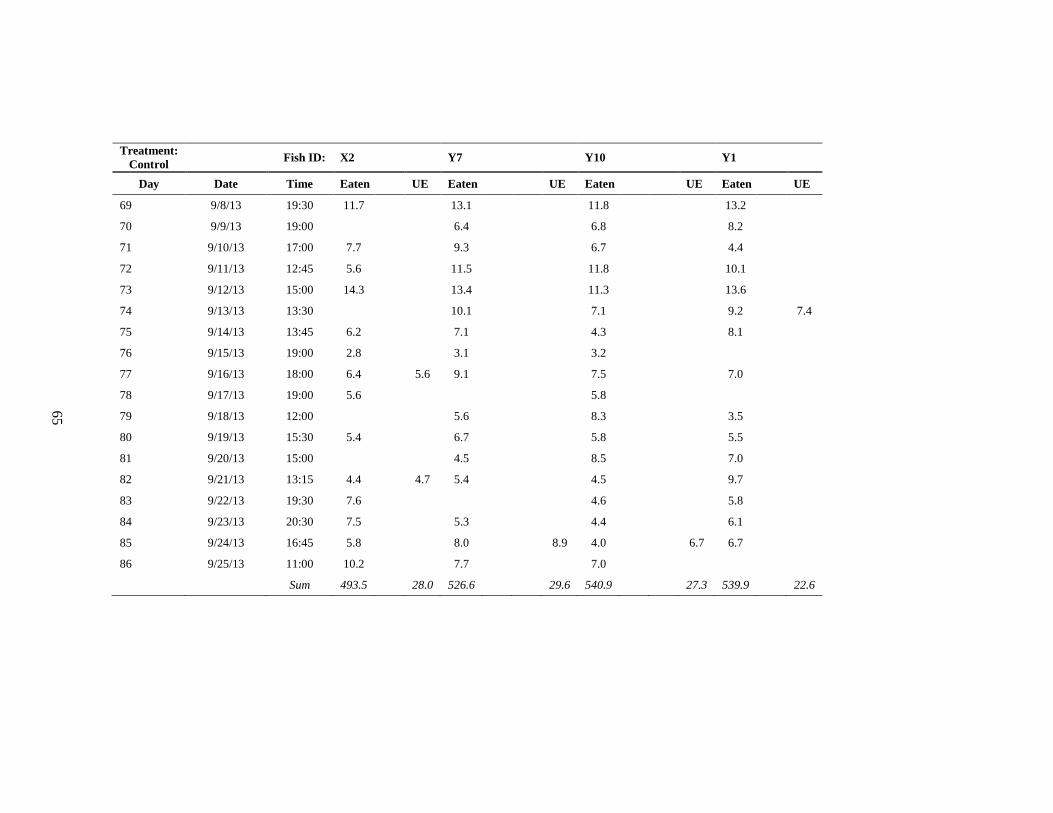
65
Treatment:
Control Fish ID: X2 Y7 Y10 Y1
Day Date Time Eaten UE Eaten UE Eaten UE Eaten UE
69 9/8/13 19:30 11.7
13.1
11.8
13.2
70 9/9/13 19:00
6.4
6.8
8.2
71 9/10/13 17:00 7.7
9.3
6.7
4.4
72 9/11/13 12:45 5.6
11.5
11.8
10.1
73 9/12/13 15:00 14.3
13.4
11.3
13.6
74 9/13/13 13:30
10.1
7.1
9.2
7.4
75 9/14/13 13:45 6.2
7.1
4.3
8.1
76 9/15/13 19:00 2.8
3.1
3.2
77 9/16/13 18:00 6.4
5.6 9.1
7.5
7.0
78 9/17/13 19:00 5.6
5.8
79 9/18/13 12:00
5.6
8.3
3.5
80 9/19/13 15:30 5.4
6.7
5.8
5.5
81 9/20/13 15:00
4.5
8.5
7.0
82 9/21/13 13:15 4.4
4.7 5.4
4.5
9.7
83 9/22/13 19:30 7.6
4.6
5.8
84 9/23/13 20:30 7.5
5.3
4.4
6.1
85 9/24/13 16:45 5.8
8.0
8.9 4.0
6.7 6.7
86 9/25/13 11:00 10.2
7.7
7.0
Sum 493.5
28.0 526.6
29.6 540.9
27.3 539.9
22.6
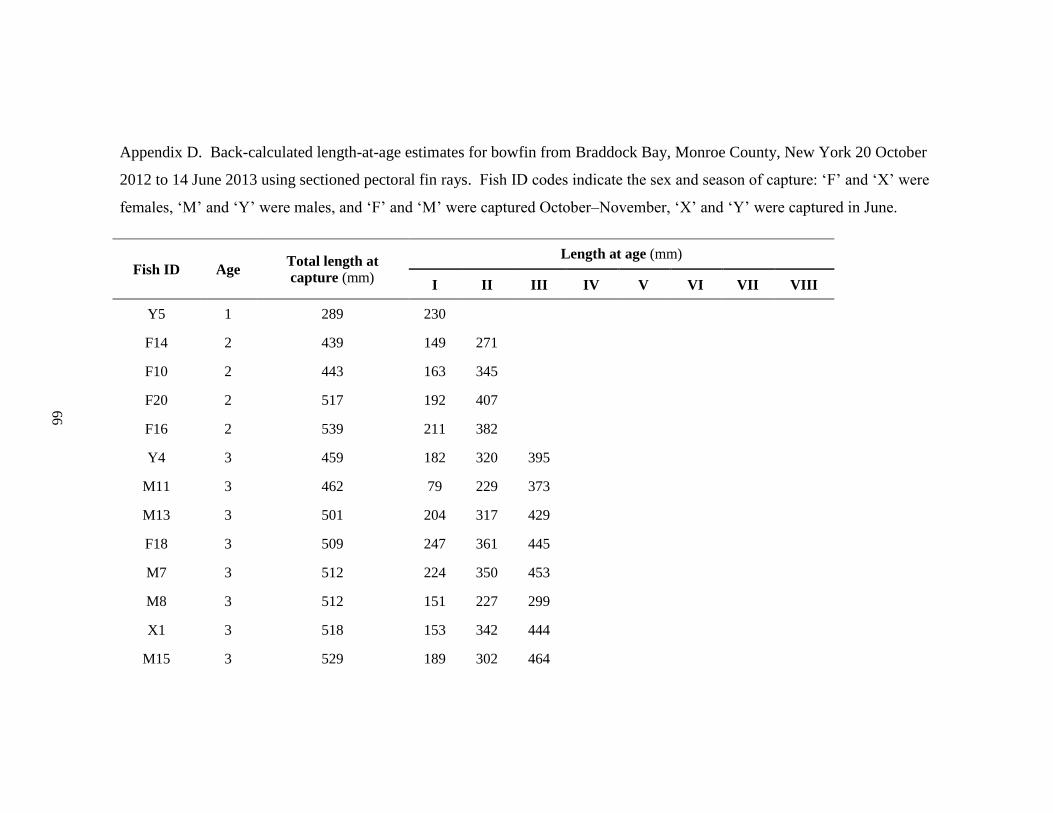
66
Appendix D. Back-calculated length-at-age estimates for bowfin from Braddock Bay, Monroe County, New York 20 October
2012 to 14 June 2013 using sectioned pectoral fin rays. Fish ID codes indicate the sex and season of capture: ‘F’ and ‘X’ were
females, ‘M’ and ‘Y’ were males, and ‘F’ and ‘M’ were captured October–November, ‘X’ and ‘Y’ were captured in June.
Fish ID Age Total length at
capture (mm)
Length at age (mm)
I II III IV V VI VII VIII
Y5 1 289 230
F14 2 439 149 271
F10 2 443 163 345
F20 2 517 192 407
F16 2 539 211 382
Y4 3 459 182 320 395
M11 3 462 79 229 373
M13 3 501 204 317 429
F18 3 509 247 361 445
M7 3 512 224 350 453
M8 3 512 151 227 299
X1 3 518 153 342 444
M15 3 529 189 302 464
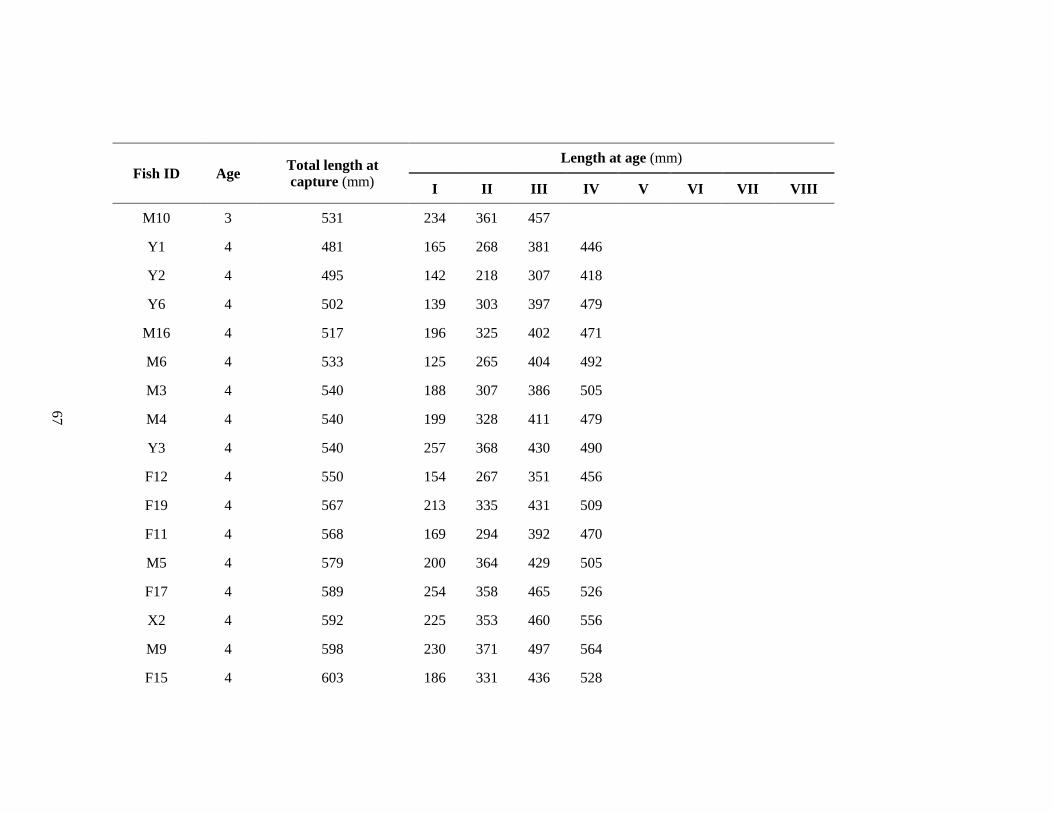
67
Fish ID Age Total length at
capture (mm)
Length at age (mm)
I II III IV V VI VII VIII
M10 3 531 234 361 457
Y1 4 481 165 268 381 446
Y2 4 495 142 218 307 418
Y6 4 502 139 303 397 479
M16 4 517 196 325 402 471
M6 4 533 125 265 404 492
M3 4 540 188 307 386 505
M4 4 540 199 328 411 479
Y3 4 540 257 368 430 490
F12 4 550 154 267 351 456
F19 4 567 213 335 431 509
F11 4 568 169 294 392 470
M5 4 579 200 364 429 505
F17 4 589 254 358 465 526
X2 4 592 225 353 460 556
M9 4 598 230 371 497 564
F15 4 603 186 331 436 528
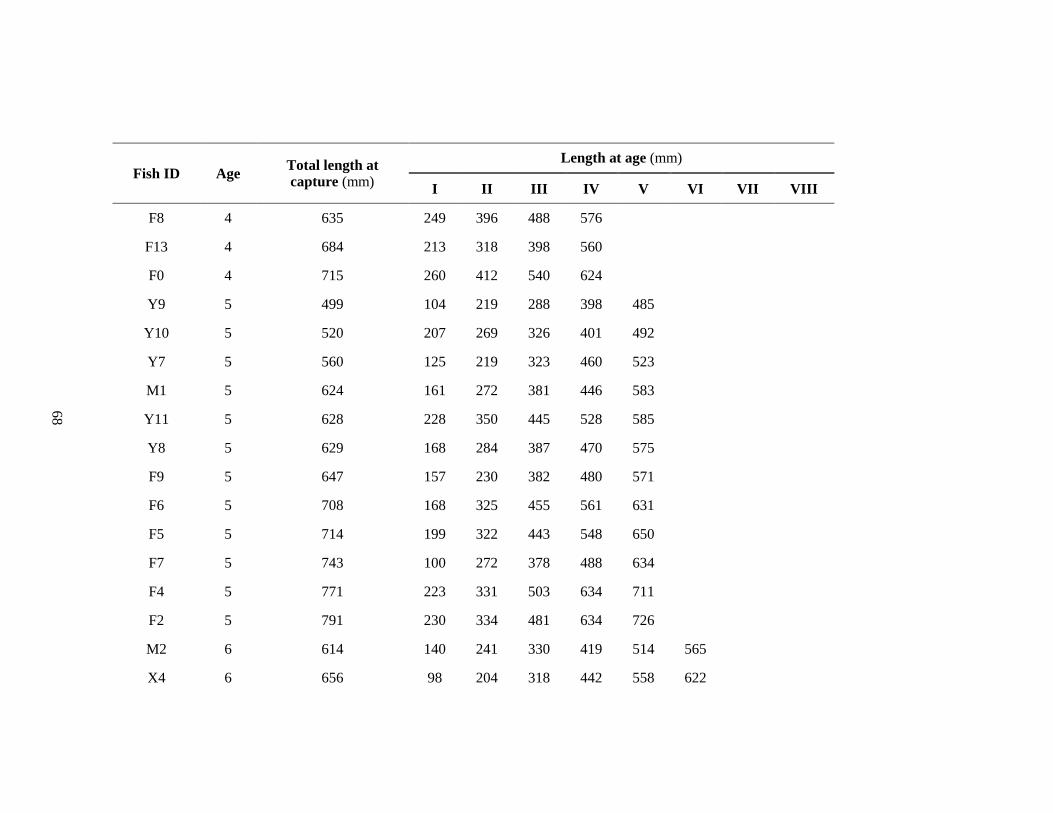
68
Fish ID Age Total length at
capture (mm)
Length at age (mm)
I II III IV V VI VII VIII
F8 4 635 249 396 488 576
F13 4 684 213 318 398 560
F0 4 715 260 412 540 624
Y9 5 499 104 219 288 398 485
Y10 5 520 207 269 326 401 492
Y7 5 560 125 219 323 460 523
M1 5 624 161 272 381 446 583
Y11 5 628 228 350 445 528 585
Y8 5 629 168 284 387 470 575
F9 5 647 157 230 382 480 571
F6 5 708 168 325 455 561 631
F5 5 714 199 322 443 548 650
F7 5 743 100 272 378 488 634
F4 5 771 223 331 503 634 711
F2 5 791 230 334 481 634 726
M2 6 614 140 241 330 419 514 565
X4 6 656 98 204 318 442 558 622
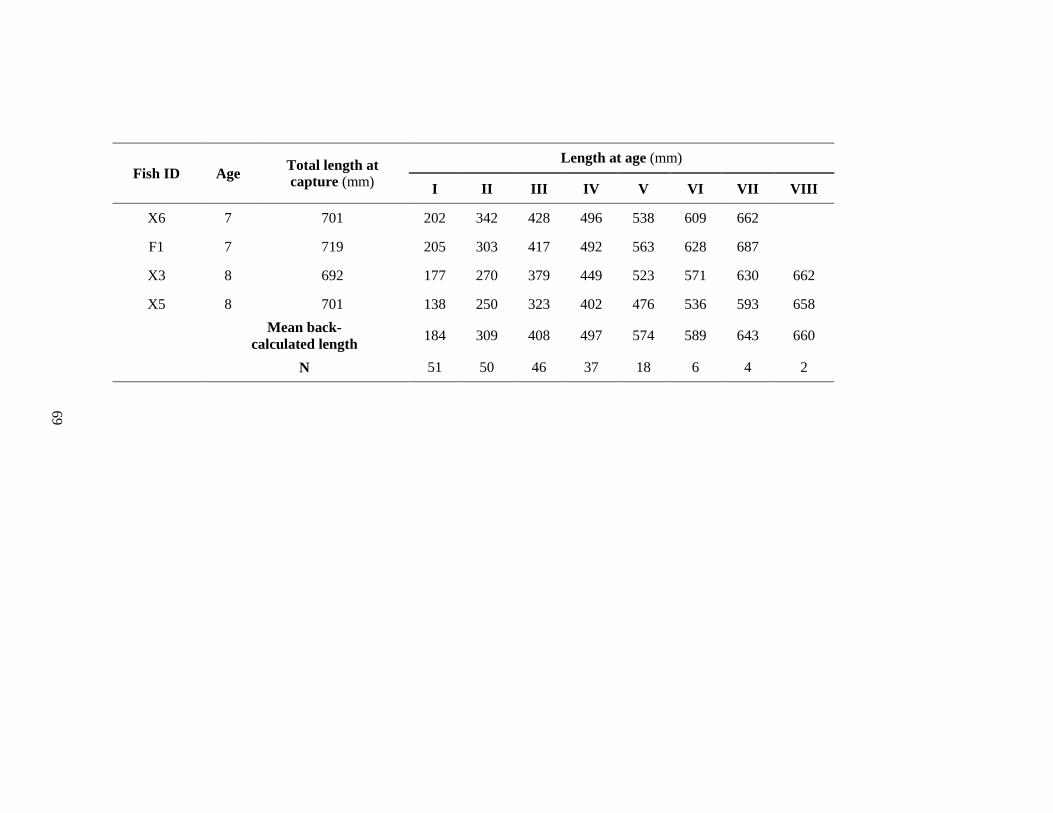
69
Fish ID Age Total length at
capture (mm)
Length at age (mm)
I II III IV V VI VII VIII
X6 7 701 202 342 428 496 538 609 662
F1 7 719 205 303 417 492 563 628 687
X3 8 692 177 270 379 449 523 571 630 662
X5 8 701 138 250 323 402 476 536 593 658
Mean back-
calculated length 184 309 408 497 574 589 643 660
N 51 50 46 37 18 6 4 2
70
Chapter 2
Status of the Last Wild Population of Northern Sunfish (Lepomis peltastes) in
New York State: Changes in the Fish Community and Hybridization with
Bluegill (L. macrochirus) in Tonawanda Creek, Erie County
Introduction
The northern sunfish (Lepomis peltastes Cope, 1870) is a small, ornate
centrarchid that inhabits low-gradient streams and rivers scattered throughout the
Great Lakes basin and the Upper Mississippi River drainage. It was formerly
recognized as one of two subspecies of L. megalotis, the longear sunfish, which was
divided into L. m. peltastes, the northern longear sunfish, and L. m. megalotis, the
central longear sunfish (Jennings 1991; Bailey et al. 2004; Figure 1). The northern
sunfish’s historical range encompassed eight waters in Western New York: the
Oneida Lake outlet, West Creek, Braddock Bay, Johnson Creek, Jeddo Creek, Oak
Orchard Creek, and Marsh Creek of the Lake Ontario basin, and Tonawanda Creek of
the Lake Erie basin (Wells & Haynes 2007; Figure 2). Local extirpations led to the
species being listed as “threatened” in New York State in 1983 (Carlson 2014). As of
2005, wild populations had only been detected in a single 3.7 km segment of lower
Tonawanda Creek (Wells 2009; Carlson 2014; Figure 2).
A recovery stocking program was initiated in 2005 by the NYSDEC, in which
production ponds were established with northern sunfish from Tonawanda Creek
(Lake Erie basin), the Huron River near Detroit, Michigan (Lake Erie basin), and the
71
Moira River near Tweed, Ontario, Canada (Lake Ontario basin). Several historical
watersheds, as well as those identified as having suitable habitat for L. peltastes by
Wells (2009), were stocked with a total of 19,000 fingerlings from 2006 to 2013.
Follow-up sampling showed they could be caught several months post-stocking in
Oak Orchard (personal communication, Douglas Carlson, NYSDEC, Watertown,
NY), Marsh, Cayuga, Murder, and Ellicott Creeks (Figure 2; Carlson 2014).
Recruitment was searched for, but documented only once in Cayuga Creek near
Buffalo, NY. Repeated sampling efforts were not successful in detecting recruitment
(D. Carlson, personal communication) at any stocking location.
Species description
Several features distinguish northern sunfish from co-occurring sunfishes in
Western New York, which include L. macrochirus (bluegill), L. gibbosus
(pumpkinseed), and L. cyanellus (green sunfish) which are not native to New York
(Carlson & Daniels 2004). Northern sunfish are the smallest of these species, with a
maximum total length (TL) of 130 mm, which is less than bluegill (410 mm),
pumpkinseed (400 mm), and green sunfish (310 mm). Northern sunfish are deep-
bodied with the forehead sloping steeply toward the dorsal fin. The opercular flap is
elongate, angled upwards, flexible, and black with a white margin and red center.
Bluegills, pumpkinseeds, and green sunfish have a much shorter, stiffer, and straight-
angled opercular flap that is plain black, black with a white margin and red highlight,
or black with a faint margin and orange highlight, respectively. Northern sunfish and

72
green sunfish have short, rounded pectoral fins, whereas pumpkinseeds and bluegills
have long, pointed pectoral fins. Northern sunfish have short, blunt gill rakers
numbering 12/5 on the lower and upper limb, as opposed to pumpkinseed with 8/4
short, blunt rakers, and green sunfish and bluegill which have long slender gill rakers.
Adults have bright coloration (more-so in males), including distinct wavy streaks of
turquoise and orange on the cheeks, a dark-olive dorsal surface blending to a
checkerboard pattern of orange, olive, and turquoise on the sides, a yellow belly, and
the fins are yellow overall with red spots in the membranes and black margins (Figure
3; Table 1; Scott & Crossman 1973; Page & Burr 1991).
Northern sunfish occupy warm water streams, rivers, ponds, and small lakes
with low turbidity (Scott & Crossman 1973), as well as calmer water near currents in
streams (Wells 2009). Their diet consists of small insects, fish, and crustaceans.
Spawning occurs in the early summer over bowl-shaped nests constructed by males in
gravel substrate (Keenleyside 1972; Scott & Crossman 1973).
Hybridization among sunfish
Natural and artificial hybridization have been well studied among Lepomis
spp. (cf. Hubbs 1920; Hubbs & Hubbs 1932; Childers 1967; Keenleyside et al. 1973;
Bolnick & Near 2005). Hubbs (1955) found that hybridization can be very common
in habitats that are degraded, when a new species is introduced, or when two related
sympatric species diverge greatly in abundance. In one stream near Ann Arbor,
Michigan, samples of the sunfish community were comprised of 95 percent green

73
sunfish x bluegill hybrids. Hubbs (1955) also demonstrated through laboratory
breeding experiments that previously described species of sunfish were in fact
hybrids: the species L. euryorus Mckay 1881 was a green sunfish x pumpkinseed
hybrid, and L. ischyrus Jordan & Nelson 1877 was a green sunfish x bluegill hybrid.
Mechanisms for hybridization among sunfish species in nature stem from the
complex breeding behavior of the genus. Northern sunfish, like most sunfish species,
are colonial nesters. Interspecific colonies of Lepomis are common, especially when
nesting substrate is limited. Jennings & Philipp (2002) observed frequent
interspecific nest intrusions in a nesting colony of longear sunfish and L. microlophus
(redear sunfish). Both cuckold males, which mimic females with dull coloration in
order to sneak past nest guarders, and nesting males were observed intruding on an
adjacent nest of another species. Similarly, Garner and Neff (2013) found
unidirectional hybridization occurring in a lake in southern Ontario caused by bluegill
cuckolds intruding on pumpkinseed nests.
Northern sunfish hybridization in Western New York has been a concern of
NYSDEC Fish Biologists Douglas Carlson and Scott Wells, who delivered eight
suspected hybrid specimens to the New York State museum from 1999 to 2013. Two
of these specimens were confirmed by museum staff to be northern sunfish x
pumpkinseed hybrids (Wells 2009; Carlson 2014). Earlier assessments of the status
of longear sunfish (Bouton 1994) contended that hybridization was a potential cause
for the species’ decline.

74
Objectives
The original goal of my study was to determine the status of New York’s
remaining wild population of northern sunfish in lower Tonawanda Creek. After an
intensive season of sampling in 2013, the population could not be detected and as
such, the project’s focus was expanded in 2014 to attempt to detect the species at
other locations stocked by the NYSDEC. Again the species was not detected in lower
Tonawanda Creek or elsewhere, and the goal of the project was broadened to become
an investigation of the cause(s) of the northern sunfish’s decline in lower Tonawanda
Creek. The objectives for achieving this goal were to:
Determine whether the fish community in lower Tonawanda Creek
had changed from 2005 to 2013, and
Investigate whether hybridization of northern sunfish with other
Lepomis spp. had occurred in lower Tonawanda Creek.
Methods
Study location
I conducted 30 sampling trips during the summers of 2013 and 2014 at 25
sites (Figure 4) within four watersheds of the Niagara River basin in Erie and
Genesee Counties, New York. Watersheds sampled included (1) Tonawanda Creek
with nine sites, (2) the Erie Canal with five sites, (3) Ellicott Creek with six sites, and
(4) Cayuga Creek with five sites. Alphanumeric codes were assigned to each

75
sampling site using the watershed number (1–4) and letters indicating relative
position of the site in an upstream order (A–I).
Sampling
Based on sampling in 2005 (Wells 2009) and from 1999–2012 (Carlson,
personal communication), several northern sunfish “hotspots” in lower Tonawanda
Creek were known at the beginning of my project; they included specific log jams,
features in the streambed, and lengths of shoreline. These spots were sampled during
most trips to lower Tonawanda Creek in 2013. The remaining effort during each trip
was distributed among other potentially desirable habitats (in-stream vegetation,
brush piles, shaded pools; Wells 2009) as well as less desirable habitat (bare mud
banks, swift waters, etc.).
In lower Tonawanda Creek, the Erie Canal, and lower Ellicott Creek,
sampling was performed by boat electroshocking (Type VI-A Pulsator, Smith-Root
Inc., Seattle, WA, with a 5,000 W generator mounted to a 5.5 m, 50 hp boat)
conducted during runs of ~900 sec of power-on time. Electrical impulses were
delivered in bursts while traveling slowly upstream along the shoreline. Sampling in
middle Tonawanda Creek (Figure 4: 1G) was conducted by raft-guided backpack
electroshocking (HT-2000, Halltech Aquatic Research, Inc., Guelph, Ontario,
Canada). Sampling in middle Cayuga Creek at Como Lake (Figure 4: 4D) was
conducted by canoe-guided backpack electroshocking. Sampling in upper
Tonawanda (Figure 4: 1I), lower Murder (Figure 4: 1H), upper Ellicott (Figure 4: 3F),

76
lower Cayuga and adjacent Slate Bottom Creeks (Figure 4: 4A–4C), and Little
Buffalo creeks (Figure 4: 4E) was conducted by backpack electroshocking on foot.
The Erie Canal (Figure 4: 2A–2E) and lower Tonawanda Creek (Figure 4:
1A–1E) were sampled by boat electroshocking in 2005 (Wells 2009) and during my
study in 2013 and 2014. Fourteen days of sampling occurred in 2013 in the lower 3.7
km of Tonawanda Creek (Figure 4: 1A–1F), the adjacent Erie Canal (Figure 4: 2A,
2B, 2D, and 2E), and lower Ransom Creek (Figure 4: 2C). One day of sampling
occurred in lower Ellicott Creek (Figure 4: 3A–3E). These creeks all enter the Erie
Canal; the mouth of Tonawanda Creek is 2.3 km from the mouth of Ransom Creek
and 17.4 km upstream from the mouth of Ellicott Creek.
In 2014, six days of sampling occurred in the lower 3.7 km of Tonawanda
Creek (Figure 4: 1A–1E) and the Erie Canal (Figure 4: 2A and 2D), one day of
sampling occurred in middle Tonawanda Creek near Rapids, New York (Figure 4:
1G), and eight days of sampling occurred (sometimes split between sites) at locations
stocked with northern sunfish by NYSDEC within the Niagara River watershed in
western New York: lower Murder Creek near Akron (Figure 4: 1H), upper
Tonawanda Creek near Alexander (Figure 4: 1I), upper Ellicott Creek near
Bowmansville (Figure 4: 3F), lower Cayuga and adjacent Slate Bottom Creeks in
Cheektowaga (Figure 4: 4A–4C), and middle Cayuga Creek at Como Lake in
Lancaster (Figure 4: 4D and 4E) (Table 2).
In 2013 all fish were netted, enumerated, and identified to species except for
some Moxostoma spp. (redhorse suckers). Because my project shifted focus in 2014

77
to the broader potential range of northern sunfish, I modified methods to allow for
greater sampling effort over a wider geographic area. Instead of collecting data for
each ~900 sec period of electrofishing, boat and backpack power-on time was
accumulated by site per-day, fish were only netted if they could not be identified in
the water, and each species captured was recorded per-location, per-day
(presence/absence data, not enumerated). In lower Tonawanda Creek (Figure 4: 1A–
1E), this allowed for a complete sampling of a shoreline, alternating with each visit,
from the mouth (Figure 4: 1A) to the Millersport Riffle (Figure 4: 1E) on most
sampling days. At sites sampled by backpack electroshocking unit, this method
allowed a much greater distance to be sampled each day (Table 3).
Fish community comparisons
Fish community records from my study in 2013 were compared to those in
2005 (from Wells 2009) for lower Tonawanda Creek and the adjacent Erie Canal.
Sampling runs were included in the analysis if they used boat electroshocking and
were conducted within 3 weeks of each other in 2013 at locations where northern
sunfish were captured in 2005. A total of 52 sampling runs (12 in 2005, 40 in 2013)
from six sites (Figure 4: 1A–1E and 2D) met these criteria. Sites 1A–1E are reaches
of lower Tonawanda Creek that have distinct physical properties (Figure 4): site 1A is
the slow, sluggish confluence of Tonawanda Creek and the Erie Canal; 1B is a
swifter, more vegetated area including the Pendleton Riffle; 1C is a slow, deep,
winding, sparsely vegetated reach with occasional shallows and woody debris; 1D is
78
the confluence of Mud Creek with Tonawanda Creek (including the downstream area
influenced by the confluence); and site 1E is the reach below and up-to the rapids at
Transit Road (Rt. 78), the Millersport Riffle. Site 2D is a muck-bottomed, dead-end
slough off of the Erie Canal 2.1 km west of the confluence with Tonawanda Creek
and 0.2 km east of Ransom Creek.
A few alterations were made in order to make the 2005 and 2013 data sets
comparable. First, to represent only the resident fish community, migrating and
numerous Dorosoma cepedianum (gizzard shad) and Notropis atherinoides (emerald
shiner) were not included. Second, species were combined for Esox spp. (pikes),
Moxostoma spp. (redhorses), and Etheostoma (darters)/Percina (logperches) spp.
Third, cyprinid (minnow) catches were grouped into the categories “native”—
consisting of Notemigonus crysoleucas (golden shiner), Luxilus chrysocephalus
(striped shiner), Notropis hudsonius (spottail shiner), Cyprinella spiloptera (spotfin
shiner), Lythrurus umbratilis (redfin shiner), Notropis volucellus (mimic shiner),
Pimephales notatus (bluntnose minnow), Pimephales promelas (fathead minnow),
and Semotilus atromaculatus (creek chub)—and “non-native”, consisting of
Carassius auratus (goldfish), Cyprinus carpio (common carp), and Scardinius
erythrophthalmus (rudd). Lastly, all catch data were transformed into Catch per Unit
Effort (CPUE) by dividing the number captured by the number of hours of power-on-
time exerted during a sampling run. A two-sample, two-tailed Student’s t-test was
used to test the hypotheses of whether individual species’ and overall fish CPUE
differed between 2005 and 2013.

79
Simpson’s index of diversity
Simpson’s index of diversity for the fish communities where northern sunfish
were caught in 2005 were compared with the fish sampled at the same sites in 2013
using an adapted Student’s t-test (Figure 4: 1A–1E, 2D; Brower & Zar 1984).
Simpson’s index of diversity, Ds, is one minus the probability that two individuals
taken in a sample belong to the same taxon; it increases as the number and evenness
of taxa increase and is calculated by:
𝐷𝑠 = 1 −∑ 𝑛𝑖(𝑛𝑖 − 1)
𝑁(𝑁 − 1)
where ni is the number of individuals in the ith
species and N is the total number of
individuals captured in the sample. A t-test can then be used to test the hypothesis
that two samples have equal diversities. The test uses the variance, s2, of the
Simpson’s index of diversity, which is calculated by:
𝑠2 =4[∑ 𝑝𝑖
3 − (∑ 𝑝𝑖2)2]
𝑁
where pi is the proportion of the total sample, N, comprised of the ith
species, or, 𝑛𝑖
𝑁.
The test statistic, t, is calculated by:
𝑡 =𝐷1 − 𝐷2
√𝑠12 + 𝑠2
2
and the degrees of freedom, df, are calculated as:
𝑑𝑓 = # taxa community 1 + # taxa community 2 − 2

80
Multivariate analyses
Statistical software (Plymouth Routines in Multivariate Ecological Research
v.6, PRIMER 6; Clarke & Gorley 2006) was used to evaluate fish community
similarities and differences across years. All CPUE data were Log10 (x+1)-
transformed to counteract the potential for a few highly abundant species to
overwhelm the analysis (Hubbell 2001). The data were then used to create a
resemblance matrix based on Bray-Curtis similarities between sampling runs. From
this matrix, an Analysis of Similarities (ANOSIM) was performed, which compared
the variation in the resemblance matrix between years to within years. The analysis
gives the test-statistic R that ranges from -1.0 to 1.0, meaning a high amount of
differences within- and among groupings, respectively. Next, a Similarity
Percentages (SIMPER) analysis was performed on the resemblance matrix to identify
the percent contributions of individual taxa to within-year similarities and between-
year dissimilarities. Lastly, non-metric Multidimensional Scaling (nMDS) was used
to create ordinations showing similarities/dissimilarities between sampling runs based
on sampling year. A vector-overlay of the species that contributed a cumulative 60%
of the overall dissimilarities between years was included in order to show the relative
strengths of their contributions (as indicated by the length of their vectors) and the
samples with which they aligned. Non-metric MDS is a technique that treats each
sampling run as a point in two-dimensional space by converting the values in the
resemblance matrix to relative distances between points and simplifying the number
of variables (taxa in this case) into two axes, or ordinations. It then rearranges the
81
points through a selected number of iterations (n = 50 in this case) until it reaches the
arrangement that causes the lowest “stress level”, or departure of the points from a
best-fitting regression line. Ordinations with a stress level of 0.2–0.3 should be
interpreted with caution, and those above 0.3 should be interpreted with extreme
caution (Clarke & Gorley 2006).
Green sunfish population assessment
A mark-recapture study was conducted to estimate the population abundance
of green sunfish in the lower 3.7 km of Tonawanda Creek from 25 July to 26
September 2013. A multiple-census technique, the Schnabel method (Schnabel
1938), was used during sampling dates 25 July, 12 & 22 August, and 26 September
2013. The method uses the formula:
�̂� =∑ 𝐶𝑡𝑀𝑡
𝑛𝑡=1
∑ 𝑅𝑡𝑛𝑡=1
where N̂ is the estimation of the total population, t is an individual sampling period, n
is the total number of samplings, Ct is the total number of fish captured during the tth
sampling, Mt is the cumulative number of fish marked prior to the tth
sampling, and Rt
is the number of marked fish recaptured in the tth
sampling. This method has the
assumptions that the mark is not lost, all marked fish are recognized upon recapture,
marked and unmarked fish have equal vulnerability to capture and mortality rates,
marked fish will redistribute equally back into the population, and there is no
recruitment for the duration of the sampling period. Because the sum of total
recaptured sunfish was less than 50, the Poisson distribution was used to estimate the
82
95% confidence intervals by substituting the denominator of the above equation with
values obtained in Appendix II of Ricker (1975; Van Den Avyle & Hayward 1999).
Sampling on each day was conducted with a ~900 sec power-on-time
electroshocking run at each of sites 1A–1E. No alterations were made to the overall
sampling design or study methods to collect green sunfish for this mini-study, except
that green sunfish were held in a live well until being processed and released at the
end of an electroshocking run. Only green sunfish >24 mm TL were studied in order
to reduce errors in identification and to minimize violations of the assumptions of the
method. Fish were marked by removing a pelvic fin.
Hybrid sunfish identification
Following difficulties identifying sub-adult sunfish, a key was developed from
the meristics, morphometrics and generalized descriptions of the four western New
York sunfish species published in Smith (1985) and Scott and Crossman (1973), and
adapted with input from NYSDEC Fish Biologist Douglas Carlson (Table 1). Using
this key, even on very small juveniles, several suspected hybrid sunfish were
captured, photographed alive, had tissue taken for genetic analysis, and transported
frozen to the New York State Museum, Albany, NY for morphometric analysis.
Genetic analysis was performed by Dr. Jose Andres (HeridiTec, Lansing, NY)
on 89 sunfish specimens collected in lower Tonawanda Creek in 2013 and 2014 and
from a NYSDEC northern sunfish hatchery pond: 27 suspected hybrids, 11
pumpkinseed, 20 bluegill, 15 green sunfish, and 16 northern sunfish. Analysis was
83
attempted on 11 additional specimens but the results were inconclusive. By using
microsatellite techniques to analyze the pure bred specimens’ nuclear genomes, the
alleles of each of the nine genes examined were identified as belonging to one of the
four pure species. Each hybrid’s parental make-up was then determined by
identifying the species to which each set of the nine parental alleles belonged.
Since the mitochondrial genome is inherited from the mother, the direction of
each hybrid was determined by identifying the parental origin of the mitochondrial
genome. A hybrid index was calculated using STRUCTURE (Pritchard et al. 2000)
for each specimen. The index value ranges from 0 to 1 and represents the probability
that a specimen’s genome resulted from random mating within one of the parental
populations. Values close to 0 or 1 indicate a pure-bred specimen, and intermediate
values indicate hybridization.
Results
Sampling effort and CPUE
A total of 49.12 hours of electroshocking power-on time (effort) was exerted
in 162 sampling runs over 34 days during three years at 25 sites in four watersheds
(Table 3), capturing a total of 57 species from 14 families (Appendices A & B). A
total of 28.67 hours of effort was exerted in 2013 and 2014 in areas where L. peltastes
was detected historically and in 2005: lower Tonawanda Creek (Figure 4: 1A-1F) and
a near-by dead-end slough adjacent to the Erie Canal (Figure 4: 2D), although only
the efforts in 2013, totaling 18.58 hours, were used for the fish community
84
comparisons. Wells (2009) exerted 3.00 hours of effort at the same locations in 2005.
In 2013 and 2014, another 12.02 hours of effort were exerted in areas where the
northern sunfish has been reintroduced (Tables 2 & 3; Figure 4: 2A, 1H, 1I, 3F, 4A–
C, 4E). No non-hybrid northern sunfish were captured at any location in 2013 and
2014 (Appendix B).
From 2005 to 2013, the average CPUE of all fish in lower Tonawanda Creek
and the Erie Canal (Figure 4: 1A–1E, 2D) increased significantly (t = 2.556, df = 50,
P = 0.014) from 398.0 fish/hour to 610.5 fish/hour, a 53.4% increase (%∆ CPUE;
Table 4). The centrarchid community had several shifts in average CPUE (df = 50
per test). Green sunfish CPUE increased by 940.8% (t = 5.801, P < 0.001), bluegills
increased by 260.5% (t = 1.988, P = 0.052), and Ambloplites rupestris (rock bass)
increased by 123.3% (t = 1.793, P = 0.079), while pumpkinseeds remained relatively
constant, with only a 5.5% decrease (t = -0.159, P = 0.874). The CPUE of the black
bass species Micropterus dolomieu (smallmouth bass) and M. salmoides (largemouth
bass) decreased by -77.8% (t = -4.496, P < 0.001) and -19.4% (t = -0.593, P = 0.556),
respectively (Table 4).
Non-centrarchid taxa with a decrease in average CPUE >90% included
Hypentelium nigricans (northern hog sucker; -100%, t = -1.87, P = 0.067), Noturus
gyrinus (tadpole madtom; -100%, t = -1.87, P = 0.067), Aplodinotus grunniens
(freshwater drum; -100%, t = -2.774, P = 0.008), Catostomus commersonii (white
sucker; -95.7%, t = -3.017, P = 0.004), Noturus miurus (brindled madtom; -95.7%, t =
-3.821, P < 0.001), and darters and logperches (-90.2%, t = -6.28, P < 0.001). Taxa
85
with an increase in average CPUE greater than 200% included Neogobius
melanostomus (round goby; +200%, t = 1.291, P = 0.203) and pikes (+220.0%, t =
2.247, P = 0.029; Table 4).
Simpson’s index of diversity
The fish community in lower Tonawanda Creek (Figure 4: 1A–1E) and the
dead-end slough off the Erie Canal (Figure 4: 2D) had significantly higher values of
Simpson’s index of diversity (Ds) in 2005 (0.790) than 2013 (0.715; t = 3.05, df = 47,
P = 0.004). The community richness also decreased from 2005 to 2013 (mean 13.42
to 10.92 species or species groups per sample; Table 5).
Multivariate analyses
There was a significant change in the fish communities of lower Tonawanda
Creek and the Erie Canal (Figure 4: 1A–1E, 2D) between 2005 and 2013 (ANOSIM,
R = 0.806, P = 0.001). SIMPER showed that taxa contributing >5% to the similarities
within the 2005 samples were native (17.8%, NACY) and non-native (10.2%,
NNCY) cyprinids, darters and logperches (9.2%, DART), largemouth bass (8.7%,
MISA), redhorses (7.8%, MOXO), green sunfish (7.7%, LECY), smallmouth bass
(6.7%, MIDO), pumpkinseed (6.5%, LEGI), bluegill (5.7%, LEMA), northern sunfish
(5.5%, LEPE), and rockbass (5.2%, AMRU). Taxa contributing >5% to the
similarities within the 2013 samples were green sunfish (22.4%, LECY), native
cyprinids (17.8%, NACY), bluegill (14.7%, LEMA), rock bass (11.3%, AMRU),
redhorse (9.3%, MOXO), pumpkinseed (7.8%, LEGI), and pikes (5.1%, ESOX).
86
Taxa contributing >5% to the dissimilarities between the 2005 and 2013 samples
were green sunfish (9.5%, LECY), darters and logperch (7.8%, DART), bluegill
(7.4%, LEMA), non-native cyprinids (7.0%, NNCY), northern sunfish (6.5%, LEPE),
pikes (5.4%, ESOX), and smallmouth bass (5.2%, MIDO; Table 6).
The nMDS plot (Figure 5) showed a strong separation between the 2005 and
2013 samples in lower Tonawanda Creek and the Erie Canal combined (Figure 4:
1A–1E, 2D). When the top nine contributing taxa were laid over the nDMS plot,
green sunfish, bluegill and rock bass aligned with the 2013 samples. Northern
sunfish, darters and logperches, non-native cyprinids, smallmouth bass, pumpkinseed,
and pikes aligned with the 2005 samples. The 2-dimensional stress level of the plot
was 0.2 which is the lower end of the range needing cautious interpretation.
Green sunfish population assessment
The population of green sunfish in lower Tonawanda Creek (Figure 4: 1A–
1E) in 2013 was estimated to be 8,606 (95% CI: 6,297–12,116; Table 7). This stream
reach is approximately 3,670 m long, and the density of green sunfish along the
shorelines was estimated to be roughly: 8,606 (6,297-12,116) fish ÷ (3,670 m north
bank + 3,670 m south bank) = 1.2 (95% CI: 0.9–1.7) green sunfish/meter of shoreline.
Hybrid sunfish identification
From my sample of 27 suspected hybrids, genetic analysis showed that there
were eight bluegill x northern sunfish, eight bluegill x pumpkinseed, eight bluegill x

87
green sunfish, and three green sunfish x pumpkinseed hybrids captured in lower
Tonawanda Creek in 2013 and 2014 (crosses are in “male x female” order). All
crosses were unidirectional, and bluegills were always the male parent of their
respective hybrids. Among the “pure bred” specimens identified, two green sunfish,
one bluegill, and one northern sunfish (from the NYSDEC hatchery pond) each had a
single hybrid allele (Table 8). Selected photographs of juvenile (~5–7 cm), age-at-
maturity (~8–12 cm), and mature adult (~14–18 cm) specimens of each pure bred and
hybrid group are included in Figures 6–8. Photographs of all specimens examined are
provided in Appendix C (http://digitalcommons.brockport.edu/env_theses/101).
Discussion
Sampling methods
I found the methods used for boat and backpack electroshocking very
effective for capturing sunfish: unlike larger, strong-swimming fish such as pikes and
Sander vitreus (walleye) that sensed the electrical current and quickly escaped,
sunfish would retreat toward the shoreline and easily succumb to electroshocking.
The field methods in 2013 and 2014 did not, however, entirely coincide with the
statistical methods and fish community comparisons I ended up using. First, only
hard to identify, native minnows collected during the first few trips in 2013 were
transported back to the lab for sure identifications, after which identifications were
made quickly in the field to permit more sampling time and distance. For the same
reason redhorses, juvenile darters and logperches, and juvenile pikes were

88
infrequently identified to species in 2013. This uncertainty about the accuracy of
certain field identifications in 2013, as well as some inconsistencies between
identifications made in 2005 (Wells 2009) and 2013, led to combining hard-to-
identify species from both years into the reliably identified groupings described
above. Moreover, by only recording presence/absence data in 2014, an entire field
season could not be included in the statistical analysis of this study. However, this
method did allow for more sampling to occur and increased the likelihood of
capturing any potential northern sunfish occupying the surveyed areas.
Changes in the fish community of lower Tonawanda Creek
In 2013 I found major changes in the fish community at the lower Tonawanda
Creek and Erie Canal sites where northern sunfish were last collected in 2005. The
overwhelming increase in abundance (+940.8% CPUE) and the high density (1.2 fish
per meter shoreline) of green sunfish, which are not native to NY State (Carlson &
Daniels 2004), and the large increase in bluegill abundance (+260.5%) indicate that
the centrarchid community overall has increased greatly in size. Concurrently, the
pike community has also increased in abundance (+220.0%). Northern sunfish are
the smallest of the Lepomis species occupying this area, and it is likely that they have
not fared well during increased interspecific competition and higher abundance of a
major centrarchid predator, the pikes (Scott & Crossman 1973). The significant
decreases in smallmouth bass (-77.8%) and redhorses (-47.9%), the near
disappearances of darters and logperches (-90.2%) and brindled madtoms (-95.7%),
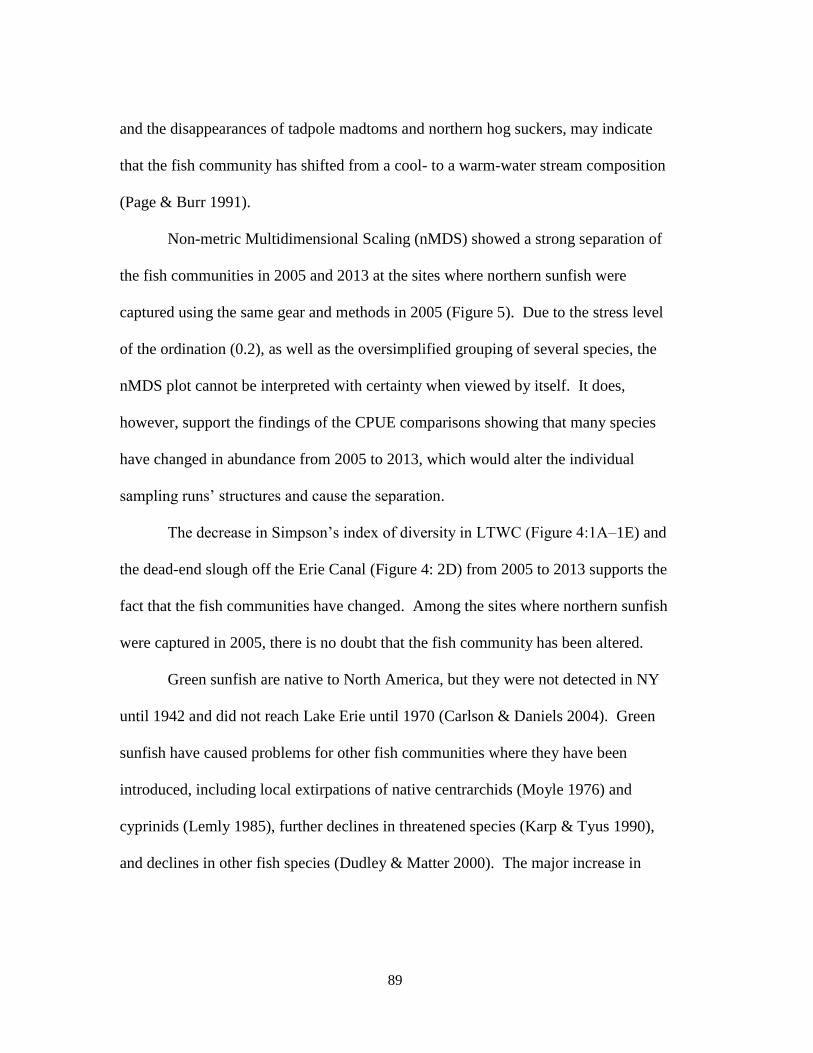
89
and the disappearances of tadpole madtoms and northern hog suckers, may indicate
that the fish community has shifted from a cool- to a warm-water stream composition
(Page & Burr 1991).
Non-metric Multidimensional Scaling (nMDS) showed a strong separation of
the fish communities in 2005 and 2013 at the sites where northern sunfish were
captured using the same gear and methods in 2005 (Figure 5). Due to the stress level
of the ordination (0.2), as well as the oversimplified grouping of several species, the
nMDS plot cannot be interpreted with certainty when viewed by itself. It does,
however, support the findings of the CPUE comparisons showing that many species
have changed in abundance from 2005 to 2013, which would alter the individual
sampling runs’ structures and cause the separation.
The decrease in Simpson’s index of diversity in LTWC (Figure 4:1A–1E) and
the dead-end slough off the Erie Canal (Figure 4: 2D) from 2005 to 2013 supports the
fact that the fish communities have changed. Among the sites where northern sunfish
were captured in 2005, there is no doubt that the fish community has been altered.
Green sunfish are native to North America, but they were not detected in NY
until 1942 and did not reach Lake Erie until 1970 (Carlson & Daniels 2004). Green
sunfish have caused problems for other fish communities where they have been
introduced, including local extirpations of native centrarchids (Moyle 1976) and
cyprinids (Lemly 1985), further declines in threatened species (Karp & Tyus 1990),
and declines in other fish species (Dudley & Matter 2000). The major increase in

90
green sunfish abundance, coupled with its ability to disrupt fish communities, is likely
to be a major driver in the decline of the northern sunfish in lower Tonawanda Creek.
Competition with green sunfish cannot explain why northern sunfish were not
detected at the sites 2A and 2D (Figure 4) which contained few or no green sunfish.
Site 2A is a shallow widewater off of the Erie Canal that was stocked in 2011 with
325 adult northern sunfish averaging 63.5 mm TL (Carlson 2014). The site was
sampled once in 2013 and four times across three days in 2014 (Table 3). Green
sunfish were only sampled in low numbers during two out of the five electroshocking
runs (Appendix B).
Lepomis hybridization
The rate of hybridization occurring in lower Tonawanda Creek between
northern sunfish females and bluegill males is alarming. There were pure northern
sunfish at five sites in lower Tonawanda Creek and one site adjacent to the Erie Canal
in 2005, but sampling every meter of the shorelines at the six sites repeatedly for two
summers captured eight hybrid and no pure northern sunfish. Roughly equal numbers
of other Lepomis hybrid crosses were also captured in 2013-2014, which supports the
findings of Hubbs (1955) that natural hybridization occurs when one species is scarce
among abundant related species. Because of this situation northern sunfish
hybridized proportionally at a higher rate than the other Lepomis species.
The mechanisms for the hybridization could have been due to female northern
sunfish resembling female bluegills and being accepted by a spawning male bluegill,

91
or there were nesting pairs of northern sunfish intruded upon by cuckolding male
bluegills, which is not likely given my finding of no pure northern sunfish.
Cuckolding would explain, however, the fact that all hybrids with bluegill parentage
had bluegill fathers (supporting the findings of Garner & Neff 2014). In either case,
northern sunfish likely had major problems in my study area with finding mates due
to an extremely low population density, and finding spawning habitat due to high
competition for it by other very abundant Lepomis species.
Interestingly, my study using genetic analysis of fish sampled in 2013-2014
found only northern sunfish x bluegill hybrids, while morphometric analysis by NY
State museum staff identified two northern sunfish x pumpkinseed hybrids in samples
provided from sampling between 2005 and 2012 (Wells 2009; Carlson 2014). It is
very difficult to identify Lepomis hybrids, especially in juvenile form (see Figures 6–
8). My results suggest that genetics is a more reliable way.
Other factors potentially contributing to the decline of L. peltastes
The increase in abundance of the non-native round goby (+200%) could have
contributed to the northern sunfish’s decline. This species has shown multiple
negative impacts in streams of the Great Lakes, including predation on fish eggs and
increasing the competition for food (Pennuto et al. 2010; Kornis et al. 2012). Since
this species is small and benthic, boat electroshocking in deep, turbid water such as
lower Tonawanda Creek is not an efficient method for capturing round gobies (Kornis
et al. 2012). Undoubtedly the true population size is larger than what my samples

92
suggest, and the effects of the round goby invasion may be underestimated. The
species was first caught in Tonawanda Creek in 2002, and seine samples by
NYSDEC in this area have seen an increase in frequency of occurrence (# seines
containing round goby ÷ total number of samples) to over 80% by 2011 (D. Carlson,
personal communication).
I collected three specimens of the non-indigenous species, Morone americana
(white perch), in lower Tonawanda Creek which was not collected by Wells (2009).
This species is native to Atlantic coast drainages and was introduced to the Great
Lakes via the Erie Canal in the 1950s. Like its distant, morphologically-similar
relative, Perca flavescens (yellow perch), it is an opportunistic feeder (Page & Burr
1991) and would likely consume northern sunfish eggs and juveniles if available.
Northern sunfish were observed spawning at one particular “hotspot” in
2005—a fluvial ledge at the confluence of Mud Creek and Tonawanda Creek (Figure
4: 2D; Wells 2009). Months before my 2013 sampling, a residential property on the
north bank of Mud Creek 60 m upstream of the confluence had a landslide that
blocked the flow of Mud Creek for several weeks (personal communication, Timothy
DePriest, NYSDEC, Buffalo, NY). This event contributed an enormous amount of
suspended solids and likely buried the spawning hotspot with sediment.
Conclusion
After massive electroshocking effort, New York State’s remaining wild
population of northern sunfish in lower Tonawanda Creek has fallen below detectable

93
levels. The evidence of hybridization I found may be a “vapor trail” left by a native
population now lost to our state. The large change in the fish community in the study
area indicates that this habitat has been altered and that it is unlikely to be suitable for
restocking unless it can be restored to favor the northern sunfish again. Surveys in
other streams of the area which had been stocked were also without evidence of
established populations. If the LTWC system is changing from a coolwater to
warmwater fish community, perhaps due to global warming or changes in the
watershed, restoration of the northern sunfish may not be possible in this historical
location, and possibly other streams in the area.
Of those waters surveyed in 2013 and 2014, I believe the best candidate sites
for developing a population would be ones with low green sunfish and round goby
abundance. One such site is Como Lake on Cayuga Creek (Figure 4: 4D)—fish
community samples did not detect round goby (nor did any samples in Cayuga Creek)
and were rich with sensitive species of suckers and darters, indicating a healthy
ecosystem. Ellicott Creek at Bowmansville (Figure 4: 3F) is another candidate site
because round goby were not detected. Lastly, the unnamed creek (Figure 4: 2B)
west of Ransom Creek (Figure 4: 2C) may be a good candidate locale because neither
green sunfish nor round goby were detected (Appendix B). An examination of
physical characteristics in streams in Western NY should be conducted as a follow-up
to Wells (2009) to aid in identifying new waters potentially suitable for northern
sunfish, and future efforts in LTWC should continue to monitor if this remnant
historical site could be repopulated.

94
Although I did not detect them in 2013-2014, northern sunfish were found at
some sites where they were reintroduced in the Niagara River watershed in Western
New York in the years before my study. Rather than have the recovery program be
discontinued, I urge managers to 1) identify additional waters suitable for northern
sunfish with low green sunfish, bluegill, pike, and round goby abundance, 2) continue
propagating the Tonawanda Creek strain to stock in these waters, and 3) develop a
more frequent and systematic sampling schedule to assess restocking success.
Literature Cited
Bailey, R. M., W. C. Latta, and G. R. Smith. 2004. An atlas of Michigan fishes with
keys and illustrations for their identification. Misc. Publ. Mus. Zool., Univ.
Michigan. 192: 1-215.
Bolnick, D. I., and T. J. Near. 2005. Tempo of hybrid inviability in centrarchid fishes
(Teleostei: Centrarchidae). Evolution. 59: 1754–1767.
Bouton, D. 1994. Strategies and near term operational plan for the management of
endangered, threatened, and special concern fishes of New York. New York
State Department of Environmental Conservation. Albany, New York.
Brower, J. E., and J. H. Zar. 1984. Field and laboratory methods for general ecology.
Second Edition. Wm. C. Brown Publishers. Dubuque, Iowa.
Carlson, D. M., and R. A. Daniels. 2004. Status of fishes in New York: increases,
declines, and homogenization of watersheds. Am. Midl. Nat. 152: 104–139
Carlson, D. M. 2014. Summary of northern sunfish recovery efforts in NYS, 2002–
2013. Unpublished. NYS Dept. of Environmental Conservation. Albany, New
York. 10pp.
Childers, W. F. 1967. Hybridization of four species of sunfishes (Centrachidae). Bull.
Ill. Nat. Hist. Surv. 29: 159–214.
95
Clarke, K. R., and R. N. Gorley. 2006. PRIMER v6: user manual/tutorial. PRIMER-
E, Plymouth, United Kingdom. 192pp.
Dudley, R. K., and W. J. Matter. 2000. Effects of small green sunfish (Lepomis
cyanellus) on recruitment of Gila chub (Gila intermedia) in Sabino Creek,
Arizona. Southwest. Nat. 45: 24–29.
Fuller, P., and M. Cannister. 2012. Lepomis megalotis. USGS Nonindigenous Aquatic
Species Database. [Online.] U. S. Geological Survey, Gainesville, Florida.
Available at: http://nas.er.usgs.gov/queries/factsheet.aspx?SpeciesID=388
Garner, S. R., and B. D. Neff. 2013. Alternative male reproductive tactics drive
asymmetrical hybridization between sunfishes (Lepomis spp.). Biol. Lett. 9:
1–4.
Hubbell, S. P. 2001. The unified neutral theory of biodiversity and biogeography.
Princeton University Press, Princeton, New Jersey. 392pp.
Hubbs, C. L. 1920. Notes on hybrid sunfishes. Aquatic Life. 5: 101–103.
Hubbs, C. L. 1955. Hybridization between fish species in nature. Syst. Zool. 4: 1–20.
Hubbs, C. L., and L. C. Hubbs. 1932. Experimental verification of natural
hybridization between distinct genera of sunfishes. Pap. Mich. Acad. Sci,
Arts, Letters. 15: 427–437.
Jennings, M. J. 1991. Sexual selection, reproductive strategies, and genetic variation
in the longear sunfish (Lepomis megalotis). Dissertation. University of
Illinois, Urbana, Illinois.
Jennings, M. J. 2013. Longear sunfish. Fishes of Wisconsin. [Online]. Available at:
http://www.fow-ebook.us/account.jsp?species_param=1464
Jennings, M. J., and D. P. Philipp. 2002. Alternative mating tactics in sunfishes
(Centrachidae): a mechanism for hybridization? Copeia. 2002: 1102–1105.
Karp, C. A., and H. M. Tyus. 1990. Behavioral interactions between young Colorado
squawfish and six fish species. Copeia. 1990: 25–34.
Keenleyside, M. H. A. 1972. Intraspecific intrusions into nests of spawning longear
sunfish (Pisces: Centrarchidae). Copeia. 1972: 272–278.
96
Keenleyside, M. H. A., R. K. Misra, and D. W. Bateson. 1973. Extended analysis of
hybridization in sunfish (Centrarchidae) using an adjusted hybrid index
method. J. Fish. Res. Board Can. 30: 1901–1904.
Kornis, M. S., N. Mercado-Silva, and M. J. Vander Zanden. 2012. Twenty years of
invasion: a review of round goby Neogobius melanostomus biology, spread
and ecological implications. J. Fish Bio. 80: 235–285.
Lemly, A. D. 1985. Suppression of native fish populations by green sunfish in first-
order streams of Piedmont North Carolina. T. Am. Fish. Soc. 114: 705–712.
Moyle, P. B. 1976. Inland fishes of California. University of California Press,
Berkeley, California.
Page, L. M., and B. M. Burr. 1991. A field guide to freshwater fishes of North
America north of Mexico. Houghton Mifflin Co., New York, New York.
Pennuto, C. M., P. J. Krakowia, and C. E. Janik. 2010. Seasonal abundance, diet, and
energy consumption of round gobies (Neogobius melanostomus) in Lake Erie
tributary streams. Ecol. Freshw. Fish. 19: 206–215.
Pritchard, J. K., M. Stephens, and P. Donnelly. 2000. Inference of population
structure using multilocus genotype data. Genetics. 155: 945–959
Ricker, W. E. 1975. Computation and interpretation of biological statistics of fish
populations. Bulletin 191. Fisheries Research Board of Canada, Ottawa,
Canada. 382pp.
Schnabel, Z. E. 1938. The estimation of the total fish population of a lake. Am. Math.
Monogr. 45: 348–368
Scott, W. B., and E .J. Crossman. 1973. Freshwater fishes of Canada. Bulletin 184.
Fisheries Research Board of Canada, Ottawa, Canada. 966pp.
Smith, C. L. 1985. The inland fishes of New York State. NYS Dept. of
Environmental Conservation. Albany, New York. 522pp.
Van Den Avyle, M. J., and R. S. Hayward. 1999. Dynamics of exploited fish
populations. Pages 127–166 in C. C. Kohler and W. A. Hubert, editors. Inland
Fisheries Management in North America. Second Edition. American Fisheries
Society, Bethesda, Maryland.

97
Wells, S. M. 2009. Habitat associations of fish species and their assemblages in the
Tonawanda and Johnson Creek watersheds of northwestern New York State.
M. S. thesis. The College at Brockport, State University of New York,
Brockport, New York.
Wells, S. M., and J. M. Haynes. 2007. Status of the longear sunfish (Lepomis
megalotis), in western New York, USA. Final Report - SWG T-5, Project 2.
NYS Dept. of Environmental Conservation. Albany, New York. 174pp.
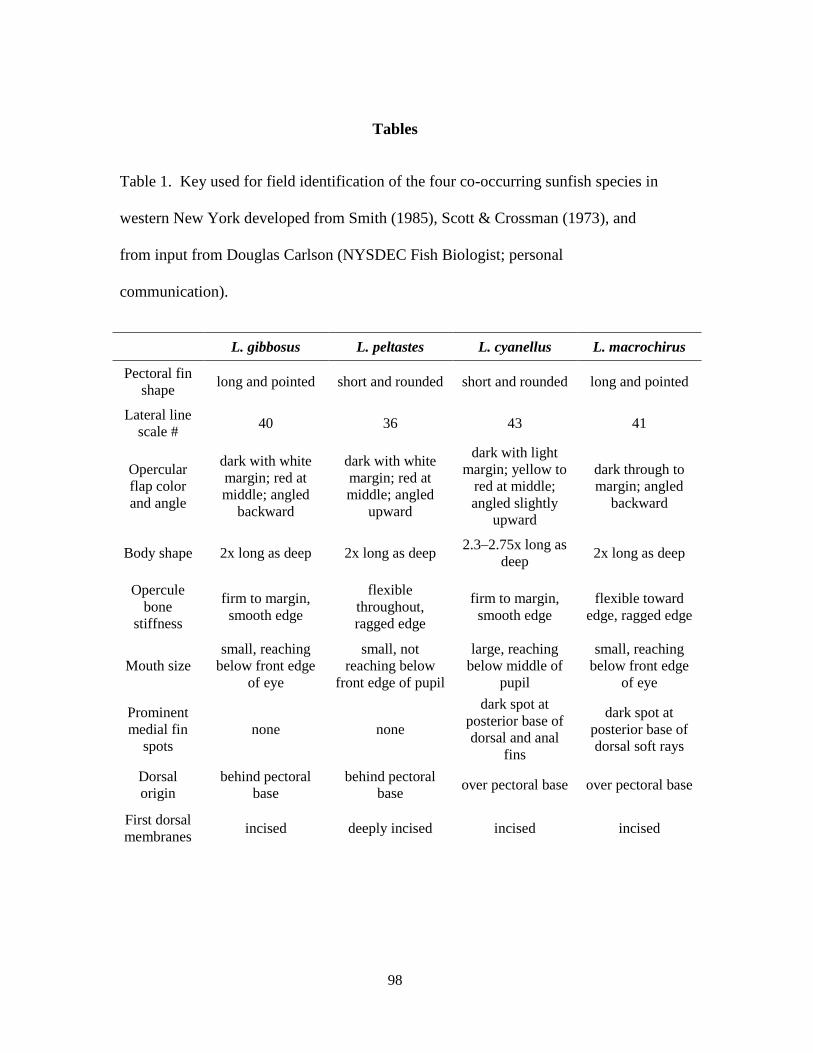
98
Tables
Table 1. Key used for field identification of the four co-occurring sunfish species in
western New York developed from Smith (1985), Scott & Crossman (1973), and
from input from Douglas Carlson (NYSDEC Fish Biologist; personal
communication).
L. gibbosus L. peltastes L. cyanellus L. macrochirus
Pectoral fin
shape long and pointed short and rounded short and rounded long and pointed
Lateral line
scale # 40 36 43 41
Opercular
flap color
and angle
dark with white
margin; red at
middle; angled
backward
dark with white
margin; red at
middle; angled
upward
dark with light
margin; yellow to
red at middle;
angled slightly
upward
dark through to
margin; angled
backward
Body shape 2x long as deep 2x long as deep 2.3–2.75x long as
deep 2x long as deep
Opercule
bone
stiffness
firm to margin,
smooth edge
flexible
throughout,
ragged edge
firm to margin,
smooth edge
flexible toward
edge, ragged edge
Mouth size
small, reaching
below front edge
of eye
small, not
reaching below
front edge of pupil
large, reaching
below middle of
pupil
small, reaching
below front edge
of eye
Prominent
medial fin
spots
none none
dark spot at
posterior base of
dorsal and anal
fins
dark spot at
posterior base of
dorsal soft rays
Dorsal
origin
behind pectoral
base
behind pectoral
base over pectoral base over pectoral base
First dorsal
membranes incised deeply incised incised incised
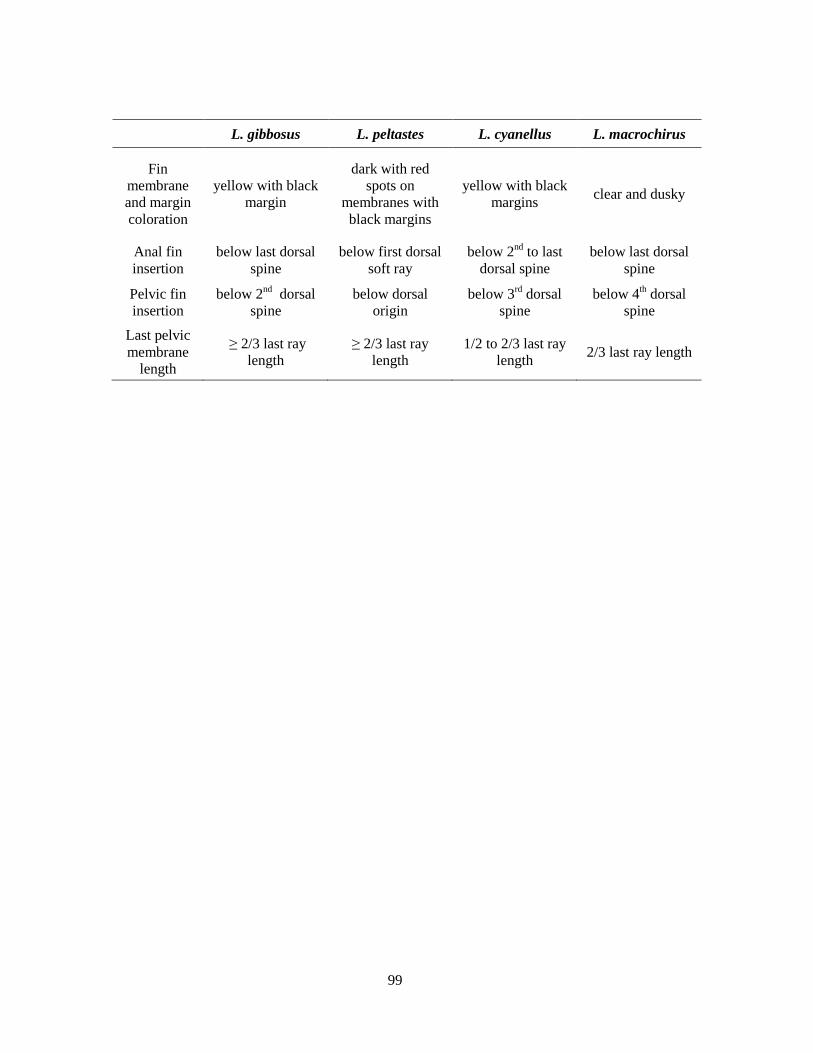
99
L. gibbosus L. peltastes L. cyanellus L. macrochirus
Fin
membrane
and margin
coloration
yellow with black
margin
dark with red
spots on
membranes with
black margins
yellow with black
margins clear and dusky
Anal fin
insertion
below last dorsal
spine
below first dorsal
soft ray
below 2nd
to last
dorsal spine
below last dorsal
spine
Pelvic fin
insertion
below 2nd
dorsal
spine
below dorsal
origin
below 3rd
dorsal
spine
below 4th dorsal
spine
Last pelvic
membrane
length
≥ 2/3 last ray
length
≥ 2/3 last ray
length
1/2 to 2/3 last ray
length 2/3 last ray length
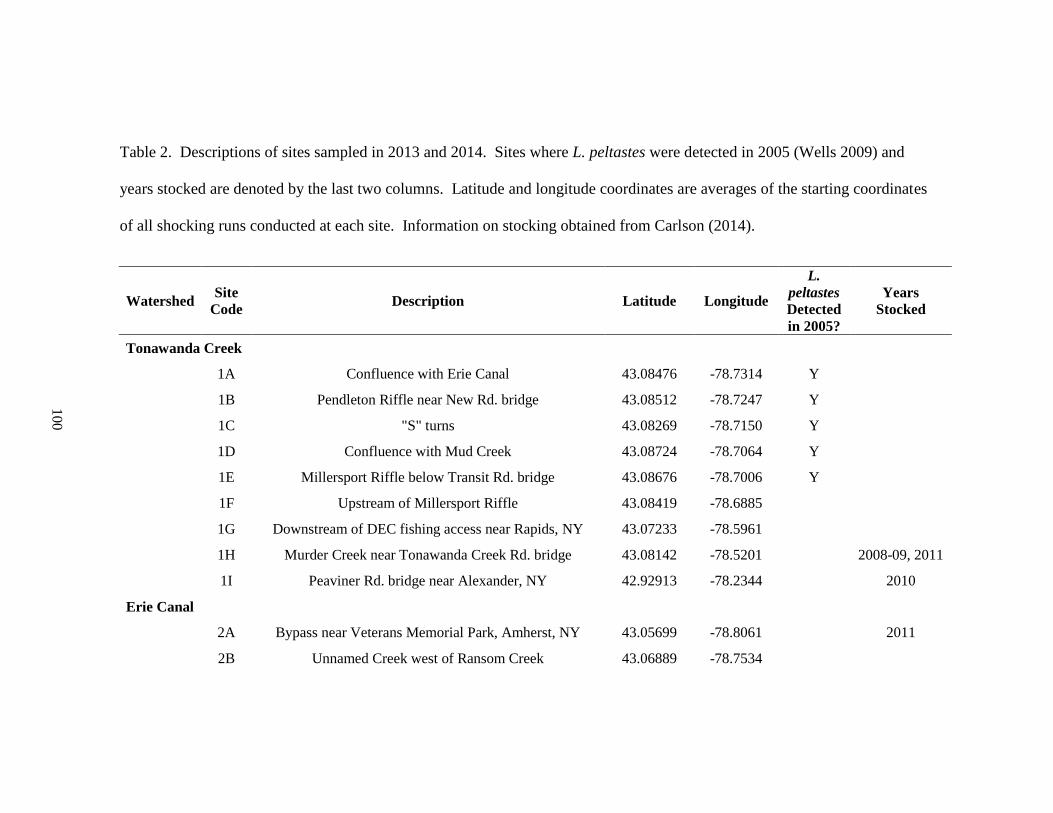
100
Table 2. Descriptions of sites sampled in 2013 and 2014. Sites where L. peltastes were detected in 2005 (Wells 2009) and
years stocked are denoted by the last two columns. Latitude and longitude coordinates are averages of the starting coordinates
of all shocking runs conducted at each site. Information on stocking obtained from Carlson (2014).
Watershed Site
Code Description Latitude Longitude
L.
peltastes
Detected
in 2005?
Years
Stocked
Tonawanda Creek
1A Confluence with Erie Canal 43.08476 -78.7314 Y
1B Pendleton Riffle near New Rd. bridge 43.08512 -78.7247 Y
1C "S" turns 43.08269 -78.7150 Y
1D Confluence with Mud Creek 43.08724 -78.7064 Y
1E Millersport Riffle below Transit Rd. bridge 43.08676 -78.7006 Y
1F Upstream of Millersport Riffle 43.08419 -78.6885
1G Downstream of DEC fishing access near Rapids, NY 43.07233 -78.5961
1H Murder Creek near Tonawanda Creek Rd. bridge 43.08142 -78.5201 2008-09, 2011
1I Peaviner Rd. bridge near Alexander, NY 42.92913 -78.2344 2010
Erie Canal
2A Bypass near Veterans Memorial Park, Amherst, NY 43.05699 -78.8061 2011
2B Unnamed Creek west of Ransom Creek 43.06889 -78.7534
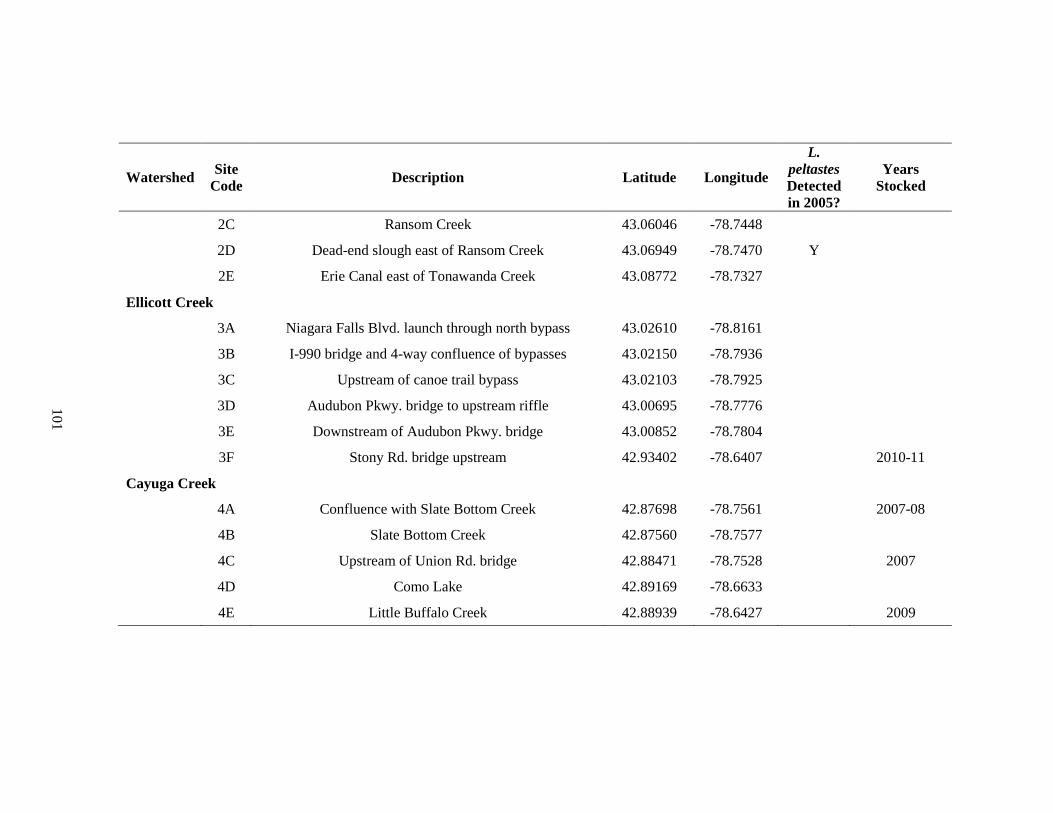
101
Watershed Site
Code Description Latitude Longitude
L.
peltastes
Detected
in 2005?
Years
Stocked
2C Ransom Creek 43.06046 -78.7448
2D Dead-end slough east of Ransom Creek 43.06949 -78.7470 Y
2E Erie Canal east of Tonawanda Creek 43.08772 -78.7327
Ellicott Creek
3A Niagara Falls Blvd. launch through north bypass 43.02610 -78.8161
3B I-990 bridge and 4-way confluence of bypasses 43.02150 -78.7936
3C Upstream of canoe trail bypass 43.02103 -78.7925
3D Audubon Pkwy. bridge to upstream riffle 43.00695 -78.7776
3E Downstream of Audubon Pkwy. bridge 43.00852 -78.7804
3F Stony Rd. bridge upstream 42.93402 -78.6407 2010-11
Cayuga Creek
4A Confluence with Slate Bottom Creek 42.87698 -78.7561 2007-08
4B Slate Bottom Creek 42.87560 -78.7577
4C Upstream of Union Rd. bridge 42.88471 -78.7528 2007
4D Como Lake 42.89169 -78.6633
4E Little Buffalo Creek 42.88939 -78.6427 2009
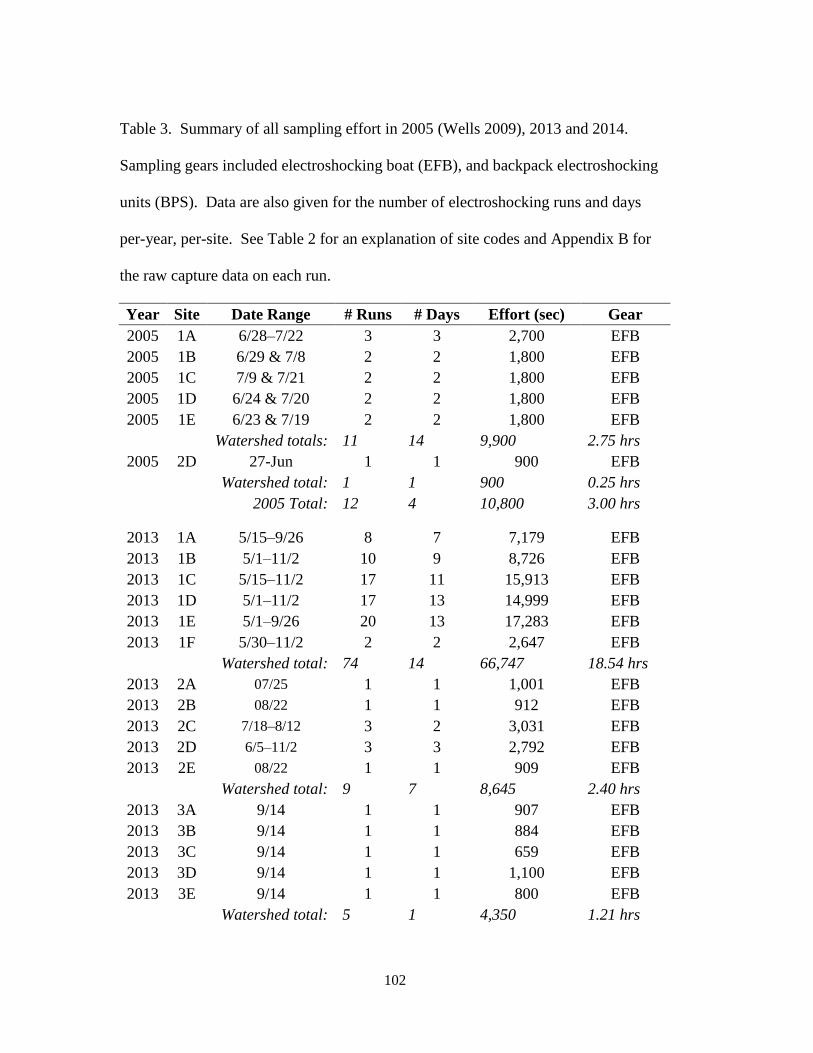
102
Table 3. Summary of all sampling effort in 2005 (Wells 2009), 2013 and 2014.
Sampling gears included electroshocking boat (EFB), and backpack electroshocking
units (BPS). Data are also given for the number of electroshocking runs and days
per-year, per-site. See Table 2 for an explanation of site codes and Appendix B for
the raw capture data on each run.
Year Site Date Range # Runs # Days Effort (sec) Gear
2005 1A 6/28–7/22 3 3 2,700 EFB
2005 1B 6/29 & 7/8 2 2 1,800 EFB
2005 1C 7/9 & 7/21 2 2 1,800 EFB
2005 1D 6/24 & 7/20 2 2 1,800 EFB
2005 1E 6/23 & 7/19 2 2 1,800 EFB
Watershed totals: 11 14 9,900 2.75 hrs
2005 2D 27-Jun 1 1 900 EFB
Watershed total: 1 1 900 0.25 hrs
2005 Total: 12 4 10,800 3.00 hrs
2013 1A 5/15–9/26 8 7 7,179 EFB
2013 1B 5/1–11/2 10 9 8,726 EFB
2013 1C 5/15–11/2 17 11 15,913 EFB
2013 1D 5/1–11/2 17 13 14,999 EFB
2013 1E 5/1–9/26 20 13 17,283 EFB
2013 1F 5/30–11/2 2 2 2,647 EFB
Watershed total: 74 14 66,747 18.54 hrs
2013 2A 07/25 1 1 1,001 EFB
2013 2B 08/22 1 1 912 EFB
2013 2C 7/18–8/12 3 2 3,031 EFB
2013 2D 6/5–11/2 3 3 2,792 EFB
2013 2E 08/22 1 1 909 EFB
Watershed total: 9 7 8,645 2.40 hrs
2013 3A 9/14 1 1 907 EFB
2013 3B 9/14 1 1 884 EFB
2013 3C 9/14 1 1 659 EFB
2013 3D 9/14 1 1 1,100 EFB
2013 3E 9/14 1 1 800 EFB
Watershed total: 5 1 4,350 1.21 hrs
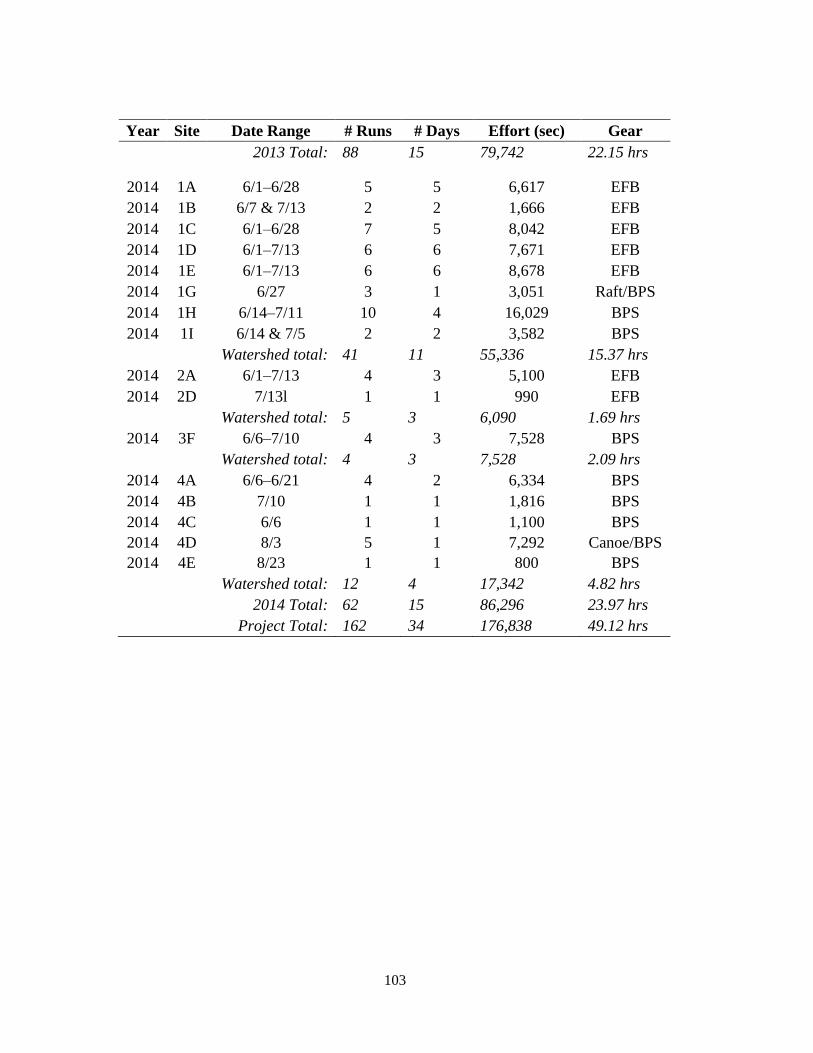
103
Year Site Date Range # Runs # Days Effort (sec) Gear
2013 Total: 88 15 79,742 22.15 hrs
2014 1A 6/1–6/28 5 5 6,617 EFB
2014 1B 6/7 & 7/13 2 2 1,666 EFB
2014 1C 6/1–6/28 7 5 8,042 EFB
2014 1D 6/1–7/13 6 6 7,671 EFB
2014 1E 6/1–7/13 6 6 8,678 EFB
2014 1G 6/27 3 1 3,051 Raft/BPS
2014 1H 6/14–7/11 10 4 16,029 BPS
2014 1I 6/14 & 7/5 2 2 3,582 BPS
Watershed total: 41 11 55,336 15.37 hrs
2014 2A 6/1–7/13 4 3 5,100 EFB
2014 2D 7/13l 1 1 990 EFB
Watershed total: 5 3 6,090 1.69 hrs
2014 3F 6/6–7/10 4 3 7,528 BPS
Watershed total: 4 3 7,528 2.09 hrs
2014 4A 6/6–6/21 4 2 6,334 BPS
2014 4B 7/10 1 1 1,816 BPS
2014 4C 6/6 1 1 1,100 BPS
2014 4D 8/3 5 1 7,292 Canoe/BPS
2014 4E 8/23 1 1 800 BPS
Watershed total: 12 4 17,342 4.82 hrs
2014 Total: 62 15 86,296 23.97 hrs
Project Total: 162 34 176,838 49.12 hrs
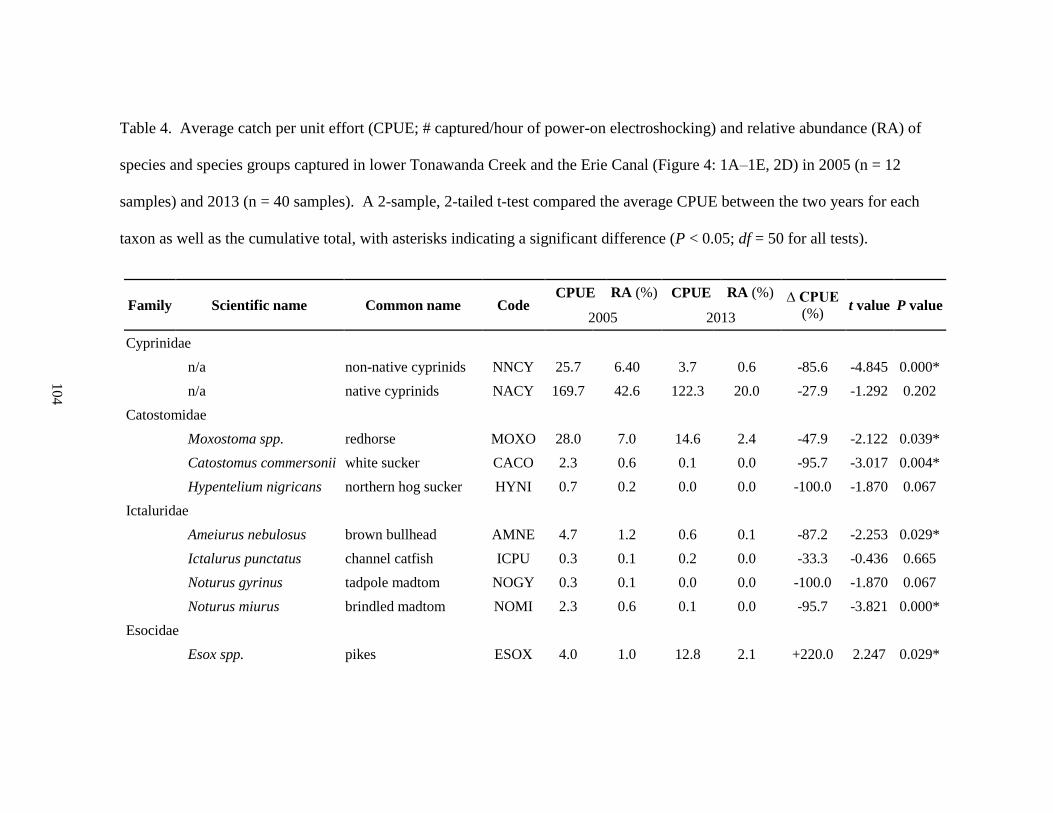
104
Table 4. Average catch per unit effort (CPUE; # captured/hour of power-on electroshocking) and relative abundance (RA) of
species and species groups captured in lower Tonawanda Creek and the Erie Canal (Figure 4: 1A–1E, 2D) in 2005 (n = 12
samples) and 2013 (n = 40 samples). A 2-sample, 2-tailed t-test compared the average CPUE between the two years for each
taxon as well as the cumulative total, with asterisks indicating a significant difference (P < 0.05; df = 50 for all tests).
Family Scientific name Common name Code CPUE RA (%) CPUE RA (%) ∆ CPUE
(%) t value P value
2005 2013
Cyprinidae
n/a non-native cyprinids NNCY 25.7 6.40 3.7 0.6 -85.6 -4.845 0.000*
n/a native cyprinids NACY 169.7 42.6 122.3 20.0 -27.9 -1.292 0.202
Catostomidae
Moxostoma spp. redhorse MOXO 28.0 7.0 14.6 2.4 -47.9 -2.122 0.039*
Catostomus commersonii white sucker CACO 2.3 0.6 0.1 0.0 -95.7 -3.017 0.004*
Hypentelium nigricans northern hog sucker HYNI 0.7 0.2 0.0 0.0 -100.0 -1.870 0.067
Ictaluridae
Ameiurus nebulosus brown bullhead AMNE 4.7 1.2 0.6 0.1 -87.2 -2.253 0.029*
Ictalurus punctatus channel catfish ICPU 0.3 0.1 0.2 0.0 -33.3 -0.436 0.665
Noturus gyrinus tadpole madtom NOGY 0.3 0.1 0.0 0.0 -100.0 -1.870 0.067
Noturus miurus brindled madtom NOMI 2.3 0.6 0.1 0.0 -95.7 -3.821 0.000*
Esocidae
Esox spp. pikes ESOX 4.0 1.0 12.8 2.1 +220.0 2.247 0.029*
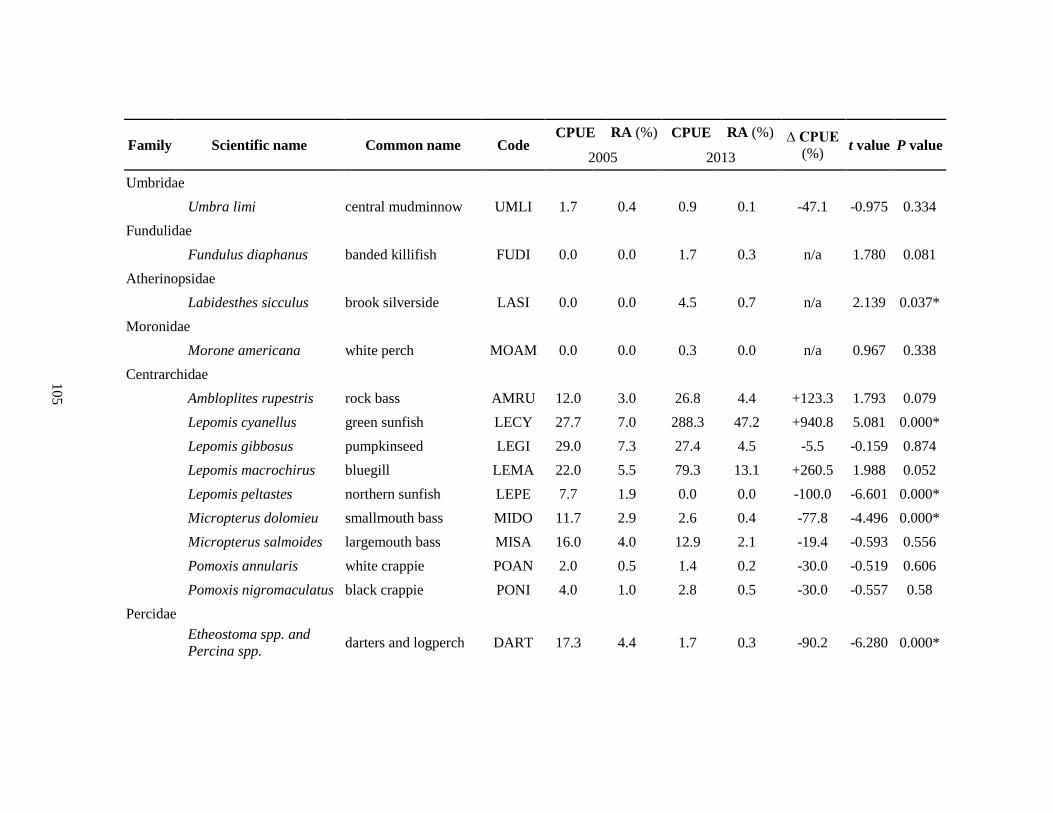
105
Family Scientific name Common name Code CPUE RA (%) CPUE RA (%) ∆ CPUE
(%) t value P value
2005 2013
Umbridae
Umbra limi central mudminnow UMLI 1.7 0.4 0.9 0.1 -47.1 -0.975 0.334
Fundulidae
Fundulus diaphanus banded killifish FUDI 0.0 0.0 1.7 0.3 n/a 1.780 0.081
Atherinopsidae
Labidesthes sicculus brook silverside LASI 0.0 0.0 4.5 0.7 n/a 2.139 0.037*
Moronidae
Morone americana white perch MOAM 0.0 0.0 0.3 0.0 n/a 0.967 0.338
Centrarchidae
Ambloplites rupestris rock bass AMRU 12.0 3.0 26.8 4.4 +123.3 1.793 0.079
Lepomis cyanellus green sunfish LECY 27.7 7.0 288.3 47.2 +940.8 5.081 0.000*
Lepomis gibbosus pumpkinseed LEGI 29.0 7.3 27.4 4.5 -5.5 -0.159 0.874
Lepomis macrochirus bluegill LEMA 22.0 5.5 79.3 13.1 +260.5 1.988 0.052
Lepomis peltastes northern sunfish LEPE 7.7 1.9 0.0 0.0 -100.0 -6.601 0.000*
Micropterus dolomieu smallmouth bass MIDO 11.7 2.9 2.6 0.4 -77.8 -4.496 0.000*
Micropterus salmoides largemouth bass MISA 16.0 4.0 12.9 2.1 -19.4 -0.593 0.556
Pomoxis annularis white crappie POAN 2.0 0.5 1.4 0.2 -30.0 -0.519 0.606
Pomoxis nigromaculatus black crappie PONI 4.0 1.0 2.8 0.5 -30.0 -0.557 0.58
Percidae
Etheostoma spp. and
Percina spp. darters and logperch DART 17.3 4.4 1.7 0.3 -90.2 -6.280 0.000*
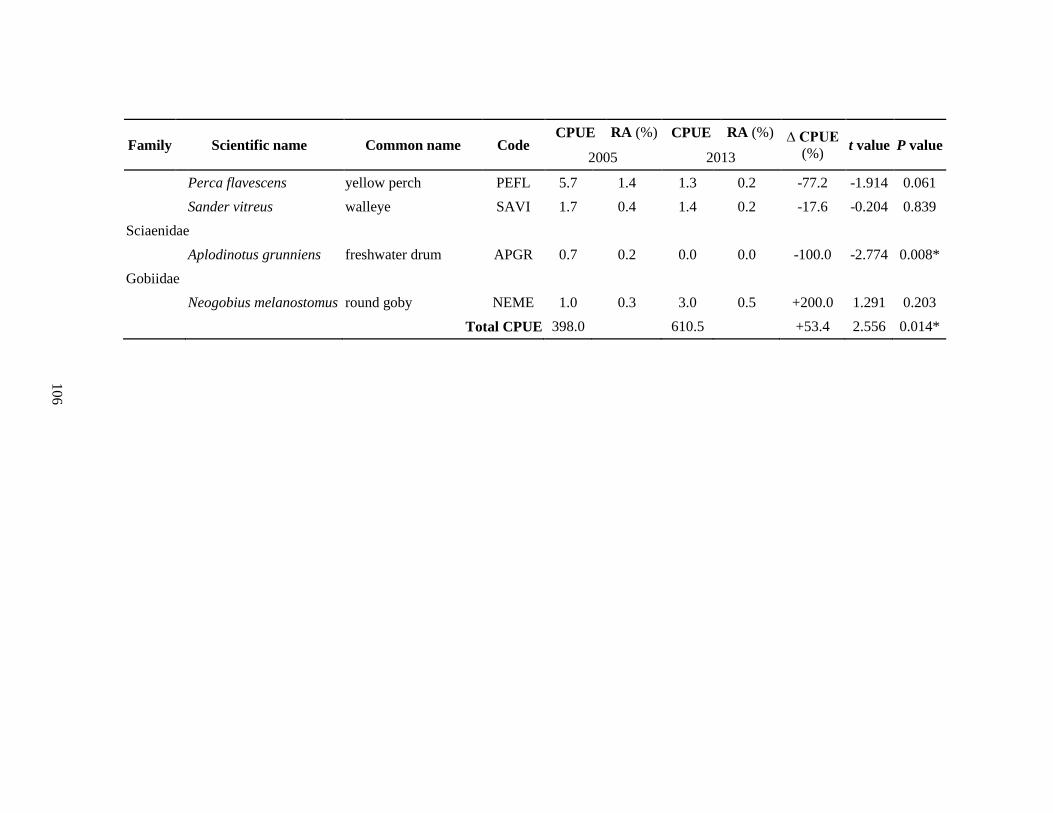
106
Family Scientific name Common name Code CPUE RA (%) CPUE RA (%) ∆ CPUE
(%) t value P value
2005 2013
Perca flavescens yellow perch PEFL 5.7 1.4 1.3 0.2 -77.2 -1.914 0.061
Sander vitreus walleye SAVI 1.7 0.4 1.4 0.2 -17.6 -0.204 0.839
Sciaenidae
Aplodinotus grunniens freshwater drum APGR 0.7 0.2 0.0 0.0 -100.0 -2.774 0.008*
Gobiidae
Neogobius melanostomus round goby NEME 1.0 0.3 3.0 0.5 +200.0 1.291 0.203
Total CPUE 398.0 610.5 +53.4 2.556 0.014*
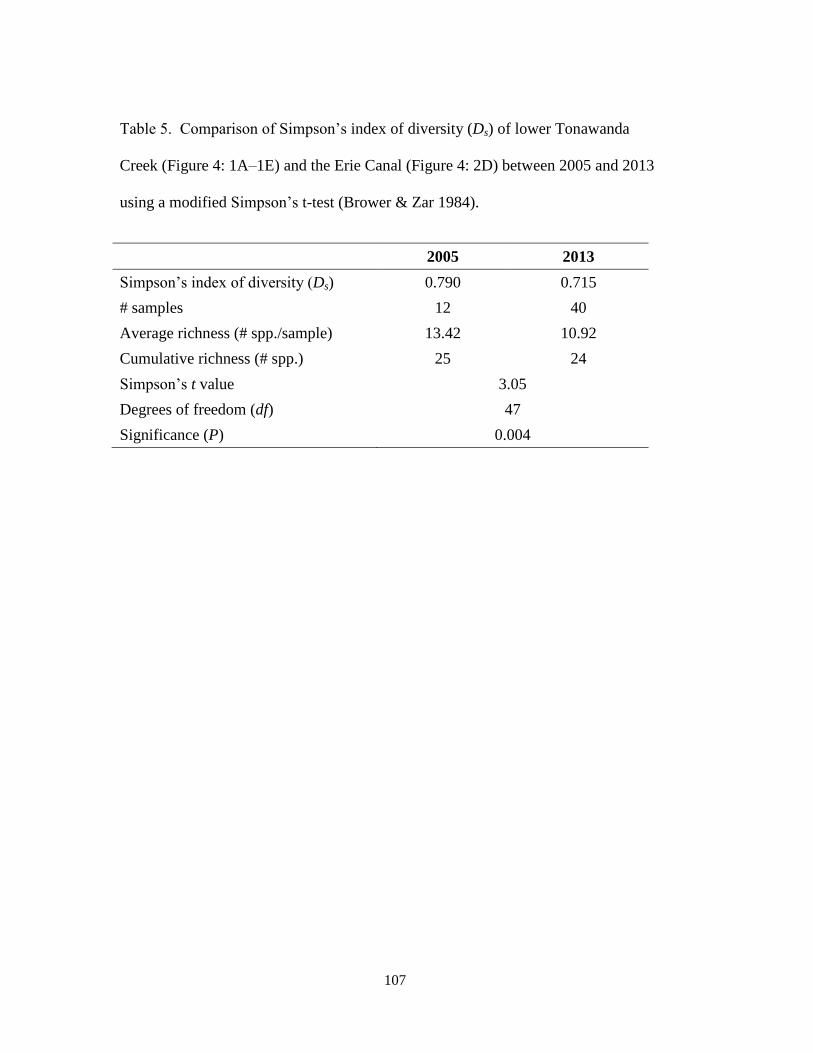
107
Table 5. Comparison of Simpson’s index of diversity (Ds) of lower Tonawanda
Creek (Figure 4: 1A–1E) and the Erie Canal (Figure 4: 2D) between 2005 and 2013
using a modified Simpson’s t-test (Brower & Zar 1984).
2005 2013
Simpson’s index of diversity (Ds) 0.790 0.715
# samples 12 40
Average richness (# spp./sample) 13.42 10.92
Cumulative richness (# spp.) 25 24
Simpson’s t value 3.05
Degrees of freedom (df) 47
Significance (P) 0.004
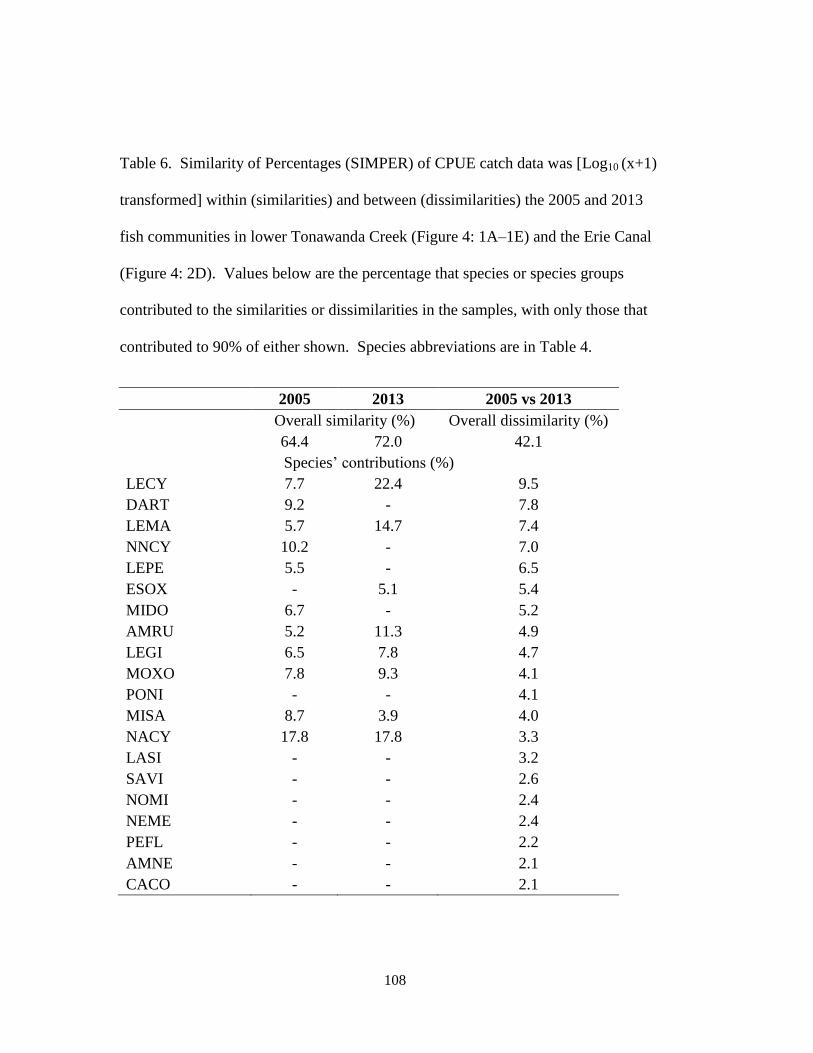
108
Table 6. Similarity of Percentages (SIMPER) of CPUE catch data was [Log10 (x+1)
transformed] within (similarities) and between (dissimilarities) the 2005 and 2013
fish communities in lower Tonawanda Creek (Figure 4: 1A–1E) and the Erie Canal
(Figure 4: 2D). Values below are the percentage that species or species groups
contributed to the similarities or dissimilarities in the samples, with only those that
contributed to 90% of either shown. Species abbreviations are in Table 4.
2005 2013 2005 vs 2013
Overall similarity (%) Overall dissimilarity (%)
64.4 72.0 42.1
Species’ contributions (%)
LECY 7.7 22.4 9.5
DART 9.2 - 7.8
LEMA 5.7 14.7 7.4
NNCY 10.2 - 7.0
LEPE 5.5 - 6.5
ESOX - 5.1 5.4
MIDO 6.7 - 5.2
AMRU 5.2 11.3 4.9
LEGI 6.5 7.8 4.7
MOXO 7.8 9.3 4.1
PONI - - 4.1
MISA 8.7 3.9 4.0
NACY 17.8 17.8 3.3
LASI - - 3.2
SAVI - - 2.6
NOMI - - 2.4
NEME - - 2.4
PEFL - - 2.2
AMNE - - 2.1
CACO - - 2.1
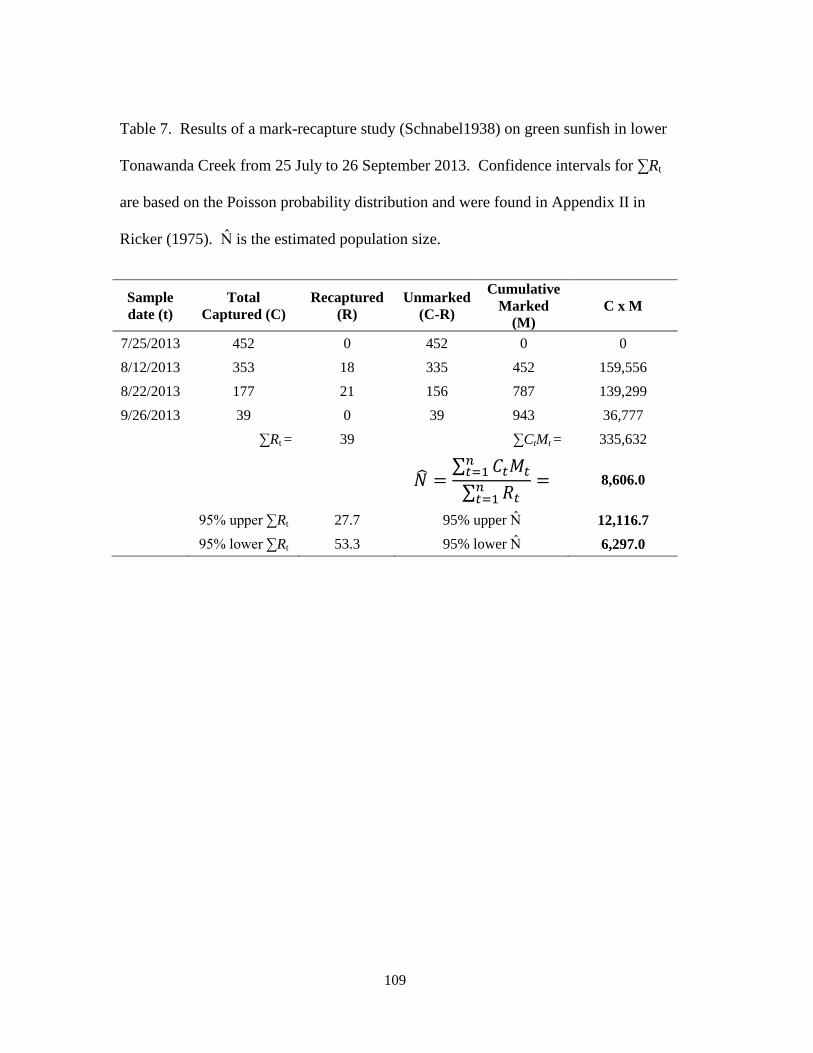
109
Table 7. Results of a mark-recapture study (Schnabel1938) on green sunfish in lower
Tonawanda Creek from 25 July to 26 September 2013. Confidence intervals for ∑Rt
are based on the Poisson probability distribution and were found in Appendix II in
Ricker (1975). N̂ is the estimated population size.
Sample
date (t)
Total
Captured (C)
Recaptured
(R)
Unmarked
(C-R)
Cumulative
Marked
(M)
C x M
7/25/2013 452 0 452 0 0
8/12/2013 353 18 335 452 159,556
8/22/2013 177 21 156 787 139,299
9/26/2013 39 0 39 943 36,777
∑Rt = 39
∑CtMt = 335,632
�̂� =∑ 𝐶𝑡𝑀𝑡
𝑛𝑡=1
∑ 𝑅𝑡𝑛𝑡=1
= 8,606.0
95% upper ∑Rt 27.7 95% upper N̂ 12,116.7
95% lower ∑Rt 53.3 95% lower N̂ 6,297.0
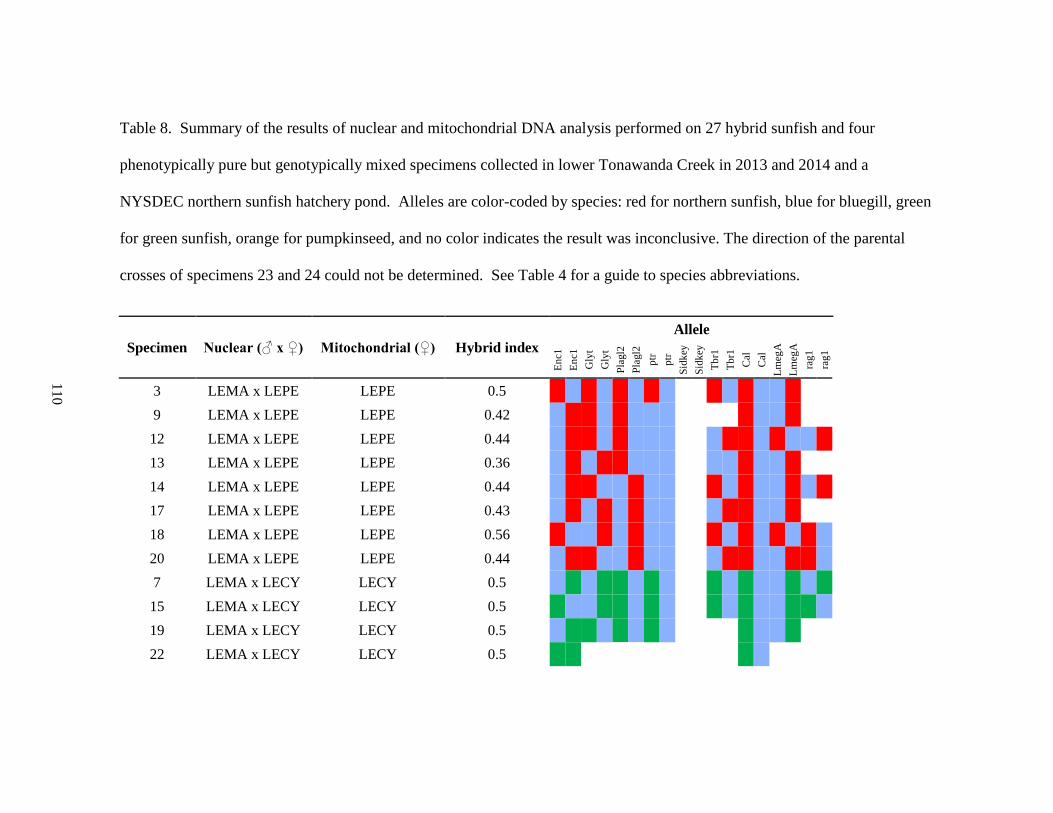
110
Table 8. Summary of the results of nuclear and mitochondrial DNA analysis performed on 27 hybrid sunfish and four
phenotypically pure but genotypically mixed specimens collected in lower Tonawanda Creek in 2013 and 2014 and a
NYSDEC northern sunfish hatchery pond. Alleles are color-coded by species: red for northern sunfish, blue for bluegill, green
for green sunfish, orange for pumpkinseed, and no color indicates the result was inconclusive. The direction of the parental
crosses of specimens 23 and 24 could not be determined. See Table 4 for a guide to species abbreviations.
Specimen Nuclear (♂ x ♀) Mitochondrial (♀) Hybrid index
Allele
En
c1
En
c1
Gly
t
Gly
t
Pla
gl2
Pla
gl2
ptr
ptr
Sid
key
Sid
key
Tb
r1
Tb
r1
Cal
Cal
Lm
egA
Lm
egA
rag1
rag1
3 LEMA x LEPE LEPE 0.5
9 LEMA x LEPE LEPE 0.42
12 LEMA x LEPE LEPE 0.44
13 LEMA x LEPE LEPE 0.36
14 LEMA x LEPE LEPE 0.44
17 LEMA x LEPE LEPE 0.43
18 LEMA x LEPE LEPE 0.56
20 LEMA x LEPE LEPE 0.44
7 LEMA x LECY LECY 0.5
15 LEMA x LECY LECY 0.5
19 LEMA x LECY LECY 0.5
22 LEMA x LECY LECY 0.5
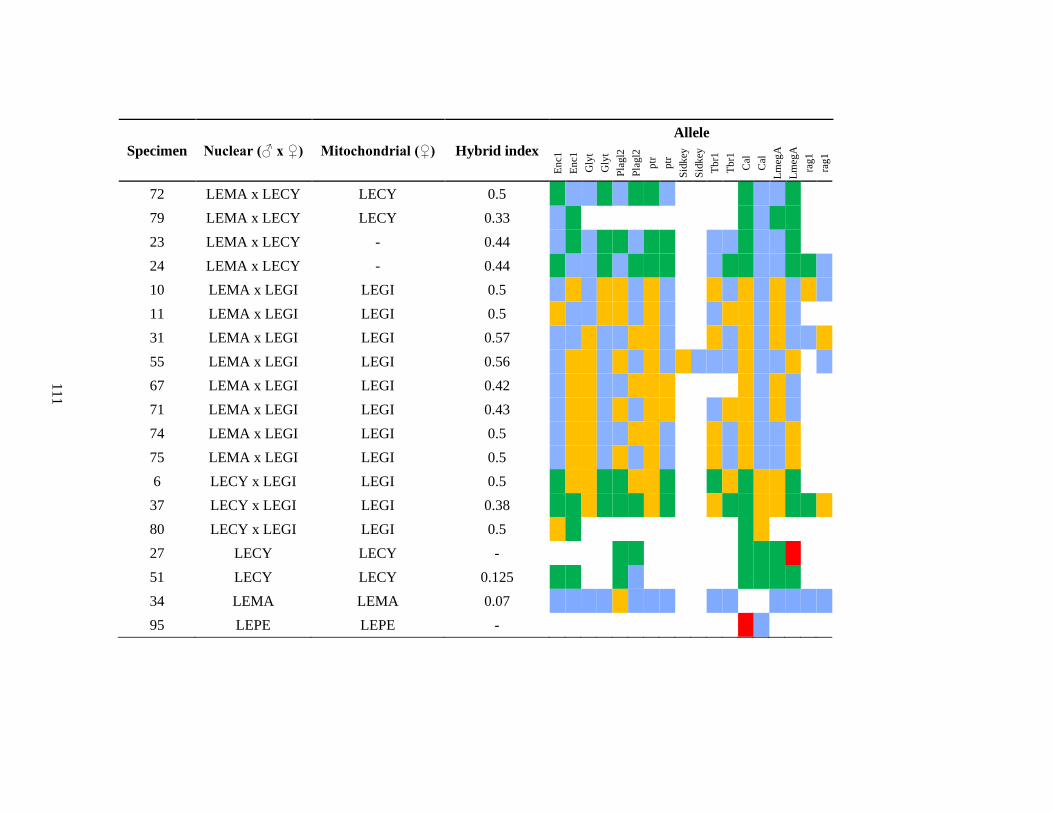
111
Specimen Nuclear (♂ x ♀) Mitochondrial (♀) Hybrid index
Allele
En
c1
En
c1
Gly
t
Gly
t
Pla
gl2
Pla
gl2
ptr
ptr
Sid
key
Sid
key
Tb
r1
Tb
r1
Cal
Cal
Lm
egA
Lm
egA
rag1
rag1
72 LEMA x LECY LECY 0.5
79 LEMA x LECY LECY 0.33
23 LEMA x LECY - 0.44
24 LEMA x LECY - 0.44
10 LEMA x LEGI LEGI 0.5
11 LEMA x LEGI LEGI 0.5
31 LEMA x LEGI LEGI 0.57
55 LEMA x LEGI LEGI 0.56
67 LEMA x LEGI LEGI 0.42
71 LEMA x LEGI LEGI 0.43
74 LEMA x LEGI LEGI 0.5
75 LEMA x LEGI LEGI 0.5
6 LECY x LEGI LEGI 0.5
37 LECY x LEGI LEGI 0.38
80 LECY x LEGI LEGI 0.5
27 LECY LECY -
51 LECY LECY 0.125
34 LEMA LEMA 0.07
95 LEPE LEPE -
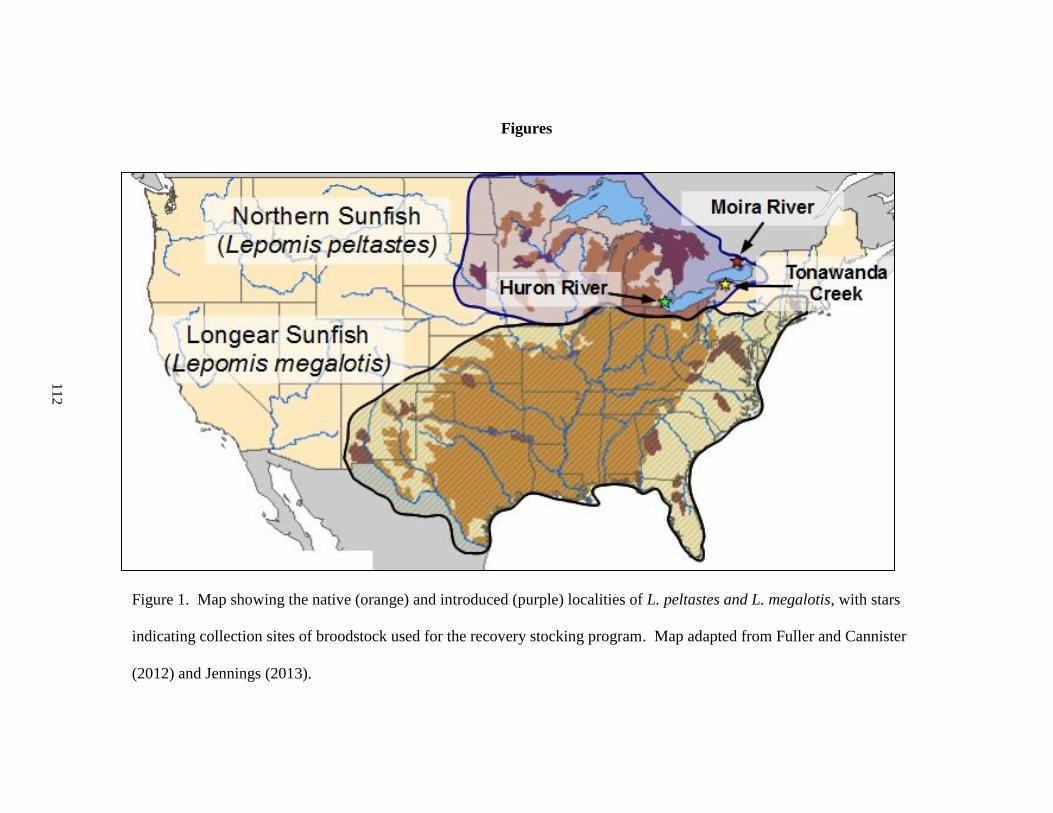
112
Figures
Figure 1. Map showing the native (orange) and introduced (purple) localities of L. peltastes and L. megalotis, with stars
indicating collection sites of broodstock used for the recovery stocking program. Map adapted from Fuller and Cannister
(2012) and Jennings (2013).
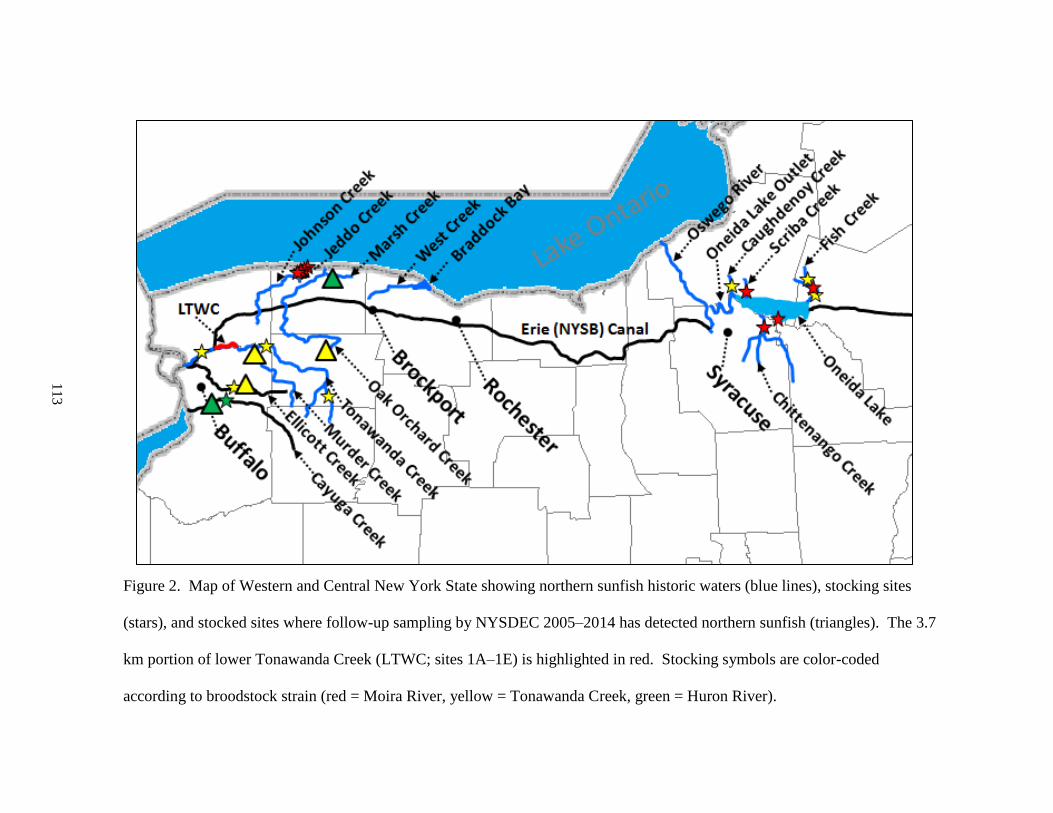
113
Figure 2. Map of Western and Central New York State showing northern sunfish historic waters (blue lines), stocking sites
(stars), and stocked sites where follow-up sampling by NYSDEC 2005–2014 has detected northern sunfish (triangles). The 3.7
km portion of lower Tonawanda Creek (LTWC; sites 1A–1E) is highlighted in red. Stocking symbols are color-coded
according to broodstock strain (red = Moira River, yellow = Tonawanda Creek, green = Huron River).
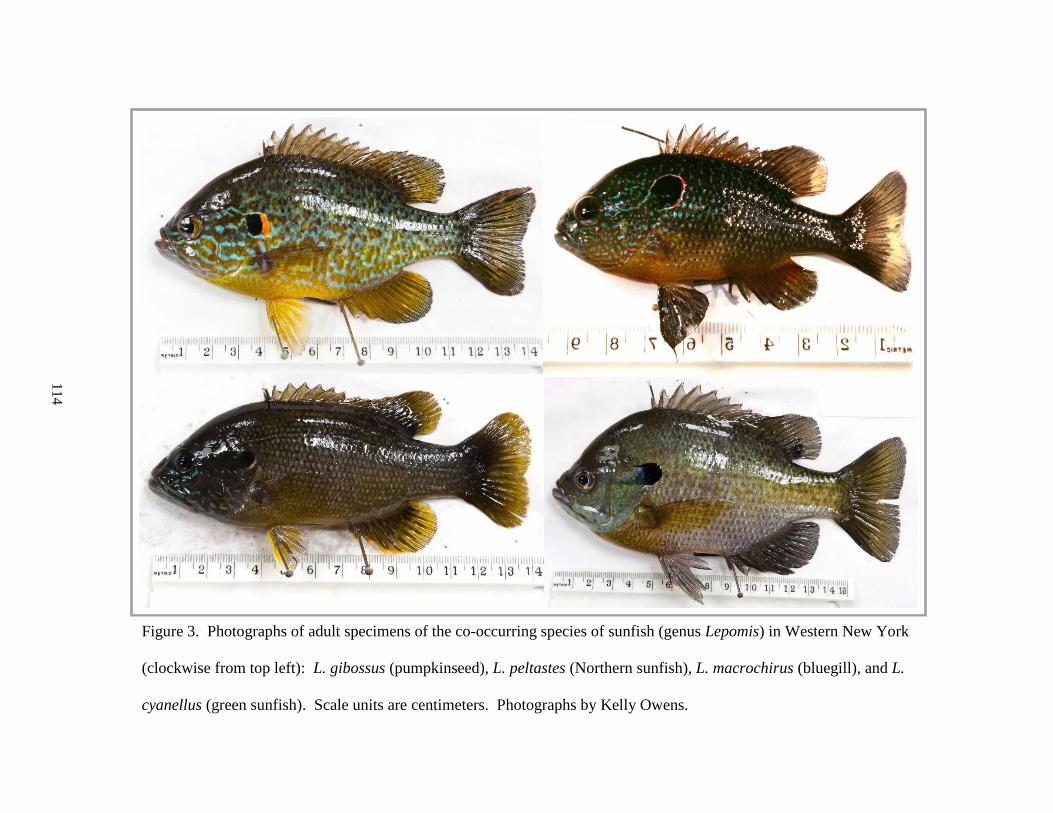
114
Figure 3. Photographs of adult specimens of the co-occurring species of sunfish (genus Lepomis) in Western New York
(clockwise from top left): L. gibossus (pumpkinseed), L. peltastes (Northern sunfish), L. macrochirus (bluegill), and L.
cyanellus (green sunfish). Scale units are centimeters. Photographs by Kelly Owens.
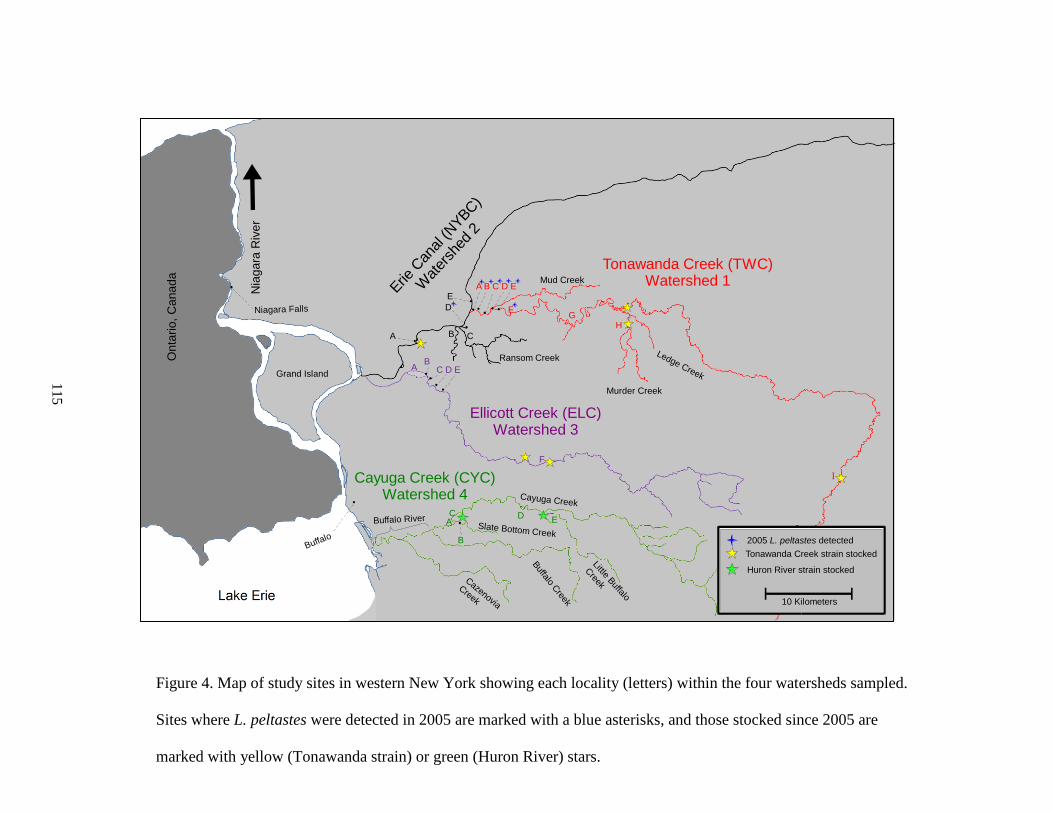
115
Figure 4. Map of study sites in western New York showing each locality (letters) within the four watersheds sampled.
Sites where L. peltastes were detected in 2005 are marked with a blue asterisks, and those stocked since 2005 are
marked with yellow (Tonawanda strain) or green (Huron River) stars.
Erie
Can
al (N
YBC)
Wat
ersh
ed 2
Grand Island
Onta
rio,
Canada
Nia
gara
Riv
er
Tonawanda Creek (TWC) Watershed 1
Ransom Creek
Mud Creek
Murder Creek
A B C D E
GH
Ledge Creek
I
A B C
D
E
Ellicott Creek (ELC) Watershed 3
B
F
C D E A
F
Cayuga Creek (CYC) Watershed 4
Buffalo River
Cazenovia
Creek
Buffalo C
reek
Little Buffalo
Creek
Slate Bottom Creek
Cayuga Creek
A
B
C DE
Buffalo
Niagara Falls
10 Kilometers
2005 L. peltastes detected
Huron River strain stocked
Tonawanda Creek strain stocked
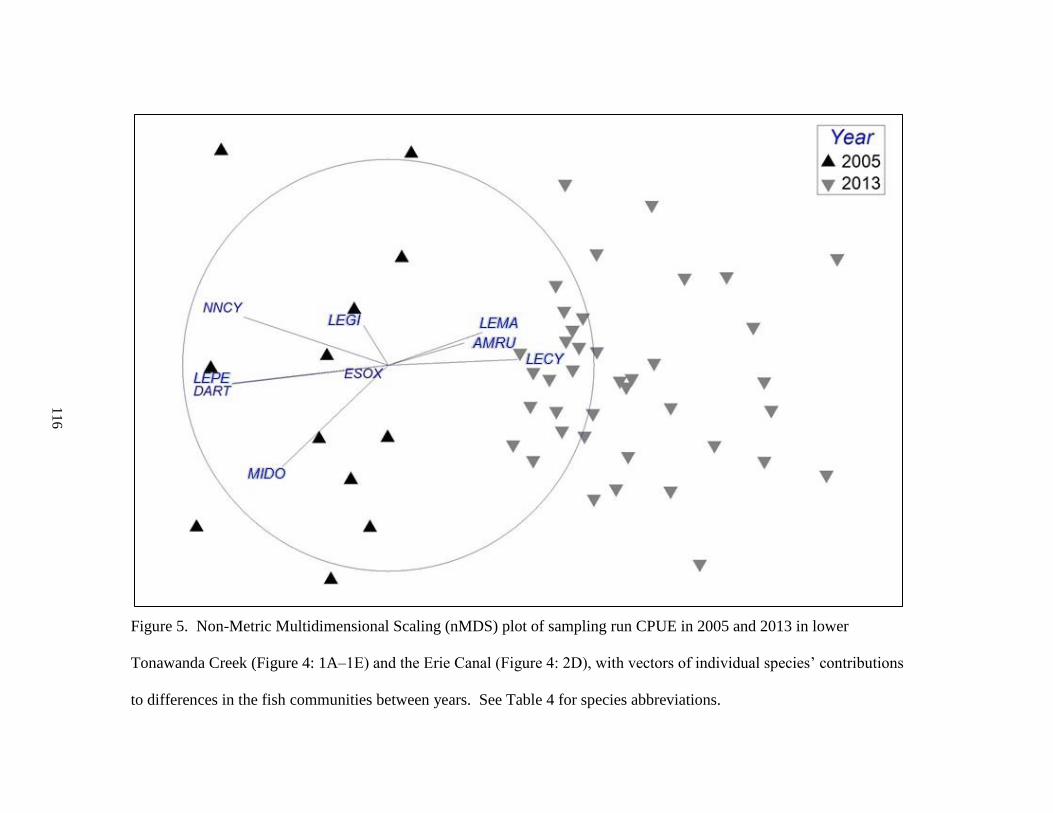
116
Figure 5. Non-Metric Multidimensional Scaling (nMDS) plot of sampling run CPUE in 2005 and 2013 in lower
Tonawanda Creek (Figure 4: 1A–1E) and the Erie Canal (Figure 4: 2D), with vectors of individual species’ contributions
to differences in the fish communities between years. See Table 4 for species abbreviations.
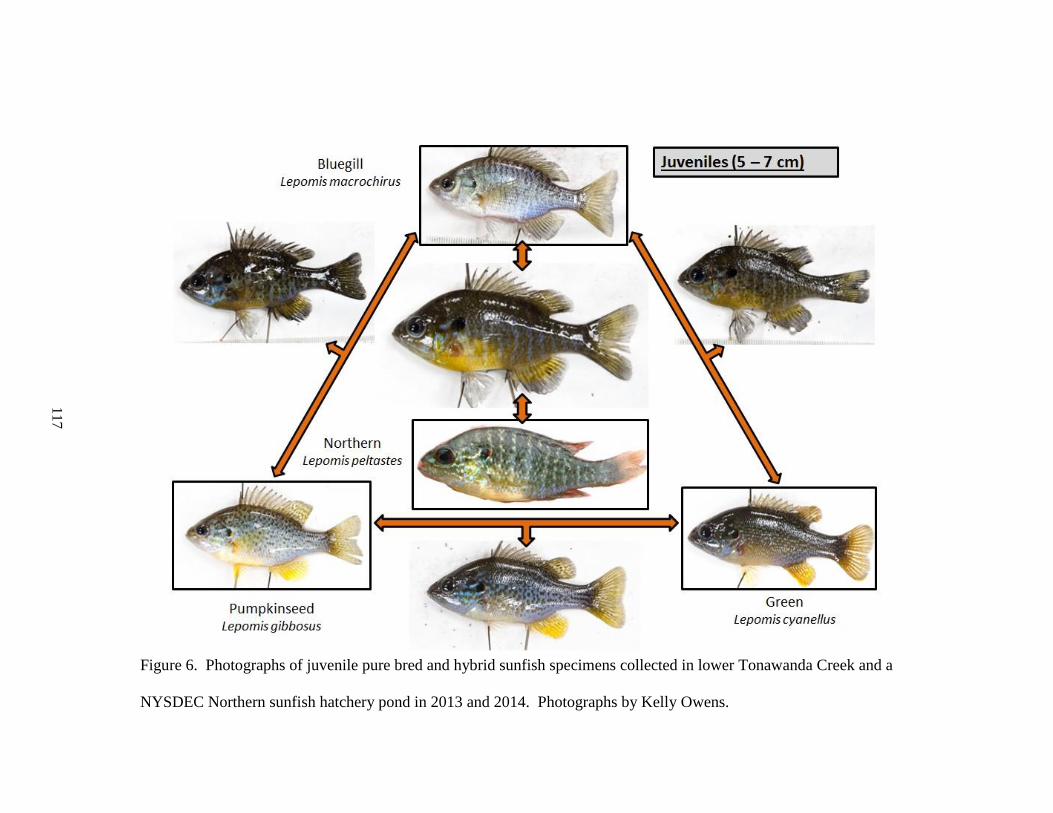
117
Figure 6. Photographs of juvenile pure bred and hybrid sunfish specimens collected in lower Tonawanda Creek and a
NYSDEC Northern sunfish hatchery pond in 2013 and 2014. Photographs by Kelly Owens.
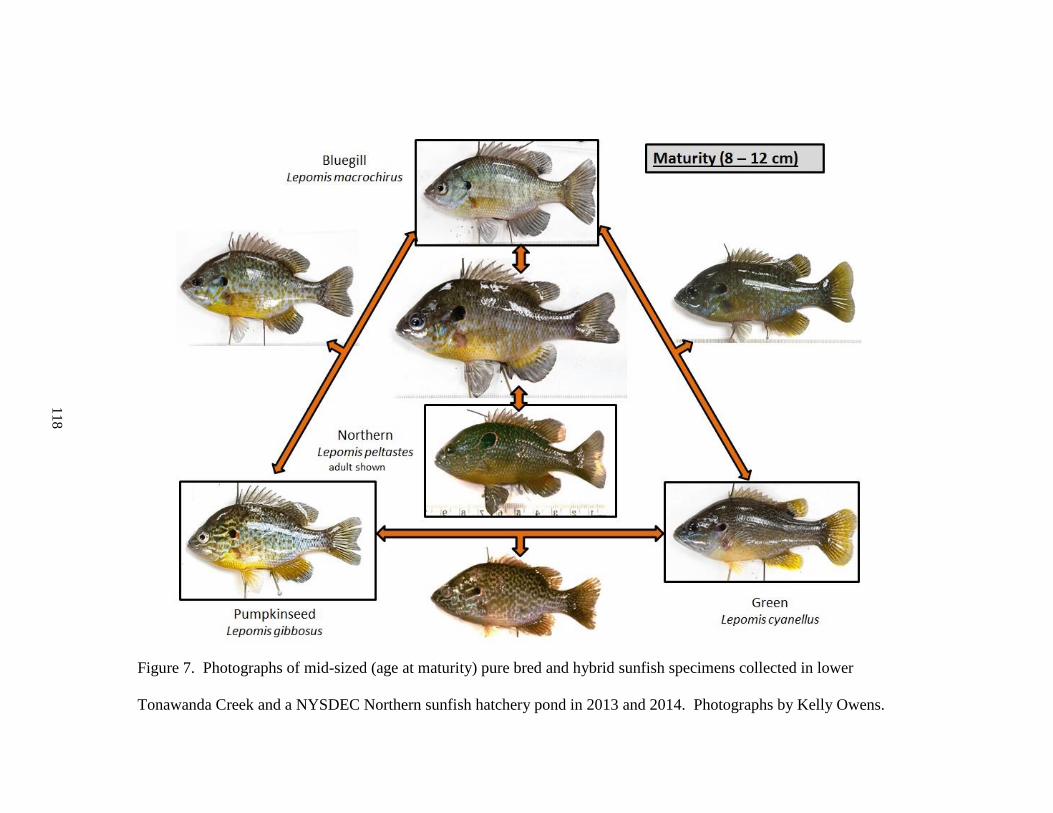
118
Figure 7. Photographs of mid-sized (age at maturity) pure bred and hybrid sunfish specimens collected in lower
Tonawanda Creek and a NYSDEC Northern sunfish hatchery pond in 2013 and 2014. Photographs by Kelly Owens.
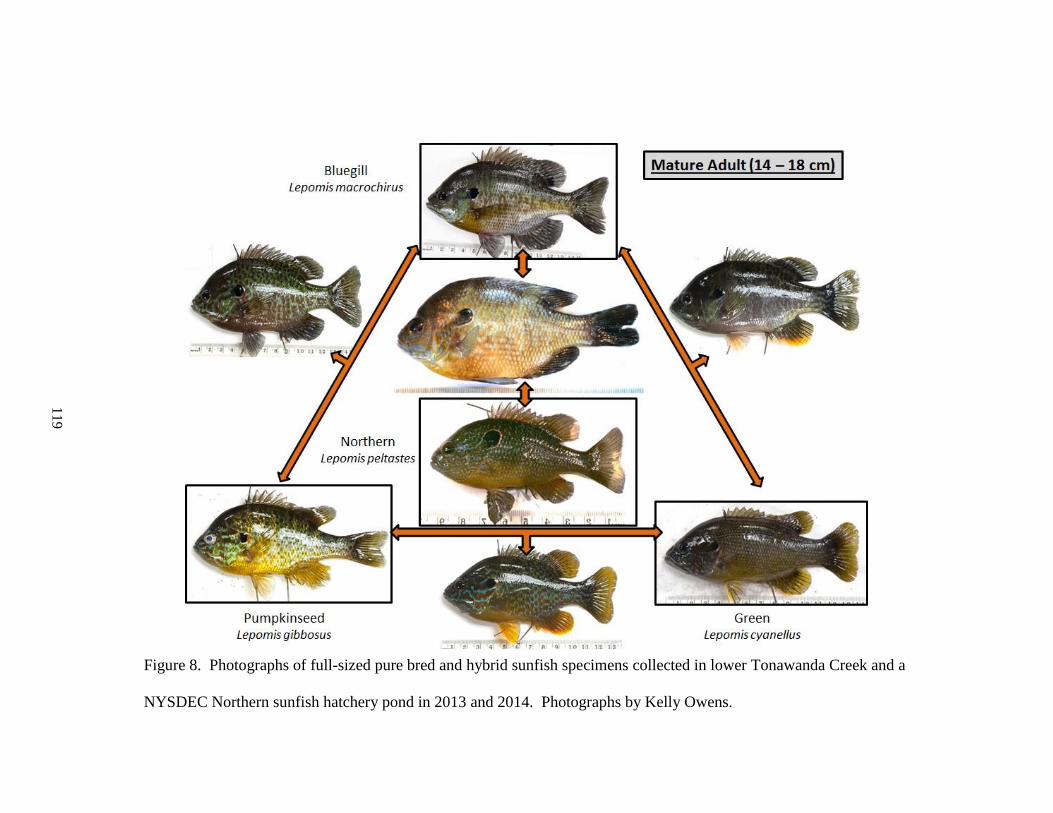
119
Figure 8. Photographs of full-sized pure bred and hybrid sunfish specimens collected in lower Tonawanda Creek and a
NYSDEC Northern sunfish hatchery pond in 2013 and 2014. Photographs by Kelly Owens.
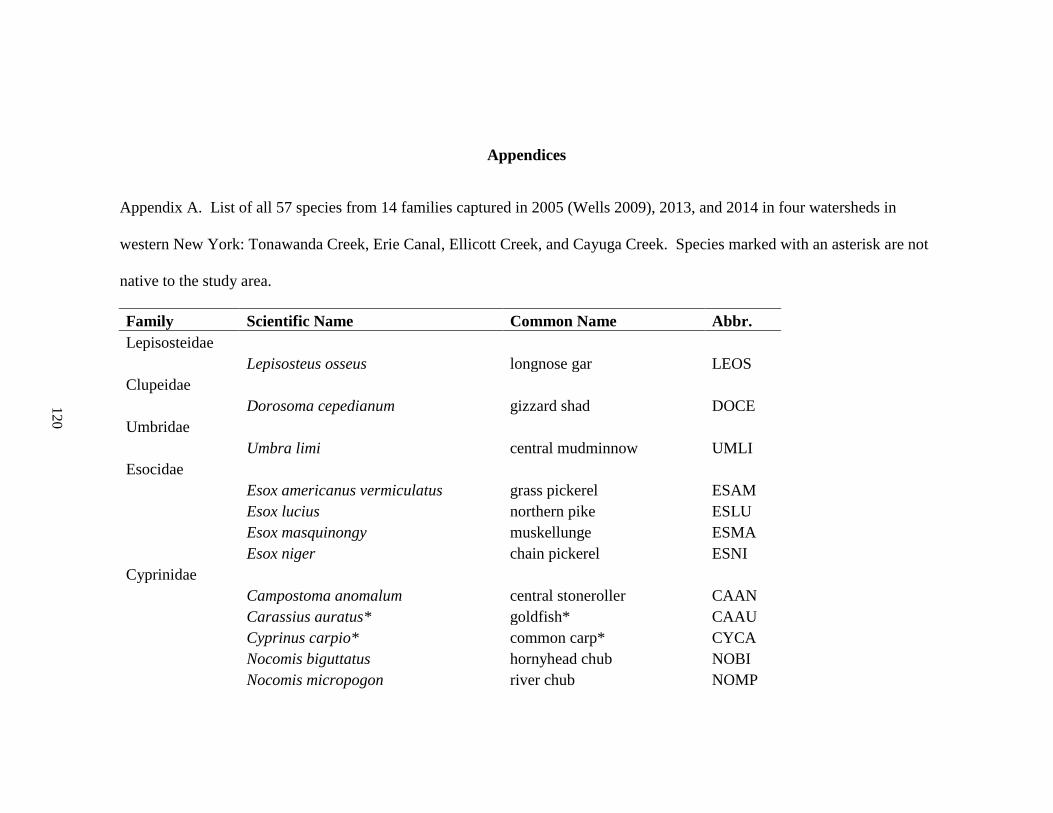
120
Appendices
Appendix A. List of all 57 species from 14 families captured in 2005 (Wells 2009), 2013, and 2014 in four watersheds in
western New York: Tonawanda Creek, Erie Canal, Ellicott Creek, and Cayuga Creek. Species marked with an asterisk are not
native to the study area.
Family Scientific Name Common Name Abbr.
Lepisosteidae
Lepisosteus osseus longnose gar LEOS
Clupeidae
Dorosoma cepedianum gizzard shad DOCE
Umbridae
Umbra limi central mudminnow UMLI
Esocidae
Esox americanus vermiculatus grass pickerel ESAM
Esox lucius northern pike ESLU
Esox masquinongy muskellunge ESMA
Esox niger chain pickerel ESNI
Cyprinidae
Campostoma anomalum central stoneroller CAAN
Carassius auratus* goldfish* CAAU
Cyprinus carpio* common carp* CYCA
Nocomis biguttatus hornyhead chub NOBI
Nocomis micropogon river chub NOMP
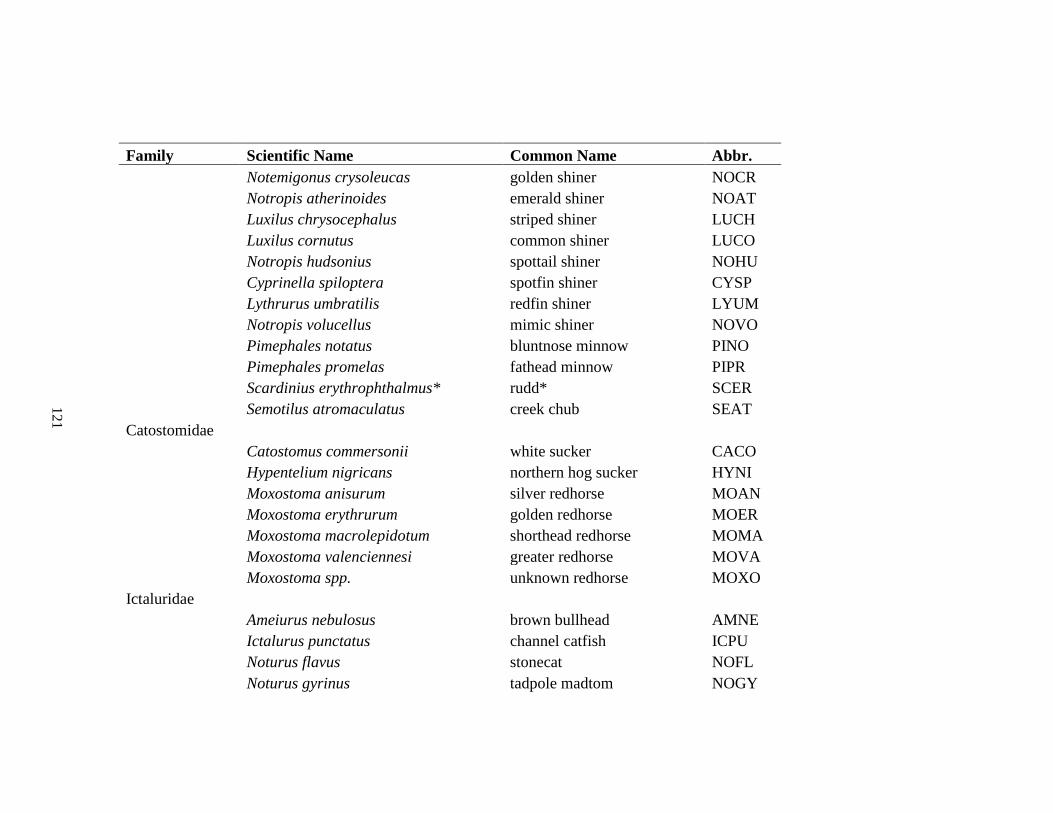
121
Family Scientific Name Common Name Abbr.
Notemigonus crysoleucas golden shiner NOCR
Notropis atherinoides emerald shiner NOAT
Luxilus chrysocephalus striped shiner LUCH
Luxilus cornutus common shiner LUCO
Notropis hudsonius spottail shiner NOHU
Cyprinella spiloptera spotfin shiner CYSP
Lythrurus umbratilis redfin shiner LYUM
Notropis volucellus mimic shiner NOVO
Pimephales notatus bluntnose minnow PINO
Pimephales promelas fathead minnow PIPR
Scardinius erythrophthalmus* rudd* SCER
Semotilus atromaculatus creek chub SEAT
Catostomidae
Catostomus commersonii white sucker CACO
Hypentelium nigricans northern hog sucker HYNI
Moxostoma anisurum silver redhorse MOAN
Moxostoma erythrurum golden redhorse MOER
Moxostoma macrolepidotum shorthead redhorse MOMA
Moxostoma valenciennesi greater redhorse MOVA
Moxostoma spp. unknown redhorse MOXO
Ictaluridae
Ameiurus nebulosus brown bullhead AMNE
Ictalurus punctatus channel catfish ICPU
Noturus flavus stonecat NOFL
Noturus gyrinus tadpole madtom NOGY
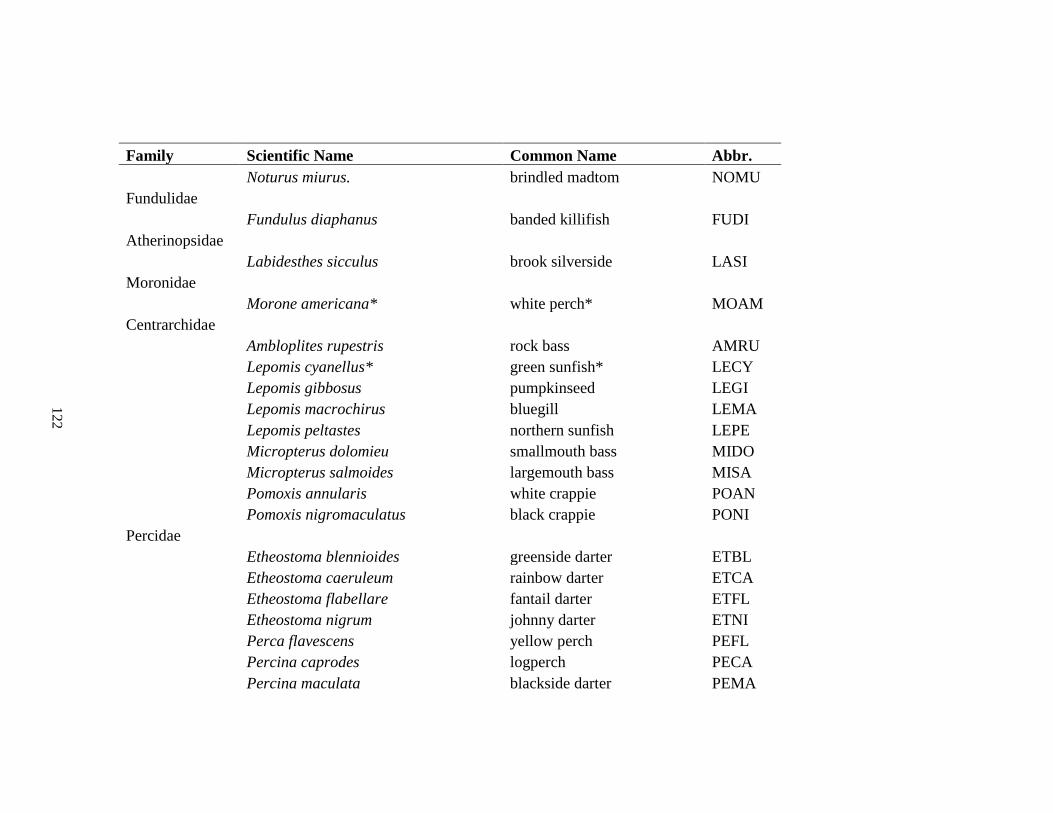
122
Family Scientific Name Common Name Abbr.
Noturus miurus. brindled madtom NOMU
Fundulidae
Fundulus diaphanus banded killifish FUDI
Atherinopsidae
Labidesthes sicculus brook silverside LASI
Moronidae
Morone americana* white perch* MOAM
Centrarchidae
Ambloplites rupestris rock bass AMRU
Lepomis cyanellus* green sunfish* LECY
Lepomis gibbosus pumpkinseed LEGI
Lepomis macrochirus bluegill LEMA
Lepomis peltastes northern sunfish LEPE
Micropterus dolomieu smallmouth bass MIDO
Micropterus salmoides largemouth bass MISA
Pomoxis annularis white crappie POAN
Pomoxis nigromaculatus black crappie PONI
Percidae
Etheostoma blennioides greenside darter ETBL
Etheostoma caeruleum rainbow darter ETCA
Etheostoma flabellare fantail darter ETFL
Etheostoma nigrum johnny darter ETNI
Perca flavescens yellow perch PEFL
Percina caprodes logperch PECA
Percina maculata blackside darter PEMA
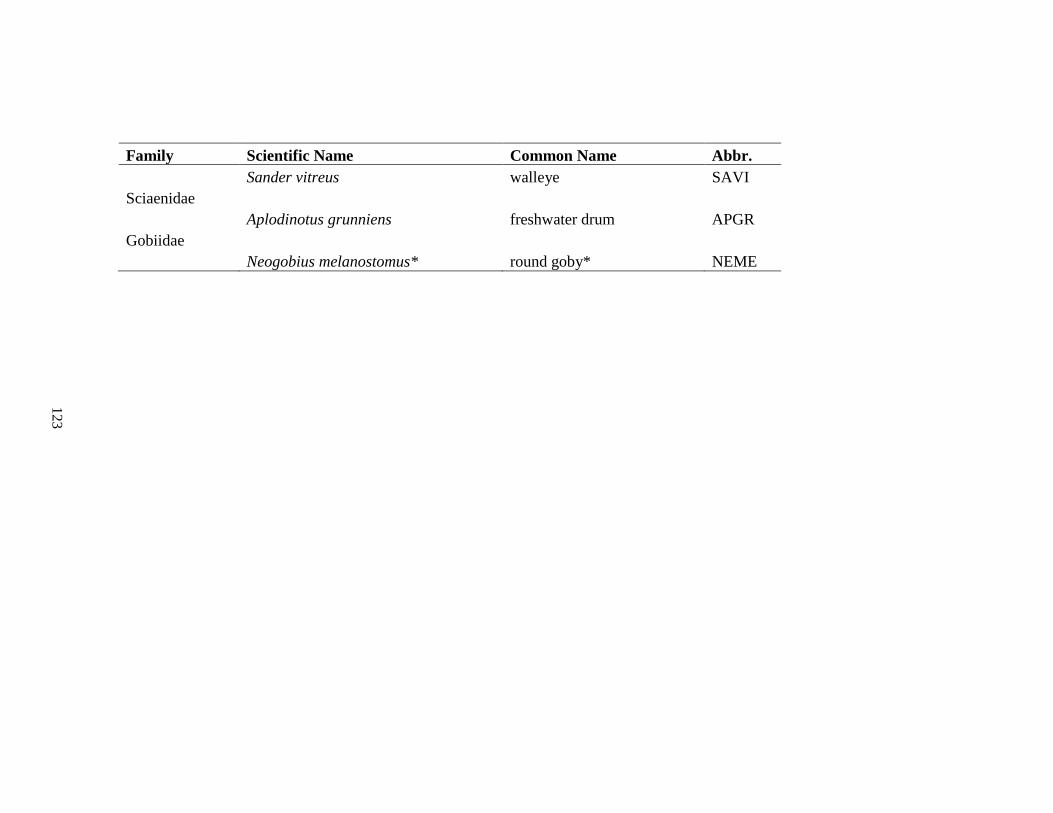
123
Family Scientific Name Common Name Abbr.
Sander vitreus walleye SAVI
Sciaenidae
Aplodinotus grunniens freshwater drum APGR
Gobiidae
Neogobius melanostomus* round goby* NEME
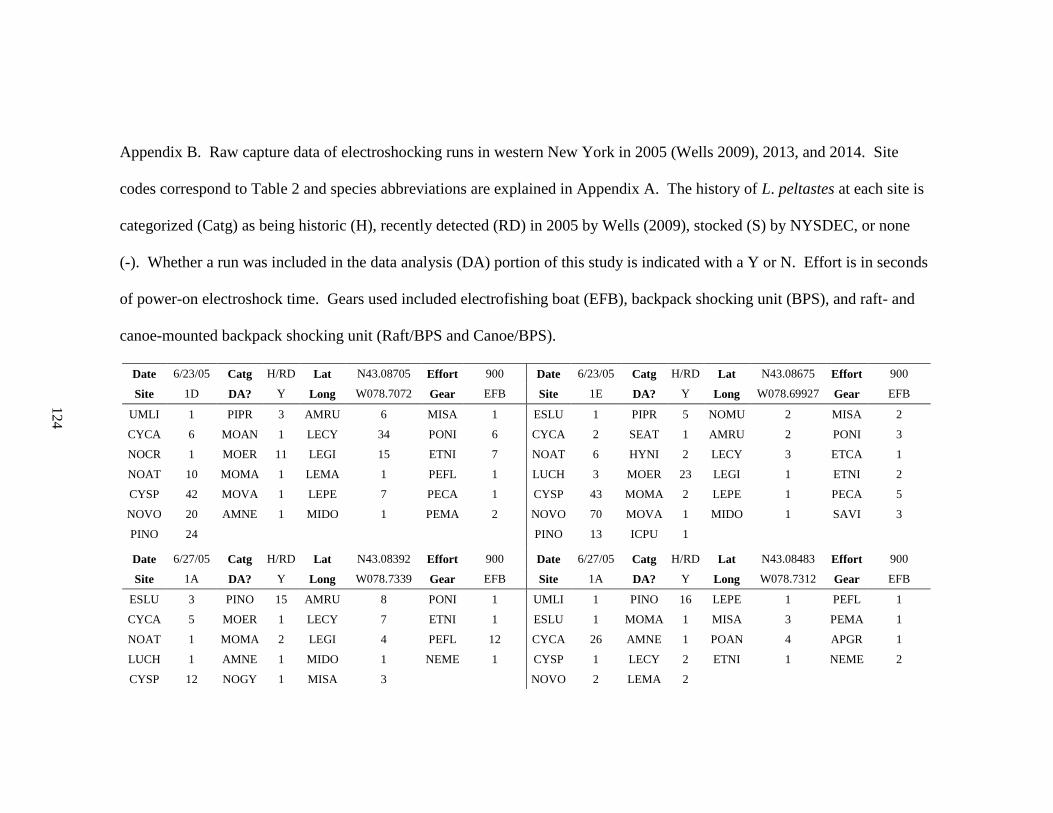
124
Appendix B. Raw capture data of electroshocking runs in western New York in 2005 (Wells 2009), 2013, and 2014. Site
codes correspond to Table 2 and species abbreviations are explained in Appendix A. The history of L. peltastes at each site is
categorized (Catg) as being historic (H), recently detected (RD) in 2005 by Wells (2009), stocked (S) by NYSDEC, or none
(-). Whether a run was included in the data analysis (DA) portion of this study is indicated with a Y or N. Effort is in seconds
of power-on electroshock time. Gears used included electrofishing boat (EFB), backpack shocking unit (BPS), and raft- and
canoe-mounted backpack shocking unit (Raft/BPS and Canoe/BPS).
Date 6/23/05 Catg H/RD Lat N43.08705 Effort 900 Date 6/23/05 Catg H/RD Lat N43.08675 Effort 900
Site 1D DA? Y Long W078.7072 Gear EFB Site 1E DA? Y Long W078.69927 Gear EFB
UMLI 1 PIPR 3 AMRU 6 MISA 1 ESLU 1 PIPR 5 NOMU 2 MISA 2
CYCA 6 MOAN 1 LECY 34 PONI 6 CYCA 2 SEAT 1 AMRU 2 PONI 3
NOCR 1 MOER 11 LEGI 15 ETNI 7 NOAT 6 HYNI 2 LECY 3 ETCA 1
NOAT 10 MOMA 1 LEMA 1 PEFL 1 LUCH 3 MOER 23 LEGI 1 ETNI 2
CYSP 42 MOVA 1 LEPE 7 PECA 1 CYSP 43 MOMA 2 LEPE 1 PECA 5
NOVO 20 AMNE 1 MIDO 1 PEMA 2 NOVO 70 MOVA 1 MIDO 1 SAVI 3
PINO 24
PINO 13 ICPU 1
Date 6/27/05 Catg H/RD Lat N43.08392 Effort 900 Date 6/27/05 Catg H/RD Lat N43.08483 Effort 900
Site 1A DA? Y Long W078.7339 Gear EFB Site 1A DA? Y Long W078.7312 Gear EFB
ESLU 3 PINO 15 AMRU 8 PONI 1 UMLI 1 PINO 16 LEPE 1 PEFL 1
CYCA 5 MOER 1 LECY 7 ETNI 1 ESLU 1 MOMA 1 MISA 3 PEMA 1
NOAT 1 MOMA 2 LEGI 4 PEFL 12 CYCA 26 AMNE 1 POAN 4 APGR 1
LUCH 1 AMNE 1 MIDO 1 NEME 1 CYSP 1 LECY 2 ETNI 1 NEME 2
CYSP 12 NOGY 1 MISA 3
NOVO 2 LEMA 2
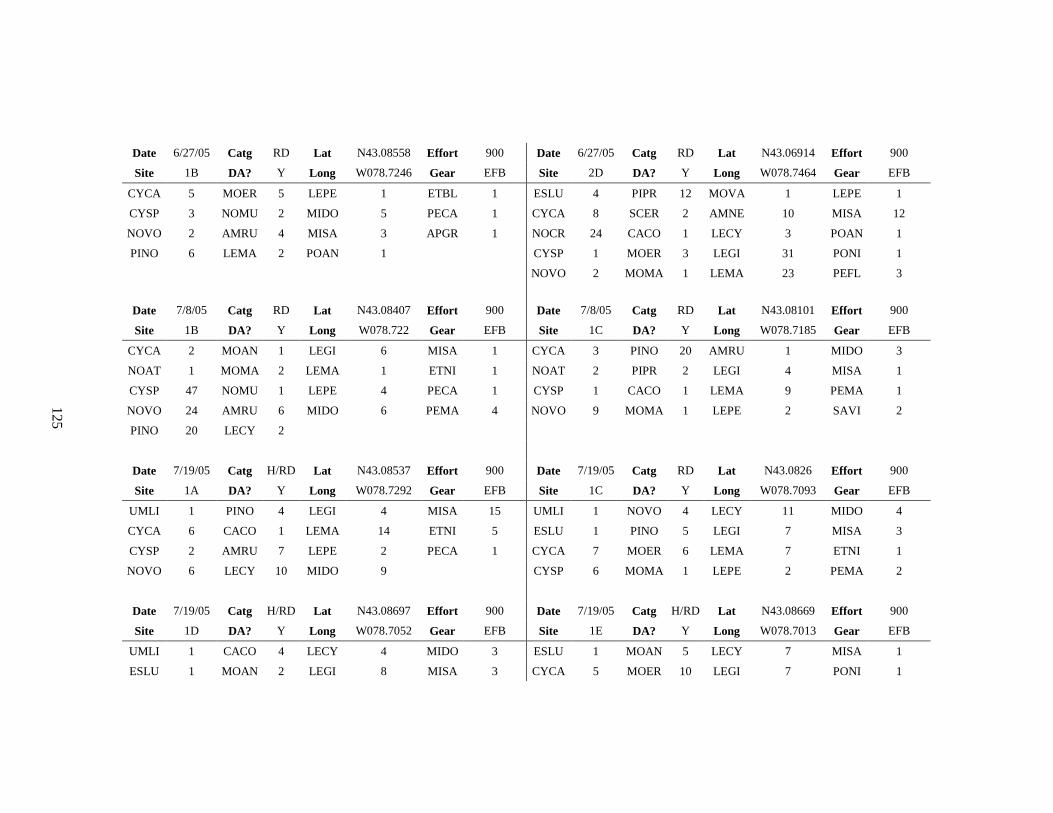
125
Date 6/27/05 Catg RD Lat N43.08558 Effort 900 Date 6/27/05 Catg RD Lat N43.06914 Effort 900
Site 1B DA? Y Long W078.7246 Gear EFB Site 2D DA? Y Long W078.7464 Gear EFB
CYCA 5 MOER 5 LEPE 1 ETBL 1 ESLU 4 PIPR 12 MOVA 1 LEPE 1
CYSP 3 NOMU 2 MIDO 5 PECA 1 CYCA 8 SCER 2 AMNE 10 MISA 12
NOVO 2 AMRU 4 MISA 3 APGR 1 NOCR 24 CACO 1 LECY 3 POAN 1
PINO 6 LEMA 2 POAN 1
CYSP 1 MOER 3 LEGI 31 PONI 1
NOVO 2 MOMA 1 LEMA 23 PEFL 3
Date 7/8/05 Catg RD Lat N43.08407 Effort 900 Date 7/8/05 Catg RD Lat N43.08101 Effort 900
Site 1B DA? Y Long W078.722 Gear EFB Site 1C DA? Y Long W078.7185 Gear EFB
CYCA 2 MOAN 1 LEGI 6 MISA 1 CYCA 3 PINO 20 AMRU 1 MIDO 3
NOAT 1 MOMA 2 LEMA 1 ETNI 1 NOAT 2 PIPR 2 LEGI 4 MISA 1
CYSP 47 NOMU 1 LEPE 4 PECA 1 CYSP 1 CACO 1 LEMA 9 PEMA 1
NOVO 24 AMRU 6 MIDO 6 PEMA 4 NOVO 9 MOMA 1 LEPE 2 SAVI 2
PINO 20 LECY 2
Date 7/19/05 Catg H/RD Lat N43.08537 Effort 900 Date 7/19/05 Catg RD Lat N43.0826 Effort 900
Site 1A DA? Y Long W078.7292 Gear EFB Site 1C DA? Y Long W078.7093 Gear EFB
UMLI 1 PINO 4 LEGI 4 MISA 15 UMLI 1 NOVO 4 LECY 11 MIDO 4
CYCA 6 CACO 1 LEMA 14 ETNI 5 ESLU 1 PINO 5 LEGI 7 MISA 3
CYSP 2 AMRU 7 LEPE 2 PECA 1 CYCA 7 MOER 6 LEMA 7 ETNI 1
NOVO 6 LECY 10 MIDO 9
CYSP 6 MOMA 1 LEPE 2 PEMA 2
Date 7/19/05 Catg H/RD Lat N43.08697 Effort 900 Date 7/19/05 Catg H/RD Lat N43.08669 Effort 900
Site 1D DA? Y Long W078.7052 Gear EFB Site 1E DA? Y Long W078.7013 Gear EFB
UMLI 1 CACO 4 LECY 4 MIDO 3 ESLU 1 MOAN 5 LECY 7 MISA 1
ESLU 1 MOAN 2 LEGI 8 MISA 3 CYCA 5 MOER 10 LEGI 7 PONI 1
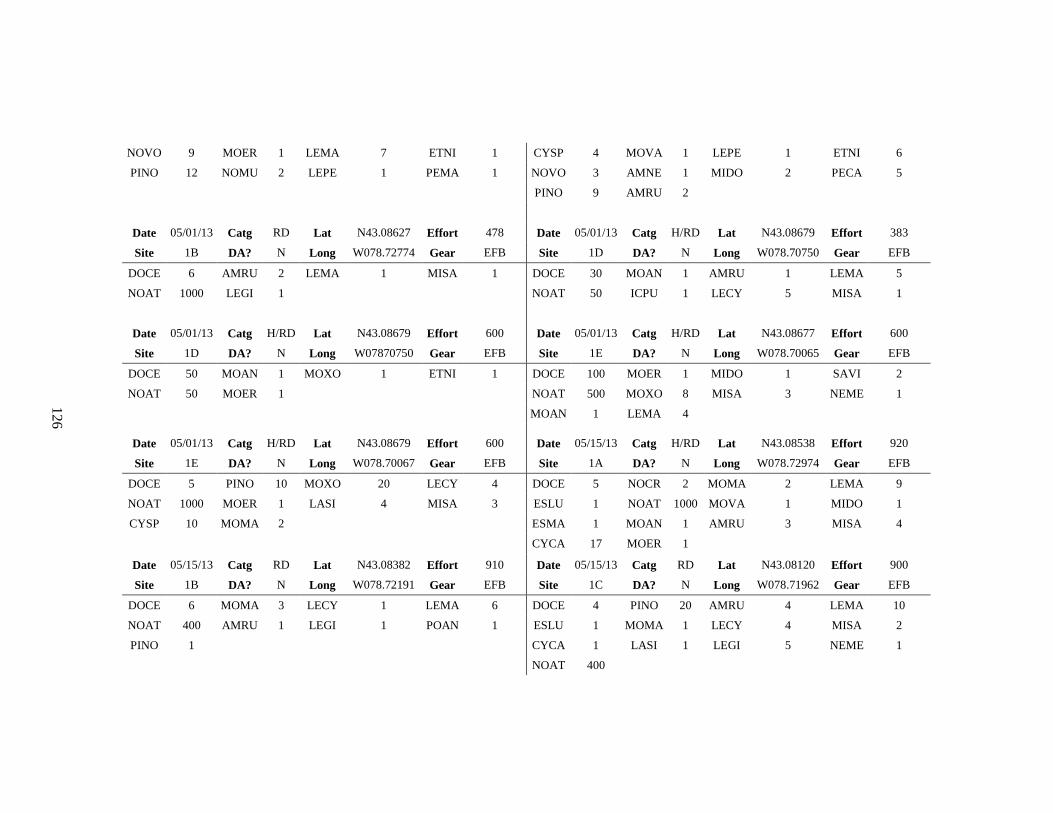
126
NOVO 9 MOER 1 LEMA 7 ETNI 1 CYSP 4 MOVA 1 LEPE 1 ETNI 6
PINO 12 NOMU 2 LEPE 1 PEMA 1 NOVO 3 AMNE 1 MIDO 2 PECA 5
PINO 9 AMRU 2
Date 05/01/13 Catg RD Lat N43.08627 Effort 478 Date 05/01/13 Catg H/RD Lat N43.08679 Effort 383
Site 1B DA? N Long W078.72774 Gear EFB Site 1D DA? N Long W078.70750 Gear EFB
DOCE 6 AMRU 2 LEMA 1 MISA 1 DOCE 30 MOAN 1 AMRU 1 LEMA 5
NOAT 1000 LEGI 1
NOAT 50 ICPU 1 LECY 5 MISA 1
Date 05/01/13 Catg H/RD Lat N43.08679 Effort 600 Date 05/01/13 Catg H/RD Lat N43.08677 Effort 600
Site 1D DA? N Long W07870750 Gear EFB Site 1E DA? N Long W078.70065 Gear EFB
DOCE 50 MOAN 1 MOXO 1 ETNI 1 DOCE 100 MOER 1 MIDO 1 SAVI 2
NOAT 50 MOER 1
NOAT 500 MOXO 8 MISA 3 NEME 1
MOAN 1 LEMA 4
Date 05/01/13 Catg H/RD Lat N43.08679 Effort 600 Date 05/15/13 Catg H/RD Lat N43.08538 Effort 920
Site 1E DA? N Long W078.70067 Gear EFB Site 1A DA? N Long W078.72974 Gear EFB
DOCE 5 PINO 10 MOXO 20 LECY 4 DOCE 5 NOCR 2 MOMA 2 LEMA 9
NOAT 1000 MOER 1 LASI 4 MISA 3 ESLU 1 NOAT 1000 MOVA 1 MIDO 1
CYSP 10 MOMA 2
ESMA 1 MOAN 1 AMRU 3 MISA 4
CYCA 17 MOER 1
Date 05/15/13 Catg RD Lat N43.08382 Effort 910 Date 05/15/13 Catg RD Lat N43.08120 Effort 900
Site 1B DA? N Long W078.72191 Gear EFB Site 1C DA? N Long W078.71962 Gear EFB
DOCE 6 MOMA 3 LECY 1 LEMA 6 DOCE 4 PINO 20 AMRU 4 LEMA 10
NOAT 400 AMRU 1 LEGI 1 POAN 1 ESLU 1 MOMA 1 LECY 4 MISA 2
PINO 1
CYCA 1 LASI 1 LEGI 5 NEME 1
NOAT 400
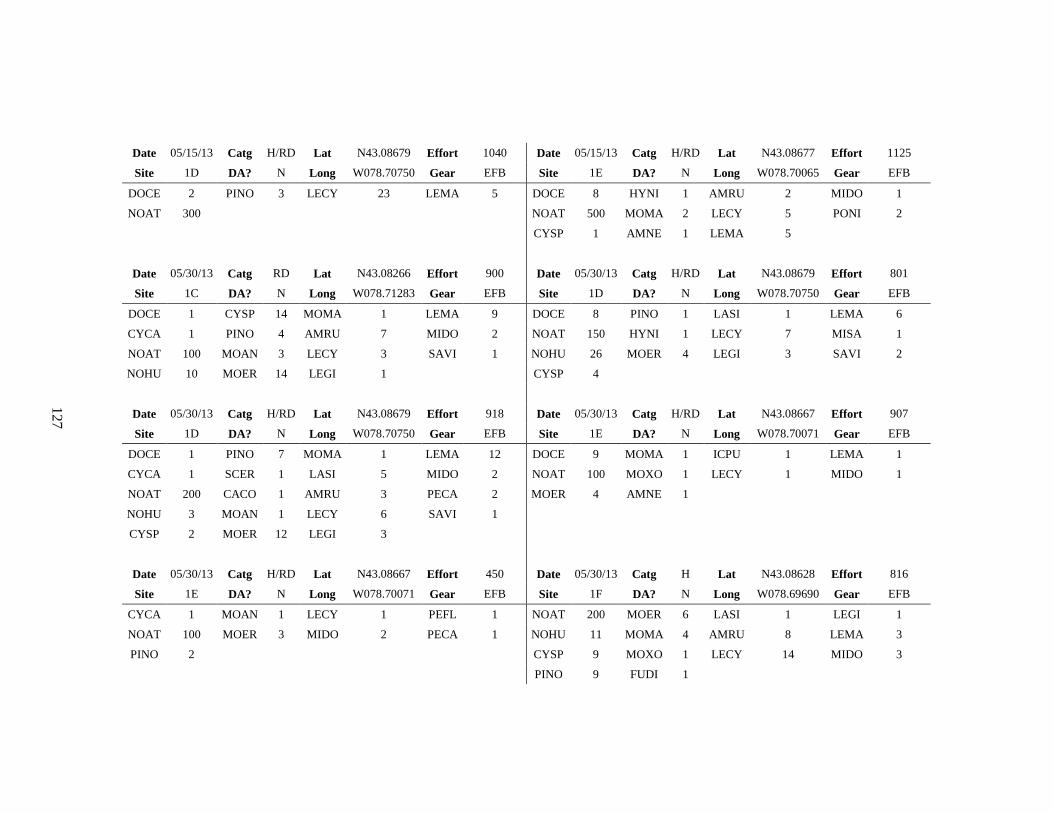
127
Date 05/15/13 Catg H/RD Lat N43.08679 Effort 1040 Date 05/15/13 Catg H/RD Lat N43.08677 Effort 1125
Site 1D DA? N Long W078.70750 Gear EFB Site 1E DA? N Long W078.70065 Gear EFB
DOCE 2 PINO 3 LECY 23 LEMA 5 DOCE 8 HYNI 1 AMRU 2 MIDO 1
NOAT 300
NOAT 500 MOMA 2 LECY 5 PONI 2
CYSP 1 AMNE 1 LEMA 5
Date 05/30/13 Catg RD Lat N43.08266 Effort 900 Date 05/30/13 Catg H/RD Lat N43.08679 Effort 801
Site 1C DA? N Long W078.71283 Gear EFB Site 1D DA? N Long W078.70750 Gear EFB
DOCE 1 CYSP 14 MOMA 1 LEMA 9 DOCE 8 PINO 1 LASI 1 LEMA 6
CYCA 1 PINO 4 AMRU 7 MIDO 2 NOAT 150 HYNI 1 LECY 7 MISA 1
NOAT 100 MOAN 3 LECY 3 SAVI 1 NOHU 26 MOER 4 LEGI 3 SAVI 2
NOHU 10 MOER 14 LEGI 1
CYSP 4
Date 05/30/13 Catg H/RD Lat N43.08679 Effort 918 Date 05/30/13 Catg H/RD Lat N43.08667 Effort 907
Site 1D DA? N Long W078.70750 Gear EFB Site 1E DA? N Long W078.70071 Gear EFB
DOCE 1 PINO 7 MOMA 1 LEMA 12 DOCE 9 MOMA 1 ICPU 1 LEMA 1
CYCA 1 SCER 1 LASI 5 MIDO 2 NOAT 100 MOXO 1 LECY 1 MIDO 1
NOAT 200 CACO 1 AMRU 3 PECA 2 MOER 4 AMNE 1
NOHU 3 MOAN 1 LECY 6 SAVI 1
CYSP 2 MOER 12 LEGI 3
Date 05/30/13 Catg H/RD Lat N43.08667 Effort 450 Date 05/30/13 Catg H Lat N43.08628 Effort 816
Site 1E DA? N Long W078.70071 Gear EFB Site 1F DA? N Long W078.69690 Gear EFB
CYCA 1 MOAN 1 LECY 1 PEFL 1 NOAT 200 MOER 6 LASI 1 LEGI 1
NOAT 100 MOER 3 MIDO 2 PECA 1 NOHU 11 MOMA 4 AMRU 8 LEMA 3
PINO 2
CYSP 9 MOXO 1 LECY 14 MIDO 3
PINO 9 FUDI 1
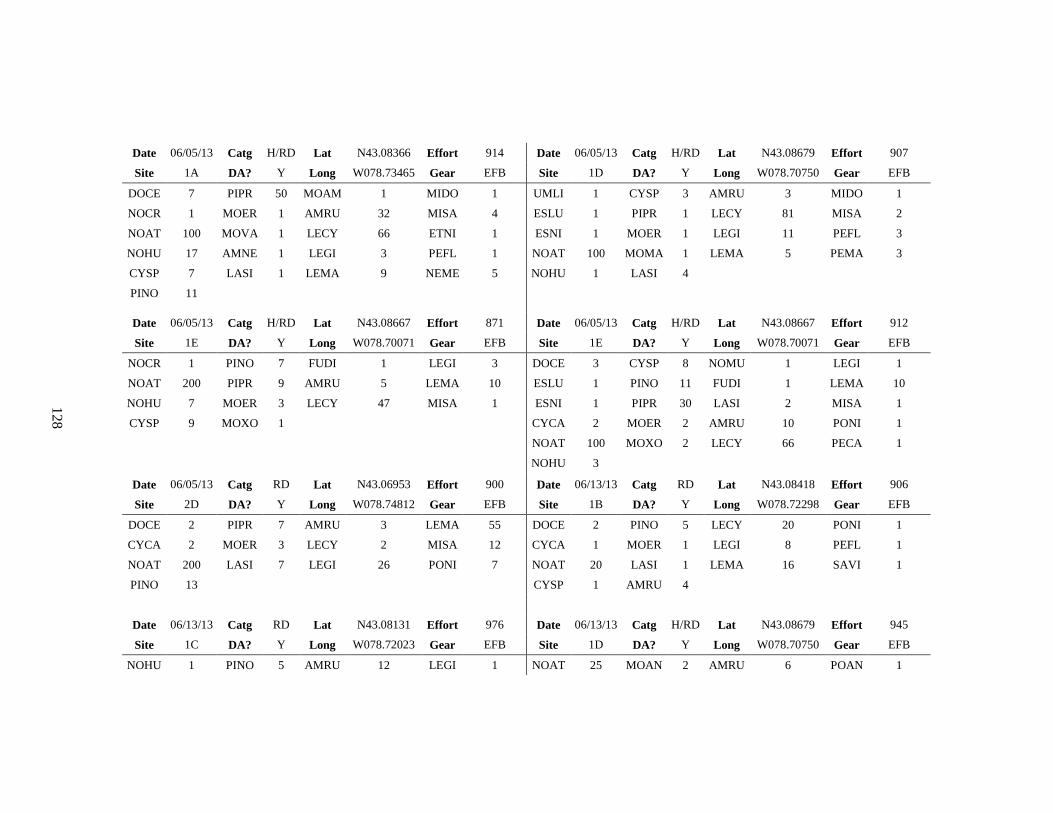
128
Date 06/05/13 Catg H/RD Lat N43.08366 Effort 914 Date 06/05/13 Catg H/RD Lat N43.08679 Effort 907
Site 1A DA? Y Long W078.73465 Gear EFB Site 1D DA? Y Long W078.70750 Gear EFB
DOCE 7 PIPR 50 MOAM 1 MIDO 1 UMLI 1 CYSP 3 AMRU 3 MIDO 1
NOCR 1 MOER 1 AMRU 32 MISA 4 ESLU 1 PIPR 1 LECY 81 MISA 2
NOAT 100 MOVA 1 LECY 66 ETNI 1 ESNI 1 MOER 1 LEGI 11 PEFL 3
NOHU 17 AMNE 1 LEGI 3 PEFL 1 NOAT 100 MOMA 1 LEMA 5 PEMA 3
CYSP 7 LASI 1 LEMA 9 NEME 5 NOHU 1 LASI 4
PINO 11
Date 06/05/13 Catg H/RD Lat N43.08667 Effort 871 Date 06/05/13 Catg H/RD Lat N43.08667 Effort 912
Site 1E DA? Y Long W078.70071 Gear EFB Site 1E DA? Y Long W078.70071 Gear EFB
NOCR 1 PINO 7 FUDI 1 LEGI 3 DOCE 3 CYSP 8 NOMU 1 LEGI 1
NOAT 200 PIPR 9 AMRU 5 LEMA 10 ESLU 1 PINO 11 FUDI 1 LEMA 10
NOHU 7 MOER 3 LECY 47 MISA 1 ESNI 1 PIPR 30 LASI 2 MISA 1
CYSP 9 MOXO 1
CYCA 2 MOER 2 AMRU 10 PONI 1
NOAT 100 MOXO 2 LECY 66 PECA 1
NOHU 3
Date 06/05/13 Catg RD Lat N43.06953 Effort 900 Date 06/13/13 Catg RD Lat N43.08418 Effort 906
Site 2D DA? Y Long W078.74812 Gear EFB Site 1B DA? Y Long W078.72298 Gear EFB
DOCE 2 PIPR 7 AMRU 3 LEMA 55 DOCE 2 PINO 5 LECY 20 PONI 1
CYCA 2 MOER 3 LECY 2 MISA 12 CYCA 1 MOER 1 LEGI 8 PEFL 1
NOAT 200 LASI 7 LEGI 26 PONI 7 NOAT 20 LASI 1 LEMA 16 SAVI 1
PINO 13
CYSP 1 AMRU 4
Date 06/13/13 Catg RD Lat N43.08131 Effort 976 Date 06/13/13 Catg H/RD Lat N43.08679 Effort 945
Site 1C DA? Y Long W078.72023 Gear EFB Site 1D DA? Y Long W078.70750 Gear EFB
NOHU 1 PINO 5 AMRU 12 LEGI 1 NOAT 25 MOAN 2 AMRU 6 POAN 1
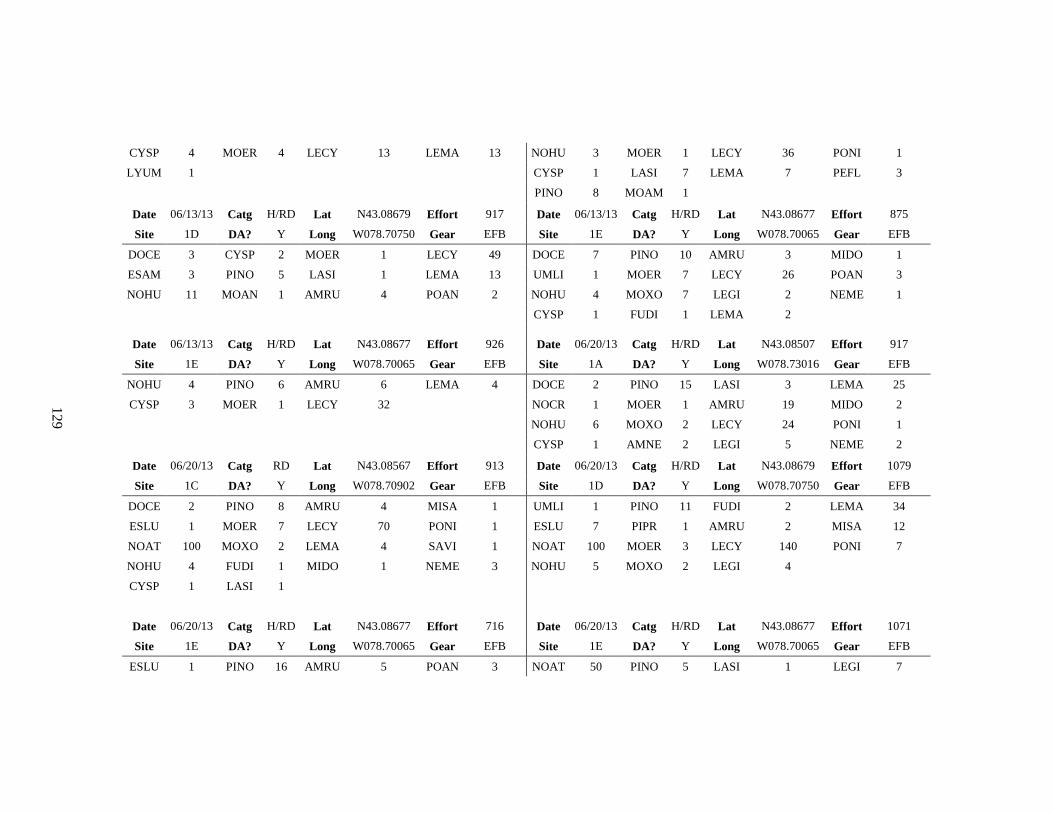
129
CYSP 4 MOER 4 LECY 13 LEMA 13 NOHU 3 MOER 1 LECY 36 PONI 1
LYUM 1
CYSP 1 LASI 7 LEMA 7 PEFL 3
PINO 8 MOAM 1
Date 06/13/13 Catg H/RD Lat N43.08679 Effort 917 Date 06/13/13 Catg H/RD Lat N43.08677 Effort 875
Site 1D DA? Y Long W078.70750 Gear EFB Site 1E DA? Y Long W078.70065 Gear EFB
DOCE 3 CYSP 2 MOER 1 LECY 49 DOCE 7 PINO 10 AMRU 3 MIDO 1
ESAM 3 PINO 5 LASI 1 LEMA 13 UMLI 1 MOER 7 LECY 26 POAN 3
NOHU 11 MOAN 1 AMRU 4 POAN 2 NOHU 4 MOXO 7 LEGI 2 NEME 1
CYSP 1 FUDI 1 LEMA 2
Date 06/13/13 Catg H/RD Lat N43.08677 Effort 926 Date 06/20/13 Catg H/RD Lat N43.08507 Effort 917
Site 1E DA? Y Long W078.70065 Gear EFB Site 1A DA? Y Long W078.73016 Gear EFB
NOHU 4 PINO 6 AMRU 6 LEMA 4 DOCE 2 PINO 15 LASI 3 LEMA 25
CYSP 3 MOER 1 LECY 32
NOCR 1 MOER 1 AMRU 19 MIDO 2
NOHU 6 MOXO 2 LECY 24 PONI 1
CYSP 1 AMNE 2 LEGI 5 NEME 2
Date 06/20/13 Catg RD Lat N43.08567 Effort 913 Date 06/20/13 Catg H/RD Lat N43.08679 Effort 1079
Site 1C DA? Y Long W078.70902 Gear EFB Site 1D DA? Y Long W078.70750 Gear EFB
DOCE 2 PINO 8 AMRU 4 MISA 1 UMLI 1 PINO 11 FUDI 2 LEMA 34
ESLU 1 MOER 7 LECY 70 PONI 1 ESLU 7 PIPR 1 AMRU 2 MISA 12
NOAT 100 MOXO 2 LEMA 4 SAVI 1 NOAT 100 MOER 3 LECY 140 PONI 7
NOHU 4 FUDI 1 MIDO 1 NEME 3 NOHU 5 MOXO 2 LEGI 4
CYSP 1 LASI 1
Date 06/20/13 Catg H/RD Lat N43.08677 Effort 716 Date 06/20/13 Catg H/RD Lat N43.08677 Effort 1071
Site 1E DA? Y Long W078.70065 Gear EFB Site 1E DA? Y Long W078.70065 Gear EFB
ESLU 1 PINO 16 AMRU 5 POAN 3 NOAT 50 PINO 5 LASI 1 LEGI 7
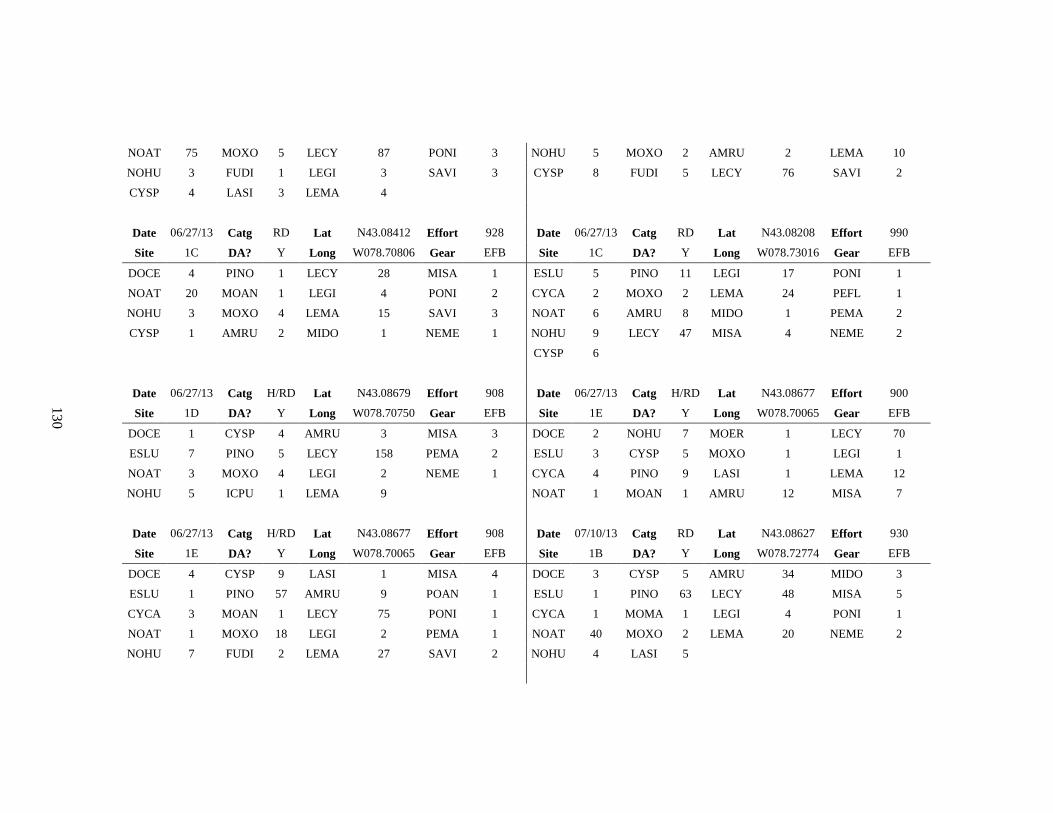
130
NOAT 75 MOXO 5 LECY 87 PONI 3 NOHU 5 MOXO 2 AMRU 2 LEMA 10
NOHU 3 FUDI 1 LEGI 3 SAVI 3 CYSP 8 FUDI 5 LECY 76 SAVI 2
CYSP 4 LASI 3 LEMA 4
Date 06/27/13 Catg RD Lat N43.08412 Effort 928 Date 06/27/13 Catg RD Lat N43.08208 Effort 990
Site 1C DA? Y Long W078.70806 Gear EFB Site 1C DA? Y Long W078.73016 Gear EFB
DOCE 4 PINO 1 LECY 28 MISA 1 ESLU 5 PINO 11 LEGI 17 PONI 1
NOAT 20 MOAN 1 LEGI 4 PONI 2 CYCA 2 MOXO 2 LEMA 24 PEFL 1
NOHU 3 MOXO 4 LEMA 15 SAVI 3 NOAT 6 AMRU 8 MIDO 1 PEMA 2
CYSP 1 AMRU 2 MIDO 1 NEME 1 NOHU 9 LECY 47 MISA 4 NEME 2
CYSP 6
Date 06/27/13 Catg H/RD Lat N43.08679 Effort 908 Date 06/27/13 Catg H/RD Lat N43.08677 Effort 900
Site 1D DA? Y Long W078.70750 Gear EFB Site 1E DA? Y Long W078.70065 Gear EFB
DOCE 1 CYSP 4 AMRU 3 MISA 3 DOCE 2 NOHU 7 MOER 1 LECY 70
ESLU 7 PINO 5 LECY 158 PEMA 2 ESLU 3 CYSP 5 MOXO 1 LEGI 1
NOAT 3 MOXO 4 LEGI 2 NEME 1 CYCA 4 PINO 9 LASI 1 LEMA 12
NOHU 5 ICPU 1 LEMA 9
NOAT 1 MOAN 1 AMRU 12 MISA 7
Date 06/27/13 Catg H/RD Lat N43.08677 Effort 908 Date 07/10/13 Catg RD Lat N43.08627 Effort 930
Site 1E DA? Y Long W078.70065 Gear EFB Site 1B DA? Y Long W078.72774 Gear EFB
DOCE 4 CYSP 9 LASI 1 MISA 4 DOCE 3 CYSP 5 AMRU 34 MIDO 3
ESLU 1 PINO 57 AMRU 9 POAN 1 ESLU 1 PINO 63 LECY 48 MISA 5
CYCA 3 MOAN 1 LECY 75 PONI 1 CYCA 1 MOMA 1 LEGI 4 PONI 1
NOAT 1 MOXO 18 LEGI 2 PEMA 1 NOAT 40 MOXO 2 LEMA 20 NEME 2
NOHU 7 FUDI 2 LEMA 27 SAVI 2 NOHU 4 LASI 5
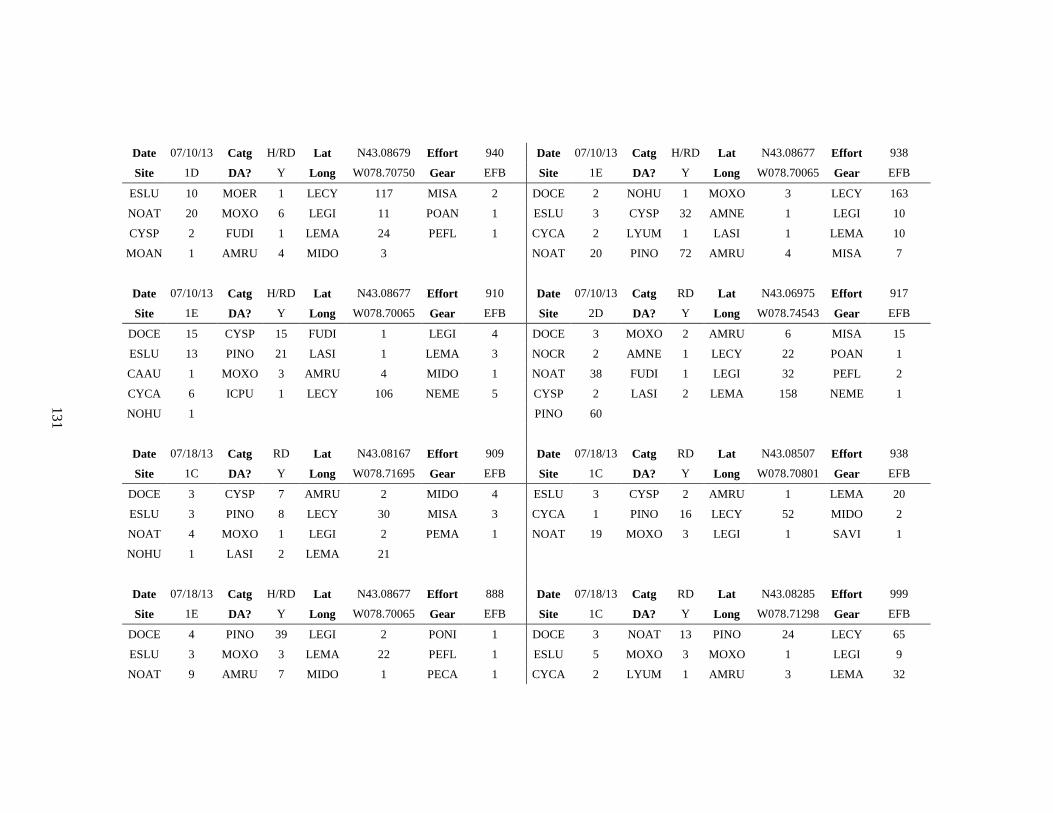
131
Date 07/10/13 Catg H/RD Lat N43.08679 Effort 940 Date 07/10/13 Catg H/RD Lat N43.08677 Effort 938
Site 1D DA? Y Long W078.70750 Gear EFB Site 1E DA? Y Long W078.70065 Gear EFB
ESLU 10 MOER 1 LECY 117 MISA 2 DOCE 2 NOHU 1 MOXO 3 LECY 163
NOAT 20 MOXO 6 LEGI 11 POAN 1 ESLU 3 CYSP 32 AMNE 1 LEGI 10
CYSP 2 FUDI 1 LEMA 24 PEFL 1 CYCA 2 LYUM 1 LASI 1 LEMA 10
MOAN 1 AMRU 4 MIDO 3
NOAT 20 PINO 72 AMRU 4 MISA 7
Date 07/10/13 Catg H/RD Lat N43.08677 Effort 910 Date 07/10/13 Catg RD Lat N43.06975 Effort 917
Site 1E DA? Y Long W078.70065 Gear EFB Site 2D DA? Y Long W078.74543 Gear EFB
DOCE 15 CYSP 15 FUDI 1 LEGI 4 DOCE 3 MOXO 2 AMRU 6 MISA 15
ESLU 13 PINO 21 LASI 1 LEMA 3 NOCR 2 AMNE 1 LECY 22 POAN 1
CAAU 1 MOXO 3 AMRU 4 MIDO 1 NOAT 38 FUDI 1 LEGI 32 PEFL 2
CYCA 6 ICPU 1 LECY 106 NEME 5 CYSP 2 LASI 2 LEMA 158 NEME 1
NOHU 1
PINO 60
Date 07/18/13 Catg RD Lat N43.08167 Effort 909 Date 07/18/13 Catg RD Lat N43.08507 Effort 938
Site 1C DA? Y Long W078.71695 Gear EFB Site 1C DA? Y Long W078.70801 Gear EFB
DOCE 3 CYSP 7 AMRU 2 MIDO 4 ESLU 3 CYSP 2 AMRU 1 LEMA 20
ESLU 3 PINO 8 LECY 30 MISA 3 CYCA 1 PINO 16 LECY 52 MIDO 2
NOAT 4 MOXO 1 LEGI 2 PEMA 1 NOAT 19 MOXO 3 LEGI 1 SAVI 1
NOHU 1 LASI 2 LEMA 21
Date 07/18/13 Catg H/RD Lat N43.08677 Effort 888 Date 07/18/13 Catg RD Lat N43.08285 Effort 999
Site 1E DA? Y Long W078.70065 Gear EFB Site 1C DA? Y Long W078.71298 Gear EFB
DOCE 4 PINO 39 LEGI 2 PONI 1 DOCE 3 NOAT 13 PINO 24 LECY 65
ESLU 3 MOXO 3 LEMA 22 PEFL 1 ESLU 5 MOXO 3 MOXO 1 LEGI 9
NOAT 9 AMRU 7 MIDO 1 PECA 1 CYCA 2 LYUM 1 AMRU 3 LEMA 32
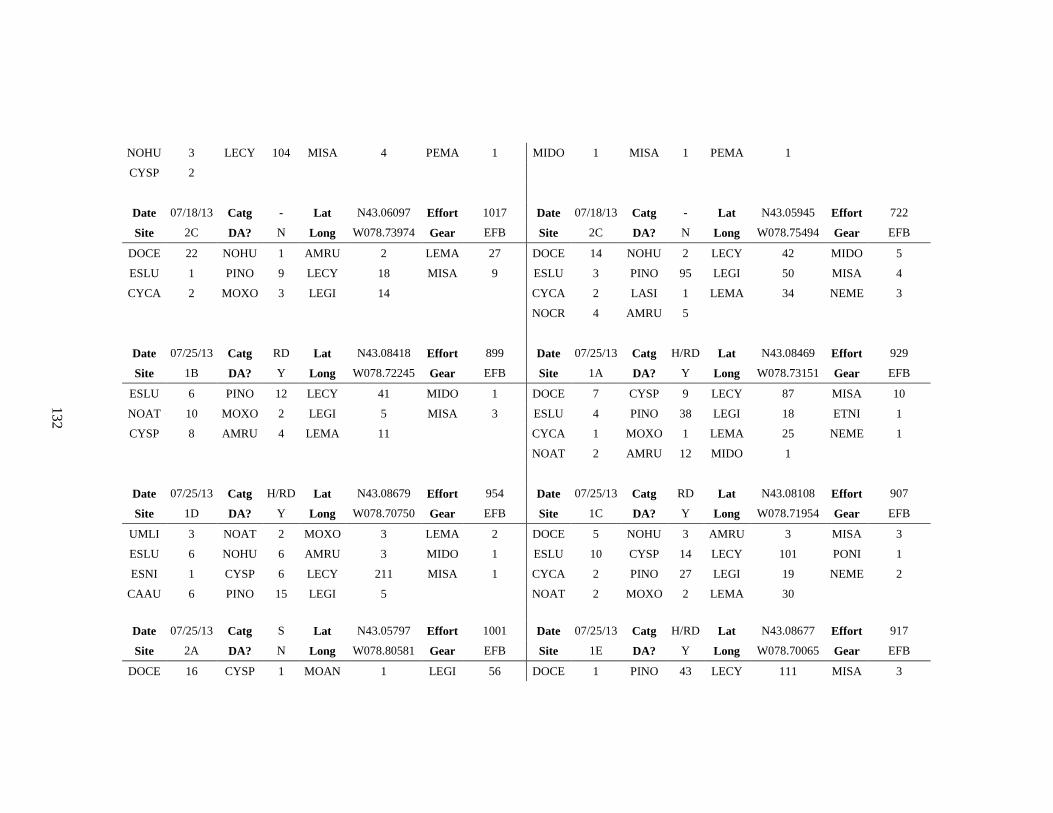
132
NOHU 3 LECY 104 MISA 4 PEMA 1 MIDO 1 MISA 1 PEMA 1
CYSP 2
Date 07/18/13 Catg - Lat N43.06097 Effort 1017 Date 07/18/13 Catg - Lat N43.05945 Effort 722
Site 2C DA? N Long W078.73974 Gear EFB Site 2C DA? N Long W078.75494 Gear EFB
DOCE 22 NOHU 1 AMRU 2 LEMA 27 DOCE 14 NOHU 2 LECY 42 MIDO 5
ESLU 1 PINO 9 LECY 18 MISA 9 ESLU 3 PINO 95 LEGI 50 MISA 4
CYCA 2 MOXO 3 LEGI 14
CYCA 2 LASI 1 LEMA 34 NEME 3
NOCR 4 AMRU 5
Date 07/25/13 Catg RD Lat N43.08418 Effort 899 Date 07/25/13 Catg H/RD Lat N43.08469 Effort 929
Site 1B DA? Y Long W078.72245 Gear EFB Site 1A DA? Y Long W078.73151 Gear EFB
ESLU 6 PINO 12 LECY 41 MIDO 1 DOCE 7 CYSP 9 LECY 87 MISA 10
NOAT 10 MOXO 2 LEGI 5 MISA 3 ESLU 4 PINO 38 LEGI 18 ETNI 1
CYSP 8 AMRU 4 LEMA 11
CYCA 1 MOXO 1 LEMA 25 NEME 1
NOAT 2 AMRU 12 MIDO 1
Date 07/25/13 Catg H/RD Lat N43.08679 Effort 954 Date 07/25/13 Catg RD Lat N43.08108 Effort 907
Site 1D DA? Y Long W078.70750 Gear EFB Site 1C DA? Y Long W078.71954 Gear EFB
UMLI 3 NOAT 2 MOXO 3 LEMA 2 DOCE 5 NOHU 3 AMRU 3 MISA 3
ESLU 6 NOHU 6 AMRU 3 MIDO 1 ESLU 10 CYSP 14 LECY 101 PONI 1
ESNI 1 CYSP 6 LECY 211 MISA 1 CYCA 2 PINO 27 LEGI 19 NEME 2
CAAU 6 PINO 15 LEGI 5
NOAT 2 MOXO 2 LEMA 30
Date 07/25/13 Catg S Lat N43.05797 Effort 1001 Date 07/25/13 Catg H/RD Lat N43.08677 Effort 917
Site 2A DA? N Long W078.80581 Gear EFB Site 1E DA? Y Long W078.70065 Gear EFB
DOCE 16 CYSP 1 MOAN 1 LEGI 56 DOCE 1 PINO 43 LECY 111 MISA 3
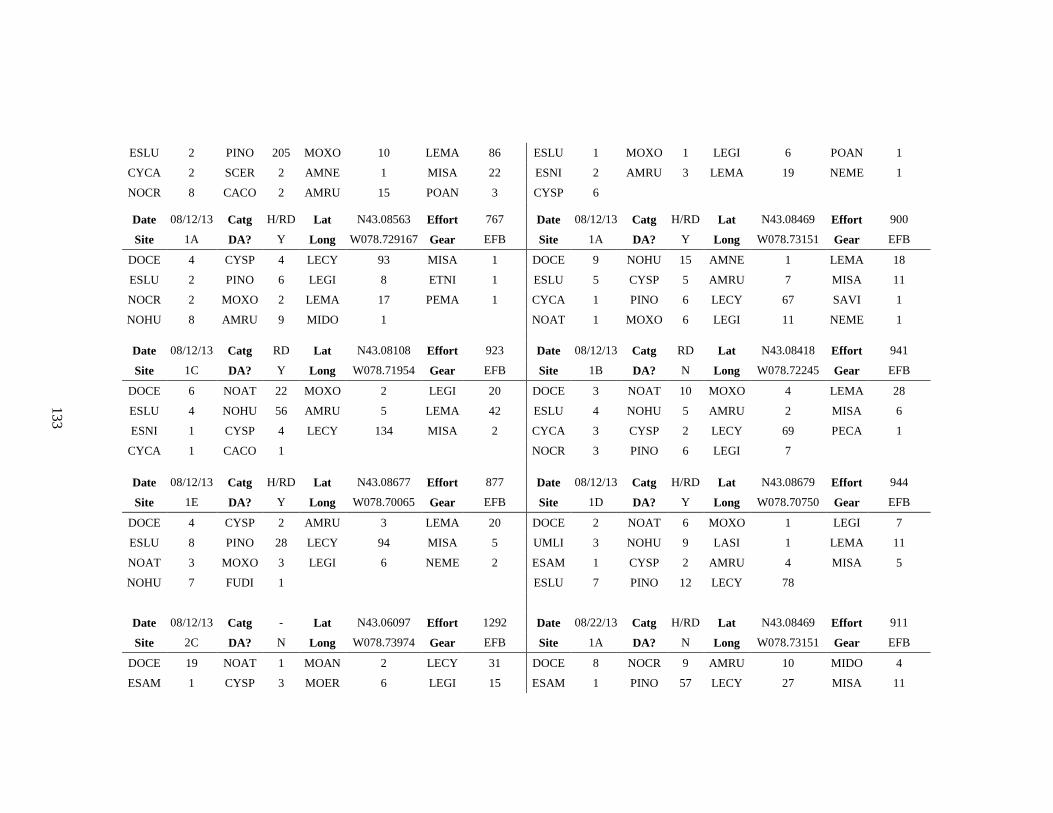
133
ESLU 2 PINO 205 MOXO 10 LEMA 86 ESLU 1 MOXO 1 LEGI 6 POAN 1
CYCA 2 SCER 2 AMNE 1 MISA 22 ESNI 2 AMRU 3 LEMA 19 NEME 1
NOCR 8 CACO 2 AMRU 15 POAN 3 CYSP 6
Date 08/12/13 Catg H/RD Lat N43.08563 Effort 767 Date 08/12/13 Catg H/RD Lat N43.08469 Effort 900
Site 1A DA? Y Long W078.729167 Gear EFB Site 1A DA? Y Long W078.73151 Gear EFB
DOCE 4 CYSP 4 LECY 93 MISA 1 DOCE 9 NOHU 15 AMNE 1 LEMA 18
ESLU 2 PINO 6 LEGI 8 ETNI 1 ESLU 5 CYSP 5 AMRU 7 MISA 11
NOCR 2 MOXO 2 LEMA 17 PEMA 1 CYCA 1 PINO 6 LECY 67 SAVI 1
NOHU 8 AMRU 9 MIDO 1
NOAT 1 MOXO 6 LEGI 11 NEME 1
Date 08/12/13 Catg RD Lat N43.08108 Effort 923 Date 08/12/13 Catg RD Lat N43.08418 Effort 941
Site 1C DA? Y Long W078.71954 Gear EFB Site 1B DA? N Long W078.72245 Gear EFB
DOCE 6 NOAT 22 MOXO 2 LEGI 20 DOCE 3 NOAT 10 MOXO 4 LEMA 28
ESLU 4 NOHU 56 AMRU 5 LEMA 42 ESLU 4 NOHU 5 AMRU 2 MISA 6
ESNI 1 CYSP 4 LECY 134 MISA 2 CYCA 3 CYSP 2 LECY 69 PECA 1
CYCA 1 CACO 1
NOCR 3 PINO 6 LEGI 7
Date 08/12/13 Catg H/RD Lat N43.08677 Effort 877 Date 08/12/13 Catg H/RD Lat N43.08679 Effort 944
Site 1E DA? Y Long W078.70065 Gear EFB Site 1D DA? Y Long W078.70750 Gear EFB
DOCE 4 CYSP 2 AMRU 3 LEMA 20 DOCE 2 NOAT 6 MOXO 1 LEGI 7
ESLU 8 PINO 28 LECY 94 MISA 5 UMLI 3 NOHU 9 LASI 1 LEMA 11
NOAT 3 MOXO 3 LEGI 6 NEME 2 ESAM 1 CYSP 2 AMRU 4 MISA 5
NOHU 7 FUDI 1
ESLU 7 PINO 12 LECY 78
Date 08/12/13 Catg - Lat N43.06097 Effort 1292 Date 08/22/13 Catg H/RD Lat N43.08469 Effort 911
Site 2C DA? N Long W078.73974 Gear EFB Site 1A DA? N Long W078.73151 Gear EFB
DOCE 19 NOAT 1 MOAN 2 LECY 31 DOCE 8 NOCR 9 AMRU 10 MIDO 4
ESAM 1 CYSP 3 MOER 6 LEGI 15 ESAM 1 PINO 57 LECY 27 MISA 11
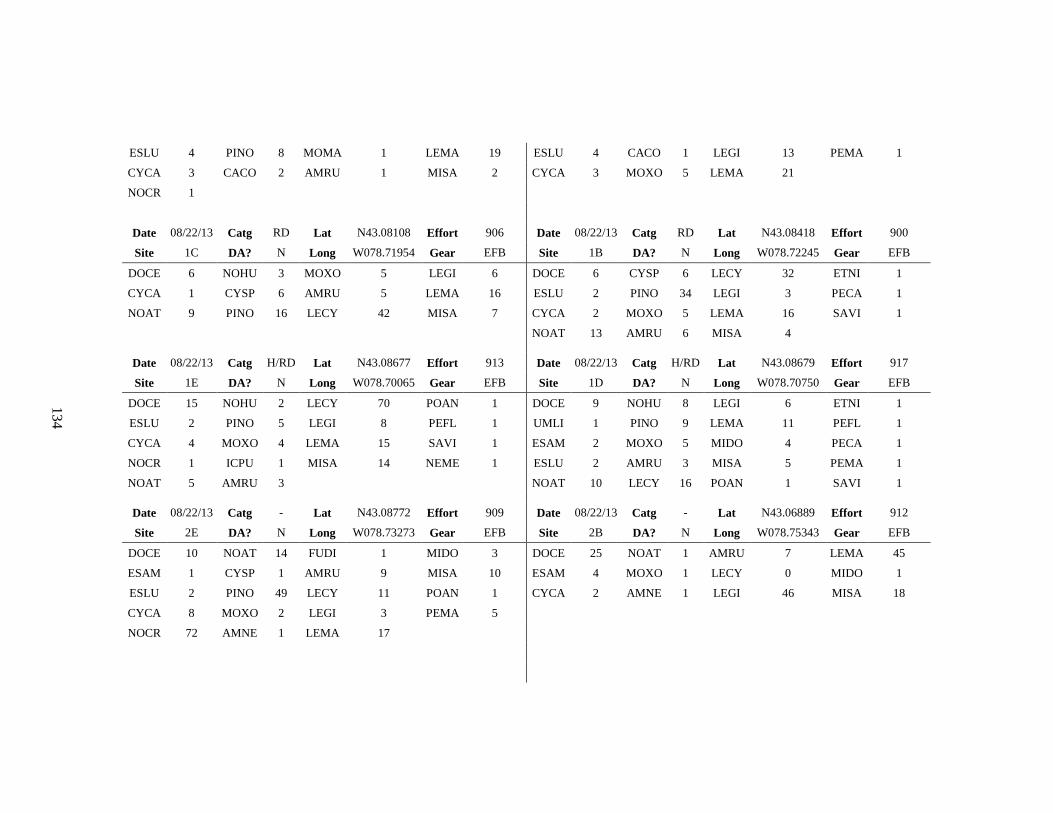
134
ESLU 4 PINO 8 MOMA 1 LEMA 19 ESLU 4 CACO 1 LEGI 13 PEMA 1
CYCA 3 CACO 2 AMRU 1 MISA 2 CYCA 3 MOXO 5 LEMA 21
NOCR 1
Date 08/22/13 Catg RD Lat N43.08108 Effort 906 Date 08/22/13 Catg RD Lat N43.08418 Effort 900
Site 1C DA? N Long W078.71954 Gear EFB Site 1B DA? N Long W078.72245 Gear EFB
DOCE 6 NOHU 3 MOXO 5 LEGI 6 DOCE 6 CYSP 6 LECY 32 ETNI 1
CYCA 1 CYSP 6 AMRU 5 LEMA 16 ESLU 2 PINO 34 LEGI 3 PECA 1
NOAT 9 PINO 16 LECY 42 MISA 7 CYCA 2 MOXO 5 LEMA 16 SAVI 1
NOAT 13 AMRU 6 MISA 4
Date 08/22/13 Catg H/RD Lat N43.08677 Effort 913 Date 08/22/13 Catg H/RD Lat N43.08679 Effort 917
Site 1E DA? N Long W078.70065 Gear EFB Site 1D DA? N Long W078.70750 Gear EFB
DOCE 15 NOHU 2 LECY 70 POAN 1 DOCE 9 NOHU 8 LEGI 6 ETNI 1
ESLU 2 PINO 5 LEGI 8 PEFL 1 UMLI 1 PINO 9 LEMA 11 PEFL 1
CYCA 4 MOXO 4 LEMA 15 SAVI 1 ESAM 2 MOXO 5 MIDO 4 PECA 1
NOCR 1 ICPU 1 MISA 14 NEME 1 ESLU 2 AMRU 3 MISA 5 PEMA 1
NOAT 5 AMRU 3
NOAT 10 LECY 16 POAN 1 SAVI 1
Date 08/22/13 Catg - Lat N43.08772 Effort 909 Date 08/22/13 Catg - Lat N43.06889 Effort 912
Site 2E DA? N Long W078.73273 Gear EFB Site 2B DA? N Long W078.75343 Gear EFB
DOCE 10 NOAT 14 FUDI 1 MIDO 3 DOCE 25 NOAT 1 AMRU 7 LEMA 45
ESAM 1 CYSP 1 AMRU 9 MISA 10 ESAM 4 MOXO 1 LECY 0 MIDO 1
ESLU 2 PINO 49 LECY 11 POAN 1 CYCA 2 AMNE 1 LEGI 46 MISA 18
CYCA 8 MOXO 2 LEGI 3 PEMA 5
NOCR 72 AMNE 1 LEMA 17
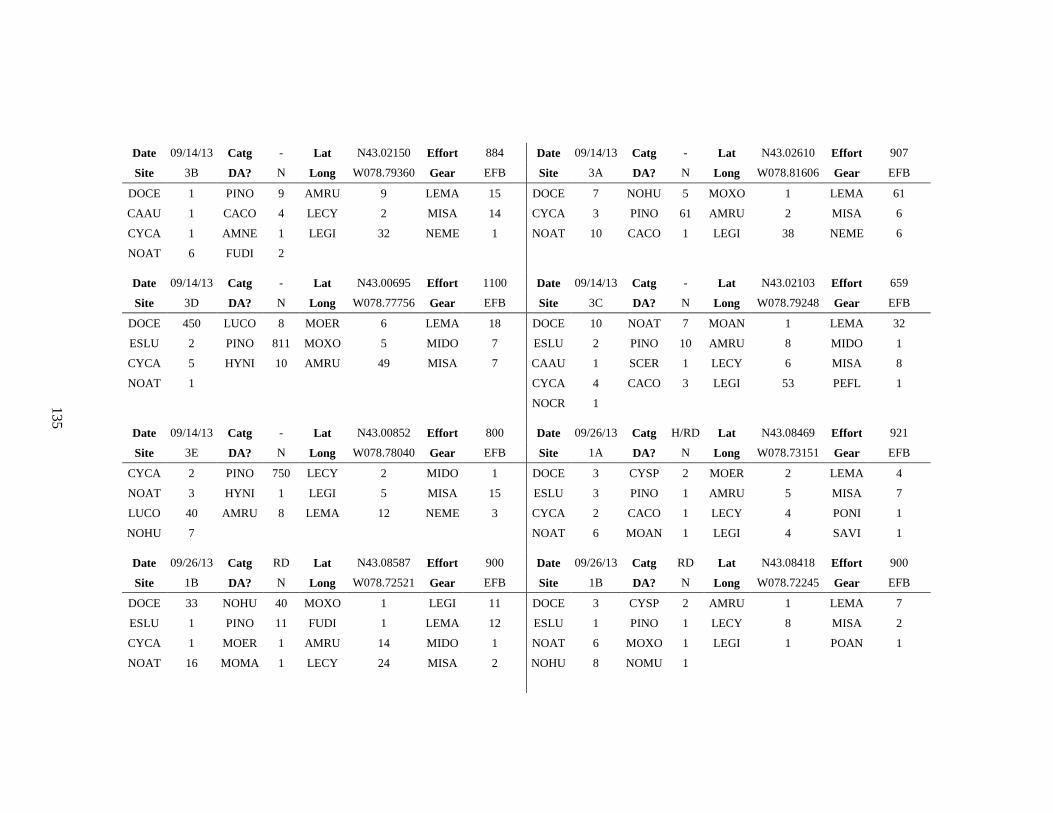
135
Date 09/14/13 Catg - Lat N43.02150 Effort 884 Date 09/14/13 Catg - Lat N43.02610 Effort 907
Site 3B DA? N Long W078.79360 Gear EFB Site 3A DA? N Long W078.81606 Gear EFB
DOCE 1 PINO 9 AMRU 9 LEMA 15 DOCE 7 NOHU 5 MOXO 1 LEMA 61
CAAU 1 CACO 4 LECY 2 MISA 14 CYCA 3 PINO 61 AMRU 2 MISA 6
CYCA 1 AMNE 1 LEGI 32 NEME 1 NOAT 10 CACO 1 LEGI 38 NEME 6
NOAT 6 FUDI 2
Date 09/14/13 Catg - Lat N43.00695 Effort 1100 Date 09/14/13 Catg - Lat N43.02103 Effort 659
Site 3D DA? N Long W078.77756 Gear EFB Site 3C DA? N Long W078.79248 Gear EFB
DOCE 450 LUCO 8 MOER 6 LEMA 18 DOCE 10 NOAT 7 MOAN 1 LEMA 32
ESLU 2 PINO 811 MOXO 5 MIDO 7 ESLU 2 PINO 10 AMRU 8 MIDO 1
CYCA 5 HYNI 10 AMRU 49 MISA 7 CAAU 1 SCER 1 LECY 6 MISA 8
NOAT 1
CYCA 4 CACO 3 LEGI 53 PEFL 1
NOCR 1
Date 09/14/13 Catg - Lat N43.00852 Effort 800 Date 09/26/13 Catg H/RD Lat N43.08469 Effort 921
Site 3E DA? N Long W078.78040 Gear EFB Site 1A DA? N Long W078.73151 Gear EFB
CYCA 2 PINO 750 LECY 2 MIDO 1 DOCE 3 CYSP 2 MOER 2 LEMA 4
NOAT 3 HYNI 1 LEGI 5 MISA 15 ESLU 3 PINO 1 AMRU 5 MISA 7
LUCO 40 AMRU 8 LEMA 12 NEME 3 CYCA 2 CACO 1 LECY 4 PONI 1
NOHU 7
NOAT 6 MOAN 1 LEGI 4 SAVI 1
Date 09/26/13 Catg RD Lat N43.08587 Effort 900 Date 09/26/13 Catg RD Lat N43.08418 Effort 900
Site 1B DA? N Long W078.72521 Gear EFB Site 1B DA? N Long W078.72245 Gear EFB
DOCE 33 NOHU 40 MOXO 1 LEGI 11 DOCE 3 CYSP 2 AMRU 1 LEMA 7
ESLU 1 PINO 11 FUDI 1 LEMA 12 ESLU 1 PINO 1 LECY 8 MISA 2
CYCA 1 MOER 1 AMRU 14 MIDO 1 NOAT 6 MOXO 1 LEGI 1 POAN 1
NOAT 16 MOMA 1 LECY 24 MISA 2 NOHU 8 NOMU 1
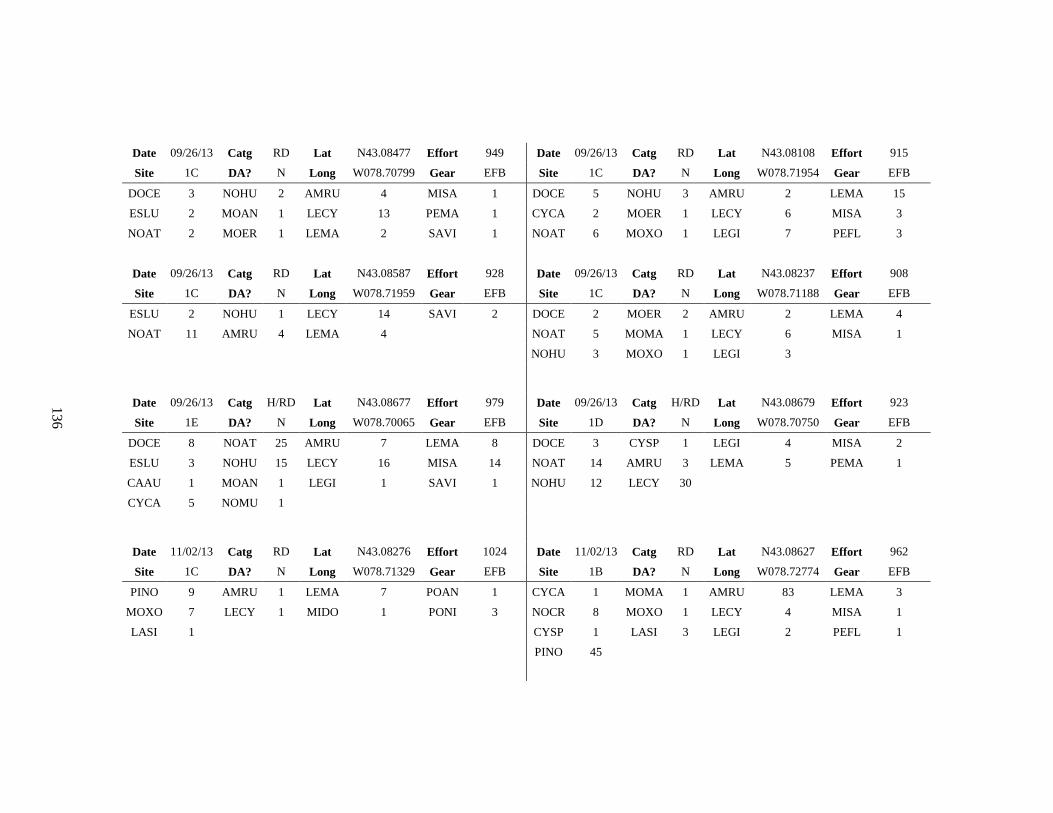
136
Date 09/26/13 Catg RD Lat N43.08477 Effort 949 Date 09/26/13 Catg RD Lat N43.08108 Effort 915
Site 1C DA? N Long W078.70799 Gear EFB Site 1C DA? N Long W078.71954 Gear EFB
DOCE 3 NOHU 2 AMRU 4 MISA 1 DOCE 5 NOHU 3 AMRU 2 LEMA 15
ESLU 2 MOAN 1 LECY 13 PEMA 1 CYCA 2 MOER 1 LECY 6 MISA 3
NOAT 2 MOER 1 LEMA 2 SAVI 1 NOAT 6 MOXO 1 LEGI 7 PEFL 3
Date 09/26/13 Catg RD Lat N43.08587 Effort 928 Date 09/26/13 Catg RD Lat N43.08237 Effort 908
Site 1C DA? N Long W078.71959 Gear EFB Site 1C DA? N Long W078.71188 Gear EFB
ESLU 2 NOHU 1 LECY 14 SAVI 2 DOCE 2 MOER 2 AMRU 2 LEMA 4
NOAT 11 AMRU 4 LEMA 4
NOAT 5 MOMA 1 LECY 6 MISA 1
NOHU 3 MOXO 1 LEGI 3
Date 09/26/13 Catg H/RD Lat N43.08677 Effort 979 Date 09/26/13 Catg H/RD Lat N43.08679 Effort 923
Site 1E DA? N Long W078.70065 Gear EFB Site 1D DA? N Long W078.70750 Gear EFB
DOCE 8 NOAT 25 AMRU 7 LEMA 8 DOCE 3 CYSP 1 LEGI 4 MISA 2
ESLU 3 NOHU 15 LECY 16 MISA 14 NOAT 14 AMRU 3 LEMA 5 PEMA 1
CAAU 1 MOAN 1 LEGI 1 SAVI 1 NOHU 12 LECY 30
CYCA 5 NOMU 1
Date 11/02/13 Catg RD Lat N43.08276 Effort 1024 Date 11/02/13 Catg RD Lat N43.08627 Effort 962
Site 1C DA? N Long W078.71329 Gear EFB Site 1B DA? N Long W078.72774 Gear EFB
PINO 9 AMRU 1 LEMA 7 POAN 1 CYCA 1 MOMA 1 AMRU 83 LEMA 3
MOXO 7 LECY 1 MIDO 1 PONI 3 NOCR 8 MOXO 1 LECY 4 MISA 1
LASI 1
CYSP 1 LASI 3 LEGI 2 PEFL 1
PINO 45
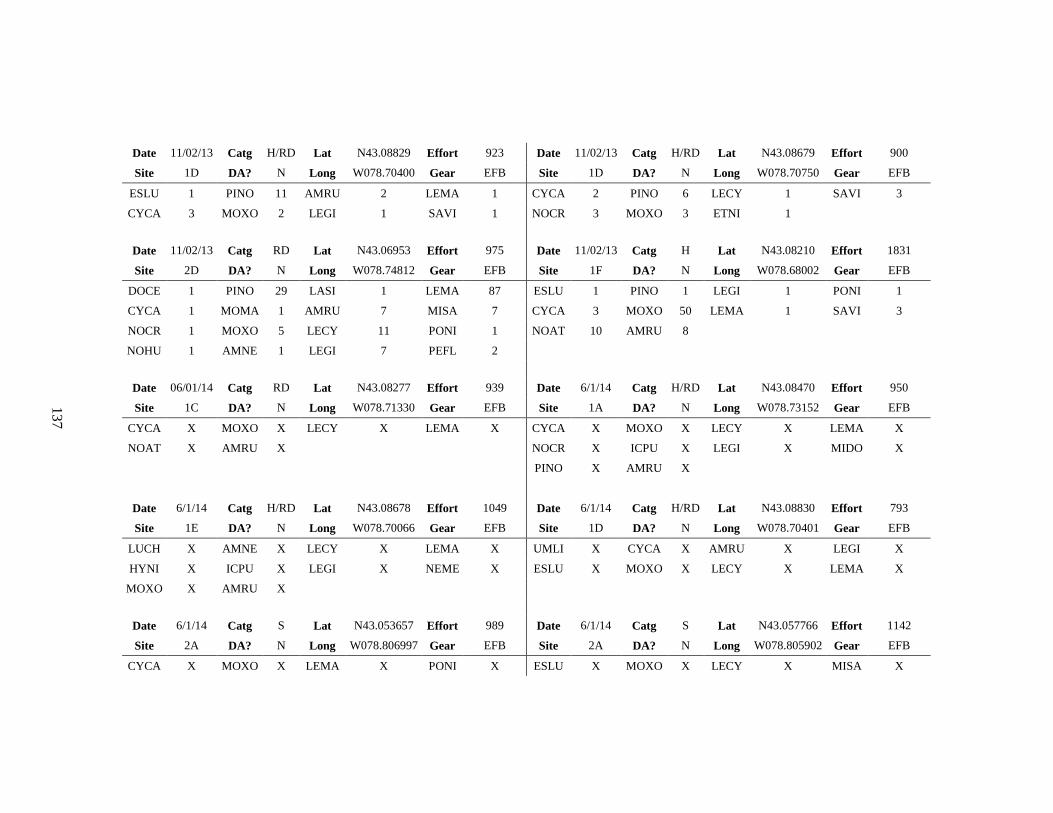
137
Date 11/02/13 Catg H/RD Lat N43.08829 Effort 923 Date 11/02/13 Catg H/RD Lat N43.08679 Effort 900
Site 1D DA? N Long W078.70400 Gear EFB Site 1D DA? N Long W078.70750 Gear EFB
ESLU 1 PINO 11 AMRU 2 LEMA 1 CYCA 2 PINO 6 LECY 1 SAVI 3
CYCA 3 MOXO 2 LEGI 1 SAVI 1 NOCR 3 MOXO 3 ETNI 1
Date 11/02/13 Catg RD Lat N43.06953 Effort 975 Date 11/02/13 Catg H Lat N43.08210 Effort 1831
Site 2D DA? N Long W078.74812 Gear EFB Site 1F DA? N Long W078.68002 Gear EFB
DOCE 1 PINO 29 LASI 1 LEMA 87 ESLU 1 PINO 1 LEGI 1 PONI 1
CYCA 1 MOMA 1 AMRU 7 MISA 7 CYCA 3 MOXO 50 LEMA 1 SAVI 3
NOCR 1 MOXO 5 LECY 11 PONI 1 NOAT 10 AMRU 8
NOHU 1 AMNE 1 LEGI 7 PEFL 2
Date 06/01/14 Catg RD Lat N43.08277 Effort 939 Date 6/1/14 Catg H/RD Lat N43.08470 Effort 950
Site 1C DA? N Long W078.71330 Gear EFB Site 1A DA? N Long W078.73152 Gear EFB
CYCA X MOXO X LECY X LEMA X CYCA X MOXO X LECY X LEMA X
NOAT X AMRU X
NOCR X ICPU X LEGI X MIDO X
PINO X AMRU X
Date 6/1/14 Catg H/RD Lat N43.08678 Effort 1049 Date 6/1/14 Catg H/RD Lat N43.08830 Effort 793
Site 1E DA? N Long W078.70066 Gear EFB Site 1D DA? N Long W078.70401 Gear EFB
LUCH X AMNE X LECY X LEMA X UMLI X CYCA X AMRU X LEGI X
HYNI X ICPU X LEGI X NEME X ESLU X MOXO X LECY X LEMA X
MOXO X AMRU X
Date 6/1/14 Catg S Lat N43.053657 Effort 989 Date 6/1/14 Catg S Lat N43.057766 Effort 1142
Site 2A DA? N Long W078.806997 Gear EFB Site 2A DA? N Long W078.805902 Gear EFB
CYCA X MOXO X LEMA X PONI X ESLU X MOXO X LECY X MISA X
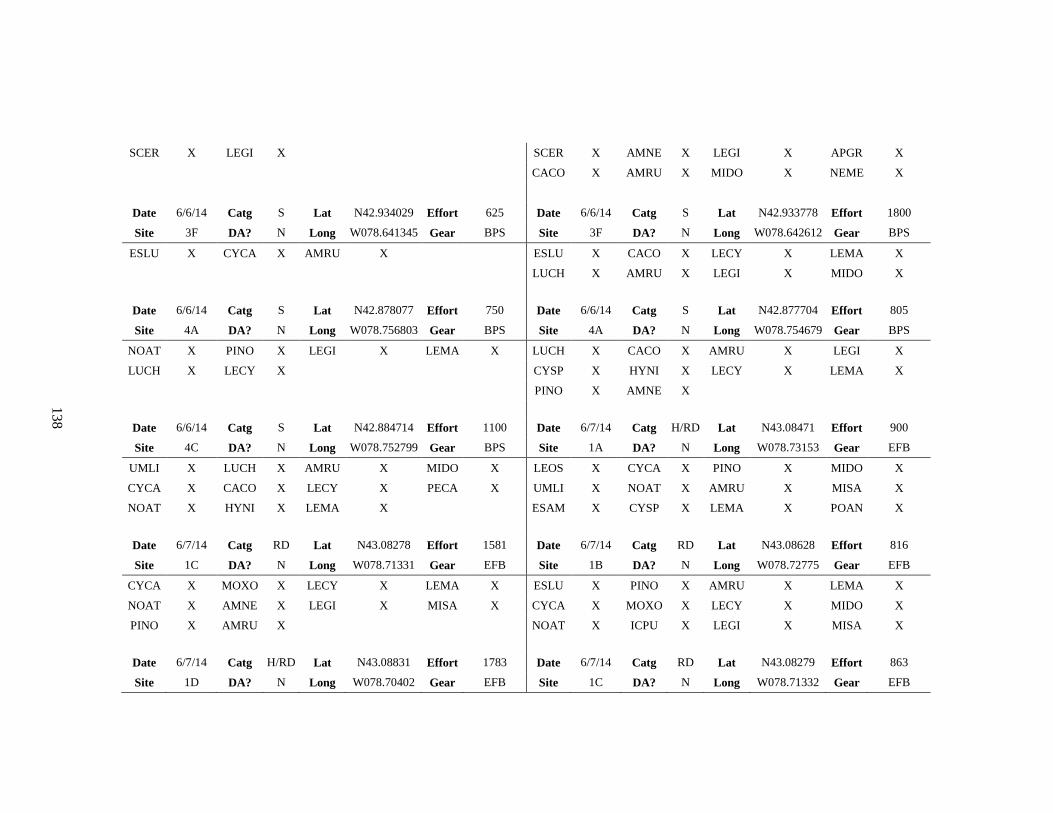
138
SCER X LEGI X
SCER X AMNE X LEGI X APGR X
CACO X AMRU X MIDO X NEME X
Date 6/6/14 Catg S Lat N42.934029 Effort 625 Date 6/6/14 Catg S Lat N42.933778 Effort 1800
Site 3F DA? N Long W078.641345 Gear BPS Site 3F DA? N Long W078.642612 Gear BPS
ESLU X CYCA X AMRU X
ESLU X CACO X LECY X LEMA X
LUCH X AMRU X LEGI X MIDO X
Date 6/6/14 Catg S Lat N42.878077 Effort 750 Date 6/6/14 Catg S Lat N42.877704 Effort 805
Site 4A DA? N Long W078.756803 Gear BPS Site 4A DA? N Long W078.754679 Gear BPS
NOAT X PINO X LEGI X LEMA X LUCH X CACO X AMRU X LEGI X
LUCH X LECY X
CYSP X HYNI X LECY X LEMA X
PINO X AMNE X
Date 6/6/14 Catg S Lat N42.884714 Effort 1100 Date 6/7/14 Catg H/RD Lat N43.08471 Effort 900
Site 4C DA? N Long W078.752799 Gear BPS Site 1A DA? N Long W078.73153 Gear EFB
UMLI X LUCH X AMRU X MIDO X LEOS X CYCA X PINO X MIDO X
CYCA X CACO X LECY X PECA X UMLI X NOAT X AMRU X MISA X
NOAT X HYNI X LEMA X
ESAM X CYSP X LEMA X POAN X
Date 6/7/14 Catg RD Lat N43.08278 Effort 1581 Date 6/7/14 Catg RD Lat N43.08628 Effort 816
Site 1C DA? N Long W078.71331 Gear EFB Site 1B DA? N Long W078.72775 Gear EFB
CYCA X MOXO X LECY X LEMA X ESLU X PINO X AMRU X LEMA X
NOAT X AMNE X LEGI X MISA X CYCA X MOXO X LECY X MIDO X
PINO X AMRU X
NOAT X ICPU X LEGI X MISA X
Date 6/7/14 Catg H/RD Lat N43.08831 Effort 1783 Date 6/7/14 Catg RD Lat N43.08279 Effort 863
Site 1D DA? N Long W078.70402 Gear EFB Site 1C DA? N Long W078.71332 Gear EFB
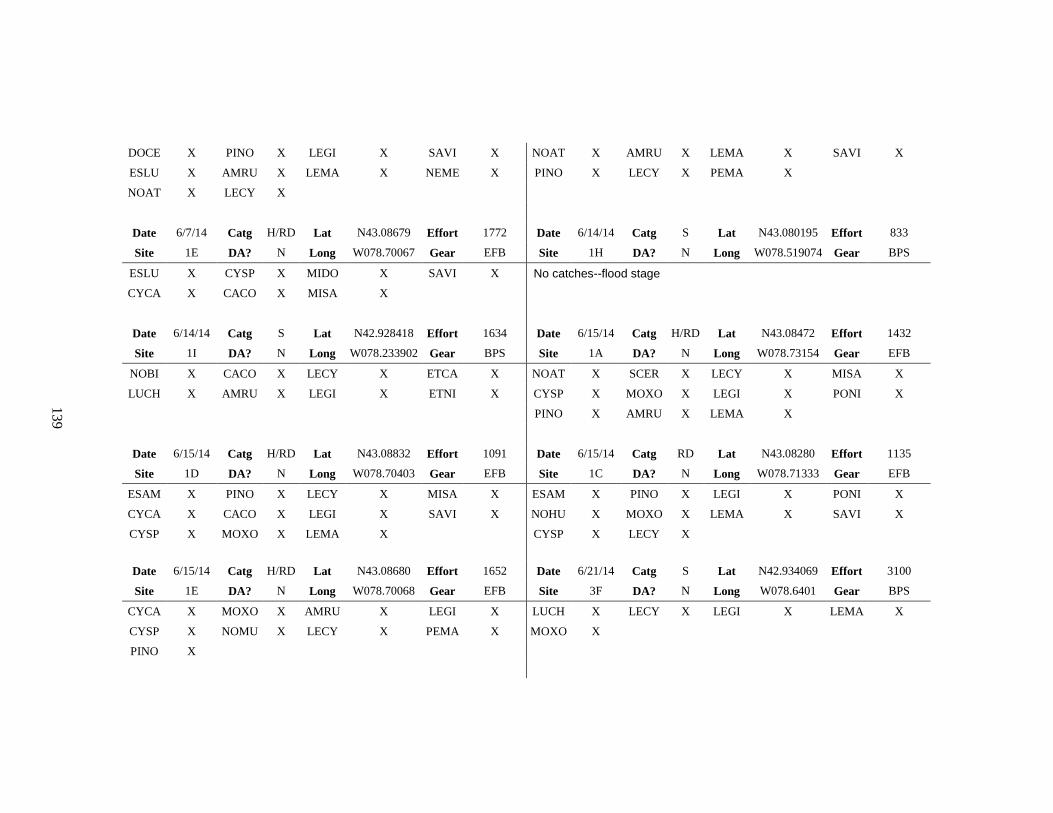
139
DOCE X PINO X LEGI X SAVI X NOAT X AMRU X LEMA X SAVI X
ESLU X AMRU X LEMA X NEME X PINO X LECY X PEMA X
NOAT X LECY X
Date 6/7/14 Catg H/RD Lat N43.08679 Effort 1772 Date 6/14/14 Catg S Lat N43.080195 Effort 833
Site 1E DA? N Long W078.70067 Gear EFB Site 1H DA? N Long W078.519074 Gear BPS
ESLU X CYSP X MIDO X SAVI X No catches--flood stage
CYCA X CACO X MISA X
Date 6/14/14 Catg S Lat N42.928418 Effort 1634 Date 6/15/14 Catg H/RD Lat N43.08472 Effort 1432
Site 1I DA? N Long W078.233902 Gear BPS Site 1A DA? N Long W078.73154 Gear EFB
NOBI X CACO X LECY X ETCA X NOAT X SCER X LECY X MISA X
LUCH X AMRU X LEGI X ETNI X CYSP X MOXO X LEGI X PONI X
PINO X AMRU X LEMA X
Date 6/15/14 Catg H/RD Lat N43.08832 Effort 1091 Date 6/15/14 Catg RD Lat N43.08280 Effort 1135
Site 1D DA? N Long W078.70403 Gear EFB Site 1C DA? N Long W078.71333 Gear EFB
ESAM X PINO X LECY X MISA X ESAM X PINO X LEGI X PONI X
CYCA X CACO X LEGI X SAVI X NOHU X MOXO X LEMA X SAVI X
CYSP X MOXO X LEMA X
CYSP X LECY X
Date 6/15/14 Catg H/RD Lat N43.08680 Effort 1652 Date 6/21/14 Catg S Lat N42.934069 Effort 3100
Site 1E DA? N Long W078.70068 Gear EFB Site 3F DA? N Long W078.6401 Gear BPS
CYCA X MOXO X AMRU X LEGI X LUCH X LECY X LEGI X LEMA X
CYSP X NOMU X LECY X PEMA X MOXO X
PINO X
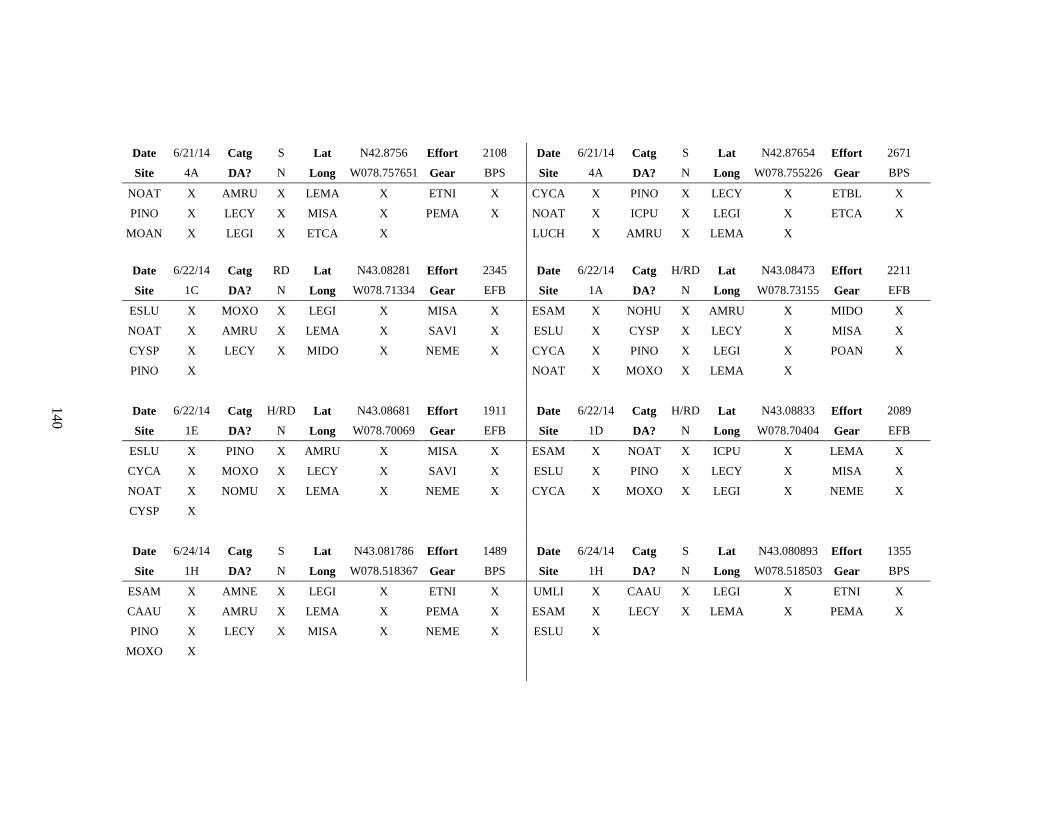
140
Date 6/21/14 Catg S Lat N42.8756 Effort 2108 Date 6/21/14 Catg S Lat N42.87654 Effort 2671
Site 4A DA? N Long W078.757651 Gear BPS Site 4A DA? N Long W078.755226 Gear BPS
NOAT X AMRU X LEMA X ETNI X CYCA X PINO X LECY X ETBL X
PINO X LECY X MISA X PEMA X NOAT X ICPU X LEGI X ETCA X
MOAN X LEGI X ETCA X
LUCH X AMRU X LEMA X
Date 6/22/14 Catg RD Lat N43.08281 Effort 2345 Date 6/22/14 Catg H/RD Lat N43.08473 Effort 2211
Site 1C DA? N Long W078.71334 Gear EFB Site 1A DA? N Long W078.73155 Gear EFB
ESLU X MOXO X LEGI X MISA X ESAM X NOHU X AMRU X MIDO X
NOAT X AMRU X LEMA X SAVI X ESLU X CYSP X LECY X MISA X
CYSP X LECY X MIDO X NEME X CYCA X PINO X LEGI X POAN X
PINO X
NOAT X MOXO X LEMA X
Date 6/22/14 Catg H/RD Lat N43.08681 Effort 1911 Date 6/22/14 Catg H/RD Lat N43.08833 Effort 2089
Site 1E DA? N Long W078.70069 Gear EFB Site 1D DA? N Long W078.70404 Gear EFB
ESLU X PINO X AMRU X MISA X ESAM X NOAT X ICPU X LEMA X
CYCA X MOXO X LECY X SAVI X ESLU X PINO X LECY X MISA X
NOAT X NOMU X LEMA X NEME X CYCA X MOXO X LEGI X NEME X
CYSP X
Date 6/24/14 Catg S Lat N43.081786 Effort 1489 Date 6/24/14 Catg S Lat N43.080893 Effort 1355
Site 1H DA? N Long W078.518367 Gear BPS Site 1H DA? N Long W078.518503 Gear BPS
ESAM X AMNE X LEGI X ETNI X UMLI X CAAU X LEGI X ETNI X
CAAU X AMRU X LEMA X PEMA X ESAM X LECY X LEMA X PEMA X
PINO X LECY X MISA X NEME X ESLU X
MOXO X
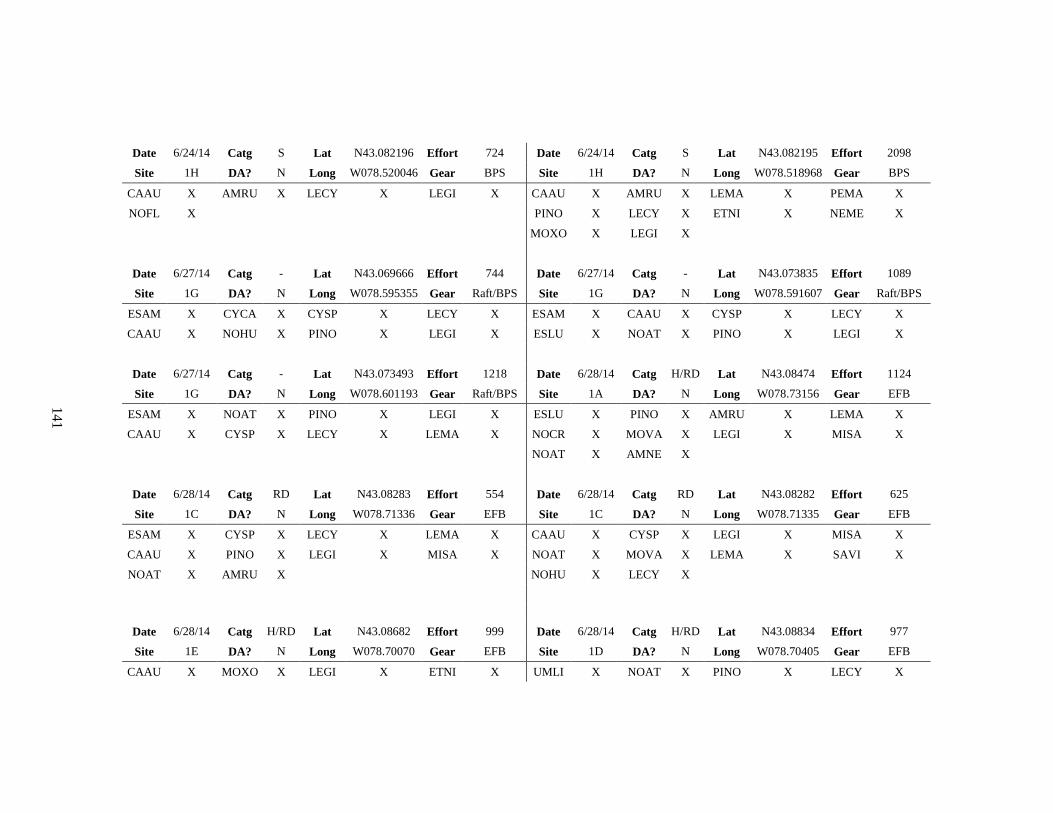
141
Date 6/24/14 Catg S Lat N43.082196 Effort 724 Date 6/24/14 Catg S Lat N43.082195 Effort 2098
Site 1H DA? N Long W078.520046 Gear BPS Site 1H DA? N Long W078.518968 Gear BPS
CAAU X AMRU X LECY X LEGI X CAAU X AMRU X LEMA X PEMA X
NOFL X
PINO X LECY X ETNI X NEME X
MOXO X LEGI X
Date 6/27/14 Catg - Lat N43.069666 Effort 744 Date 6/27/14 Catg - Lat N43.073835 Effort 1089
Site 1G DA? N Long W078.595355 Gear Raft/BPS Site 1G DA? N Long W078.591607 Gear Raft/BPS
ESAM X CYCA X CYSP X LECY X ESAM X CAAU X CYSP X LECY X
CAAU X NOHU X PINO X LEGI X ESLU X NOAT X PINO X LEGI X
Date 6/27/14 Catg - Lat N43.073493 Effort 1218 Date 6/28/14 Catg H/RD Lat N43.08474 Effort 1124
Site 1G DA? N Long W078.601193 Gear Raft/BPS Site 1A DA? N Long W078.73156 Gear EFB
ESAM X NOAT X PINO X LEGI X ESLU X PINO X AMRU X LEMA X
CAAU X CYSP X LECY X LEMA X NOCR X MOVA X LEGI X MISA X
NOAT X AMNE X
Date 6/28/14 Catg RD Lat N43.08283 Effort 554 Date 6/28/14 Catg RD Lat N43.08282 Effort 625
Site 1C DA? N Long W078.71336 Gear EFB Site 1C DA? N Long W078.71335 Gear EFB
ESAM X CYSP X LECY X LEMA X CAAU X CYSP X LEGI X MISA X
CAAU X PINO X LEGI X MISA X NOAT X MOVA X LEMA X SAVI X
NOAT X AMRU X
NOHU X LECY X
Date 6/28/14 Catg H/RD Lat N43.08682 Effort 999 Date 6/28/14 Catg H/RD Lat N43.08834 Effort 977
Site 1E DA? N Long W078.70070 Gear EFB Site 1D DA? N Long W078.70405 Gear EFB
CAAU X MOXO X LEGI X ETNI X UMLI X NOAT X PINO X LECY X
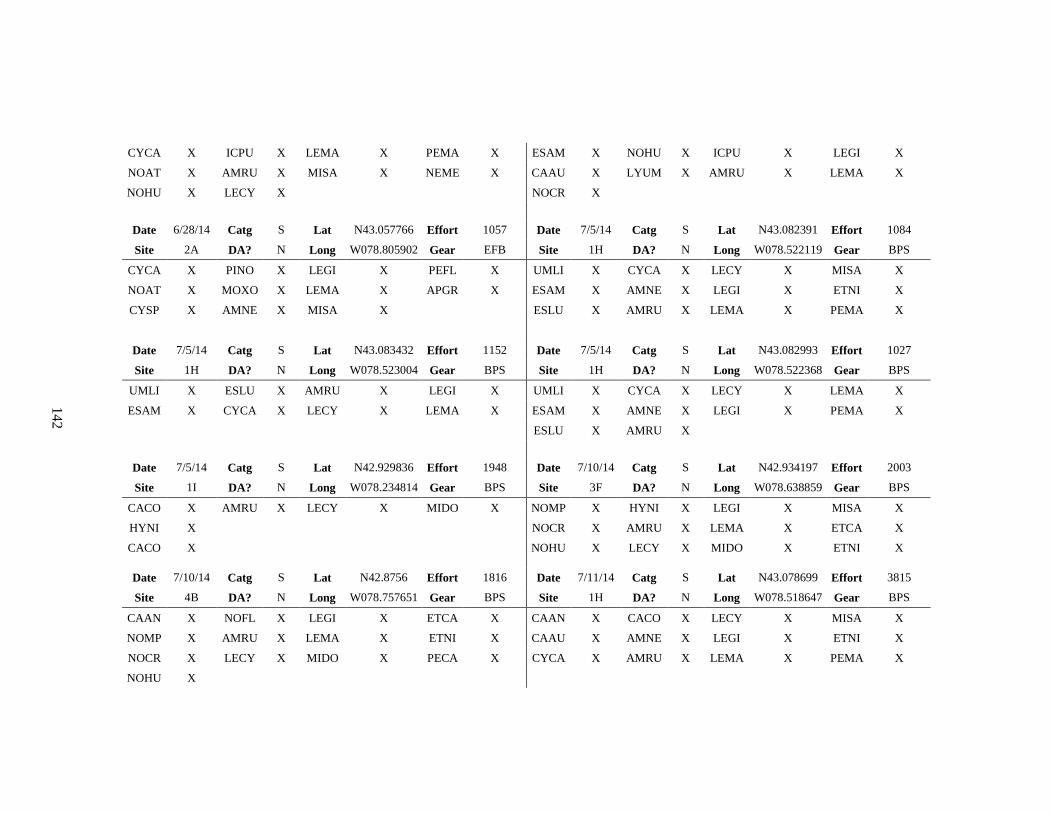
142
CYCA X ICPU X LEMA X PEMA X ESAM X NOHU X ICPU X LEGI X
NOAT X AMRU X MISA X NEME X CAAU X LYUM X AMRU X LEMA X
NOHU X LECY X
NOCR X
Date 6/28/14 Catg S Lat N43.057766 Effort 1057 Date 7/5/14 Catg S Lat N43.082391 Effort 1084
Site 2A DA? N Long W078.805902 Gear EFB Site 1H DA? N Long W078.522119 Gear BPS
CYCA X PINO X LEGI X PEFL X UMLI X CYCA X LECY X MISA X
NOAT X MOXO X LEMA X APGR X ESAM X AMNE X LEGI X ETNI X
CYSP X AMNE X MISA X
ESLU X AMRU X LEMA X PEMA X
Date 7/5/14 Catg S Lat N43.083432 Effort 1152 Date 7/5/14 Catg S Lat N43.082993 Effort 1027
Site 1H DA? N Long W078.523004 Gear BPS Site 1H DA? N Long W078.522368 Gear BPS
UMLI X ESLU X AMRU X LEGI X UMLI X CYCA X LECY X LEMA X
ESAM X CYCA X LECY X LEMA X ESAM X AMNE X LEGI X PEMA X
ESLU X AMRU X
Date 7/5/14 Catg S Lat N42.929836 Effort 1948 Date 7/10/14 Catg S Lat N42.934197 Effort 2003
Site 1I DA? N Long W078.234814 Gear BPS Site 3F DA? N Long W078.638859 Gear BPS
CACO X AMRU X LECY X MIDO X NOMP X HYNI X LEGI X MISA X
HYNI X
NOCR X AMRU X LEMA X ETCA X
CACO X
NOHU X LECY X MIDO X ETNI X
Date 7/10/14 Catg S Lat N42.8756 Effort 1816 Date 7/11/14 Catg S Lat N43.078699 Effort 3815
Site 4B DA? N Long W078.757651 Gear BPS Site 1H DA? N Long W078.518647 Gear BPS
CAAN X NOFL X LEGI X ETCA X CAAN X CACO X LECY X MISA X
NOMP X AMRU X LEMA X ETNI X CAAU X AMNE X LEGI X ETNI X
NOCR X LECY X MIDO X PECA X CYCA X AMRU X LEMA X PEMA X
NOHU X
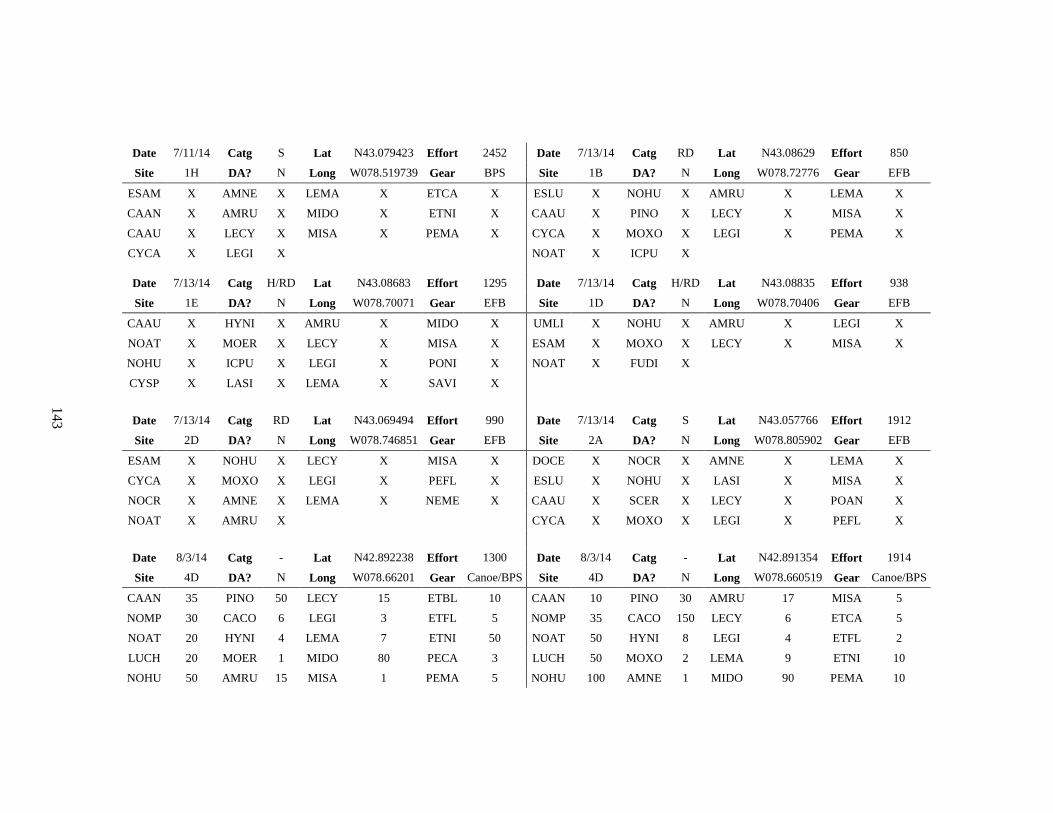
143
Date 7/11/14 Catg S Lat N43.079423 Effort 2452 Date 7/13/14 Catg RD Lat N43.08629 Effort 850
Site 1H DA? N Long W078.519739 Gear BPS Site 1B DA? N Long W078.72776 Gear EFB
ESAM X AMNE X LEMA X ETCA X ESLU X NOHU X AMRU X LEMA X
CAAN X AMRU X MIDO X ETNI X CAAU X PINO X LECY X MISA X
CAAU X LECY X MISA X PEMA X CYCA X MOXO X LEGI X PEMA X
CYCA X LEGI X
NOAT X ICPU X
Date 7/13/14 Catg H/RD Lat N43.08683 Effort 1295 Date 7/13/14 Catg H/RD Lat N43.08835 Effort 938
Site 1E DA? N Long W078.70071 Gear EFB Site 1D DA? N Long W078.70406 Gear EFB
CAAU X HYNI X AMRU X MIDO X UMLI X NOHU X AMRU X LEGI X
NOAT X MOER X LECY X MISA X ESAM X MOXO X LECY X MISA X
NOHU X ICPU X LEGI X PONI X NOAT X FUDI X
CYSP X LASI X LEMA X SAVI X
Date 7/13/14 Catg RD Lat N43.069494 Effort 990 Date 7/13/14 Catg S Lat N43.057766 Effort 1912
Site 2D DA? N Long W078.746851 Gear EFB Site 2A DA? N Long W078.805902 Gear EFB
ESAM X NOHU X LECY X MISA X DOCE X NOCR X AMNE X LEMA X
CYCA X MOXO X LEGI X PEFL X ESLU X NOHU X LASI X MISA X
NOCR X AMNE X LEMA X NEME X CAAU X SCER X LECY X POAN X
NOAT X AMRU X
CYCA X MOXO X LEGI X PEFL X
Date 8/3/14 Catg - Lat N42.892238 Effort 1300 Date 8/3/14 Catg - Lat N42.891354 Effort 1914
Site 4D DA? N Long W078.66201 Gear Canoe/BPS Site 4D DA? N Long W078.660519 Gear Canoe/BPS
CAAN 35 PINO 50 LECY 15 ETBL 10 CAAN 10 PINO 30 AMRU 17 MISA 5
NOMP 30 CACO 6 LEGI 3 ETFL 5 NOMP 35 CACO 150 LECY 6 ETCA 5
NOAT 20 HYNI 4 LEMA 7 ETNI 50 NOAT 50 HYNI 8 LEGI 4 ETFL 2
LUCH 20 MOER 1 MIDO 80 PECA 3 LUCH 50 MOXO 2 LEMA 9 ETNI 10
NOHU 50 AMRU 15 MISA 1 PEMA 5 NOHU 100 AMNE 1 MIDO 90 PEMA 10
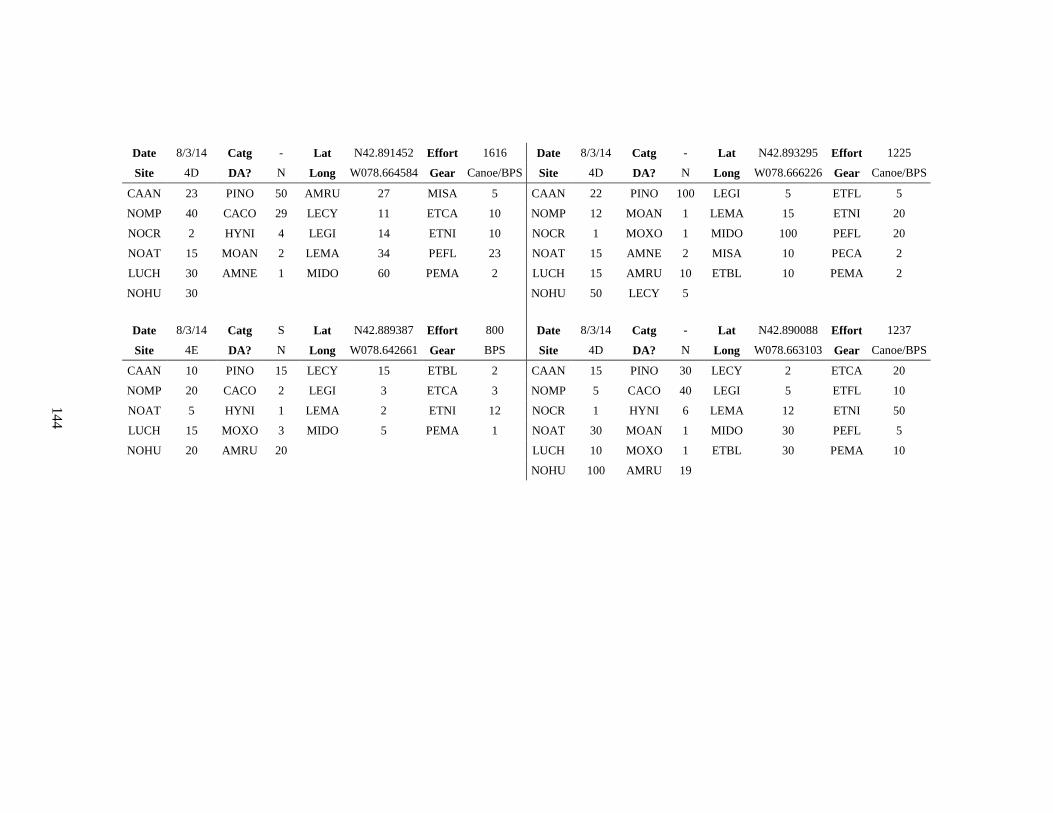
144
Date 8/3/14 Catg - Lat N42.891452 Effort 1616 Date 8/3/14 Catg - Lat N42.893295 Effort 1225
Site 4D DA? N Long W078.664584 Gear Canoe/BPS Site 4D DA? N Long W078.666226 Gear Canoe/BPS
CAAN 23 PINO 50 AMRU 27 MISA 5 CAAN 22 PINO 100 LEGI 5 ETFL 5
NOMP 40 CACO 29 LECY 11 ETCA 10 NOMP 12 MOAN 1 LEMA 15 ETNI 20
NOCR 2 HYNI 4 LEGI 14 ETNI 10 NOCR 1 MOXO 1 MIDO 100 PEFL 20
NOAT 15 MOAN 2 LEMA 34 PEFL 23 NOAT 15 AMNE 2 MISA 10 PECA 2
LUCH 30 AMNE 1 MIDO 60 PEMA 2 LUCH 15 AMRU 10 ETBL 10 PEMA 2
NOHU 30
NOHU 50 LECY 5
Date 8/3/14 Catg S Lat N42.889387 Effort 800 Date 8/3/14 Catg - Lat N42.890088 Effort 1237
Site 4E DA? N Long W078.642661 Gear BPS Site 4D DA? N Long W078.663103 Gear Canoe/BPS
CAAN 10 PINO 15 LECY 15 ETBL 2 CAAN 15 PINO 30 LECY 2 ETCA 20
NOMP 20 CACO 2 LEGI 3 ETCA 3 NOMP 5 CACO 40 LEGI 5 ETFL 10
NOAT 5 HYNI 1 LEMA 2 ETNI 12 NOCR 1 HYNI 6 LEMA 12 ETNI 50
LUCH 15 MOXO 3 MIDO 5 PEMA 1 NOAT 30 MOAN 1 MIDO 30 PEFL 5
NOHU 20 AMRU 20
LUCH 10 MOXO 1 ETBL 30 PEMA 10
NOHU 100 AMRU 19