Embed Size (px)
Citation preview
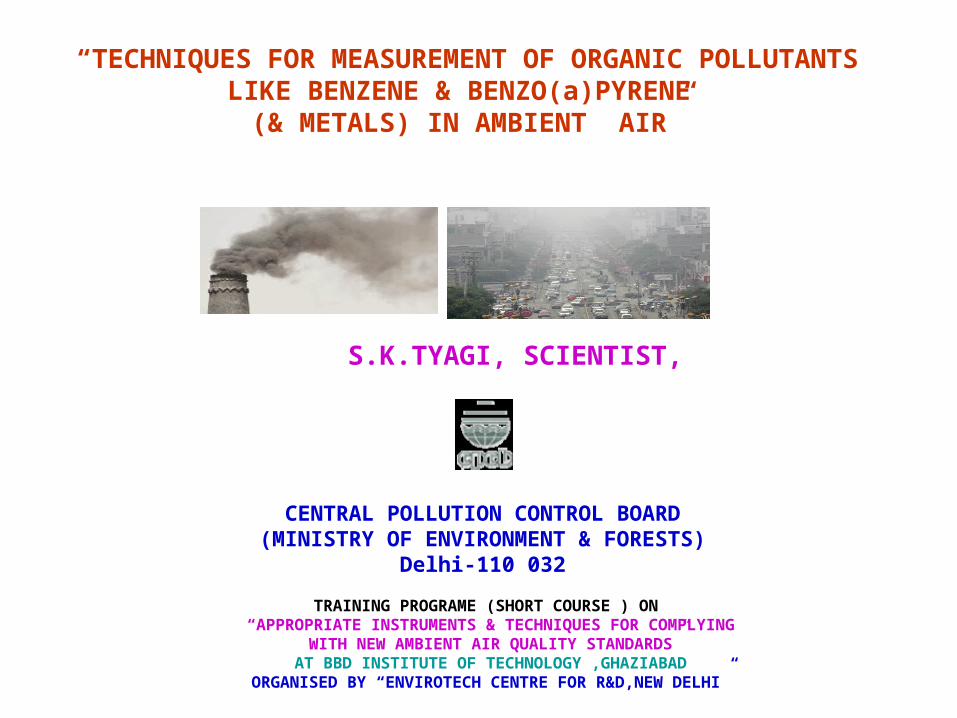
“TECHNIQUES FOR MEASUREMENT OF ORGANIC POLLUTANTS LIKE BENZENE & BENZO(a)PYRENE
(& METALS) IN AMBIENT AIR”
S.K.TYAGI, SCIENTIST,
CENTRAL POLLUTION CONTROL BOARD(MINISTRY OF ENVIRONMENT & FORESTS)
Delhi-110 032
TRAINING PROGRAME (SHORT COURSE ) ON “APPROPRIATE INSTRUMENTS & TECHNIQUES FOR COMPLYING
WITH NEW AMBIENT AIR QUALITY STANDARDS”AT BBD INSTITUTE OF TECHNOLOGY ,GHAZIABAD
ORGANISED BY “ENVIROTECH CENTRE FOR R&D,NEW DELHI”
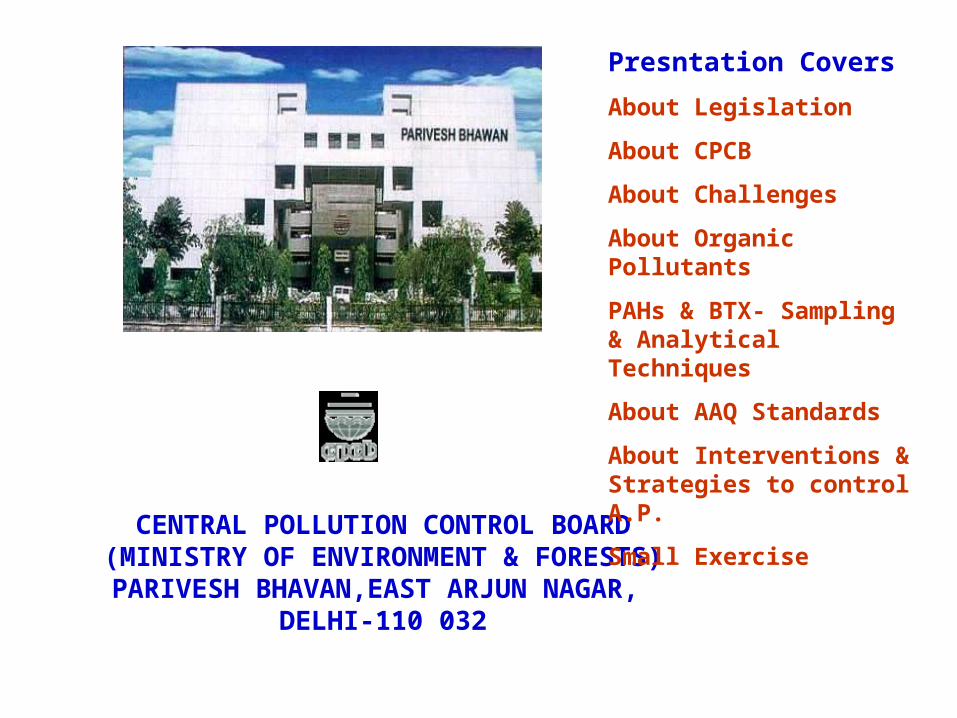
CENTRAL POLLUTION CONTROL BOARD(MINISTRY OF ENVIRONMENT & FORESTS)PARIVESH BHAVAN,EAST ARJUN NAGAR,
DELHI-110 032
Presntation CoversAbout Legislation
About CPCB
About Challenges
About Organic Pollutants
PAHs & BTX- Sampling & Analytical Techniques
About AAQ Standards
About Interventions & Strategies to control A.P.
Small Exercise
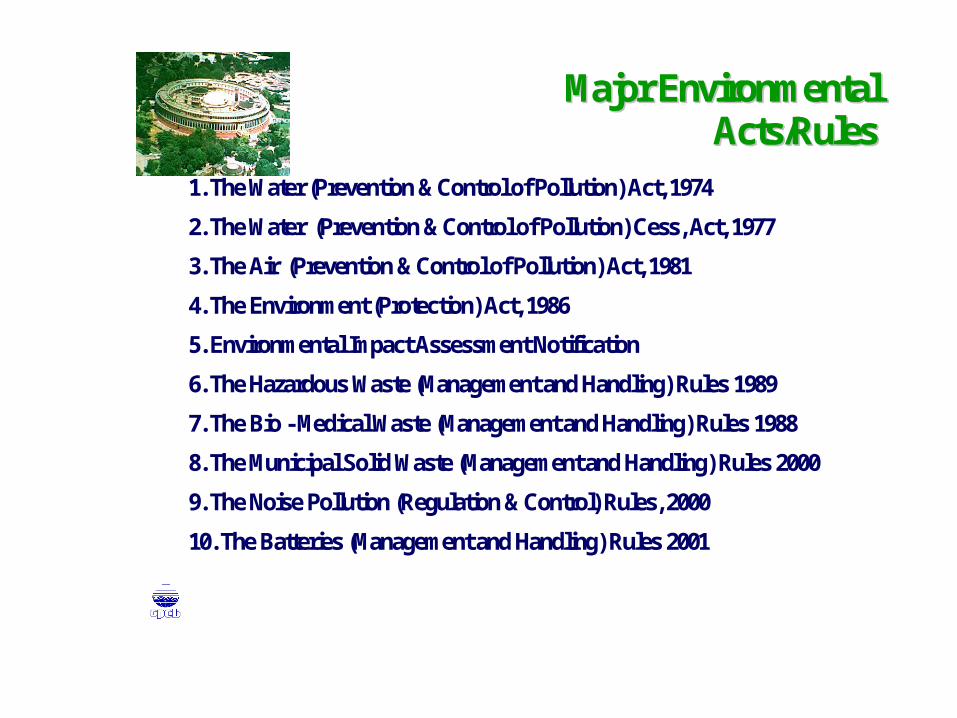
1. The Water (Prevention & Control of Pollution) Act, 1974
2. The Water (Prevention & Control of Pollution) Cess, Act, 1977 3. The Air (Prevention & Control of Pollution) Act, 1981
4. The Environment (Protection) Act, 19865. Environmental Impact Assessment Notification
6. The Hazardous Waste (Management and Handling) Rules 1989
7. The Bio - Medical Waste (Management and Handling) Rules 19888. The Municipal Solid Waste (Management and Handling) Rules 2000
9. The Noise Pollution (Regulation & Control) Rules, 2000
10. The Batteries (Management and Handling) Rules 2001
Major Environmental Major Environmental Acts/RulesActs/Rules
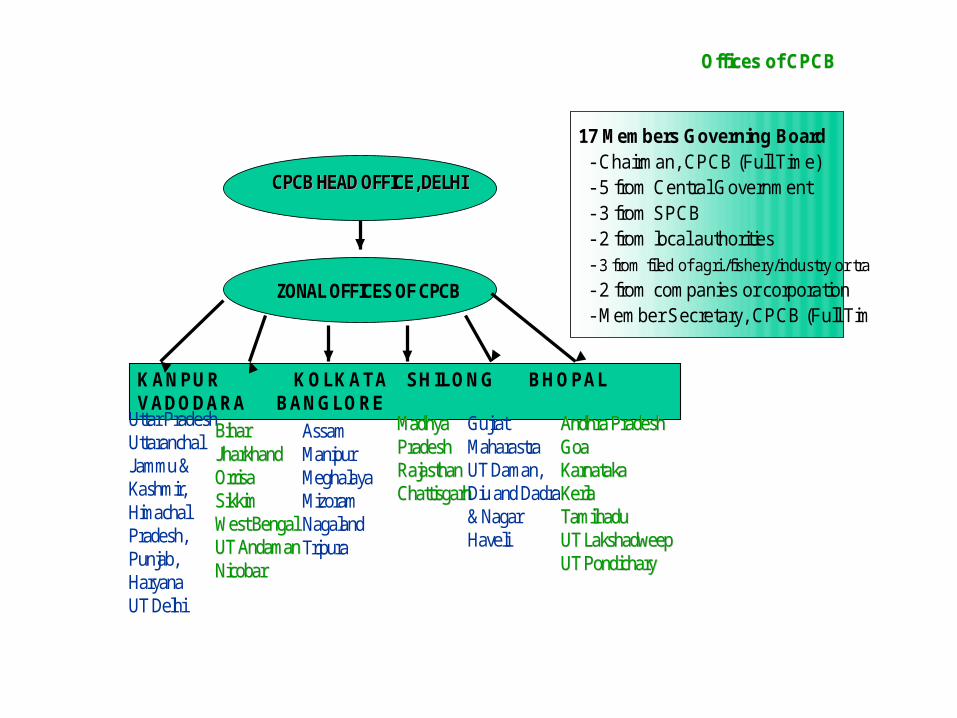
CPCB HEAD OFFICE, DELHICPCB HEAD OFFICE, DELHI
KANPUR KOLKATA SHILONG BHOPAL VADODARA BANGLORE
Uttar PradeshUttaranchalJammu &Kashmir, Himachal Pradesh,Punjab, Haryana UT Delhi
BiharBiharJharkhandJharkhandOrrisaOrrisaSikkimSikkimWest BengalWest BengalUT AndamanUT AndamanNicobarNicobar
AssamManipurMeghalayaMizoramNagalandTripura
MadhyaMadhyaPradeshPradeshRajasthanRajasthanChattisgarhChattisgarh
GujratMaharastraUT Daman,Diu and Dadra& NagarHaveli
Andhra PradeshAndhra PradeshGoaGoaKarnatakaKarnatakaKerlaKerlaTamilnaduTamilnaduUT LakshadweepUT LakshadweepUT UT PondicharyPondichary
ZONAL OFFICES OF CPCB
Offices of CPCB Offices of CPCB
17 Members Governing Board- Chairman, CPCB (Full Time)- 5 from Central Government- 3 from SPCB- 2 from local authorities- 3 from filed of agri./fishery/industry or trade- 2 from companies or corporation- Member Secretary, CPCB (Full Time)
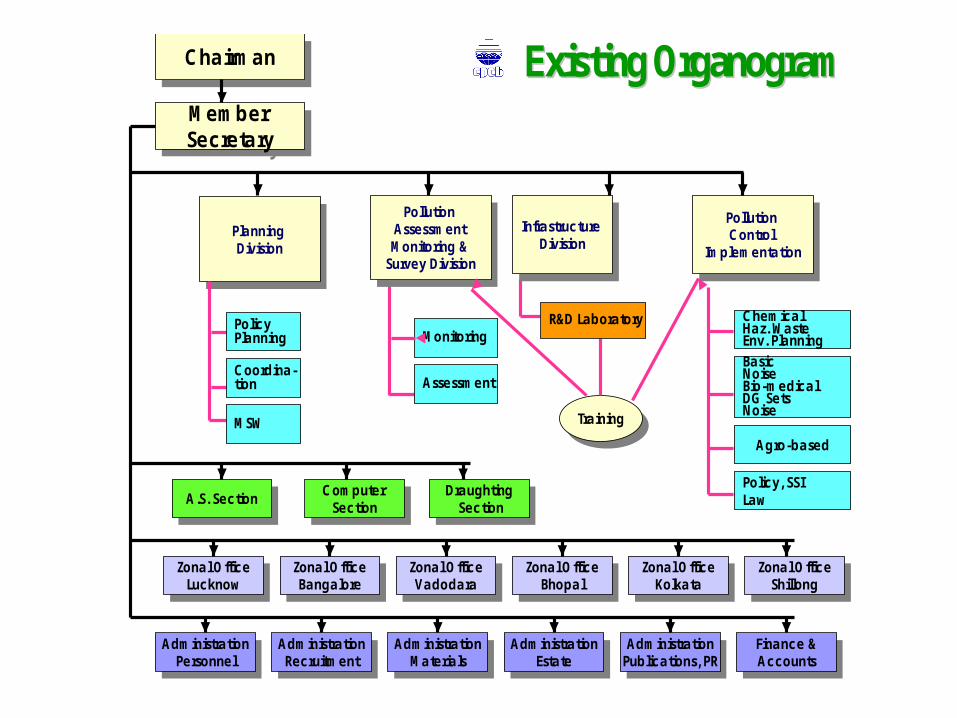
Member SecretaryMember Secretary
ChairmanChairman
Planning Division
Planning Division
Pollution Assessment Monitoring &
Survey Division
Pollution Assessment Monitoring &
Survey Division
Infrastructure Division
Infrastructure Division
Pollution Control
Implementation
Pollution Control
Implementation
Zonal OfficeLucknow
Zonal OfficeLucknow Zonal Office
VadodaraZonal OfficeVadodara Zonal Office
BhopalZonal Office
Bhopal Zonal OfficeKolkata
Zonal OfficeKolkata Zonal Office
ShillongZonal Office
ShillongZonal OfficeBangalore
Zonal OfficeBangalore
AdministrationPersonnel
AdministrationPersonnel Administration
MaterialsAdministration
Materials AdministrationEstate
AdministrationEstate Administration
Publications, PRAdministrationPublications, PR Finance &
AccountsFinance &AccountsAdministration
RecruitmentAdministrationRecruitment
A.S. SectionA.S. Section Computer Section
Computer Section
TrainingTraining
ChemicalHaz. WasteEnv. PlanningBasicNoiseBio-medicalDG SetsNoise
Agro-based
Policy, SSILaw
R&D LaboratoryMonitoring
Assessment
PolicyPlanning
MSW
Coordina-tion
DraughtingSection
DraughtingSection
Existing Existing OrganogramOrganogram
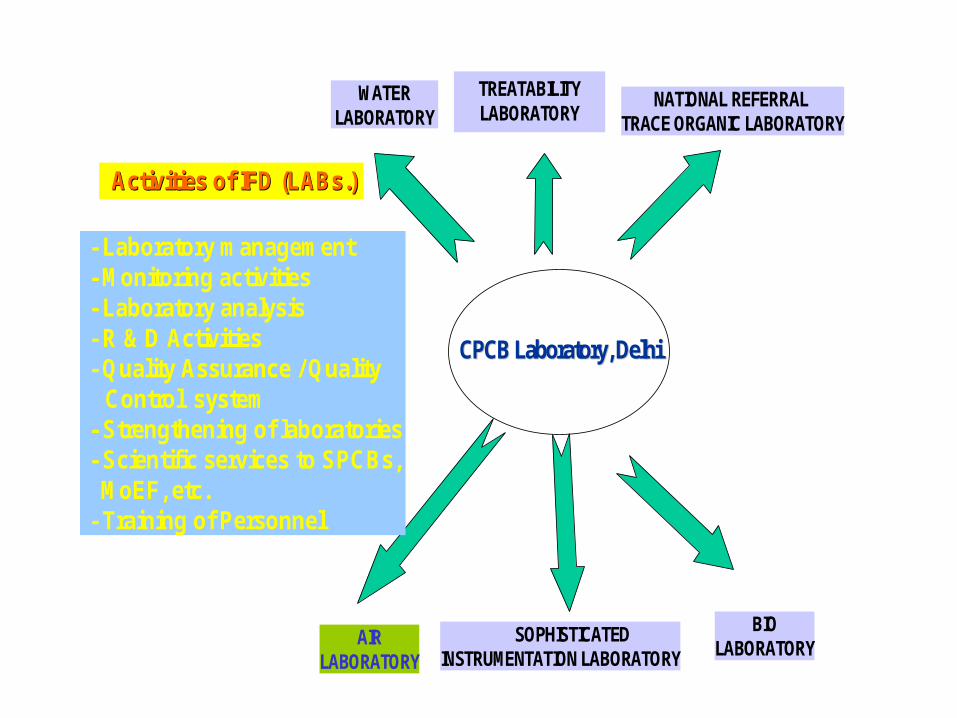
Activities of IFD (Activities of IFD (LABsLABs.) .)
CPCB Laboratory, DelhiCPCB Laboratory, Delhi
WATERLABORATORY
AIRLABORATORY
SOPHISTICATEDINSTRUMENTATION LABORATORY
BIOLABORATORY
TREATABILITYLABORATORY
NATIONAL REFERRAL TRACE ORGANIC LABORATORY
- Laboratory management- Monitoring activities- Laboratory analysis- R & D Activities- Quality Assurance / Quality
Control system- Strengthening of laboratories- Scientific services to SPCBs,MoEF, etc.
- Training of Personnel
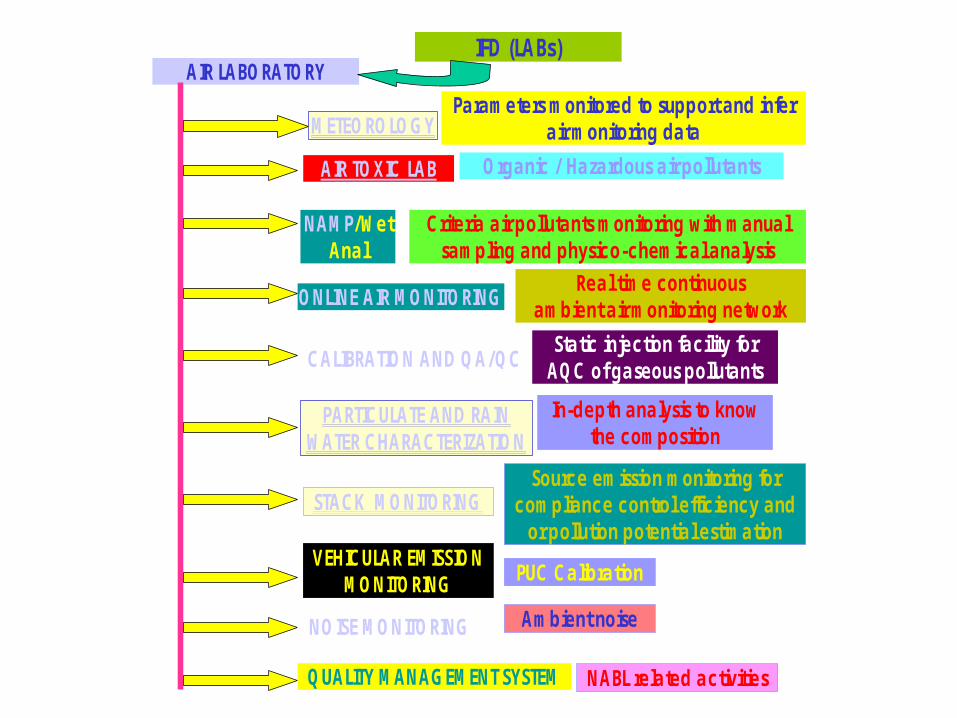
AIR LABORATORYIFD (LABs)
AIR TOXIC LABMETEOROLOGY
NAMP/Wet Anal
ONLINE AIR MONITORING
STACK MONITORING
PARTICULATE AND RAIN WATER CHARACTERIZATION
CALIBRATION AND QA/QC
Parameters monitored to support and infer air monitoring data
Organic / Hazardous air pollutants
Criteria air pollutants monitoring with manual sampling and physico-chemical analysis
Real time continuous ambient air monitoring network
Static injection facility for AQC of gaseous pollutants
QUALITY MANAGEMENT SYSTEM
In-depth analysis to know the composition
Source emission monitoring for compliance control efficiency and
or pollution potential estimationVEHICULAR EMISSION
MONITORING PUC Calibration
NABL related activities
NOISE MONITORING Ambient noise
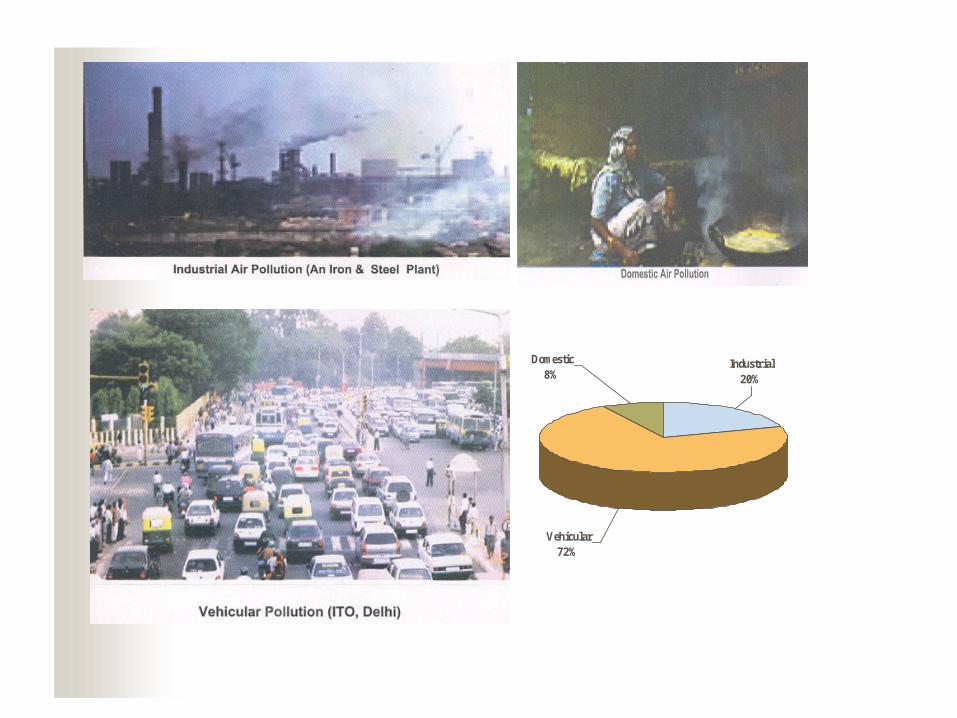
Domestic8%
Vehicular72%
Industrial20%
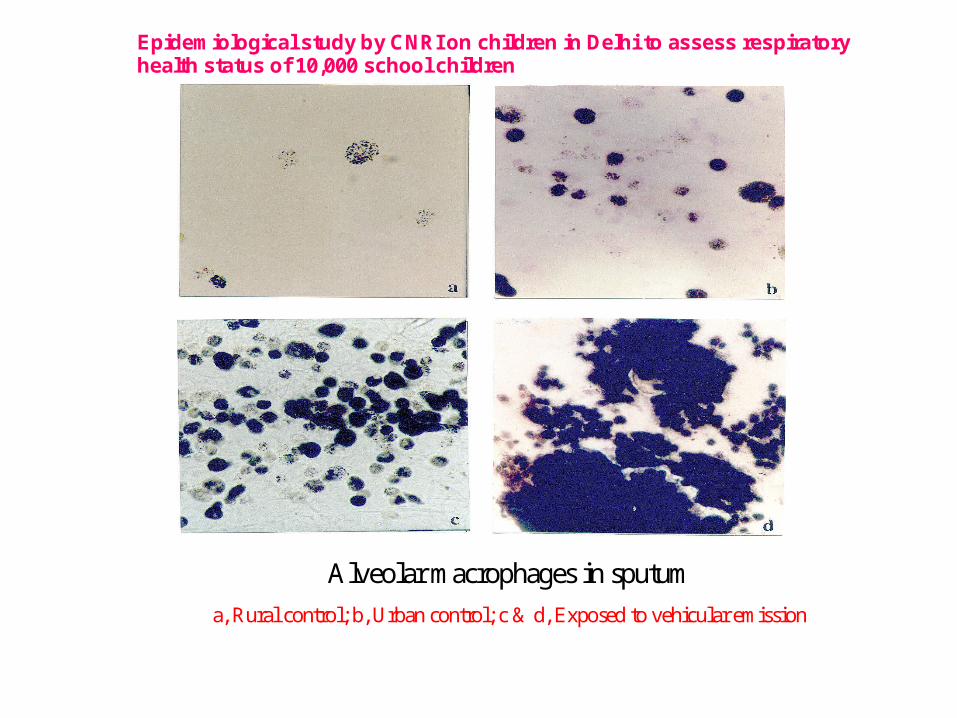
Alveolar macrophages in sputuma, Rural control; b, Urban control; c & d, Exposed to vehicular emission
Epidemiological study by CNRI on children in Delhi to assess respiratory health status of 10,000 school children
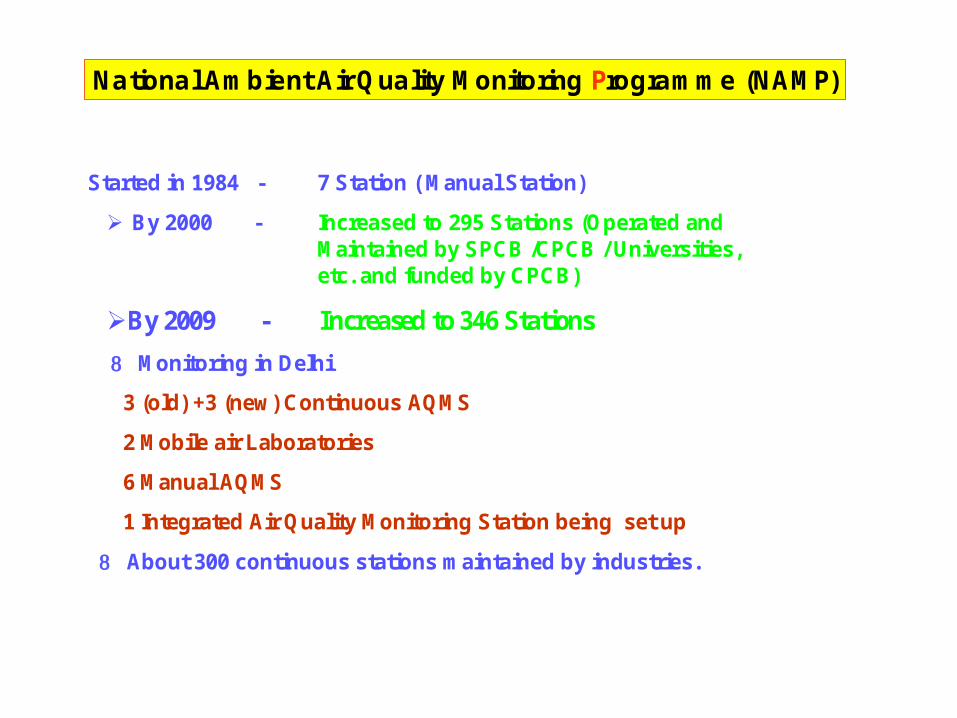
National Ambient Air Quality Monitoring Programme (NAMP)
Started in 1984 - 7 Station ( Manual Station)
By 2000 - Increased to 295 Stations (Operated and Maintained by SPCB /CPCB / Universities, etc. and funded by CPCB)
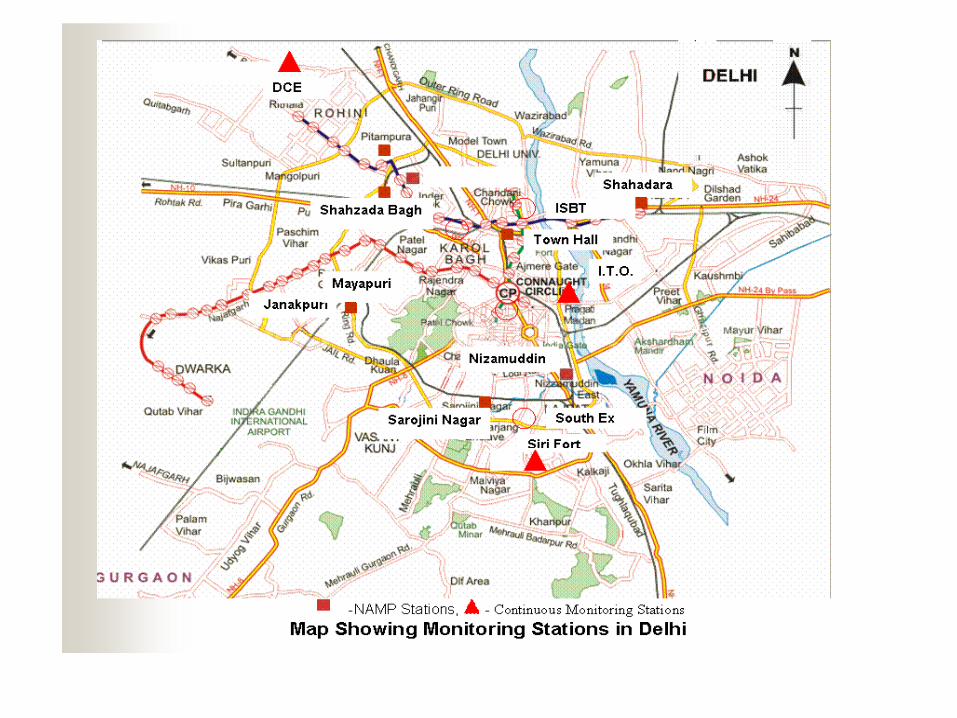
By 2009 - Increased to 346 Stations Monitoring in Delhi
3 (old) +3 (new) Continuous AQMS
2 Mobile air Laboratories
6 Manual AQMS
1 Integrated Air Quality Monitoring Station being set up
About 300 continuous stations maintained by industries.
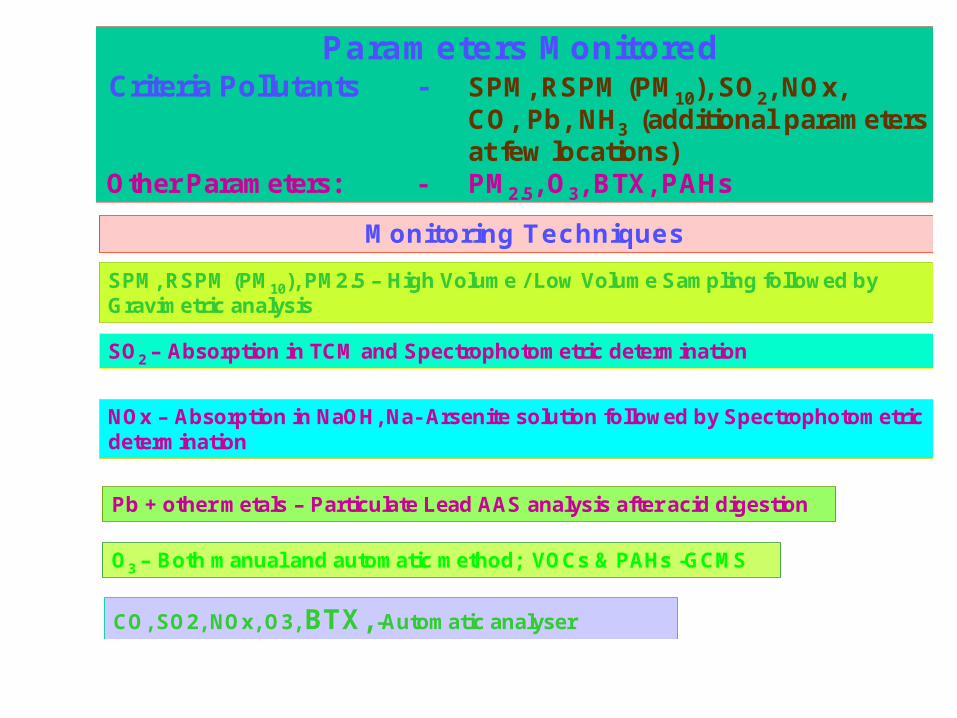
Parameters MonitoredCriteria Pollutants - SPM, RSPM (PM10), SO2, NOx,
CO, Pb, NH3 (additional parameters at few locations)
Other Parameters: - PM2.5, O3, BTX, PAHs
Monitoring Techniques
SO2 – Absorption in TCM and Spectrophotometric determination
SPM, RSPM (PM10), PM2.5 – High Volume / Low Volume Sampling followed by Gravimetric analysis
NOx – Absorption in NaOH, Na- Arsenite solution followed by Spectrophotometricdetermination
Pb + other metals – Particulate Lead AAS analysis after acid digestion
O3 – Both manual and automatic method; VOCs & PAHs -GCMS
CO, SO2, NOx, O3, BTX, -Automatic analyser
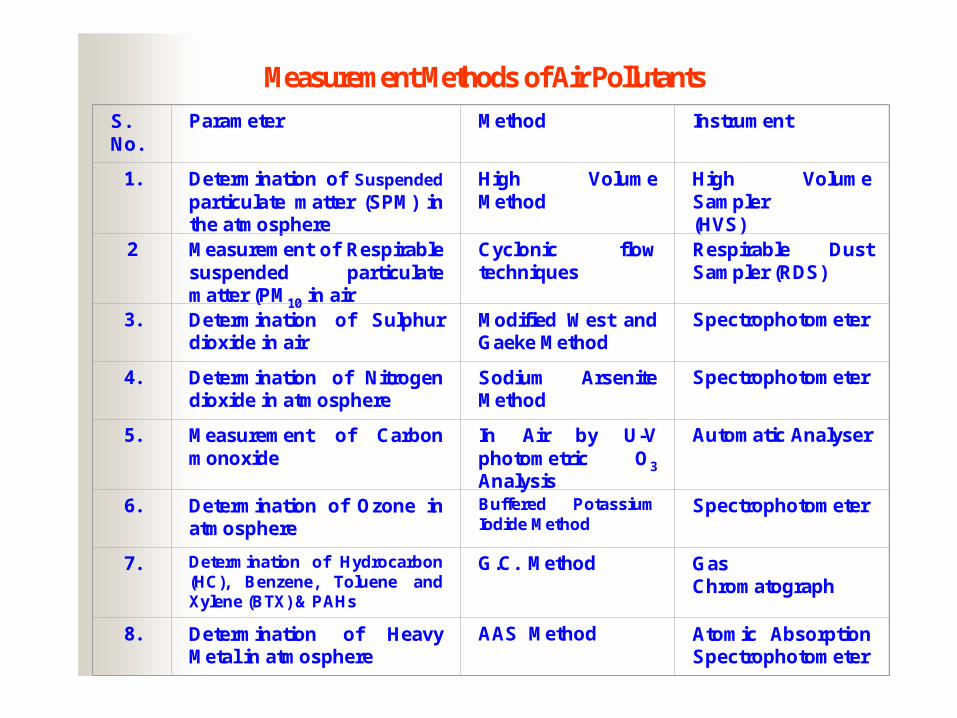
S. No.
Parameter Method Instrument
1. Determination of Suspendedparticulate matter (SPM) in the atmosphere
High Volume Method
High Volume Sampler(HVS)
2 Measurement of Respirable suspended particulate matter (PM10 in air
Cyclonic flow techniques
Respirable Dust Sampler (RDS)
3. Determination of Sulphur dioxide in air
Modified West and Gaeke Method
Spectrophotometer
4. Determination of Nitrogen dioxide in atmosphere
Sodium Arsenite Method
Spectrophotometer
5. Measurement of Carbon monoxide
In Air by U-V photometric O3Analysis
Automatic Analyser
6. Determination of Ozone in atmosphere
Buffered Potassium Iodide Method
Spectrophotometer
7. Determination of Hydrocarbon (HC), Benzene, Toluene and Xylene (BTX) & PAHs
G.C. Method Gas Chromatograph
8. Determination of Heavy Metal in atmosphere
AAS Method Atomic Absorption Spectrophotometer
Measurement Methods of Air Pollutants
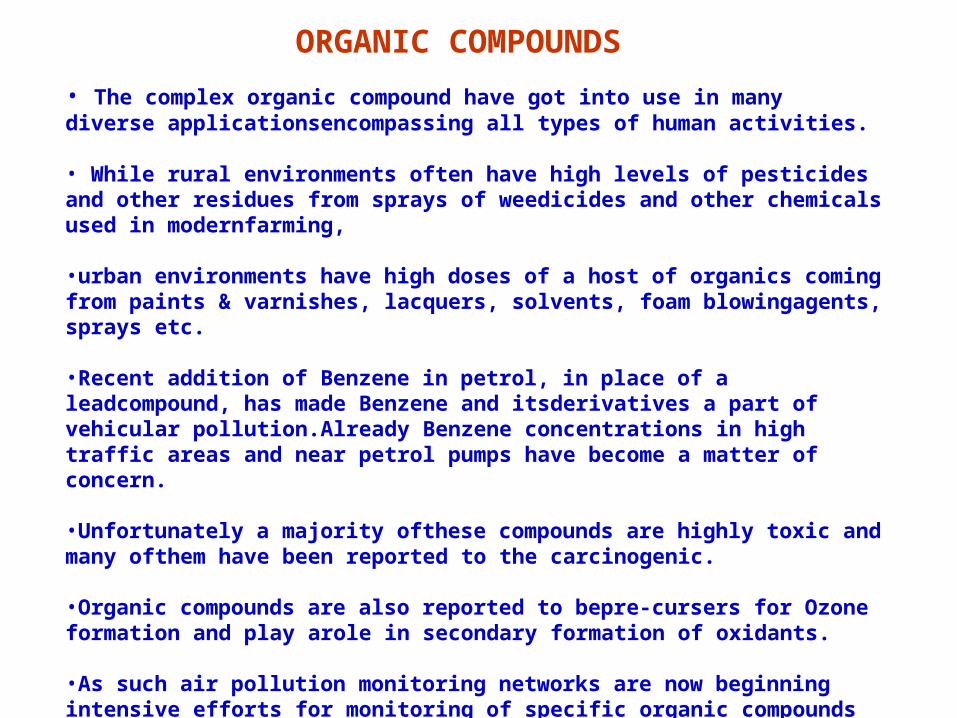
• The complex organic compound have got into use in many diverse applicationsencompassing all types of human activities.
• While rural environments often have high levels of pesticides and other residues from sprays of weedicides and other chemicals used in modernfarming,
•urban environments have high doses of a host of organics coming from paints & varnishes, lacquers, solvents, foam blowingagents, sprays etc.
•Recent addition of Benzene in petrol, in place of a leadcompound, has made Benzene and itsderivatives a part of vehicular pollution.Already Benzene concentrations in high traffic areas and near petrol pumps have become a matter of concern.
•Unfortunately a majority ofthese compounds are highly toxic and many ofthem have been reported to the carcinogenic.
•Organic compounds are also reported to bepre-cursers for Ozone formation and play arole in secondary formation of oxidants.
•As such air pollution monitoring networks are now beginning intensive efforts for monitoring of specific organic compounds such as Benzene,Toluene & Xylene (BTX)and often a mixture of polynuclear aromatic hydrocarbons (PAHS) .
ORGANIC COMPOUNDS
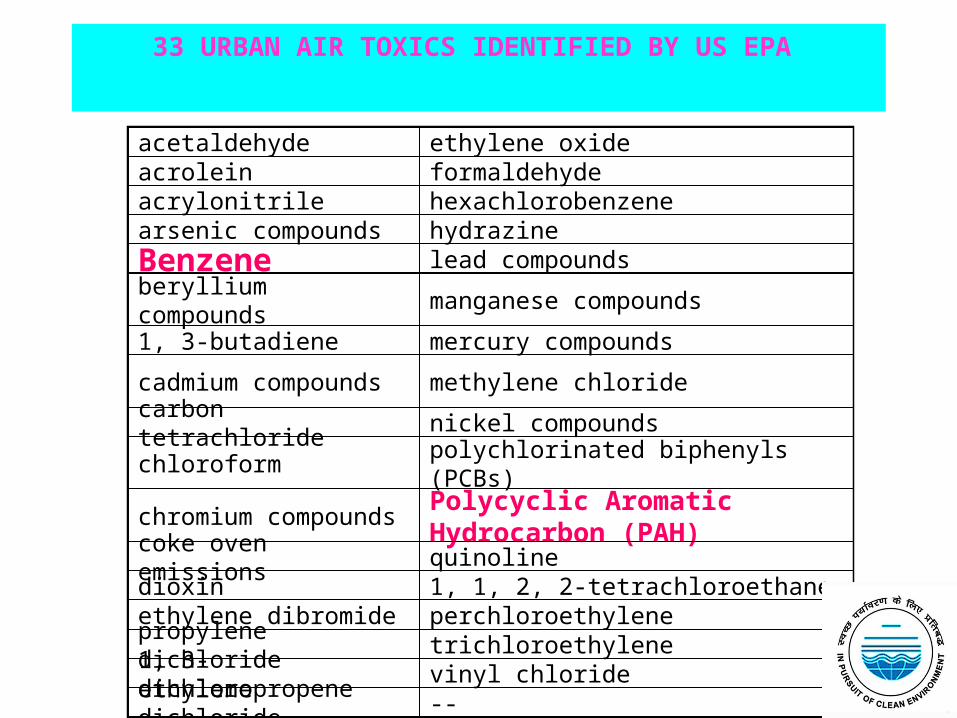
33 URBAN AIR TOXICS IDENTIFIED BY US EPA
acetaldehyde ethylene oxideacrolein formaldehydeacrylonitrile hexachlorobenzenearsenic compounds hydrazineBenzene lead compounds
beryllium compounds manganese compounds
1, 3-butadiene mercury compounds
cadmium compounds methylene chloride
carbon tetrachloride nickel compounds
chloroform polychlorinated biphenyls (PCBs)
chromium compounds Polycyclic Aromatic Hydrocarbon (PAH)
coke oven emissions quinolinedioxin 1, 1, 2, 2-tetrachloroethaneethylene dibromide perchloroethylenepropylene dichloride trichloroethylene1, 3-dichloropropene vinyl chlorideethylene dichloride --
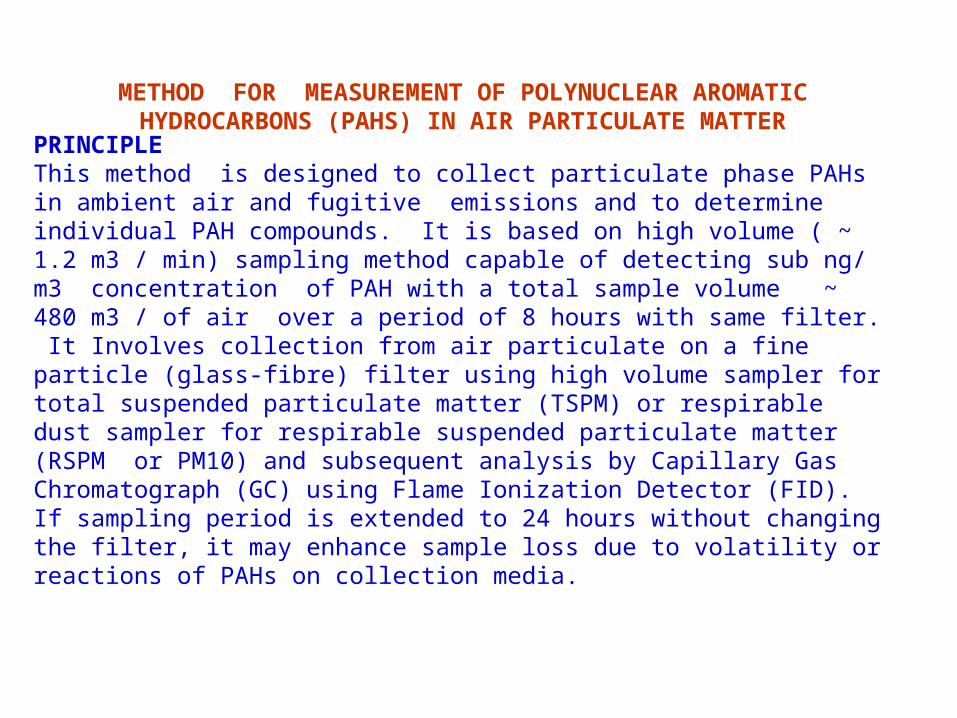
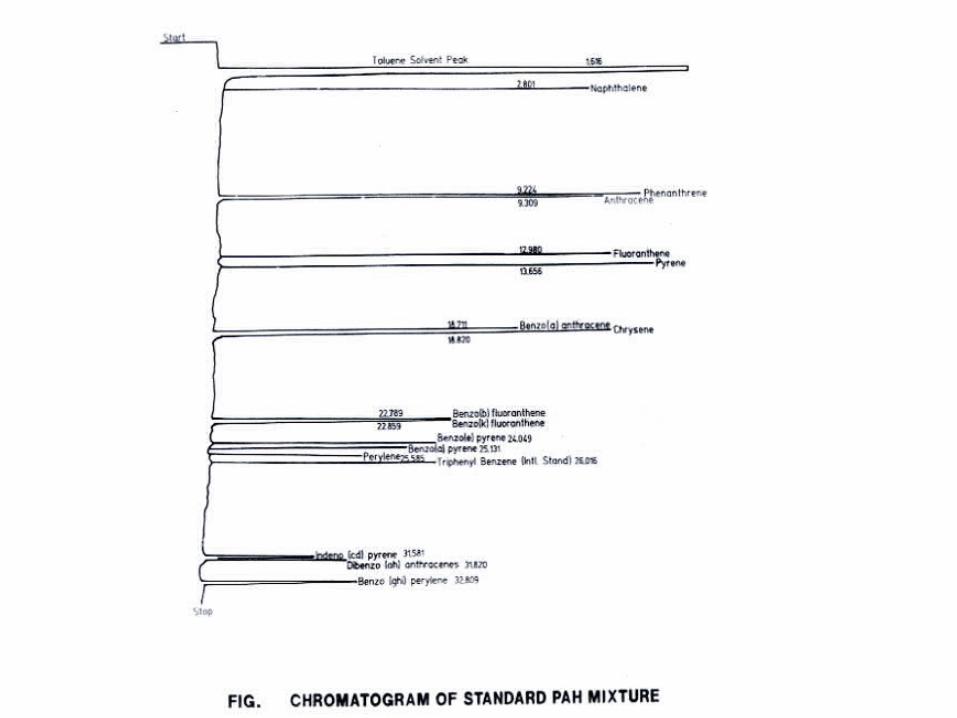
METHOD FOR MEASUREMENT OF POLYNUCLEAR AROMATIC HYDROCARBONS (PAHS) IN AIR PARTICULATE MATTER
PRINCIPLEThis method is designed to collect particulate phase PAHs in ambient air and fugitive emissions and to determine individual PAH compounds. It is based on high volume ( ~ 1.2 m3 / min) sampling method capable of detecting sub ng/ m3 concentration of PAH with a total sample volume ~ 480 m3 / of air over a period of 8 hours with same filter. It Involves collection from air particulate on a fine particle (glass-fibre) filter using high volume sampler for total suspended particulate matter (TSPM) or respirable dust sampler for respirable suspended particulate matter (RSPM or PM10) and subsequent analysis by Capillary Gas Chromatograph (GC) using Flame Ionization Detector (FID). If sampling period is extended to 24 hours without changing the filter, it may enhance sample loss due to volatility or reactions of PAHs on collection media.
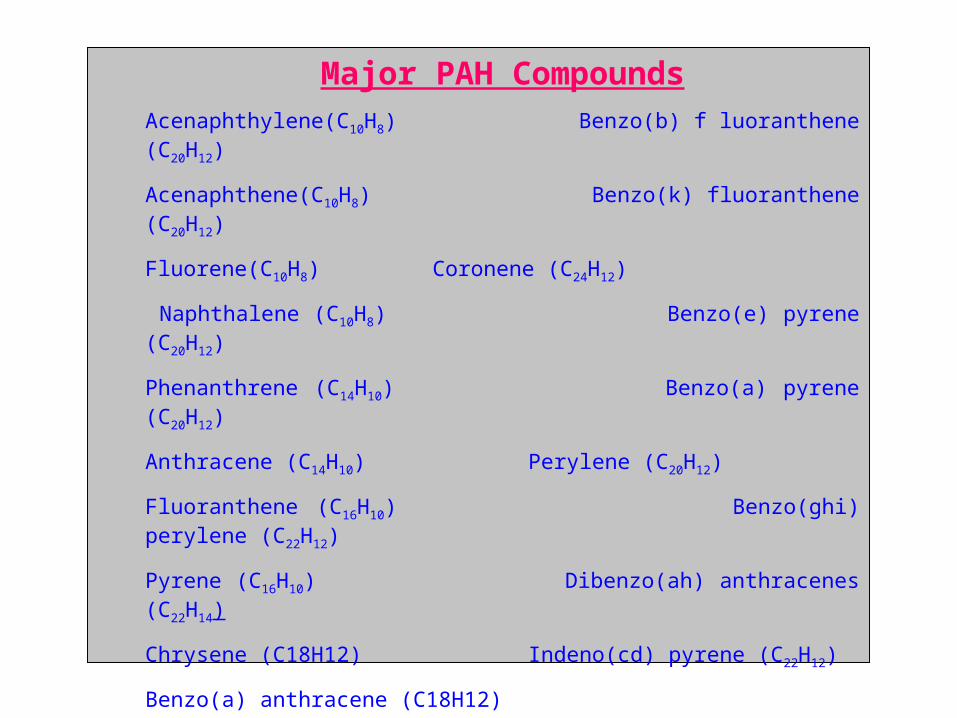
Major PAH CompoundsAcenaphthylene(C10H8) Benzo(b) f luoranthene (C20H12)Acenaphthene(C10H8) Benzo(k) fluoranthene (C20H12)Fluorene(C10H8) Coronene (C24H12) Naphthalene (C10H8) Benzo(e) pyrene (C20H12)
Phenanthrene (C14H10) Benzo(a) pyrene (C20H12)Anthracene (C14H10) Perylene (C20H12)Fluoranthene (C16H10) Benzo(ghi) perylene (C22H12)Pyrene (C16H10) Dibenzo(ah) anthracenes (C22H14)Chrysene (C18H12) Indeno(cd) pyrene (C22H12)Benzo(a) anthracene (C18H12)
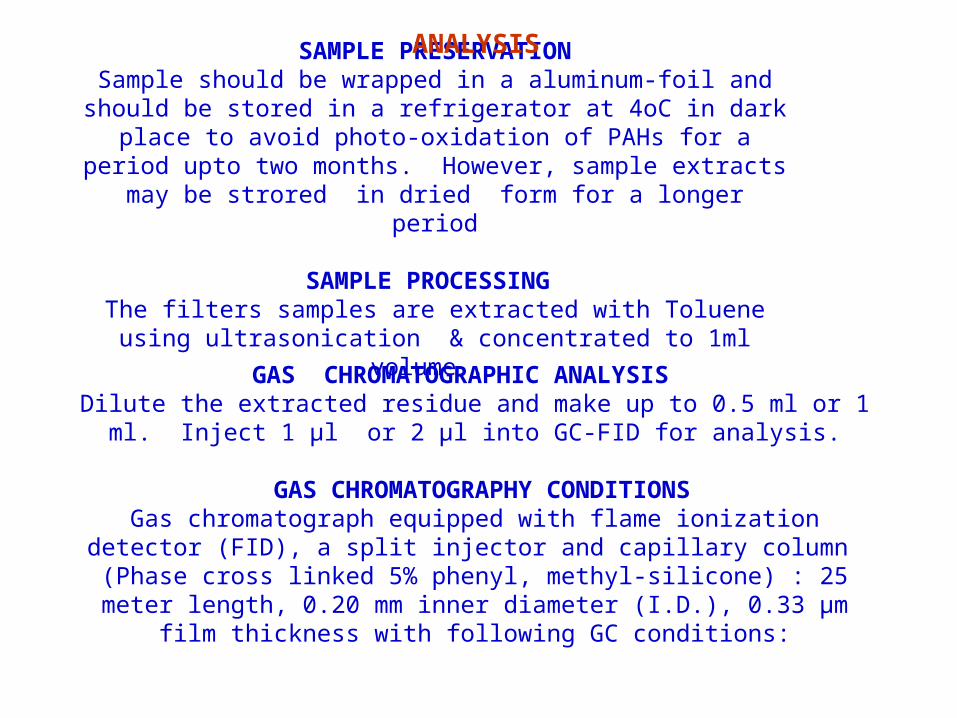
SAMPLE PRESERVATIONSample should be wrapped in a aluminum-foil and should be stored in a refrigerator at 4oC in dark place to avoid photo-
oxidation of PAHs for a period upto two months. However, sample extracts may be strored in dried form for a longer period
SAMPLE PROCESSING
The filters samples are extracted with Toluene using ultrasonication & concentrated to 1ml volume .
GAS CHROMATOGRAPHIC ANALYSIS Dilute the extracted residue and make up to 0.5 ml or 1 ml. Inject 1 µl or 2
µl into GC-FID for analysis.
GAS CHROMATOGRAPHY CONDITIONS Gas chromatograph equipped with flame ionization detector (FID), a split
injector and capillary column (Phase cross linked 5% phenyl, methyl-silicone) : 25 meter length, 0.20 mm inner diameter (I.D.), 0.33 µm film
thickness with following GC conditions:
ANALYSIS
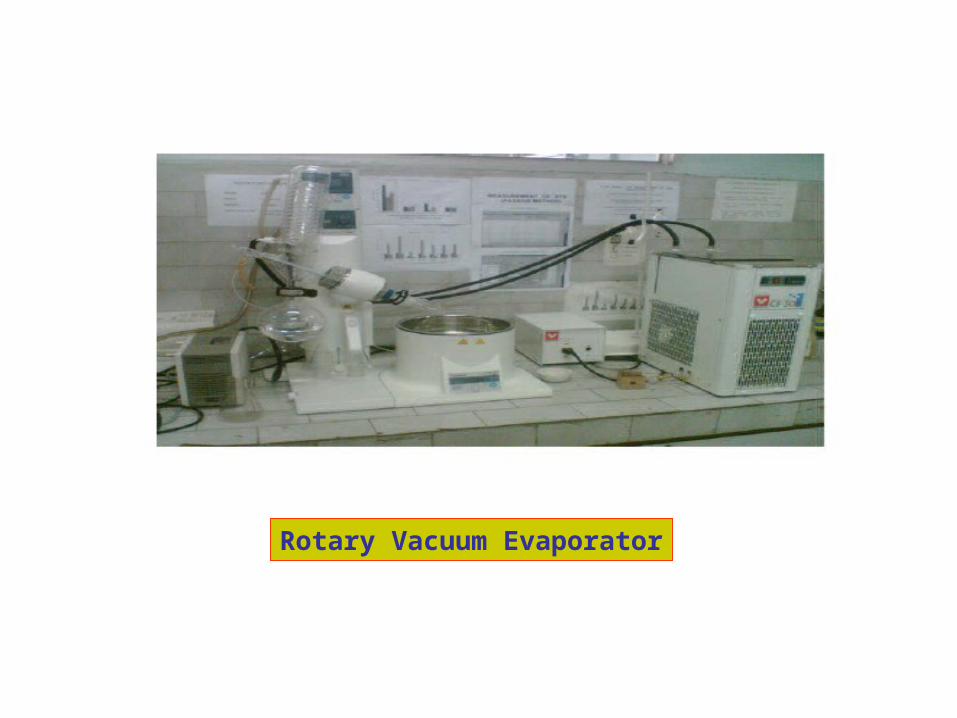
Rotary Vacuum Evaporator
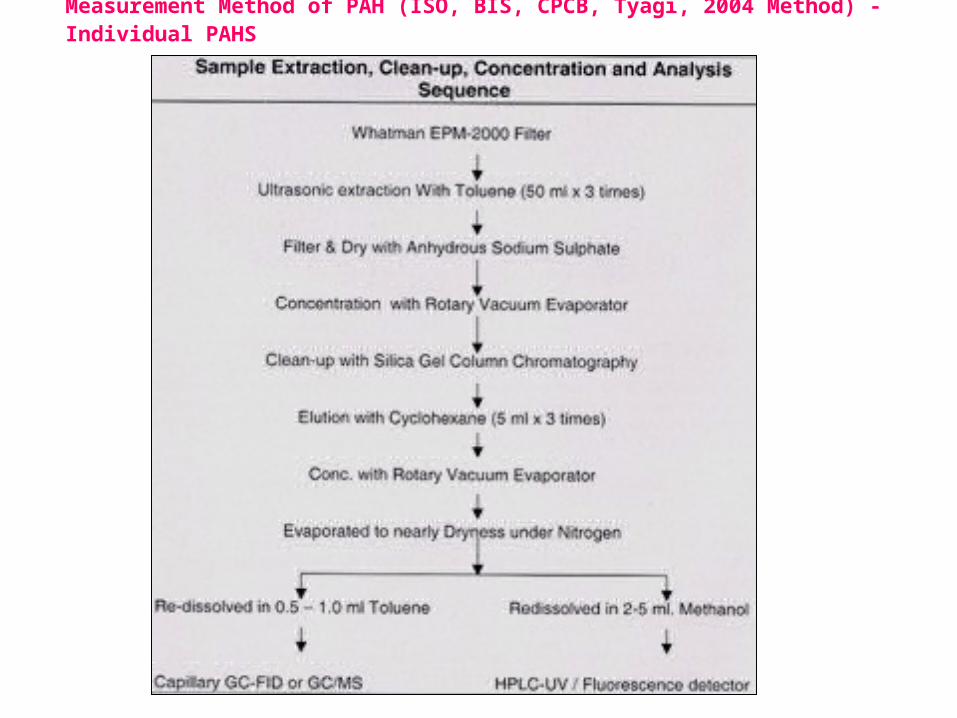
Measurement Method of PAH (ISO, BIS, CPCB, Tyagi, 2004 Method) - Individual PAHS
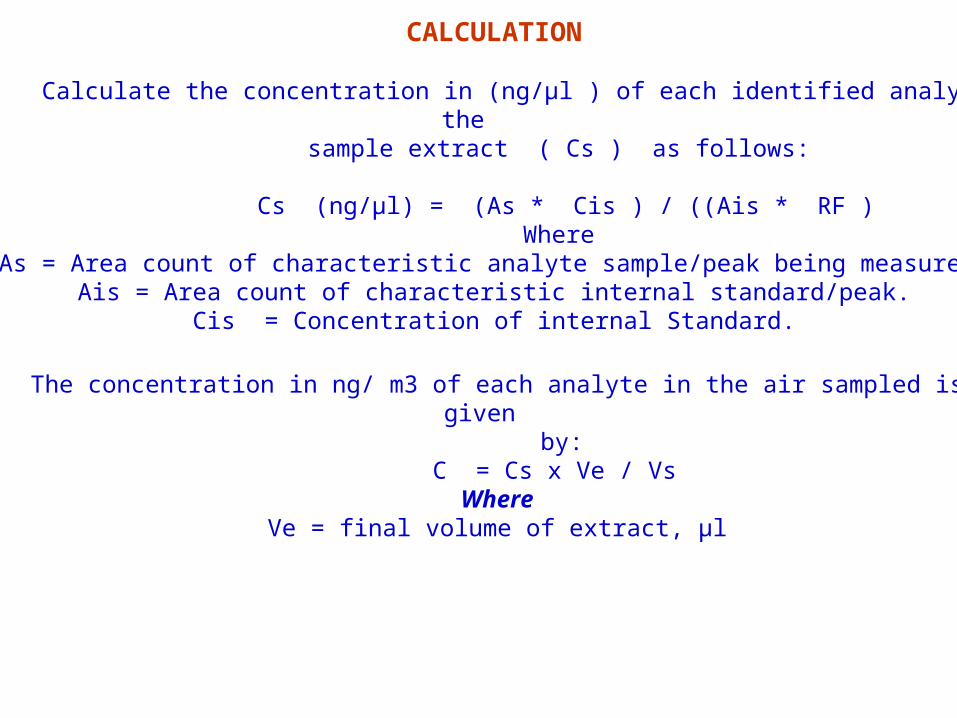
The concentration in ng/ m3 of each analyte in the air sampled is given by:
C = Cs x Ve / Vs Where
Ve = final volume of extract, µl
CALCULATION
7.1 Calculate the concentration in (ng/µl ) of each identified analyte in the
sample extract ( Cs ) as follows:
Cs (ng/µl) = (As * Cis ) / ((Ais * RF ) Where
As = Area count of characteristic analyte sample/peak being measured.
Ais = Area count of characteristic internal standard/peak.Cis = Concentration of internal Standard.
METHODS FOR MEASUREMENT OF BENZENE ,
TOLUENE & XYLENE (BTX) IN AIR
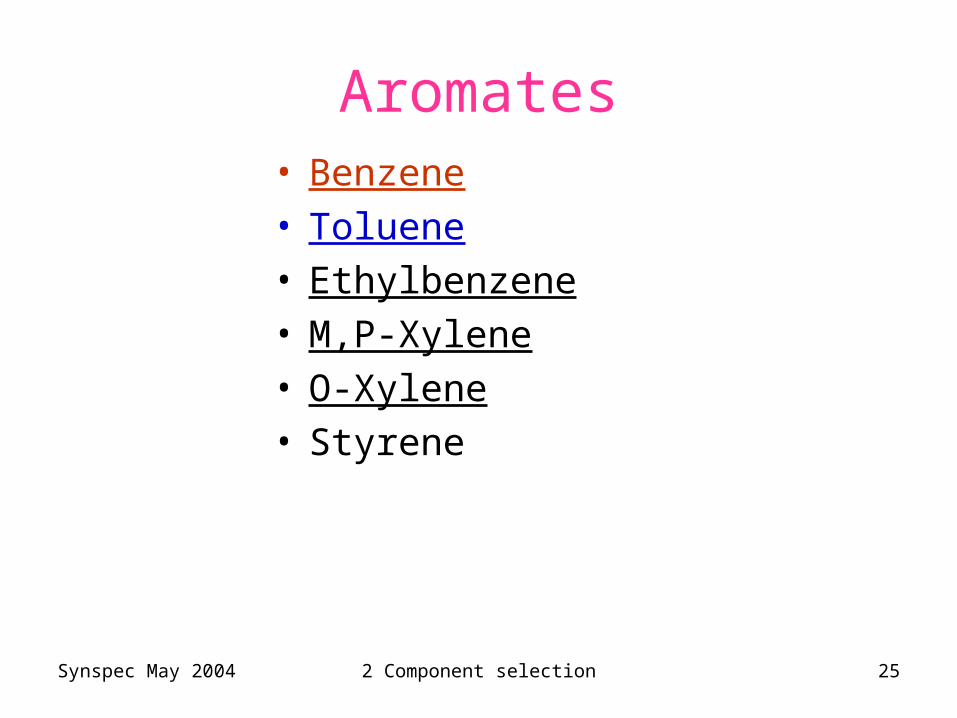
Synspec May 2004 2 Component selection 25
Aromates• Benzene• Toluene• Ethylbenzene• M,P-Xylene• O-Xylene• Styrene
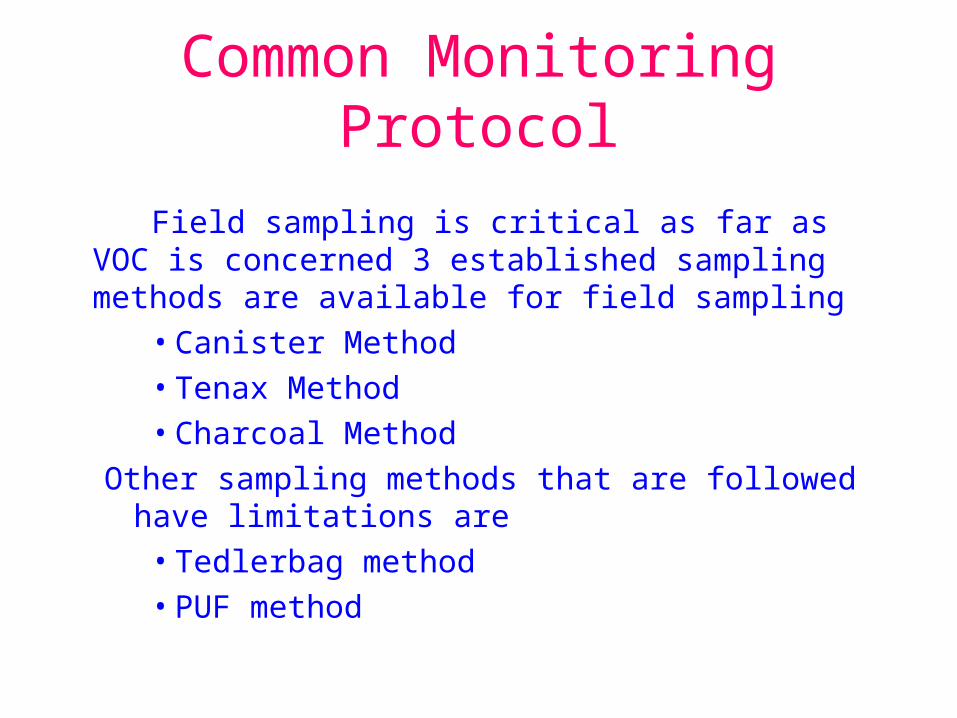
Common Monitoring Protocol Field sampling is critical as far as VOC is concerned 3
established sampling methods are available for field sampling
• Canister Method• Tenax Method• Charcoal Method
Other sampling methods that are followed have limitations are
• Tedlerbag method• PUF method
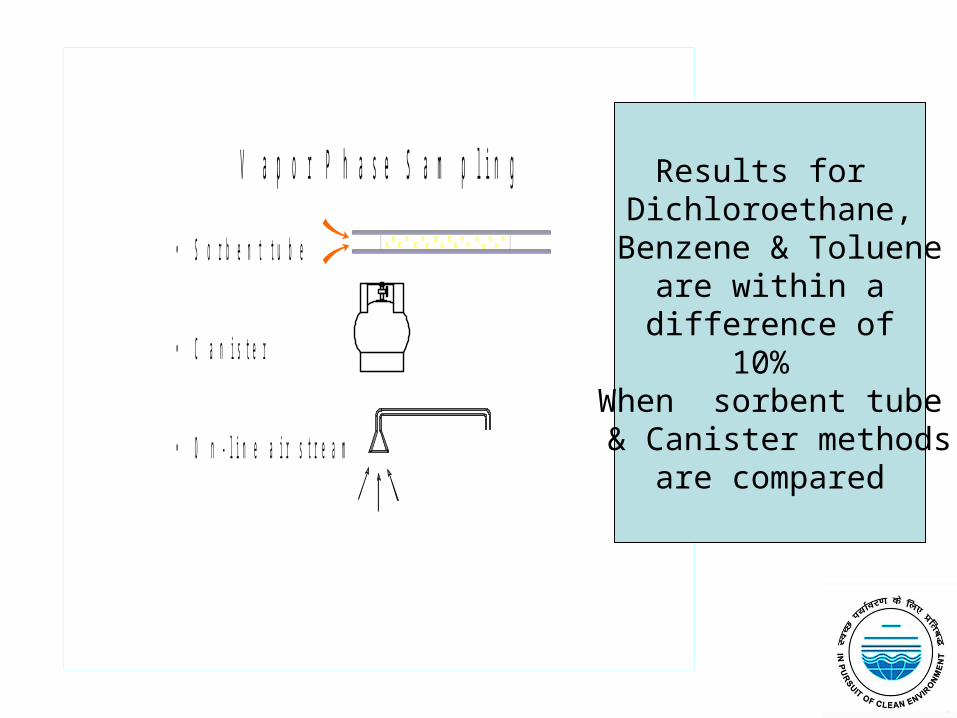
V a p o r P h a s e S a m p l i n g
• S o r b e n t t u b e
• C a n i s t e r
• O n - l i n e a i r s t r e a m
Results for Dichloroethane,
Benzene & Tolueneare within a
difference of 10%
When sorbent tube & Canister methods
are compared
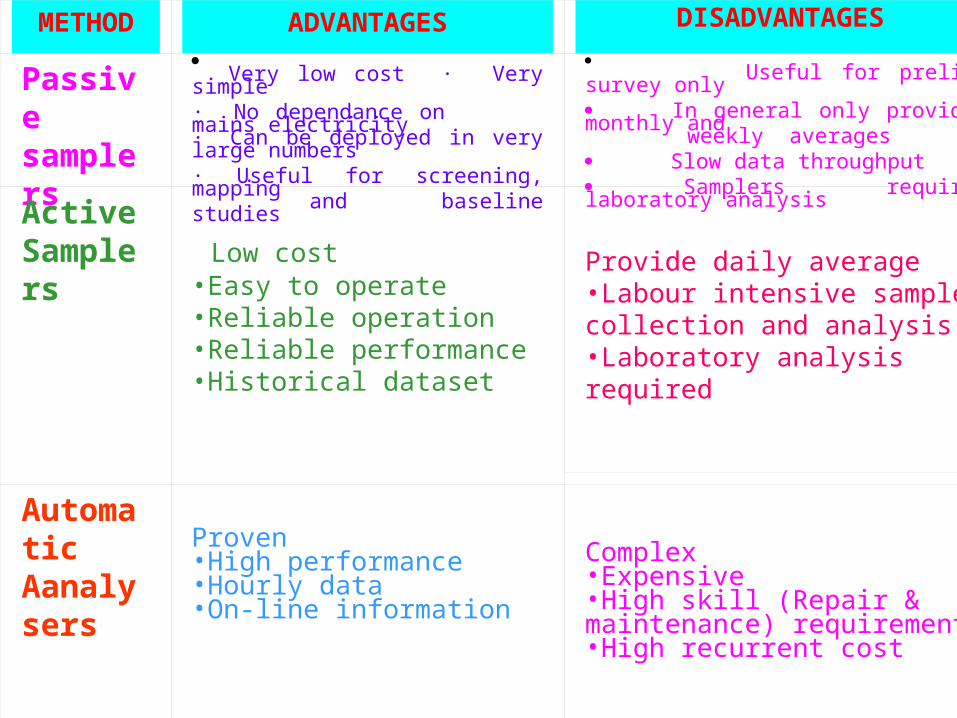
METHOD ADVANTAGES DISADVANTAGES
Passive samplers
Very low cost · Very simple· No dependance on mains electricity· Can be deployed in very large numbers· Useful for screening, mapping and baseline studies
Useful for prelim survey only In general only provide monthly and weekly averages Slow data throughput Samplers require laboratory analysis
Active Samplers Low cost
•Easy to operate•Reliable operation•Reliable performance•Historical dataset
Provide daily average•Labour intensive sample collection and analysis•Laboratory analysis required
Automatic Aanalysers
Proven•High performance•Hourly data•On-line information
Complex•Expensive•High skill (Repair & maintenance) requirement•High recurrent cost
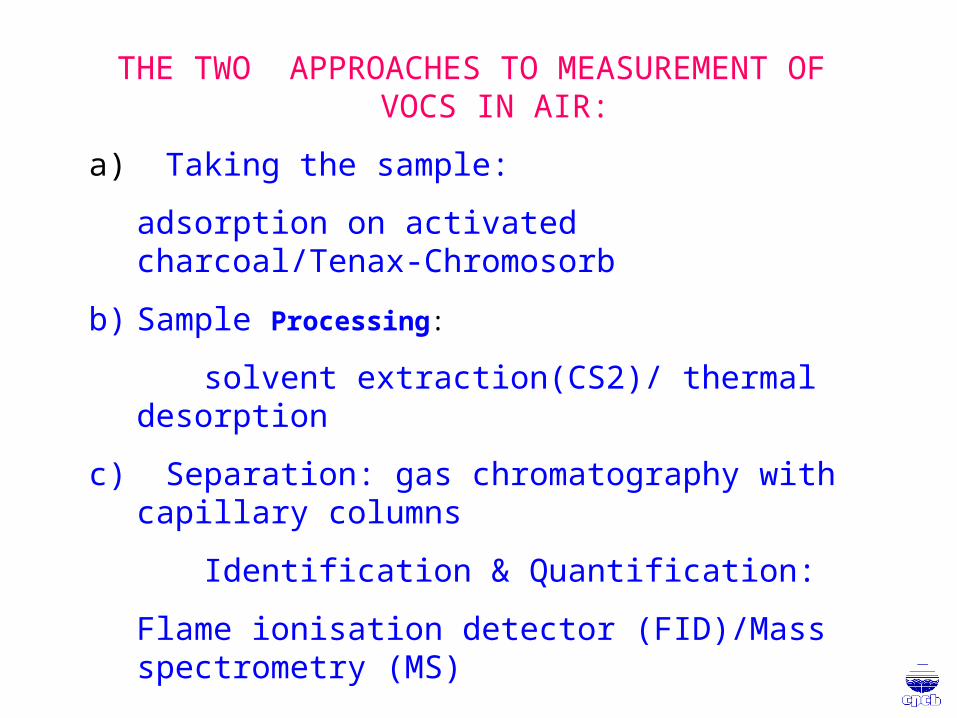
THE TWO APPROACHES TO MEASUREMENT OF VOCS IN AIR:
a) Taking the sample:
adsorption on activated charcoal/Tenax-Chromosorb
b) Sample Processing:
solvent extraction(CS2)/ thermal desorption
c) Separation: gas chromatography with capillary columns
Identification & Quantification:
Flame ionisation detector (FID)/Mass spectrometry (MS)
d) PASSIVE / ACTIVE SAMPLING
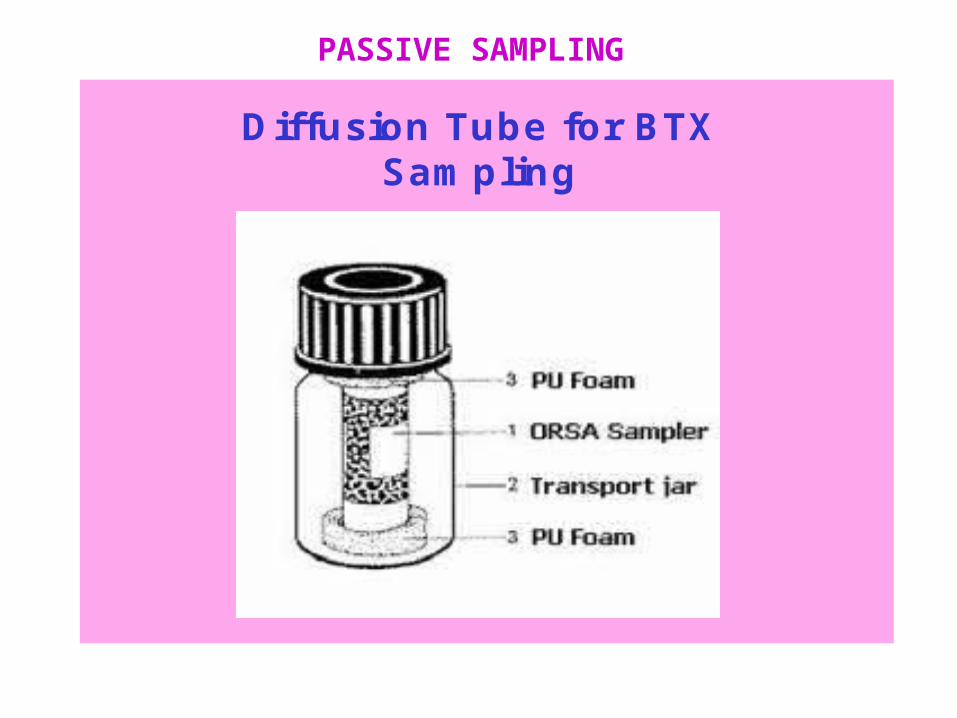
Diffusion Tube for BTX Sampling
PASSIVE SAMPLING
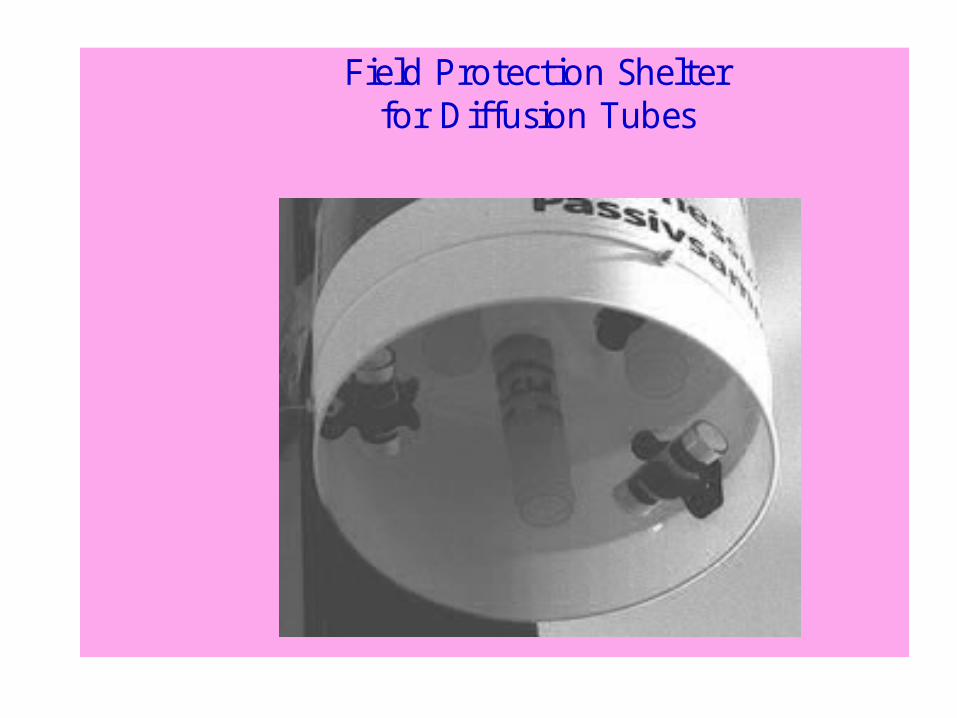
Field Protection Shelterfor Diffusion Tubes
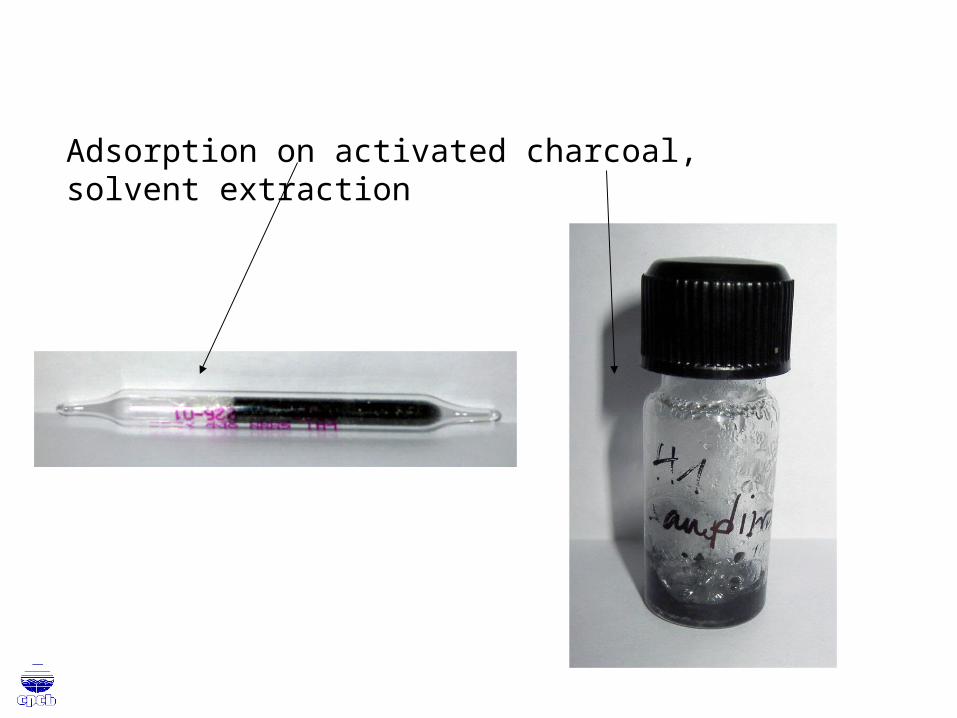
Adsorption on activated charcoal, solvent extraction
Procedure• Diffusion tube is exposed for two weeks in the
ambient air.• After exposure the charcoal of the exposed tube
is transferred in the sample vials and desorbed using carbon-disulfide(CS2 ).
• Desorption is done employing Ultra-sonic bath followed by centrifugation.
• Samples are analysed on Gas chromatograph.
Calculations
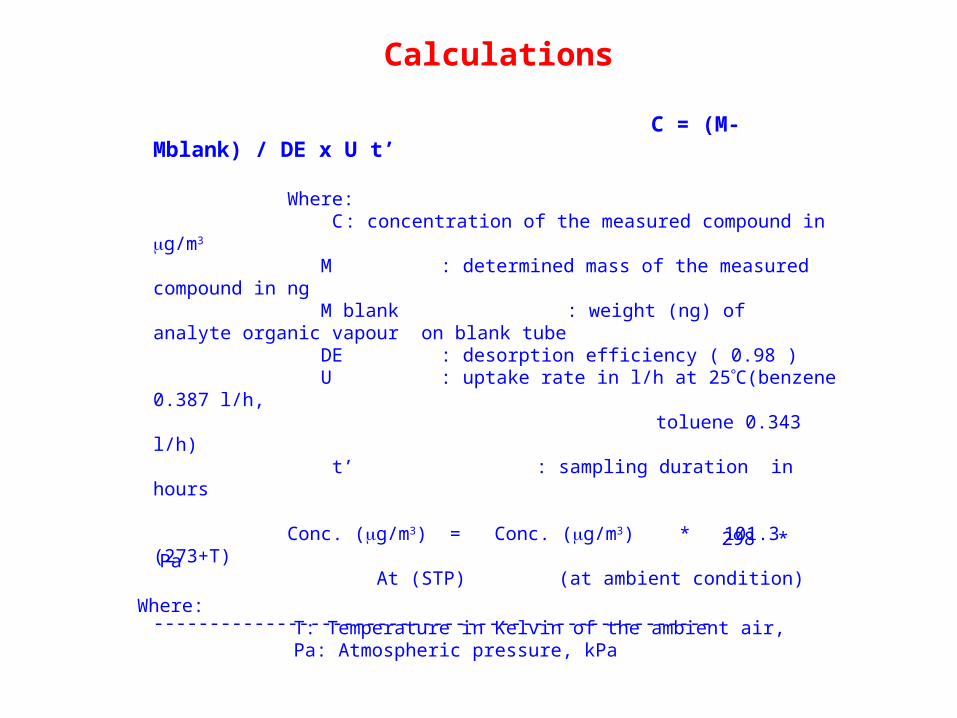
C = (M-Mblank) / DE x U t’
Where: C : concentration of the measured compound in g/m3
M : determined mass of the measured compound in ng M blank : weight (ng) of analyte organic vapour on blank tube DE : desorption efficiency ( 0.98 ) U : uptake rate in l/h at 25C(benzene 0.387 l/h, toluene 0.343 l/h) t’ : sampling duration in hours
Conc. (g/m3) = Conc. (g/m3) * 101.3 (273+T) At (STP) (at ambient condition) --------------------------------------------------
298 * Pa
Where: T: Temperature in Kelvin of the ambient air, Pa: Atmospheric pressure, kPa
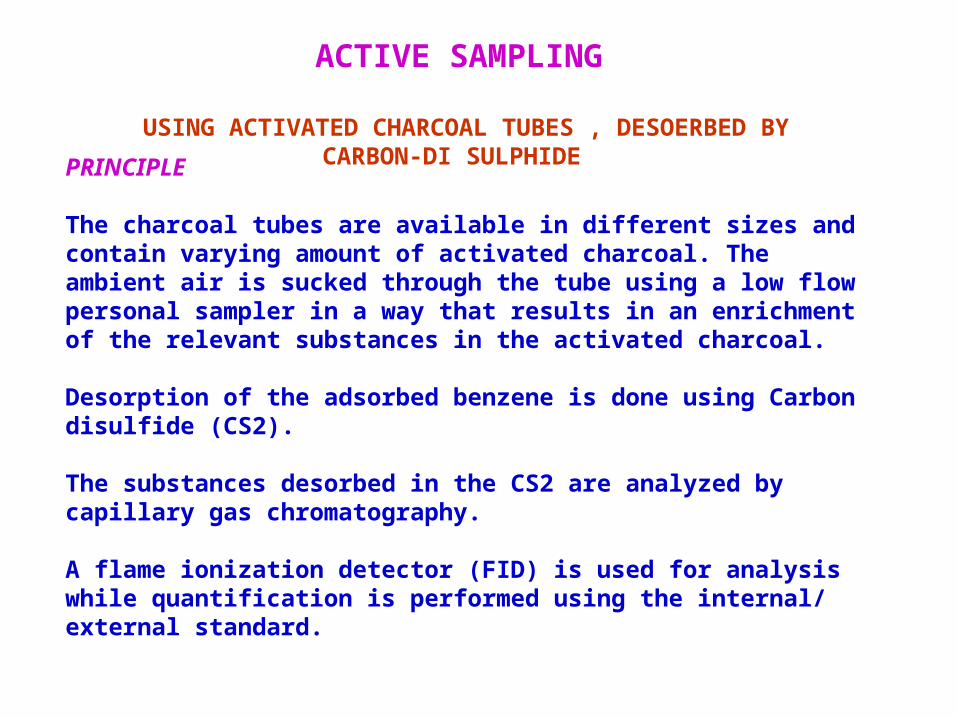
ACTIVE SAMPLING
USING ACTIVATED CHARCOAL TUBES , DESOERBED BY CARBON-DI SULPHIDE
PRINCIPLE The charcoal tubes are available in different sizes and contain varying amount of activated charcoal. The ambient air is sucked through the tube using a low flow personal sampler in a way that results in an enrichment of the relevant substances in the activated charcoal.
Desorption of the adsorbed benzene is done using Carbon disulfide (CS2).
The substances desorbed in the CS2 are analyzed by capillary gas chromatography.
A flame ionization detector (FID) is used for analysis while quantification is performed using the internal/ external standard.
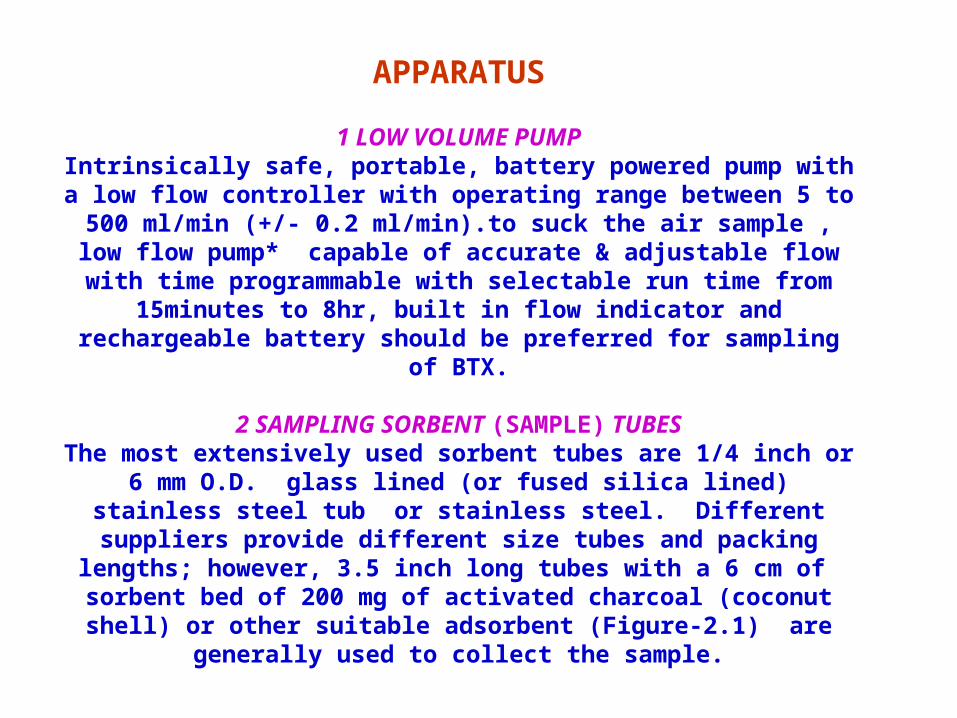
APPARATUS
1 LOW VOLUME PUMPIntrinsically safe, portable, battery powered pump with a low flow controller with operating range between 5 to 500 ml/min (+/- 0.2
ml/min).to suck the air sample , low flow pump* capable of accurate & adjustable flow with time programmable with selectable run time from
15minutes to 8hr, built in flow indicator and rechargeable battery should be preferred for sampling of BTX.
2 SAMPLING SORBENT (SAMPLE) TUBESThe most extensively used sorbent tubes are 1/4 inch or 6 mm O.D.
glass lined (or fused silica lined) stainless steel tub or stainless steel. Different suppliers provide different size tubes and packing lengths; however, 3.5 inch long tubes with a 6 cm of sorbent bed of 200 mg of activated charcoal (coconut shell) or other suitable adsorbent (Figure-
2.1) are generally used to collect the sample.
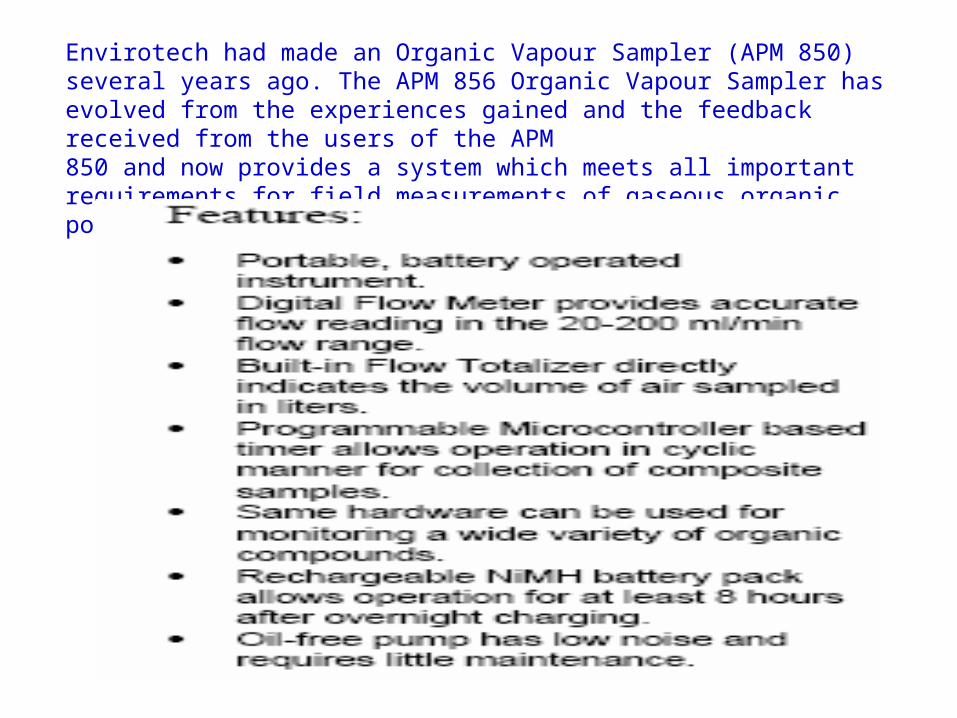
Envirotech had made an Organic Vapour Sampler (APM 850) several years ago. The APM 856 Organic Vapour Sampler has evolved from the experiences gained and the feedback received from the users of the APM850 and now provides a system which meets all important requirements for field measurements of gaseous organic pollutants in ambient air.
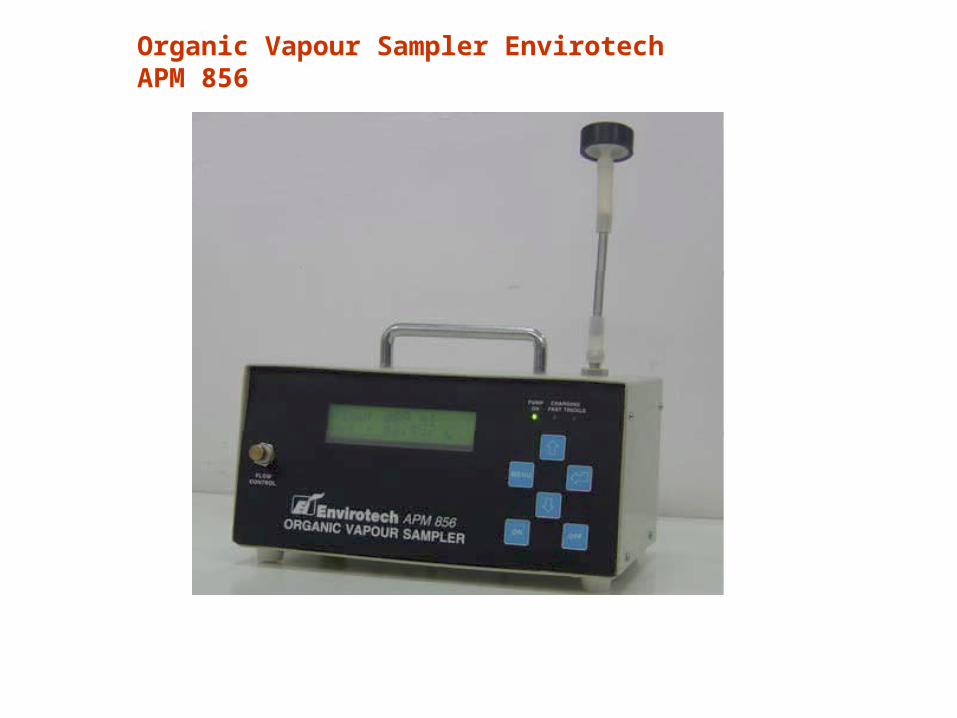
Organic Vapour Sampler Envirotech APM 856
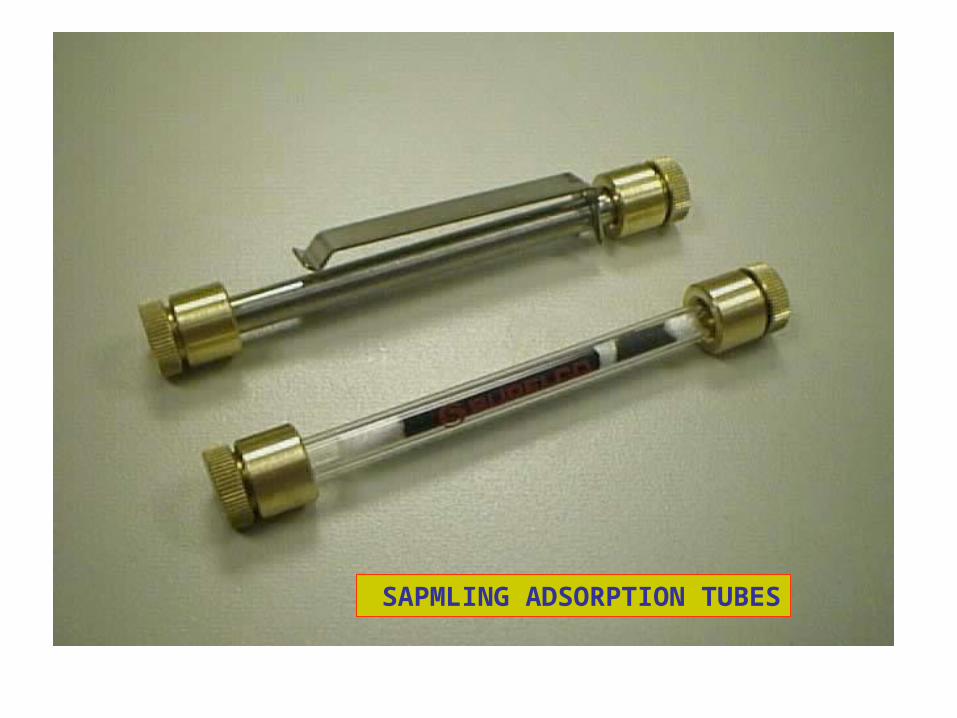
SAPMLING ADSORPTION TUBES
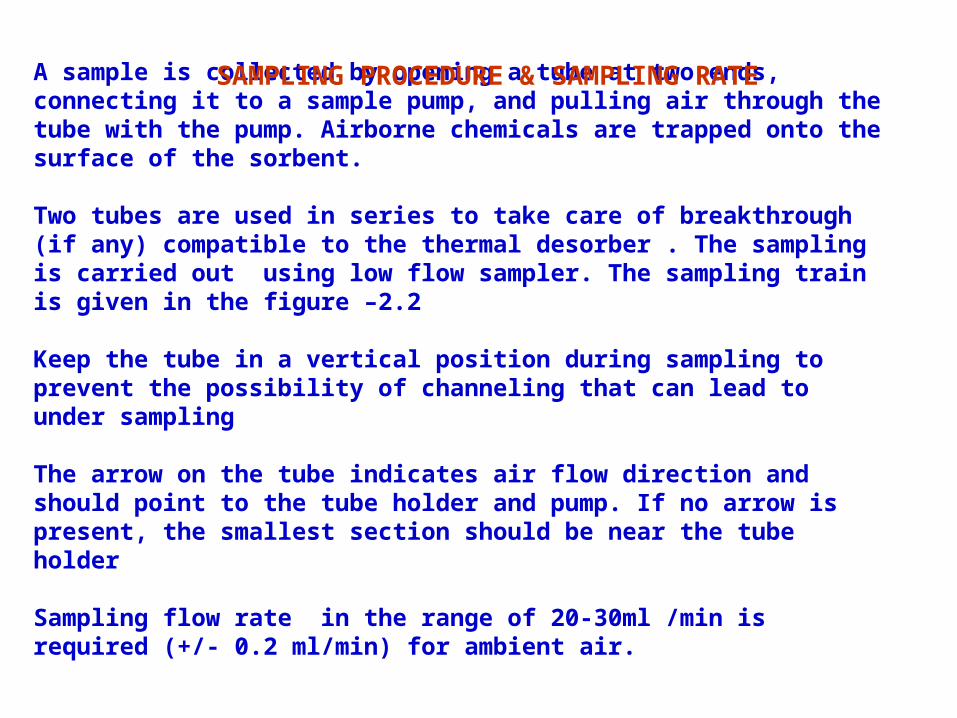
A sample is collected by opening a tube at two ends, connecting it to a sample pump, and pulling air through the tube with the pump. Airborne chemicals are trapped onto the surface of the sorbent.
Two tubes are used in series to take care of breakthrough (if any) compatible to the thermal desorber . The sampling is carried out using low flow sampler. The sampling train is given in the figure –2.2
Keep the tube in a vertical position during sampling to prevent the possibility of channeling that can lead to under sampling
The arrow on the tube indicates air flow direction and should point to the tube holder and pump. If no arrow is present, the smallest section should be near the tube holder Sampling flow rate in the range of 20-30ml /min is required (+/- 0.2 ml/min) for ambient air.
SAMPLING PROCEDURE & SAMPLING RATE
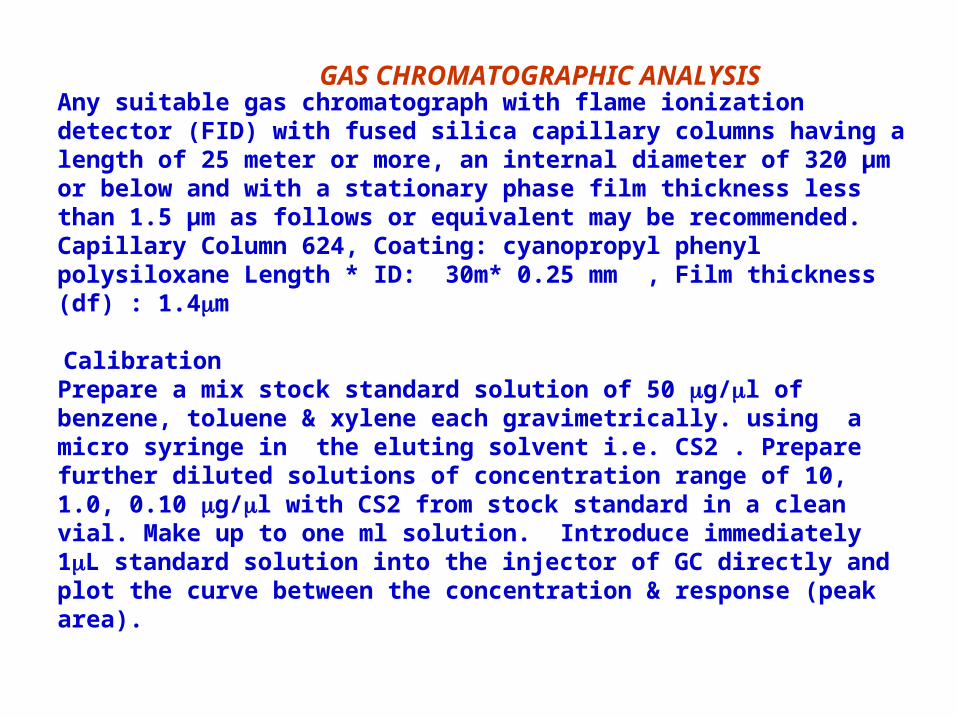
Any suitable gas chromatograph with flame ionization detector (FID) with fused silica capillary columns having a length of 25 meter or more, an internal diameter of 320 µm or below and with a stationary phase film thickness less than 1.5 µm as follows or equivalent may be recommended.Capillary Column 624, Coating: cyanopropyl phenyl polysiloxane Length * ID: 30m* 0.25 mm , Film thickness (df) : 1.4m
CalibrationPrepare a mix stock standard solution of 50 g/l of benzene, toluene & xylene each gravimetrically. using a micro syringe in the eluting solvent i.e. CS2 . Prepare further diluted solutions of concentration range of 10, 1.0, 0.10 g/l with CS2 from stock standard in a clean vial. Make up to one ml solution. Introduce immediately 1L standard solution into the injector of GC directly and plot the curve between the concentration & response (peak area).
GAS CHROMATOGRAPHIC ANALYSIS
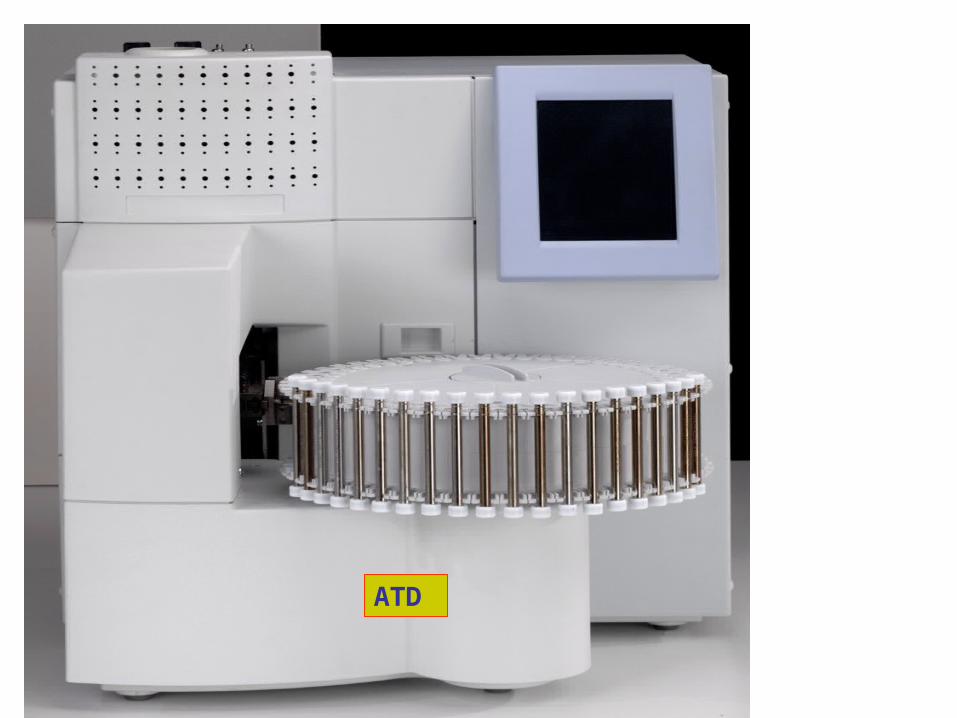
ATD
GC – ATD - MS
Electron IonisationElectron Ionisation : M + e- M+. + 2e-
CH4 + e- CH4+. + 2e-CH4+. CH3+ + H.
Primary ionsPrimary ions
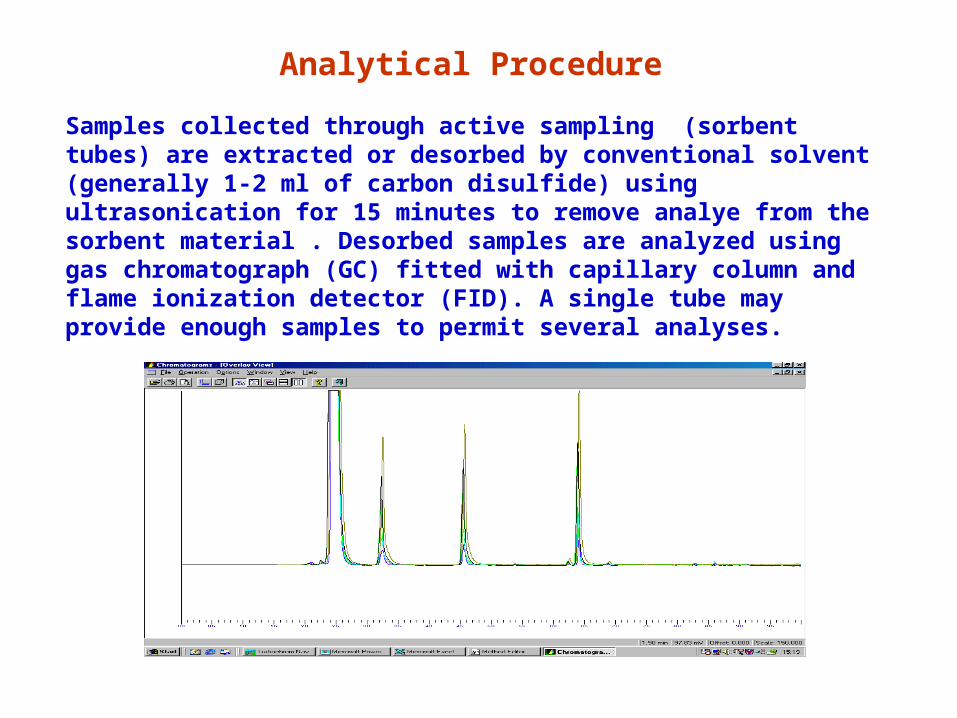
Analytical Procedure
Samples collected through active sampling (sorbent tubes) are extracted or desorbed by conventional solvent (generally 1-2 ml of carbon disulfide) using ultrasonication for 15 minutes to remove analye from the sorbent material . Desorbed samples are analyzed using gas chromatograph (GC) fitted with capillary column and flame ionization detector (FID). A single tube may provide enough samples to permit several analyses.
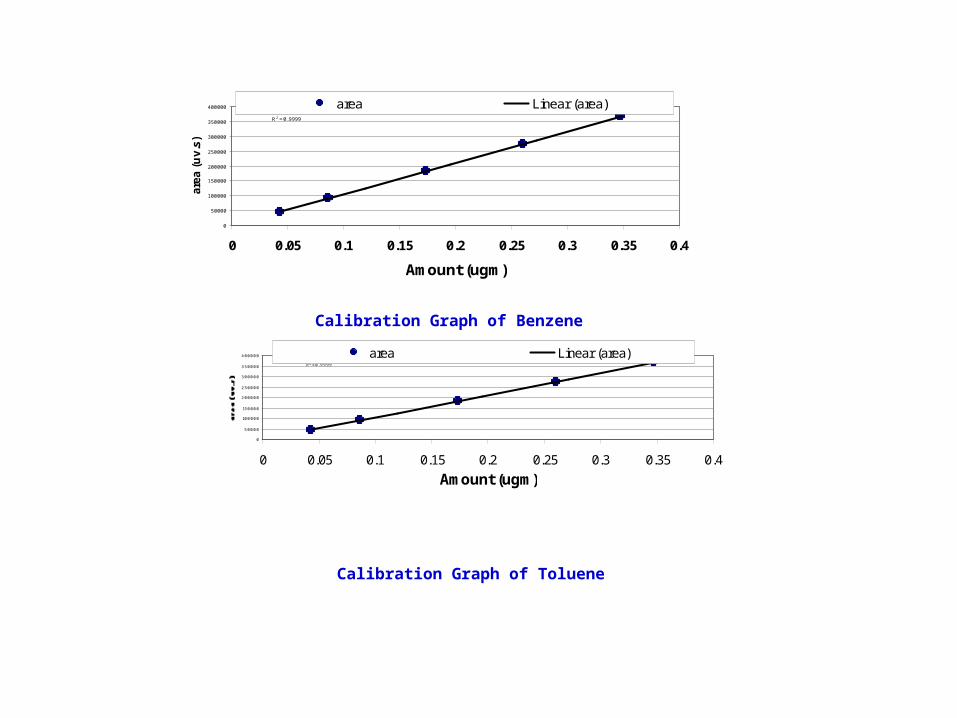
y = 1E+06xR2 = 0. 9999
0
50000
100000
150000
200000
250000
300000
350000
400000
0 0.05 0.1 0.15 0.2 0.25 0.3 0.35 0.4Amount (ugm)
area Linear (area)
y = 1E +06xR2 = 0.9999
0
50000
100000
150000
200000
250000
300000
350000
400000
0 0.05 0.1 0.15 0.2 0.25 0.3 0.35 0.4
Amount (ugm)
area
(uv.
s)
area Linear (area)
Calibration Graph of Benzene
Calibration Graph of Toluene
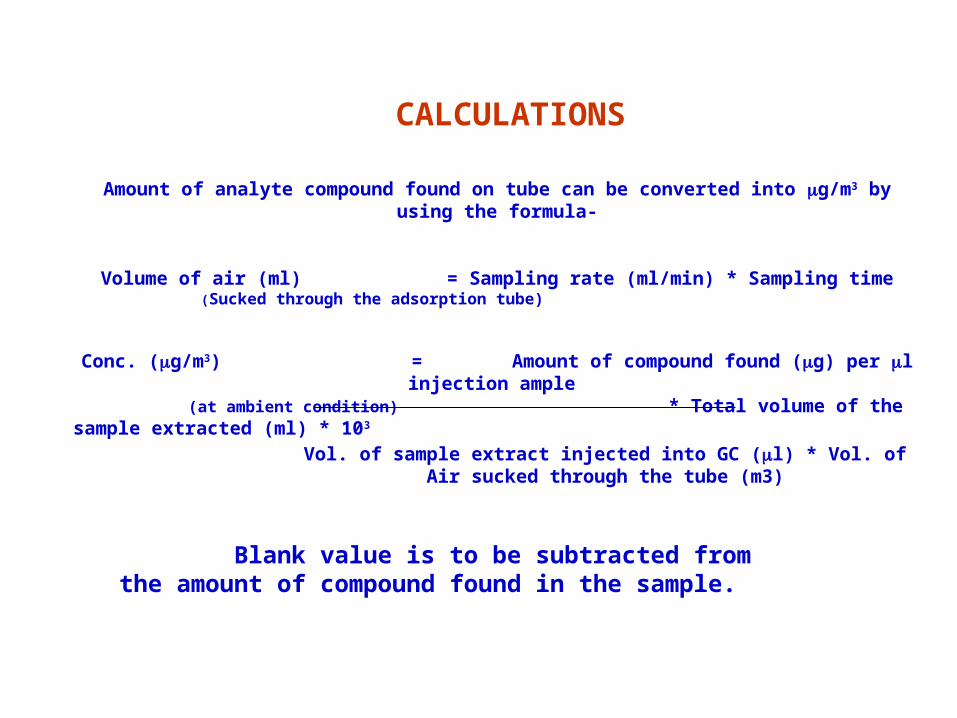
Amount of analyte compound found on tube can be converted into g/m3 by using the formula-
Volume of air (ml) = Sampling rate (ml/min) * Sampling time (Sucked through the adsorption tube)
Conc. (g/m3) = Amount of compound found (g) per l injection ample (at ambient condition) * Total volume of the sample extracted (ml) * 103
Vol. of sample extract injected into GC (l) * Vol. of Air sucked through the tube (m3)
CALCULATIONS
Blank value is to be subtracted from the amount of compound found in the sample.
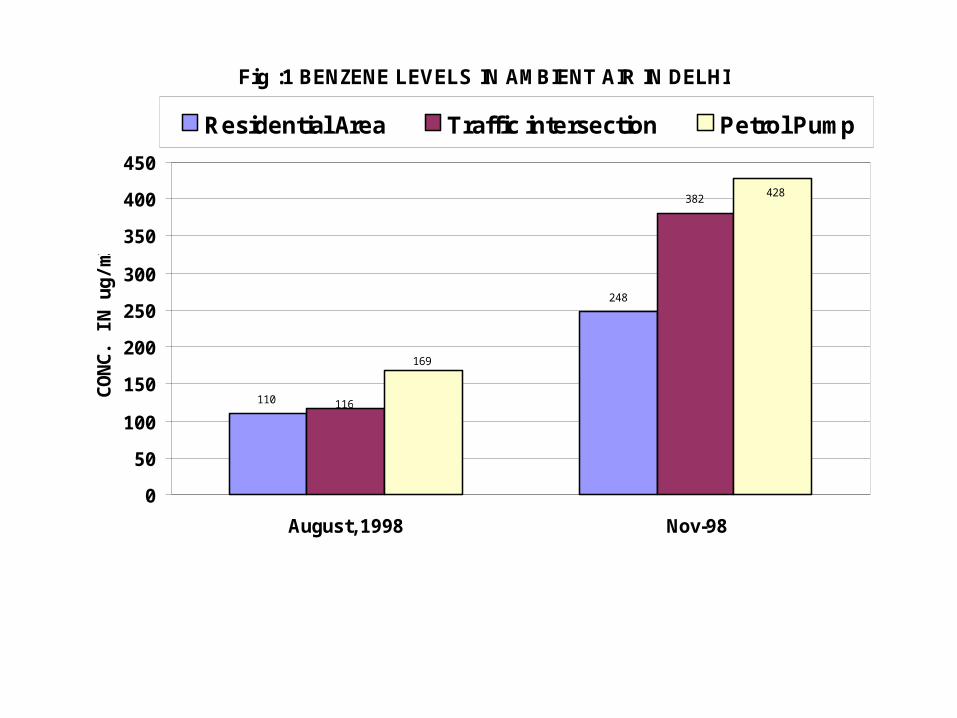
Fig :1 BENZENE LEVELS IN AMBIENT AIR IN DELHI
110
248
382
116
169
428
0
50
100
150
200
250
300
350
400
450
August, 1998 Nov-98
CO
NC
. IN
ug/
m3
Residential Area Traffic intersection Petrol Pump
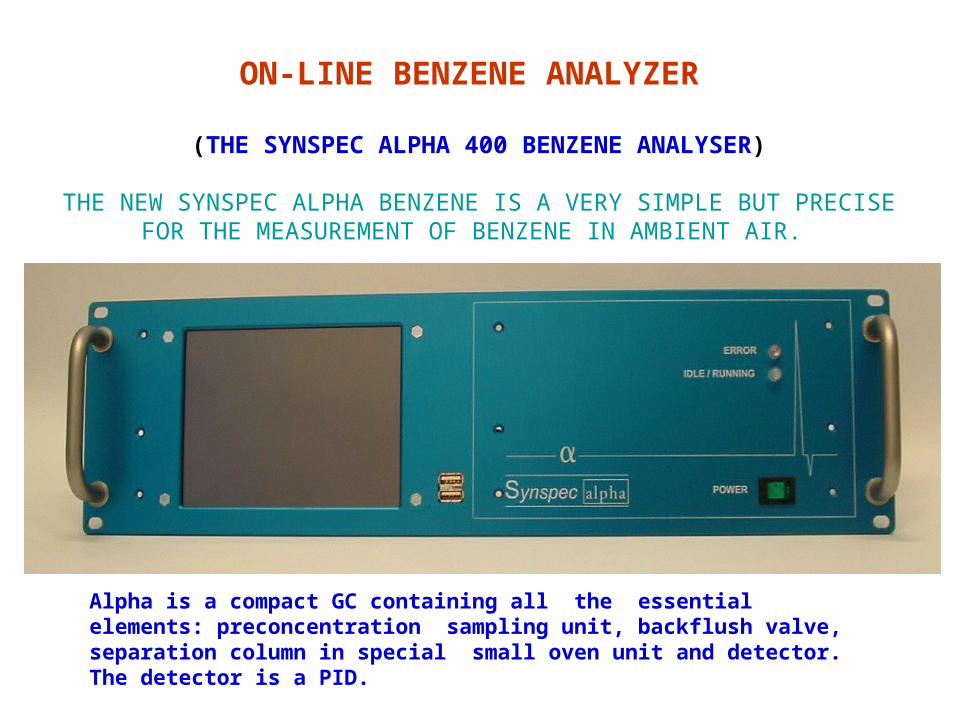
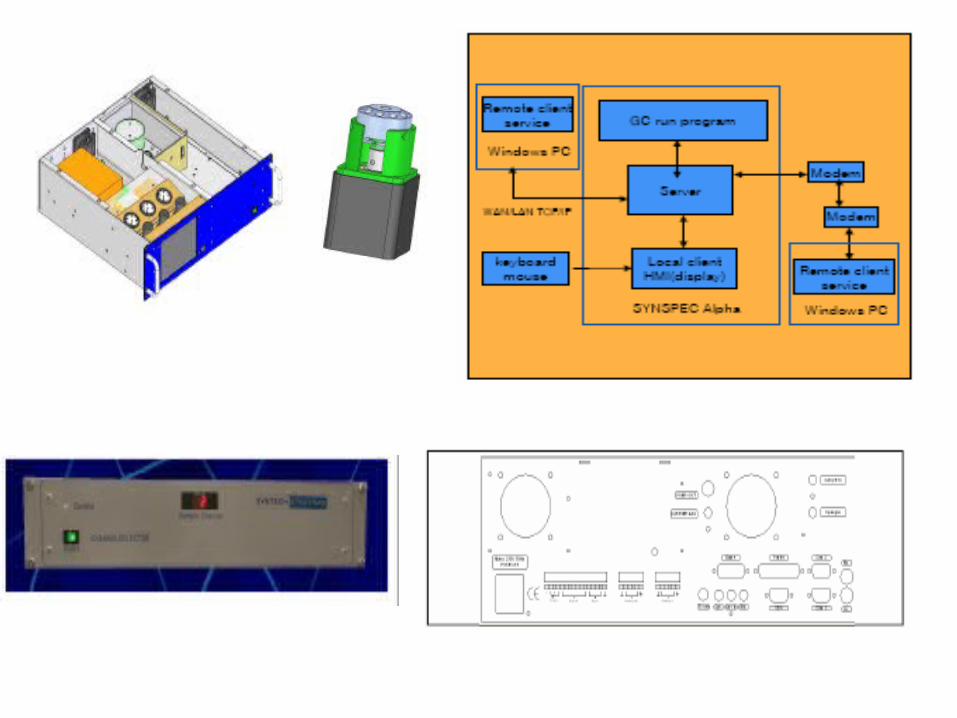
ON-LINE BENZENE ANALYZER
(THE SYNSPEC ALPHA 400 BENZENE ANALYSER)
THE NEW SYNSPEC ALPHA BENZENE IS A VERY SIMPLE BUT PRECISE FOR THE MEASUREMENT OF BENZENE IN AMBIENT AIR.
Alpha is a compact GC containing all the essential elements: preconcentration sampling unit, backflush valve, separation column in special small oven unit and detector. The detector is a PID.
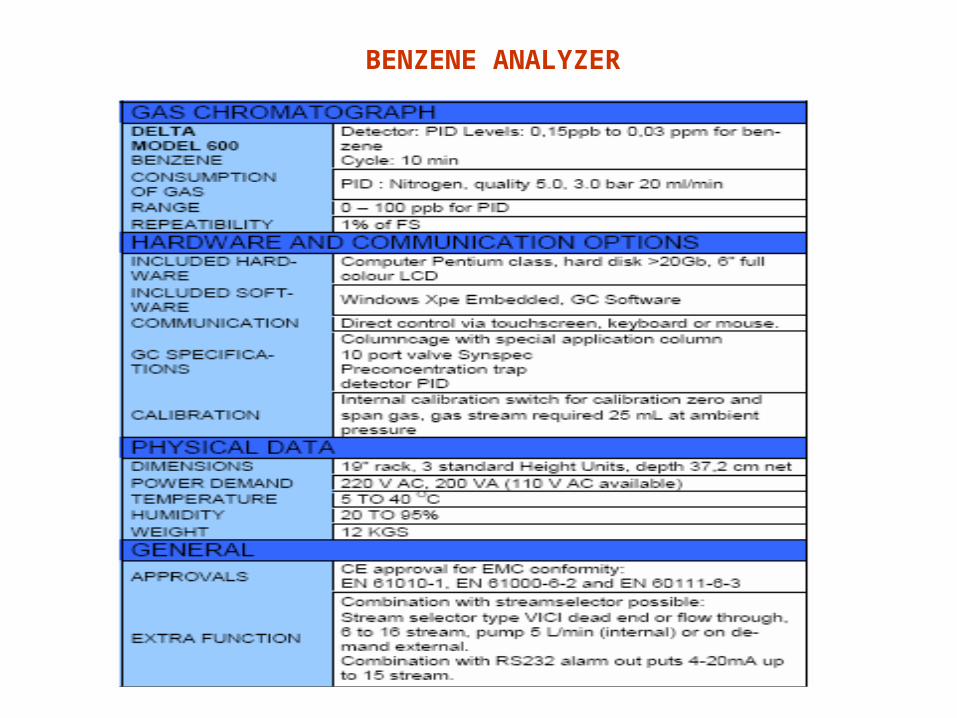
BENZENE ANALYZER
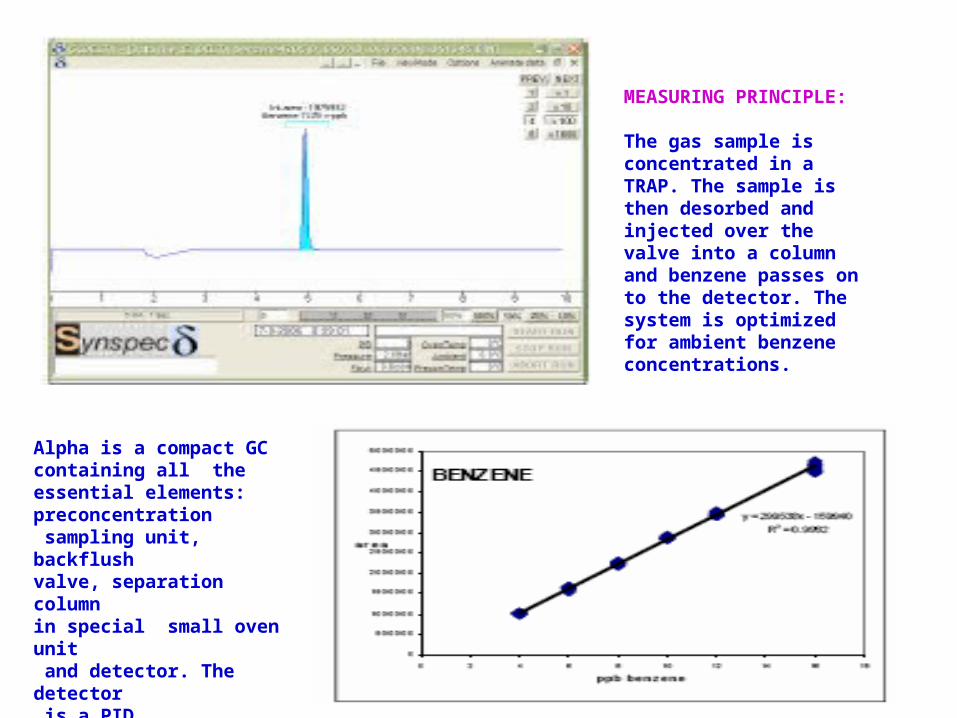
MEASURING PRINCIPLE:
The gas sample is concentrated in a TRAP. The sample is then desorbed and injected over the valve into a column and benzene passes on to the detector. The system is optimized for ambient benzene concentrations.
Alpha is a compact GC containing all the essential elements: preconcentration sampling unit, backflush valve, separation column in special small oven unit and detector. The detector is a PID.
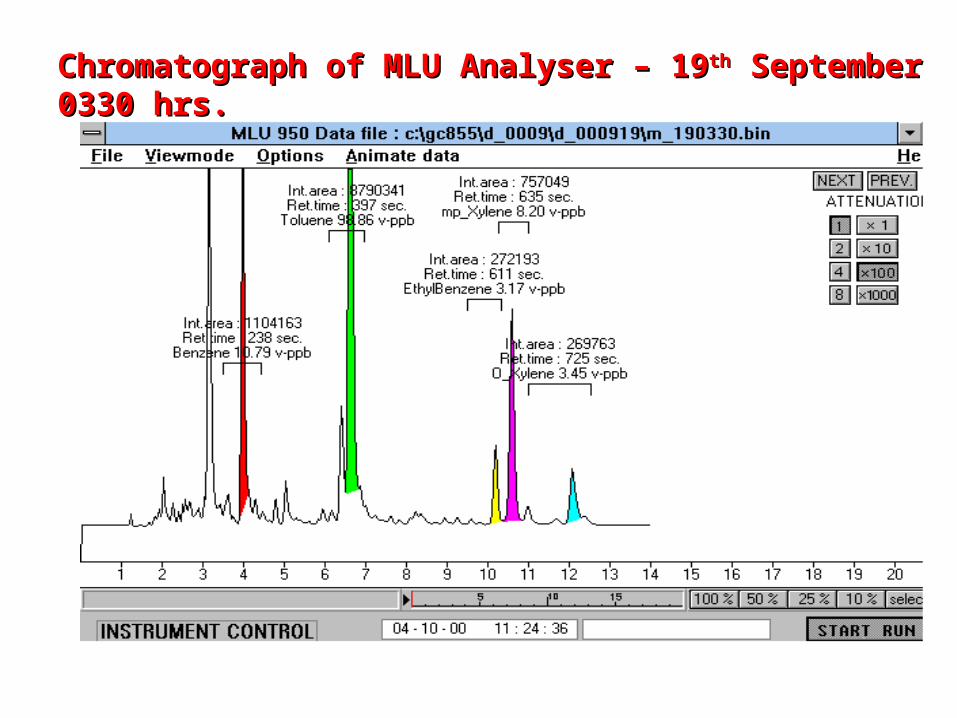
Chromatograph of MLU Analyser – 19Chromatograph of MLU Analyser – 19thth September 0330 hrs. September 0330 hrs.
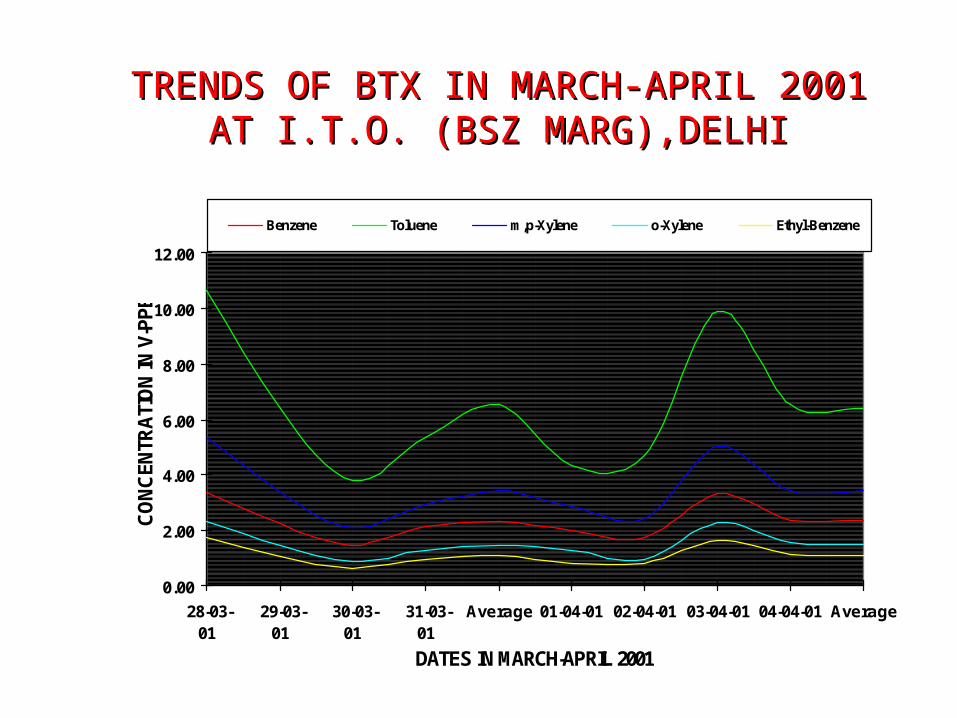
0.00
2.00
4.00
6.00
8.00
10.00
12.00
28-03-01
29-03-01
30-03-01
31-03-01
Average 01-04-01 02-04-01 03-04-01 04-04-01 Average
DATES IN MARCH-APRIL 2001
CONC
ENTR
ATIO
N IN
V-P
PB
Benzene Toluene m,p-Xylene o-Xylene Ethyl-Benzene
TRENDS OF BTX IN MARCH-APRIL 2001 AT TRENDS OF BTX IN MARCH-APRIL 2001 AT I.T.O. (BSZ MARG),DELHII.T.O. (BSZ MARG),DELHI
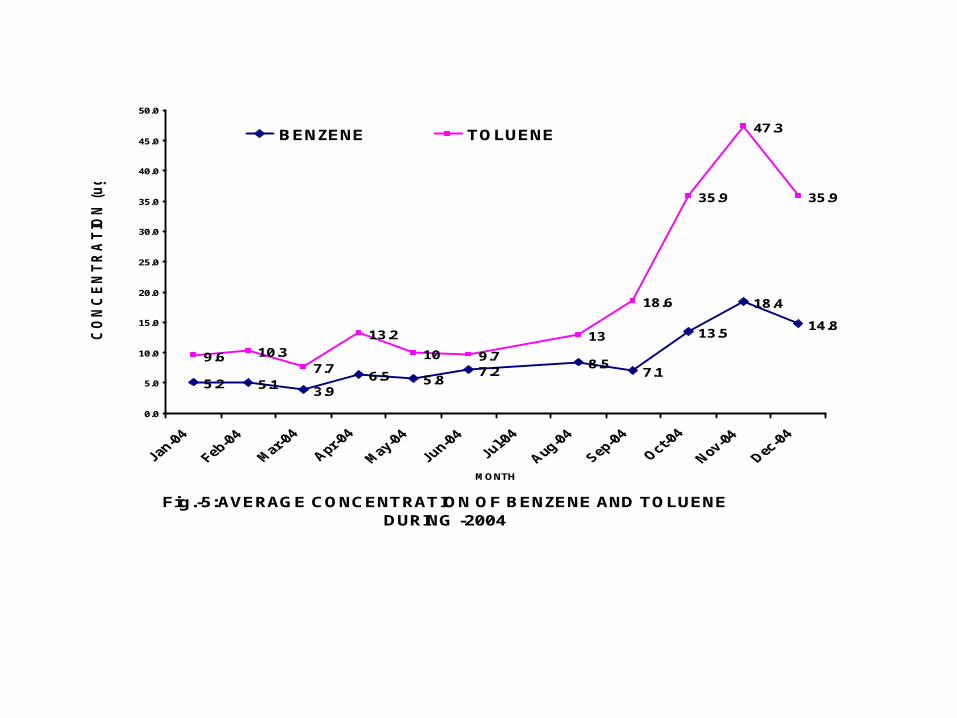
Fig.-5:AVERAGE CONCENTRATION OF BENZENE AND TOLUENE DURING -2004
5.2 5.1 3.96.5 5.8 7.2 8.5 7.1
13.5
18.4
14.8
9.6 10.37.7
13.210 9.7
13
18.6
35.9
47.3
35.9
0.0
5.0
10.0
15.0
20.0
25.0
30.0
35.0
40.0
45.0
50.0
MONTH
CO
NC
ENTR
ATI
ON
(ug/
m3)
BENZENE TOLUENE
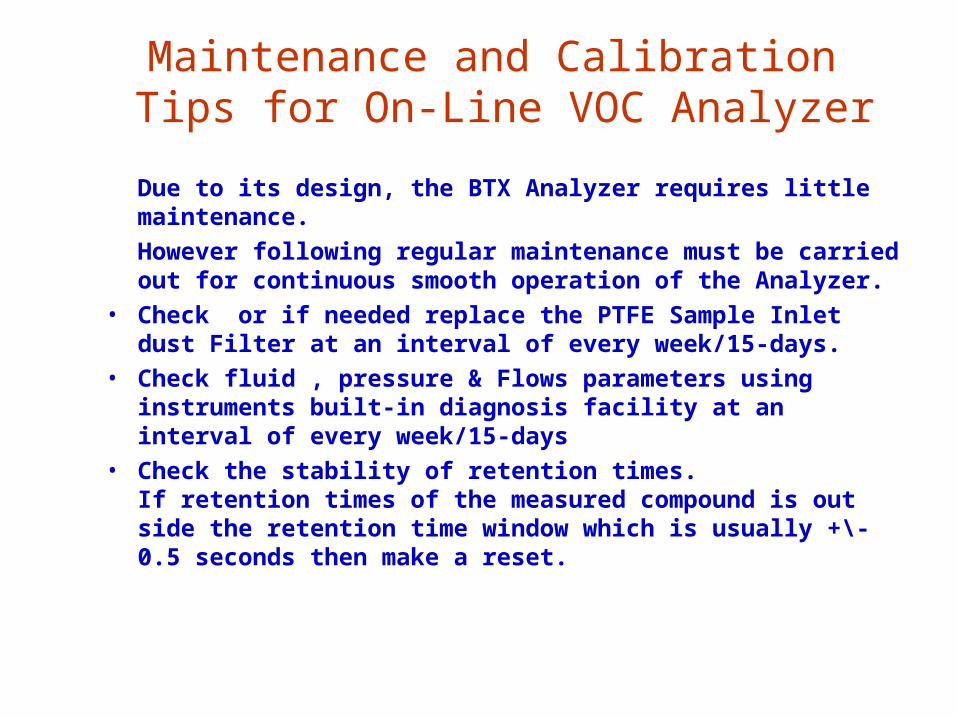
Maintenance and Calibration Tips for On-Line VOC Analyzer
Due to its design, the BTX Analyzer requires little maintenance.
However following regular maintenance must be carried out for continuous smooth operation of the Analyzer.
• Check or if needed replace the PTFE Sample Inlet dust Filter at an interval of every week/15-days.
• Check fluid , pressure & Flows parameters using instruments built-in diagnosis facility at an interval of every week/15-days
• Check the stability of retention times.If retention times of the measured compound is out side the retention time window which is usually +\- 0.5 seconds then make a reset.
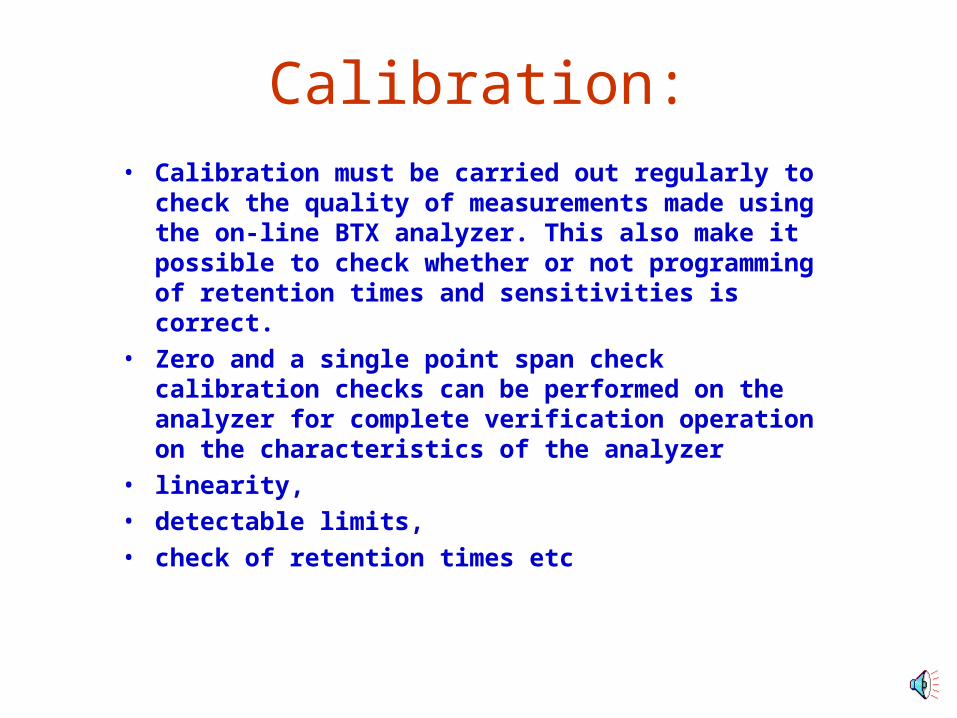
Calibration:• Calibration must be carried out regularly to check
the quality of measurements made using the on-line BTX analyzer. This also make it possible to check whether or not programming of retention times and sensitivities is correct.
• Zero and a single point span check calibration checks can be performed on the analyzer for complete verification operation on the characteristics of the analyzer
• linearity, • detectable limits,• check of retention times etc
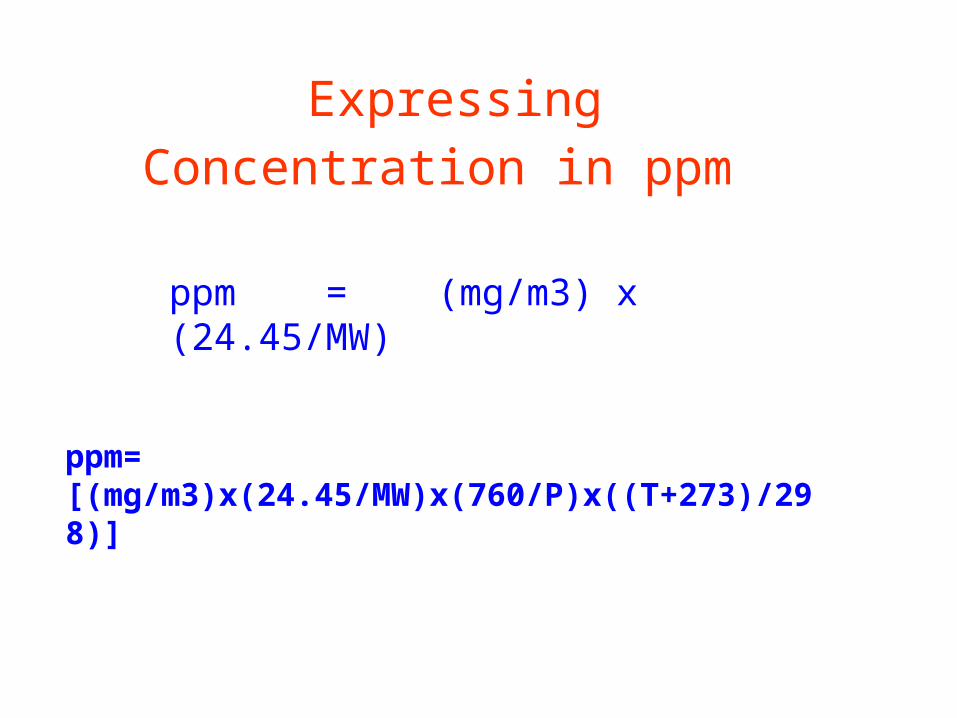
ppm = (mg/m3) x (24.45/MW)
Expressing Concentration in ppm
ppm= [(mg/m3)x(24.45/MW)x(760/P)x((T+273)/298)]
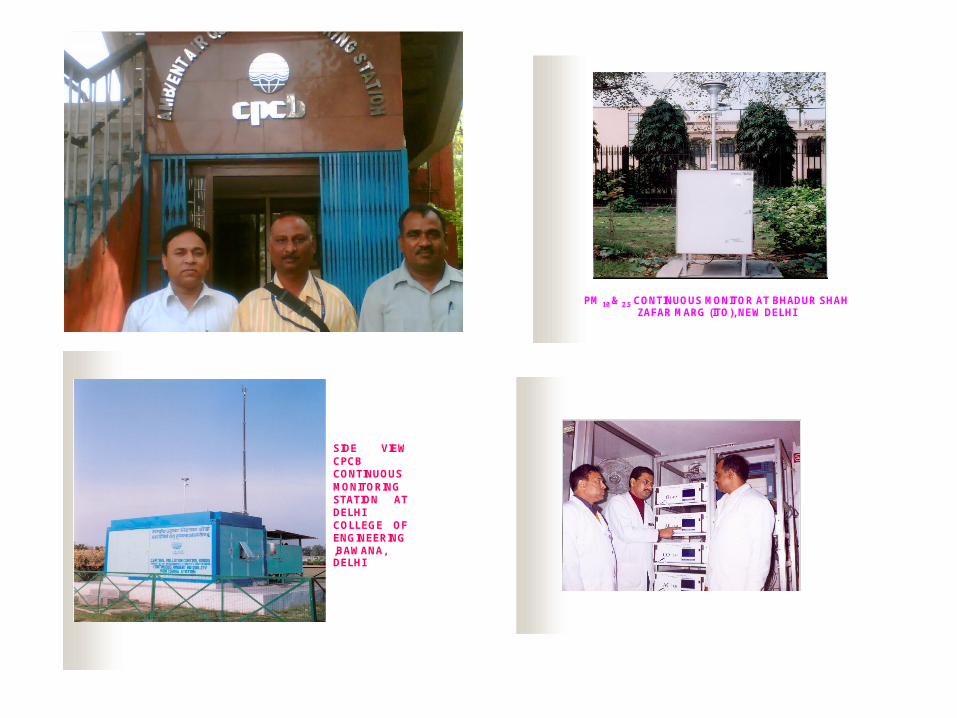
PM 10 & 2.5 CONTINUOUS MONITOR AT BHADUR SHAH ZAFAR MARG (ITO), NEW DELHI
SIDE VIEW CPCB CONTINUOUS MONITORING STATION AT DELHI COLLEGE OF ENGINEERING,BAWANA, DELHI
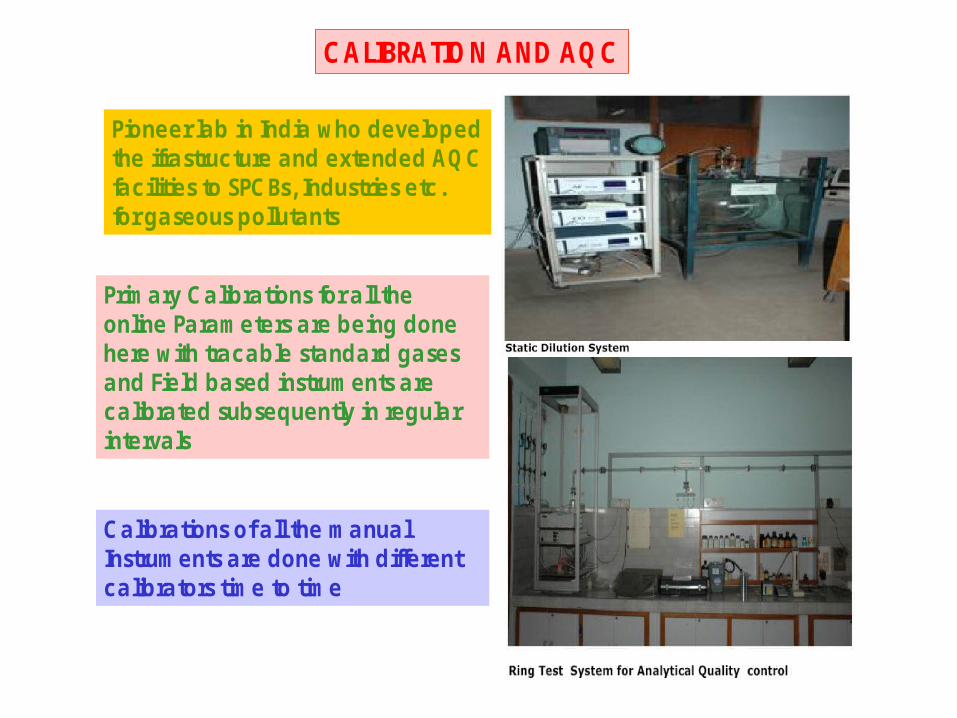
CALIBRATION AND AQC
Pioneer lab in India who developedthe ifrastructure and extended AQCfacilities to SPCBs, Industries etc.for gaseous pollutants
Primary Calibrations for all the online Parameters are being done here with tracable standard gases and Field based instruments are calibrated subsequently in regular intervals
Calibrations of all the manualInstruments are done with different calibrators time to time
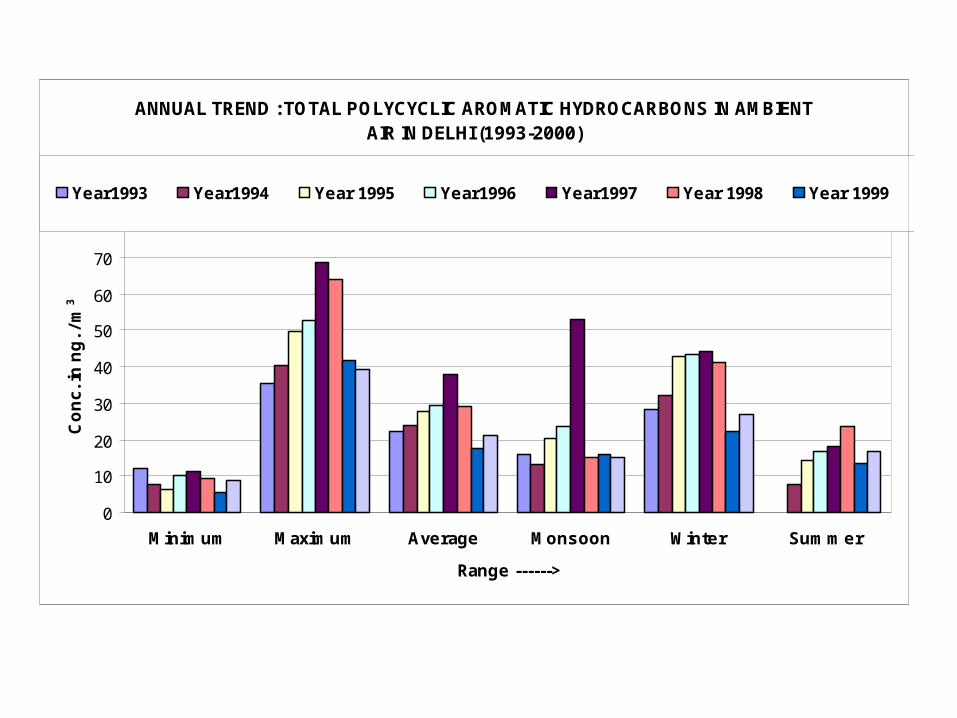
ANNUAL TREND : TOTAL POLYCYCLIC AROMATIC HYDROCARBONS IN AMBIENT AIR IN DELHI (1993-2000)
0
10
20
30
40
50
60
70
80
Minimum Maximum Average Monsoon Winter Summer
Range ------>
Con
c. in
ng.
/ m
3
Year1993 Year1994 Year 1995 Year1996 Year1997 Year 1998 Year 1999 Year 2000
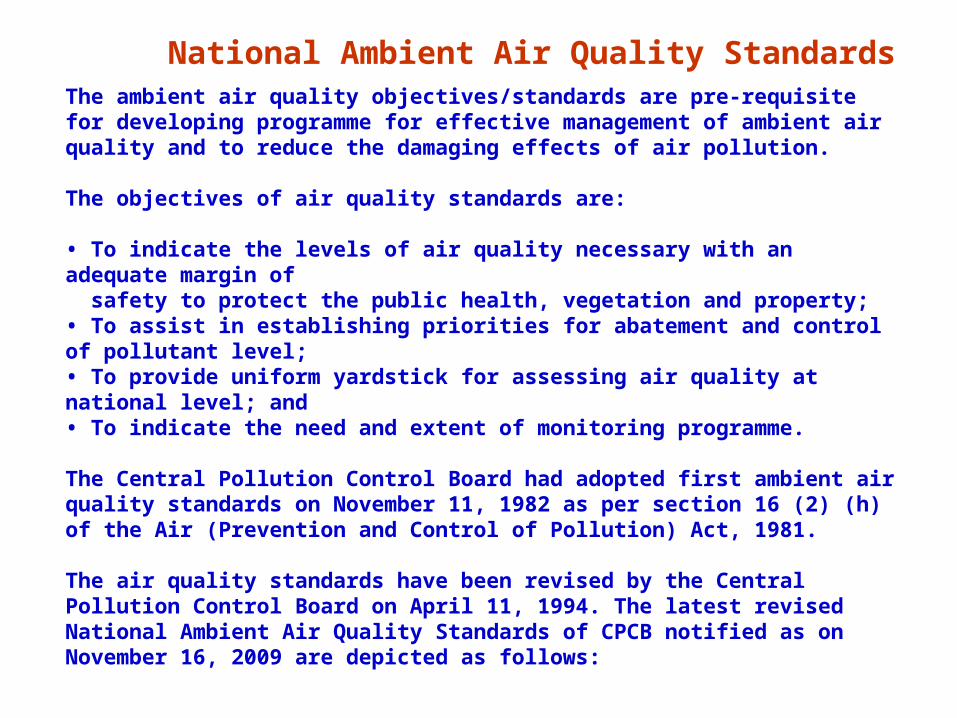
The ambient air quality objectives/standards are pre-requisite for developing programme for effective management of ambient air quality and to reduce the damaging effects of air pollution.
The objectives of air quality standards are:
• To indicate the levels of air quality necessary with an adequate margin of safety to protect the public health, vegetation and property;• To assist in establishing priorities for abatement and control of pollutant level;• To provide uniform yardstick for assessing air quality at national level; and• To indicate the need and extent of monitoring programme.
The Central Pollution Control Board had adopted first ambient air quality standards on November 11, 1982 as per section 16 (2) (h) of the Air (Prevention and Control of Pollution) Act, 1981.
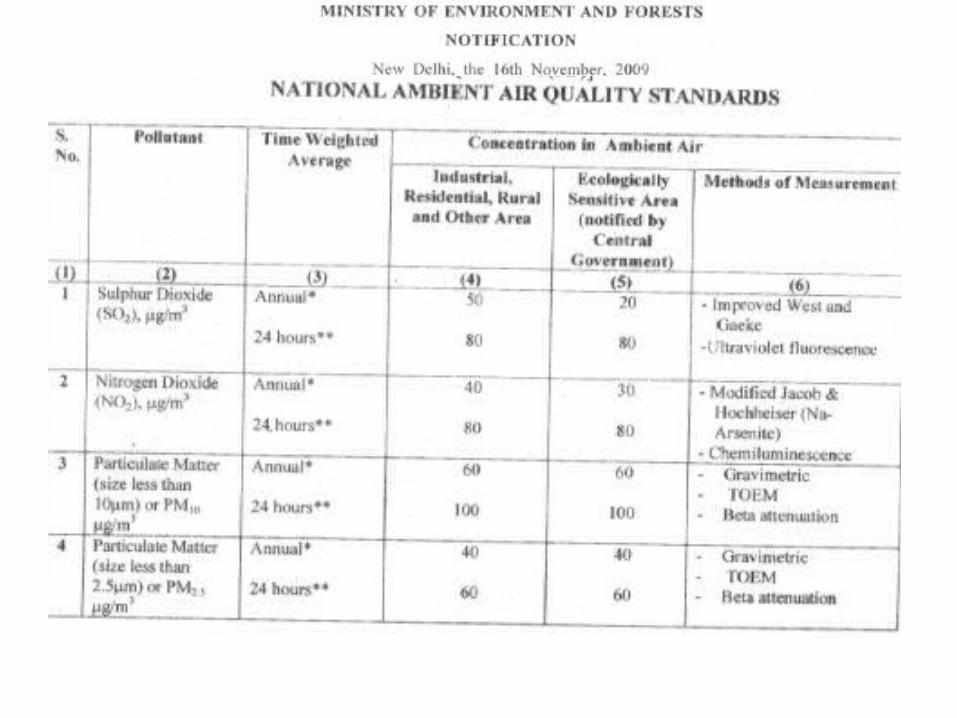
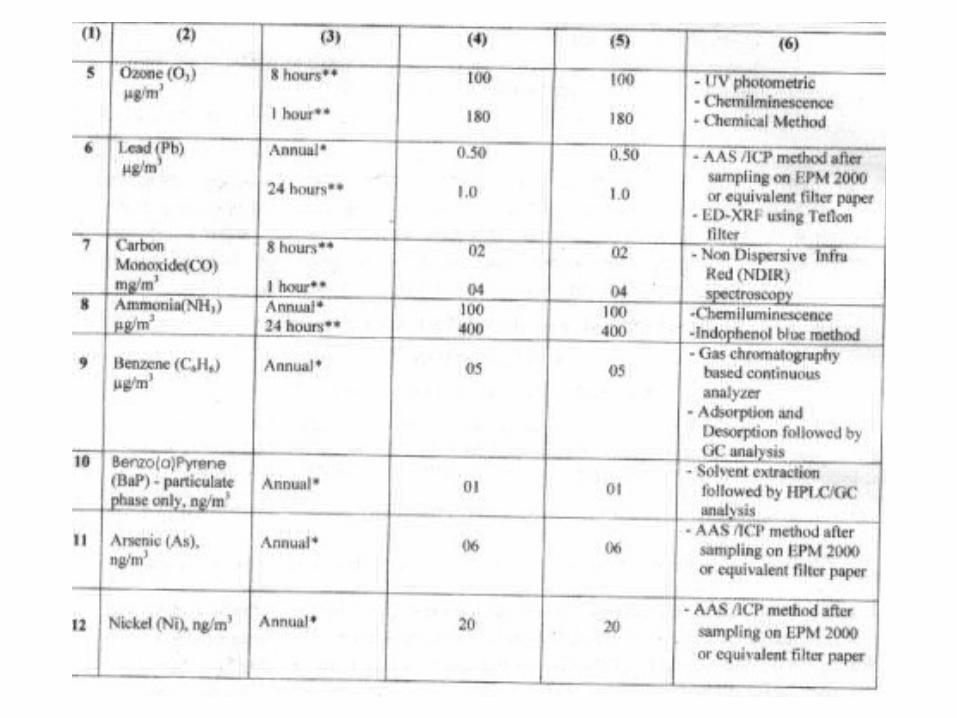
The air quality standards have been revised by the Central Pollution Control Board on April 11, 1994. The latest revised National Ambient Air Quality Standards of CPCB notified as on November 16, 2009 are depicted as follows:
National Ambient Air Quality Standards
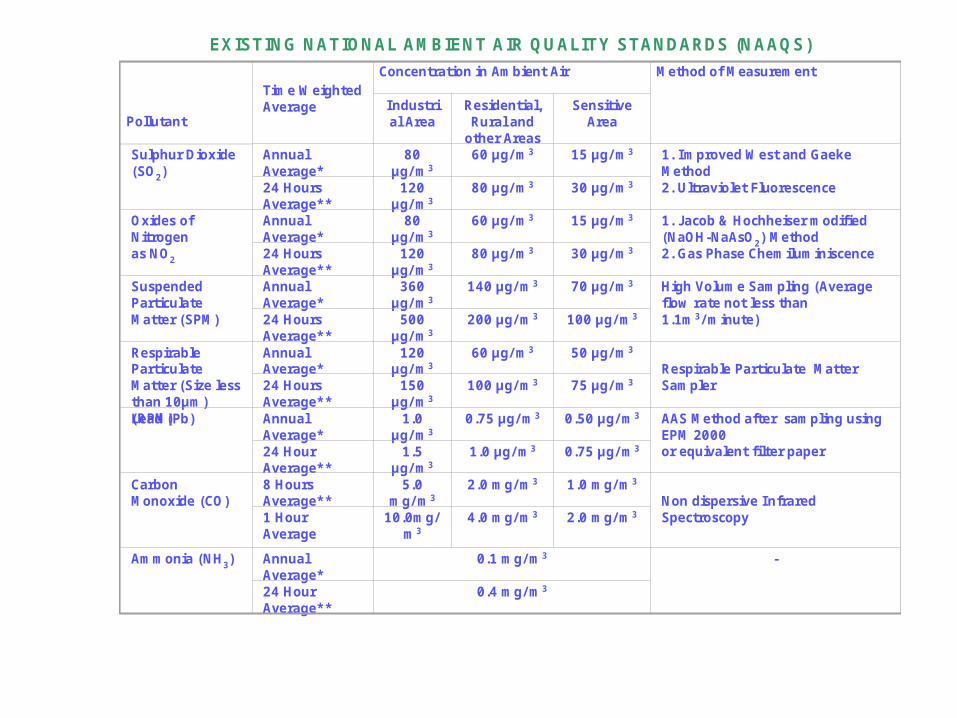
EXISTING NATIONAL AMBIENT AIR QUALITY STANDARDS (NAAQS)
Pollutant
Time WeightedAverage
Concentration in Ambient Air Method of Measurement
Industrial Area
Residential, Rural and
other Areas
Sensitive Area
Sulphur Dioxide (SO2)
Annual Average*
80 µg/ m3
60 µg/ m3 15 µg/ m3 1. Improved West and GaekeMethod2. Ultraviolet Fluorescence24 Hours
Average**120
µg/ m380 µg/ m3 30 µg/ m3
Oxides of Nitrogen as NO2
Annual Average*
80 µg/ m3
60 µg/ m3 15 µg/ m3 1. Jacob & Hochheiser modified (NaOH-NaAsO2) Method2. Gas Phase Chemiluminiscence24 Hours
Average**120
µg/ m380 µg/ m3 30 µg/ m3
Suspended ParticulateMatter (SPM)
Annual Average*
360 µg/ m3
140 µg/ m3 70 µg/ m3 High Volume Sampling (Average flow rate not less than 1.1m3/ minute)24 Hours
Average**500
µg/ m3200 µg/ m3 100 µg/ m3
RespirableParticulate Matter (Size less than 10µm) (RPM)
Annual Average*
120 µg/ m3
60 µg/ m3 50 µg/ m3
Respirable Particulate Matter Sampler24 Hours
Average**150
µg/ m3100 µg/ m3 75 µg/ m3
Lead (Pb) Annual Average*
1.0 µg/ m3
0.75 µg/ m3 0.50 µg/ m3 AAS Method after sampling using EPM 2000or equivalent filter paper24 Hour
Average**1.5
µg/ m31.0 µg/ m3 0.75 µg/ m3
Carbon Monoxide (CO)
8 Hours Average**
5.0 mg/ m3
2.0 mg/ m3 1.0 mg/ m3
Non dispersive Infrared Spectroscopy1 Hour
Average10.0mg/
m34.0 mg/ m3 2.0 mg/ m3
Ammonia (NH3) Annual Average*
0.1 mg/ m3 -
24 Hour Average**
0.4 mg/ m3
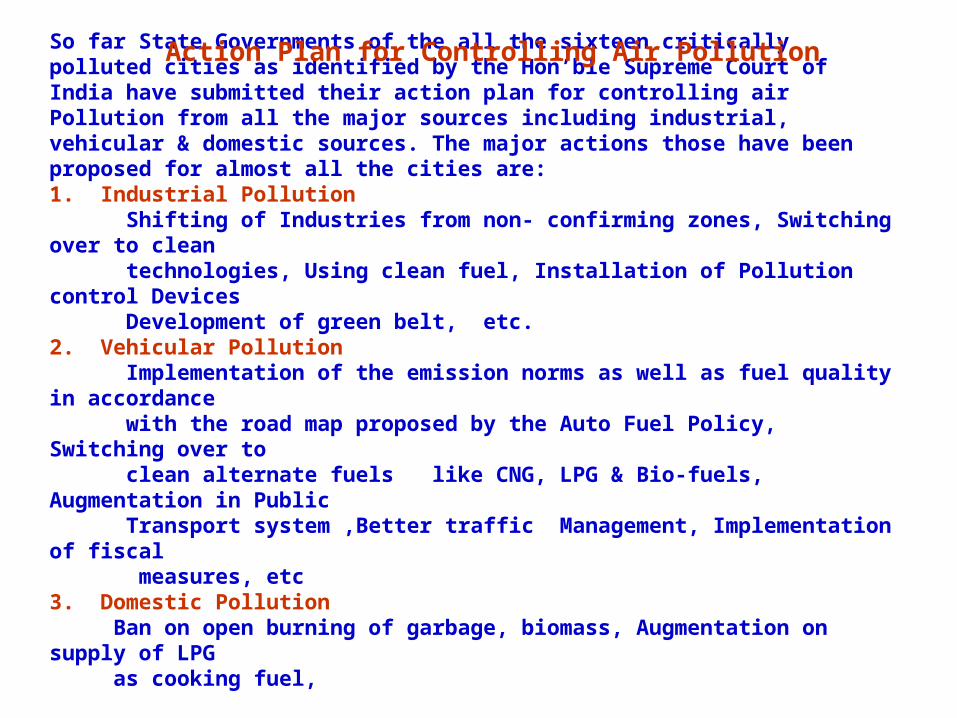
So far State Governments of the all the sixteen critically polluted cities as identified by the Hon’ble Supreme Court of India have submitted their action plan for controlling air Pollution from all the major sources including industrial, vehicular & domestic sources. The major actions those have been proposed for almost all the cities are:1. Industrial Pollution Shifting of Industries from non- confirming zones, Switching over to clean technologies, Using clean fuel, Installation of Pollution control Devices Development of green belt, etc.2. Vehicular Pollution Implementation of the emission norms as well as fuel quality in accordance with the road map proposed by the Auto Fuel Policy, Switching over to clean alternate fuels like CNG, LPG & Bio-fuels, Augmentation in Public Transport system ,Better traffic Management, Implementation of fiscal measures, etc3. Domestic Pollution Ban on open burning of garbage, biomass, Augmentation on supply of LPG as cooking fuel,
Action Plan for Controlling Air Pollution
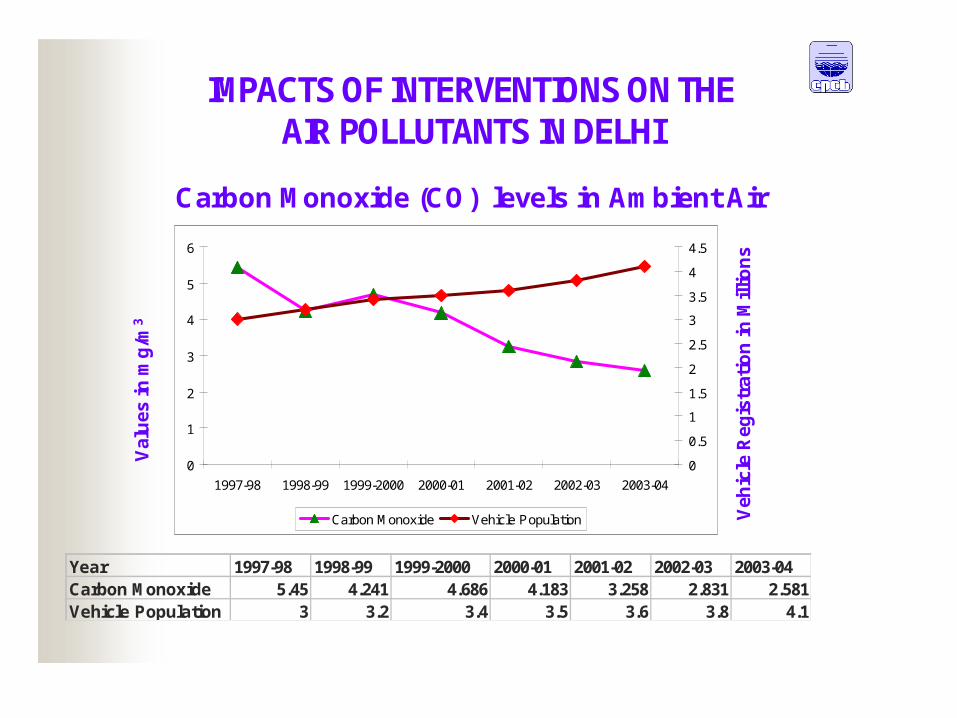
Carbon Monoxide (CO) levels in Ambient Air
0
1
2
3
4
5
6
1997-98 1998-99 1999-2000 2000-01 2001-02 2002-03 2003-040
0.5
1
1.5
2
2.5
3
3.5
4
4.5
Carbon Monoxide Vehicle Population
Year 1997-98 1998-99 1999-2000 2000-01 2001-02 2002-03 2003-04Carbon Monoxide 5.45 4.241 4.686 4.183 3.258 2.831 2.581Vehicle Population 3 3.2 3.4 3.5 3.6 3.8 4.1
Vehi
cle
Reg
istr
atio
n in
Mill
ions
Valu
es in
mg/
m3
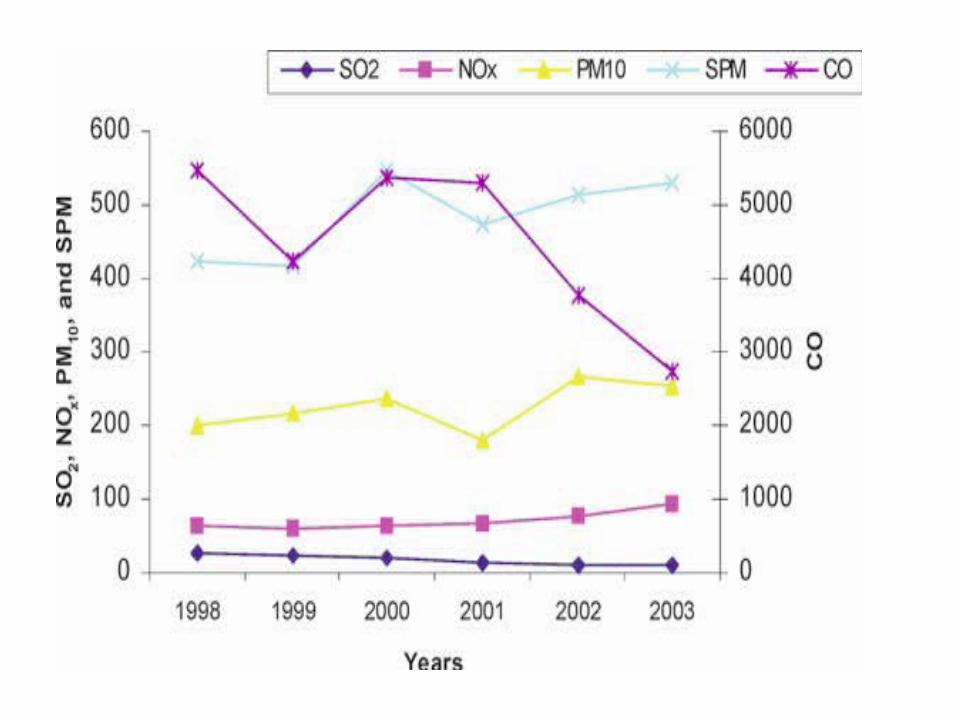
IMPACTS OF INTERVENTIONS ON THE AIR POLLUTANTS IN DELHI
Dr. S.K.Tyagi
Methods of Sampling and Analysis of Metals in Ambient Air
(CADMIUM, CHROMIUM, IRON, LEAD, MANGANESE, NICKEL, COBALT, ALUMINUM, VANADIUM, AND ZINC)
PRINCIPLE This method is designed to collect particulate phase Metals in the ambient air and fugitive emissions and to determine individual metal . It is based on high volume ( ~ 1.2 m3 / min) sampling method capable of detecting ng/ m3 concentration of metal with a total sample volume ~ 480 m3 / of air over a period of 8 hours with same filter. It Involves collection from air particulate on a fine particle (glass-fibre) filter using high volume sampler for total suspended particulate matter (TSPM) or respirable dust sampler for respirable suspended particulate matter (RSPM or PM10) and subsequent analysis by Flame Atomic Absorption Spectroscopy (FAAS) after the digestion of samples with concentrated nitric acid & hydrochloric acid .
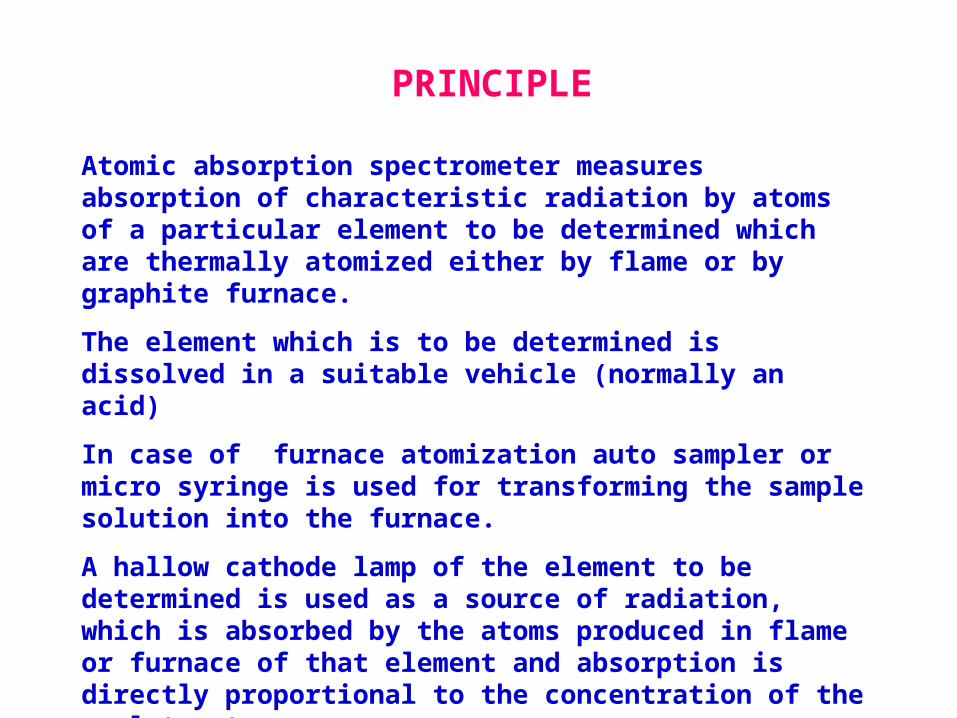
Atomic absorption spectrometer measures absorption of characteristic radiation by atoms of a particular element to be determined which are thermally atomized either by flame or by graphite furnace.
The element which is to be determined is dissolved in a suitable vehicle (normally an acid)
In case of furnace atomization auto sampler or micro syringe is used for transforming the sample solution into the furnace.
A hallow cathode lamp of the element to be determined is used as a source of radiation, which is absorbed by the atoms produced in flame or furnace of that element and absorption is directly proportional to the concentration of the analyte atoms.
PRINCIPLE
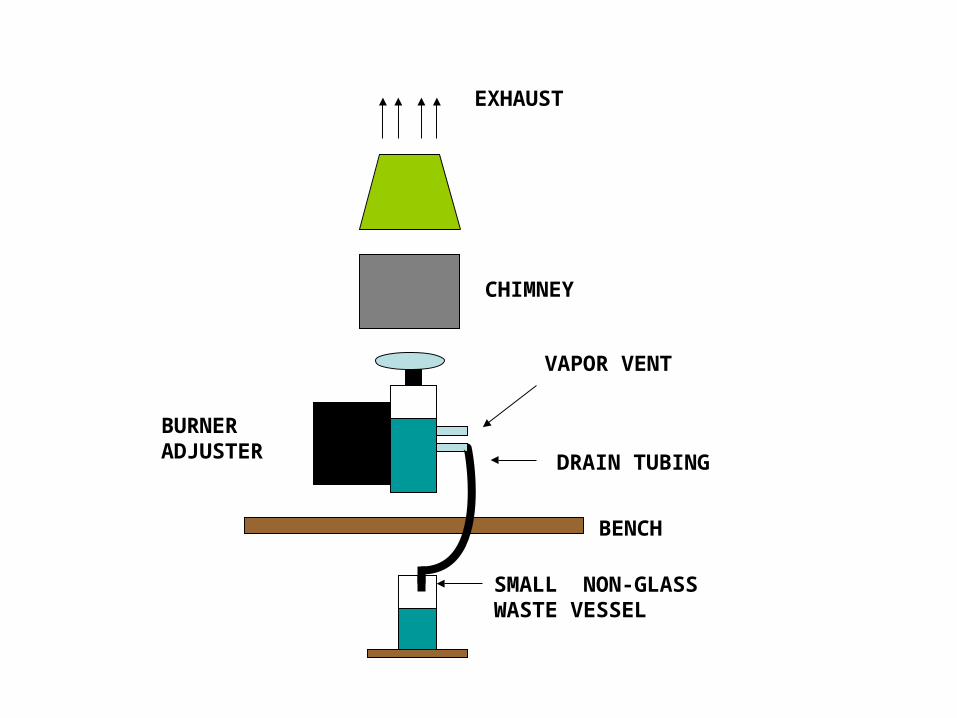
BURNER ADJUSTER
VAPOR VENT
DRAIN TUBING
EXHAUST
CHIMNEY
BENCH
SMALL NON-GLASSWASTE VESSEL
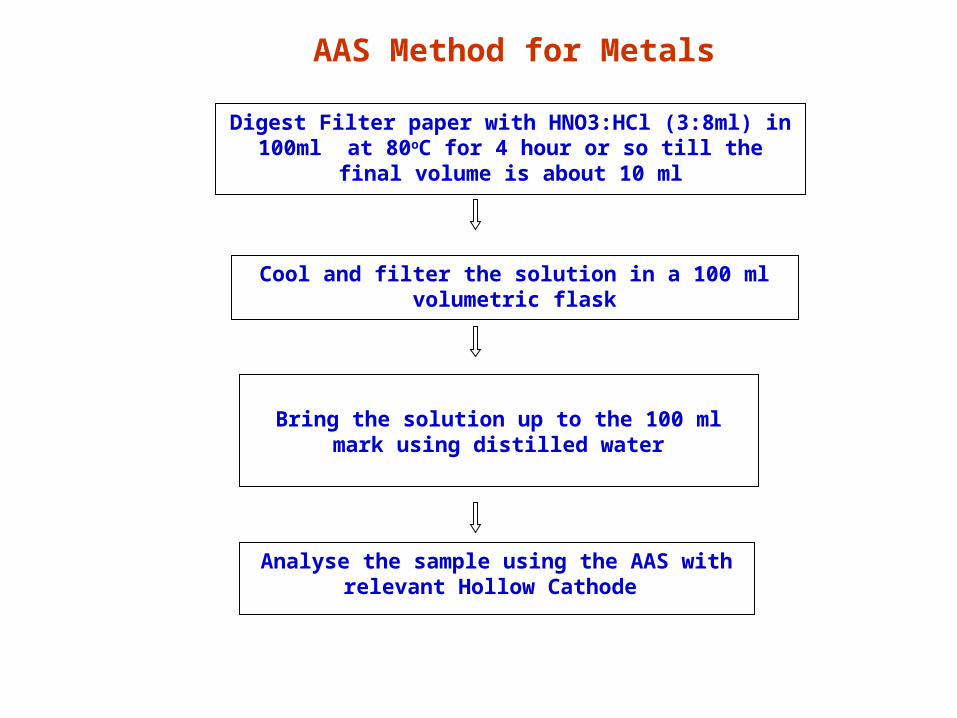
Cool and filter the solution in a 100 ml volumetric flask
Bring the solution up to the 100 ml mark using distilled water
Analyse the sample using the AAS with relevant Hollow Cathode
AAS Method for Metals
Digest Filter paper with HNO3:HCl (3:8ml) in 100ml at 80oC for 4 hour or so till the final volume is about 10 ml
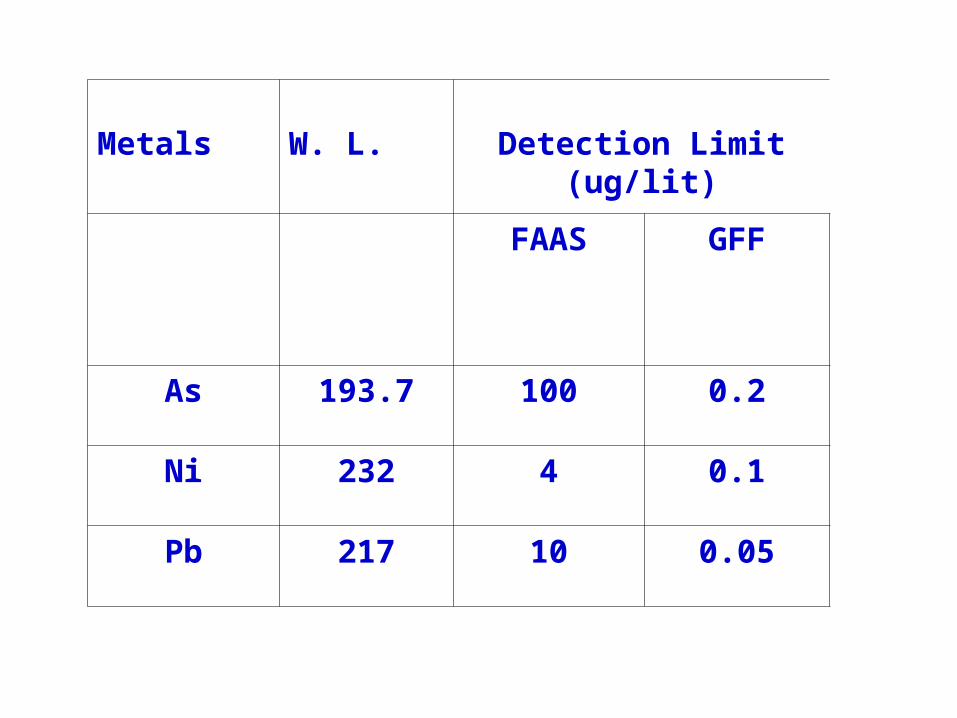
Metals W. L. Detection Limit (ug/lit)
FAAS GFF
As 193.7 100 0.2
Ni 232 4 0.1
Pb 217 10 0.05
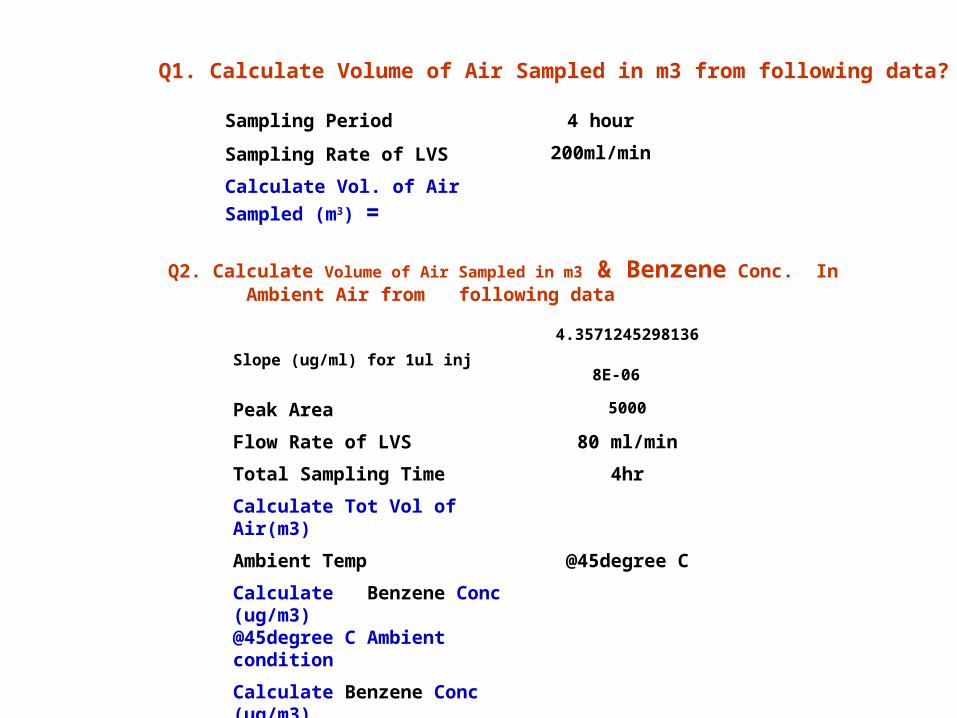
Q1. Calculate Volume of Air Sampled in m3 from following data?
Sampling Period 4 hour
Sampling Rate of LVS 200ml/min
Calculate Vol. of Air Sampled (m3) =
Q2. Calculate Volume of Air Sampled in m3 & Benzene Conc. In Ambient Air from following data
Slope (ug/ml) for 1ul inj4.35712452981368
E-06 Peak Area 5000
Flow Rate of LVS 80 ml/minTotal Sampling Time 4hrCalculate Tot Vol of Air(m3)Ambient Temp @45degree CCalculate Benzene Conc (ug/m3) @45degree C Ambient conditionCalculate Benzene Conc (ug/m3) @25degree C Ambient condition
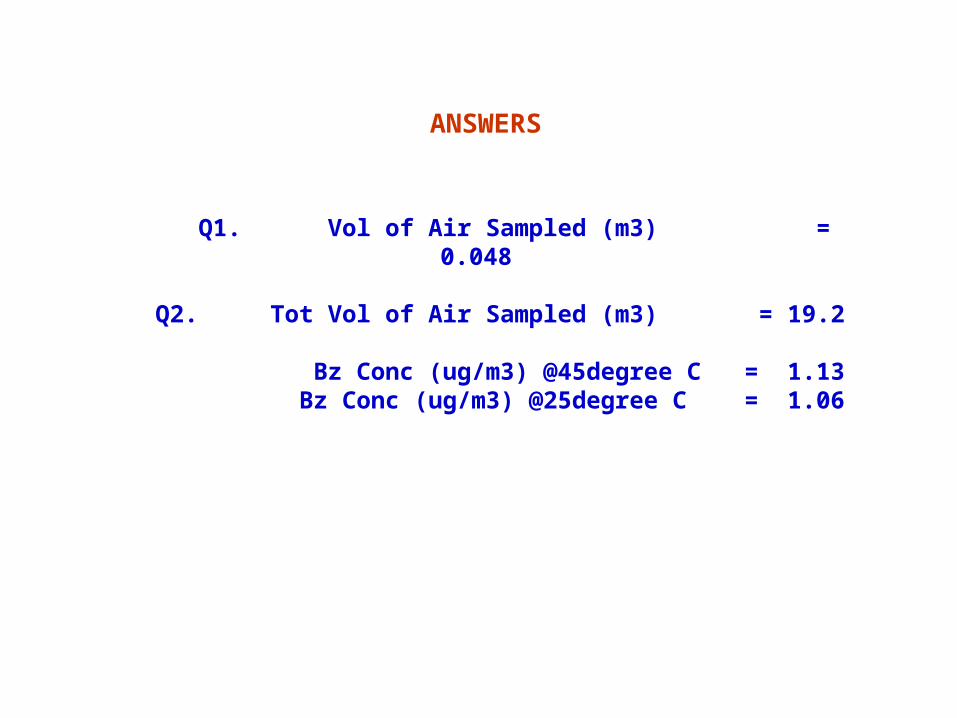
Q1. Vol of Air Sampled (m3) = 0.048
Q2. Tot Vol of Air Sampled (m3) = 19.2
Bz Conc (ug/m3) @45degree C = 1.13
Bz Conc (ug/m3) @25degree C = 1.06
ANSWERS

PRESERVE PLANET EARTH
THROUGH YOUR DEEDS

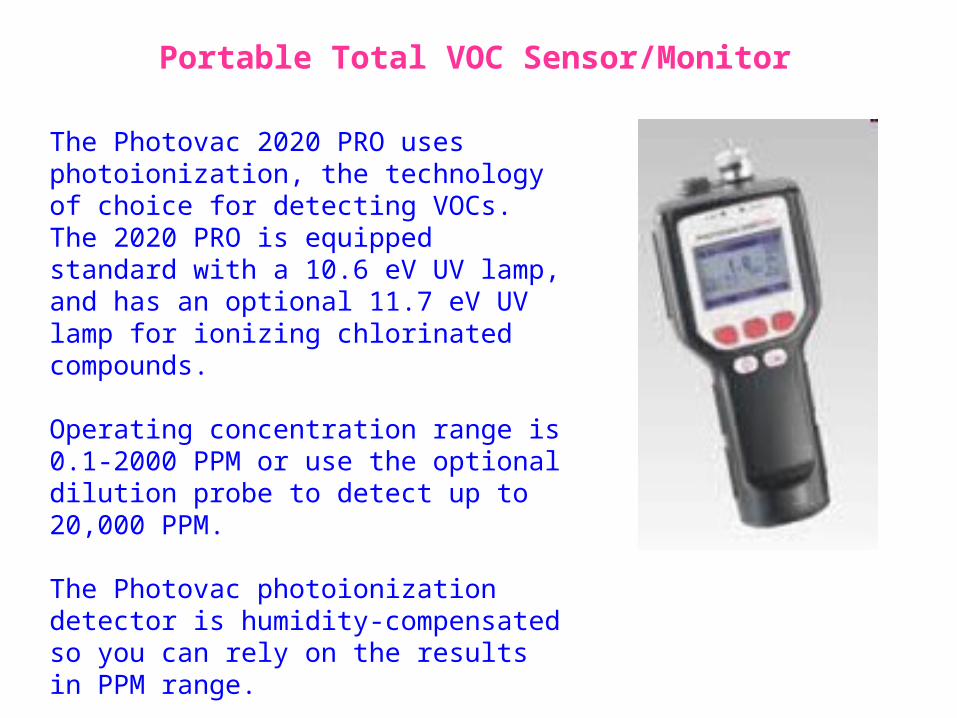
The Photovac 2020 PRO uses photoionization, the technology of choice for detecting VOCs. The 2020 PRO is equipped standard with a 10.6 eV UV lamp, and has an optional 11.7 eV UV lamp for ionizing chlorinated compounds.
Operating concentration range is 0.1-2000 PPM or use the optional dilution probe to detect up to 20,000 PPM.
The Photovac photoionization detector is humidity-compensated so you can rely on the results in PPM range.
Portable Total VOC Sensor/Monitor
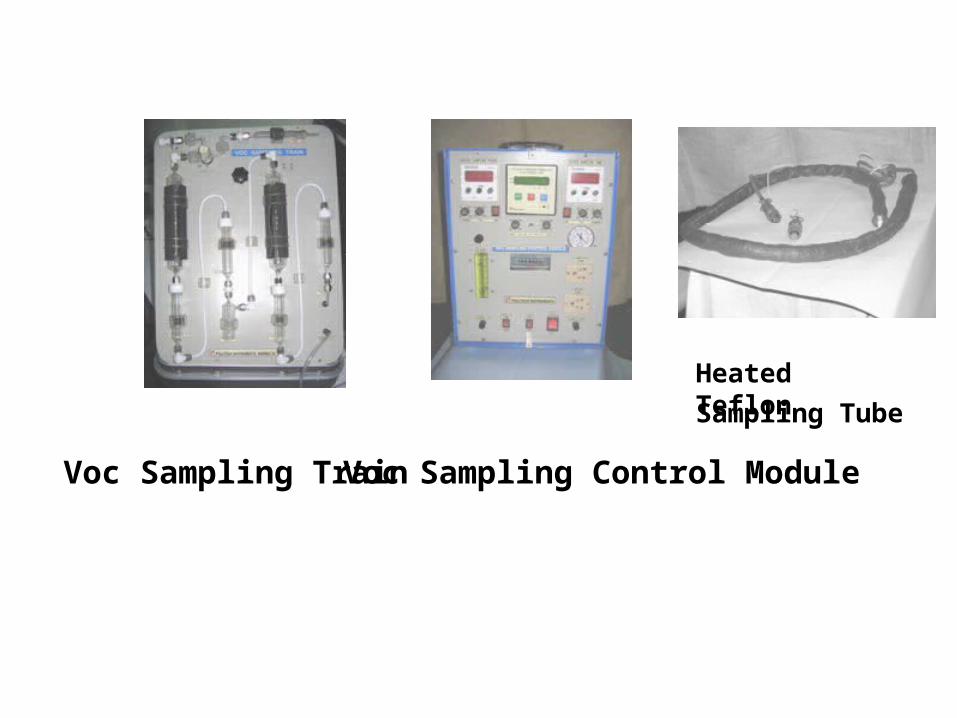
Voc Sampling Train
Voc Sampling Control Module
Heated TeflonSampling Tube


![Sector+ +Feb10[1]](https://img.pdfslide.us/doc/110x75/577d29011a28ab4e1ea5c422/sector-feb101.jpg)