Embed Size (px)
Citation preview
Challenges)and)adapta-ons)to)persistence)in)dynamic)environments:)-dewater)gobies)in)
northern)California)lagoons!
Michael!Hellmair*!&!Andrew!Kinziger!
*Current!affilia9on:!

Habitat)
• Endemic!to!CA!lagoons!and!estuaries!
• Low!connec9vity!• Limited!migra9on!
• High!gene9c!differen9a9on!between!!!popula9ons!!

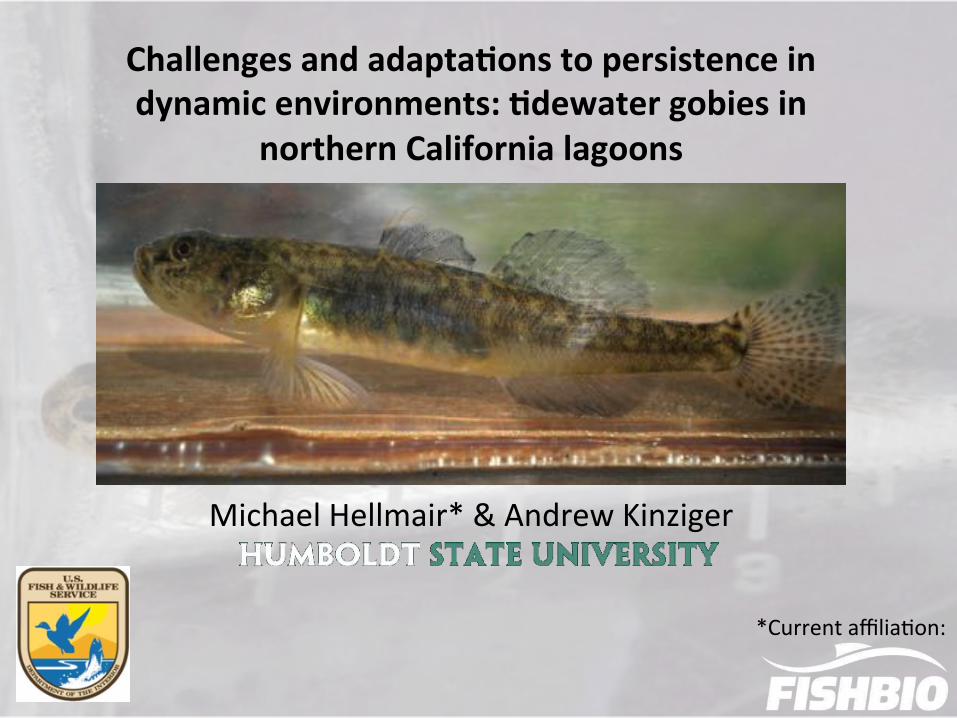
Habitat,)cont.!
• Dynamic!
• Breaching!events!
Habitat,)cont.)• !Fluctua9ons!in:!!
I!Water!level!I!Salinity!I!Temperature!
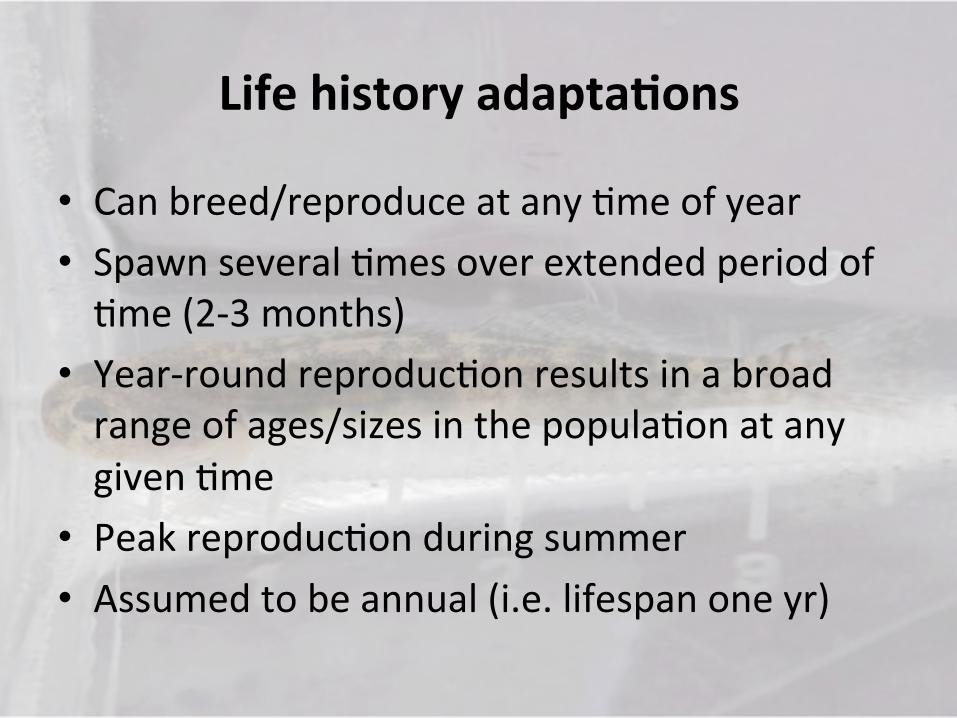
Life)history)adapta-ons)
• Can!breed/reproduce!at!any!9me!of!year!
• Spawn!several!9mes!over!extended!period!of!9me!(2I3!months)!
• YearIround!reproduc9on!results!in!a!broad!range!of!ages/sizes!in!the!popula9on!at!any!given!9me!
• Peak!reproduc9on!during!summer!
• Assumed!to!be!annual!(i.e.!lifespan!one!yr)!

Age)and)Growth)• Daily!age!determina9on!using!otolith!(sagiWae)!
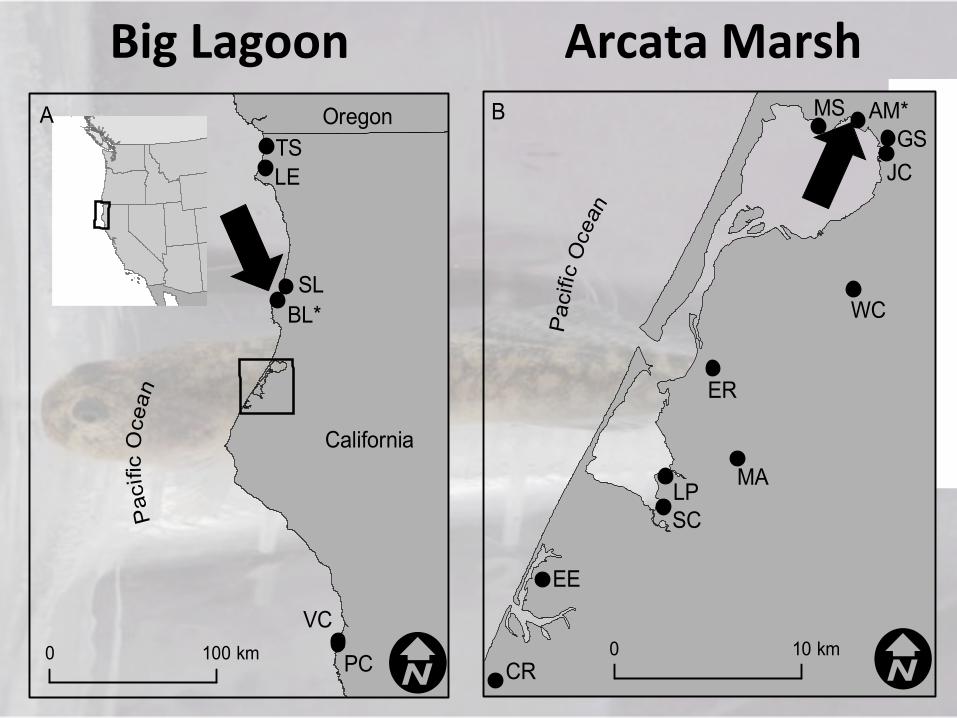
!!!!!Big)Lagoon) )))Arcata)Marsh)
0 100 km I
OregonP
acifi
c O
cean
California
A
I0 10 km
Pac
ific
Oce
an
B
SLBL*
VC
PC
TSLE
EE
SC
ER
WC
JCGS
AM*MS
MALP
CR
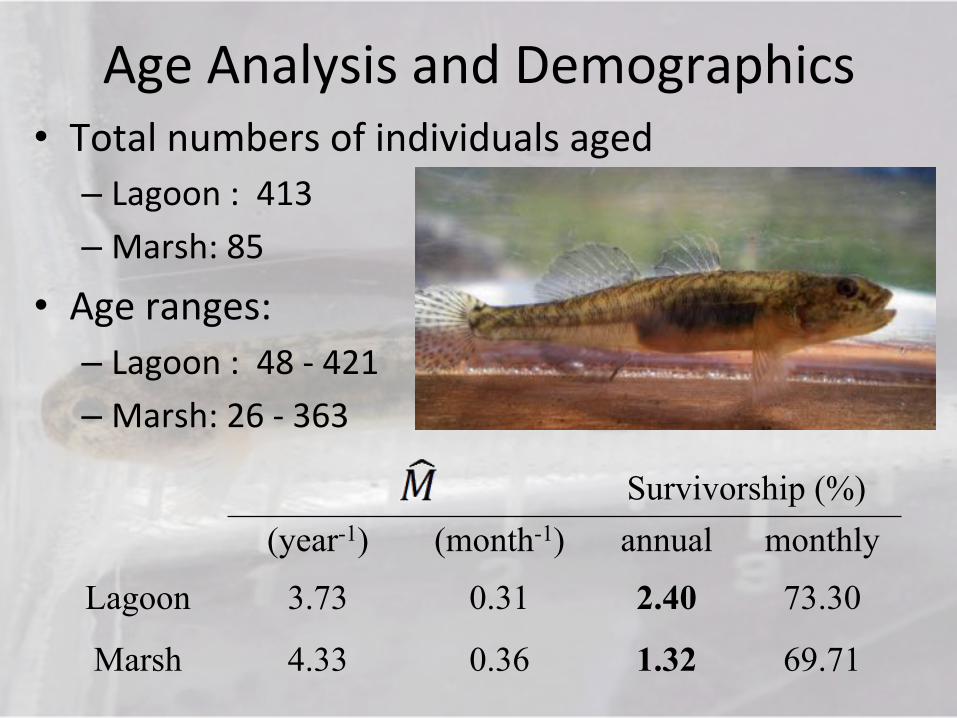
Age!Analysis!and!Demographics!• Total!numbers!of!individuals!aged!– Lagoon!:!!413!– Marsh:!85!
• Age!ranges:!– Lagoon!:!!48!I!421!– Marsh:!26!I!363!
!Survivorship (%)
(year-1) (month-1) annual monthly
Lagoon 3.73 0.31 2.40 73.30
Marsh 4.33 0.36 1.32 69.71
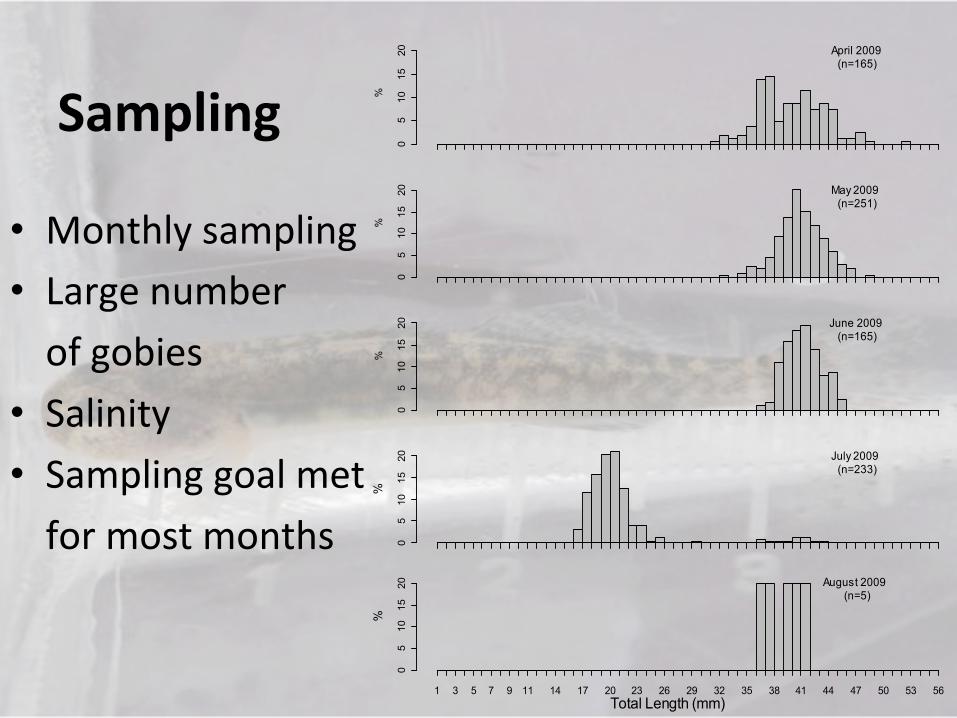
Sampling)
• Monthly!sampling!
• Large!number!
!of!gobies!
• Salinity!• Sampling!goal!met!
!for!most!months!
%
05
1015
20 April 2009 (n=165)
%
05
1015
20 May 2009 (n=251)
%
05
1015
20 June 2009 (n=165)
%
05
1015
20 July 2009 (n=233)
%
1 3 5 7 9 11 14 17 20 23 26 29 32 35 38 41 44 47 50 53 56
05
1015
20 August 2009 (n=5)
Total Length (mm)
Marsh

Lagoon%
05
1015
20 April 2010 (n = 202) Salinity 11‰
Marsh
%
05
1015
20July 2009 (n = 233) Salinity 12‰
Length(mm)
%
0 4 8 14 20 26 32 38 44 50
05
1015
20 May 2010 (n = 265) Salinity 27‰
Length(mm)
0 4 8 14 20 26 32 38 44 50
05
1015
20August 2009 (n = 5) Salinity 34‰

BackCcalculated)birthday)distribu-ons))(from)daily)otolith)ages))
Mar
shLa
goon
*La
goon
Jan08
Apr08
Jul08
Oct08
Jan09
Apr09
Jul09
Oct09
Jan10
Apr10
Jul10
Oct10
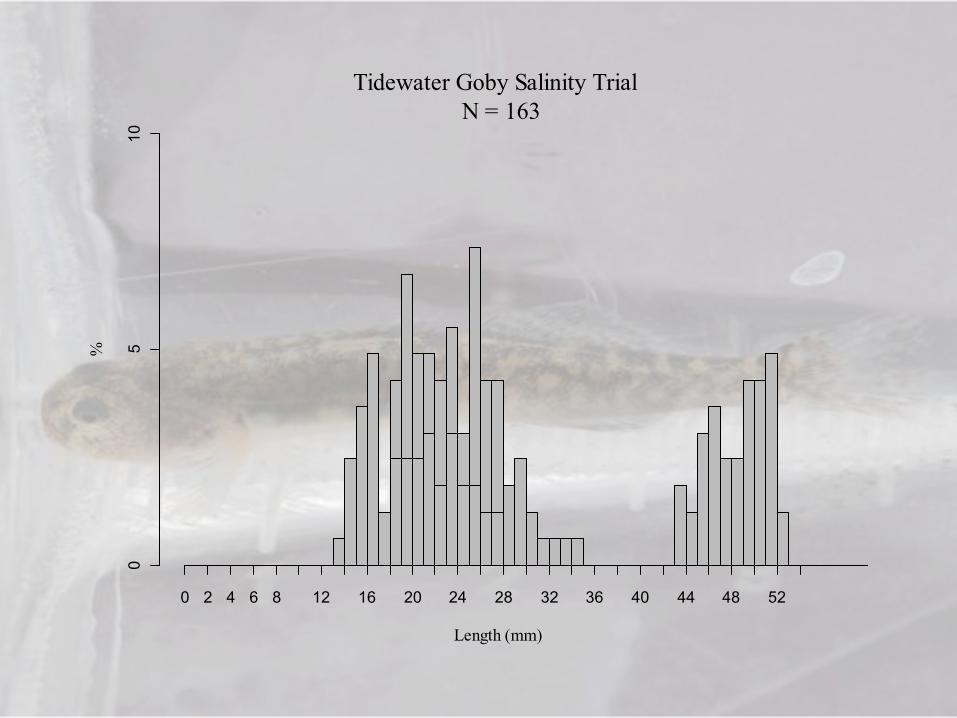
Tidewater Goby Salinity Trial N = 163
Length (mm)
%
0 2 4 6 8 12 16 20 24 28 32 36 40 44 48 52
05
10
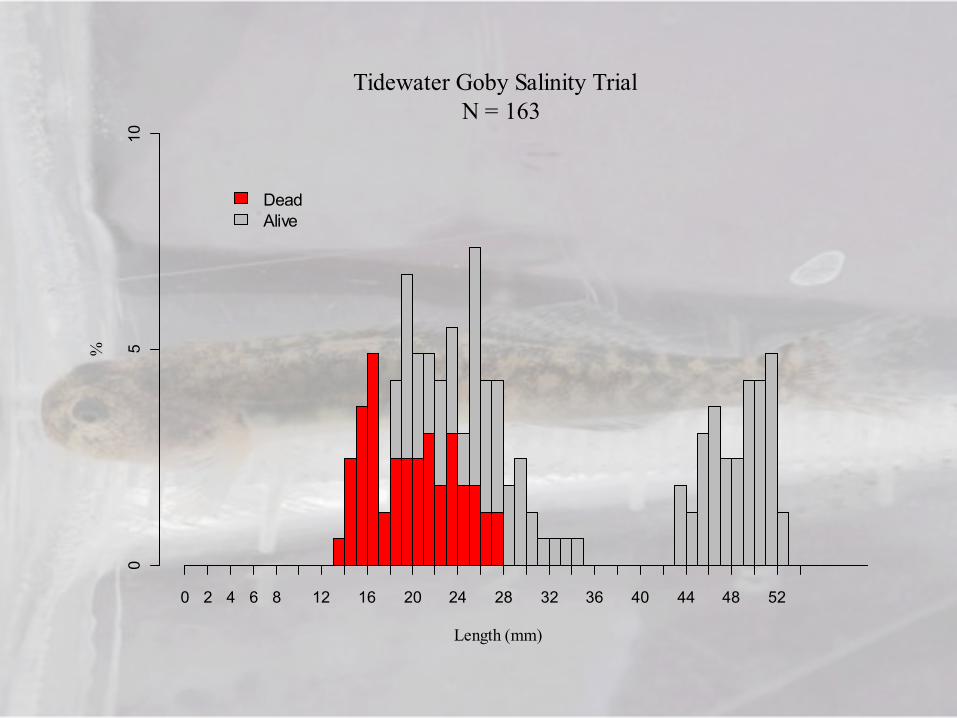
Tidewater Goby Salinity Trial N = 163
Length (mm)
%
0 2 4 6 8 12 16 20 24 28 32 36 40 44 48 52
05
10
DeadAlive

Metapopula-on)gene-cs)Population Area (ha) n Mean sizea
(mm) SD Size rangea
(mm) HE
b Arc
Virgin Creek (VC) 4.5 60 28.85 3.84 18 0.57d 3.69 Big Lagoon (BL) 612.5 60 32.47 6.46 25 0.56d 4.92
Stone Lagoon (SL) 236.7 60 28.95 8.39 32 0.52d 4.89 Pudding Creek (PC) 9.5 60 35.28 5.16 20 0.45d 2.94
Eel River (EE) 108.5 60 40.78 4.38 20 0.28d 2.67 Elk River (ER) 35.1 60 32.93 6.55 27 0.28d 1.83 Lake Earl (LE) 1085.4 60 22.10 3.86 17 0.26 3.18
Tillas Slough (TS) 6.6 60 25.72 2.00 8 0.26 2.40 Connick Ranch (CR) 6.4 60 41.40 4.35 17 0.25 2.48
Long Pond (LP) 2.3 60 38.1 4.05 17 0.24 2.20 Salmon Creek (SC) 396.9 60 28.90 4.21 18 0.23d 2.21
Gannon Slough (GS) 18.2 60 41.15 2.79 13 0.22d 1.87 Martin Slough (MA) 0.2 60 30.22 3.30 14 0.21 1.78
McDaniel Slough (MS) 34.8 31 27.23 2.65 12 0.18d 1.75 Jacoby Creek (JC) 6.2 58 20.00 2.54 11 0.16d 1.66 Wood Creek (WC) 0.4 59 31.65 3.75 13 0.10d 1.36 Arcata Marsh (AM) 0.2 165 40.69 1.98 11 0.08 1.36
a!Size!is!defined!at!total!length!(TL)!b!Mean!expected!HardyIWeinberg!heterozygosity!!c!Rarefied!allelic!richness!d!Heterozygosity!es9mates!obtained!from!McCraney!et!al.!(2010))!
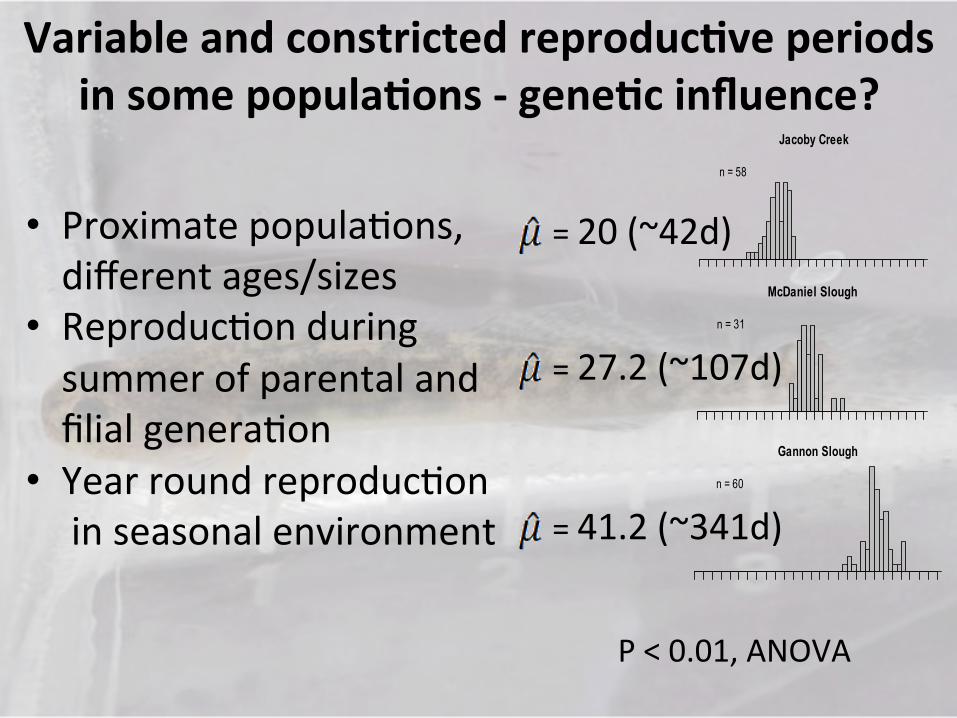
P!<!0.01,!ANOVA!
• Proximate!popula9ons,!!!different!ages/sizes!• Reproduc9on!during!!!summer!of!parental!and!!!filial!genera9on!• Year!round!reproduc9on!!!in!seasonal!environment!
!
!
Big Lagoon
%
05
10
15
20
25
n = 60
Stone Lagoon
%
n = 60
Virgin Creek
%
05
10
15
20
25
n = 60
Pudding Creek
%
05
10
15
20
25
n = 60
Gannon Slough
n = 60
McDaniel Slough
%
05
10
15
20
25
n = 31
Jacoby Creek
%
05
10
15
20
25
n = 58
Elk River
%
n = 60
Salmon Creek
%
05
10
15
20
25
n = 60
Eel River
%
0 4 8 12 16 20 24 28 32 36 40 44 48 52
05
10
15
20
25
n = 60
Wood Creek
%
0 4 8 12 16 20 24 28 32 36 40 44 48 52
n = 59
Marsh
%
0 4 8 12 16 20 24 28 32 36 40 44 48 52
05
10
15
20
25
n = 165
Total Length (mm)
Big Lagoon
%
05
10
15
20
25
n = 60
Stone Lagoon
%
n = 60
Virgin Creek
%
05
10
15
20
25
n = 60
Pudding Creek
%
05
10
15
20
25
n = 60
Gannon Slough
n = 60
McDaniel Slough
%
05
10
15
20
25
n = 31
Jacoby Creek
%
05
10
15
20
25
n = 58
Elk River
%n = 60
Salmon Creek
%
05
10
15
20
25
n = 60
Eel River
%
0 4 8 12 16 20 24 28 32 36 40 44 48 52
05
10
15
20
25
n = 60
Wood Creek
%
0 4 8 12 16 20 24 28 32 36 40 44 48 52
n = 59
Marsh
%0 4 8 12 16 20 24 28 32 36 40 44 48 52
05
10
15
20
25
n = 165
Total Length (mm)
=!27.2!(~107d)!
=!20!(~42d)!
=!41.2!(~341d)!
Variable)and)constricted)reproduc-ve)periods)in)some)popula-ons)C)gene-c)influence?)
!
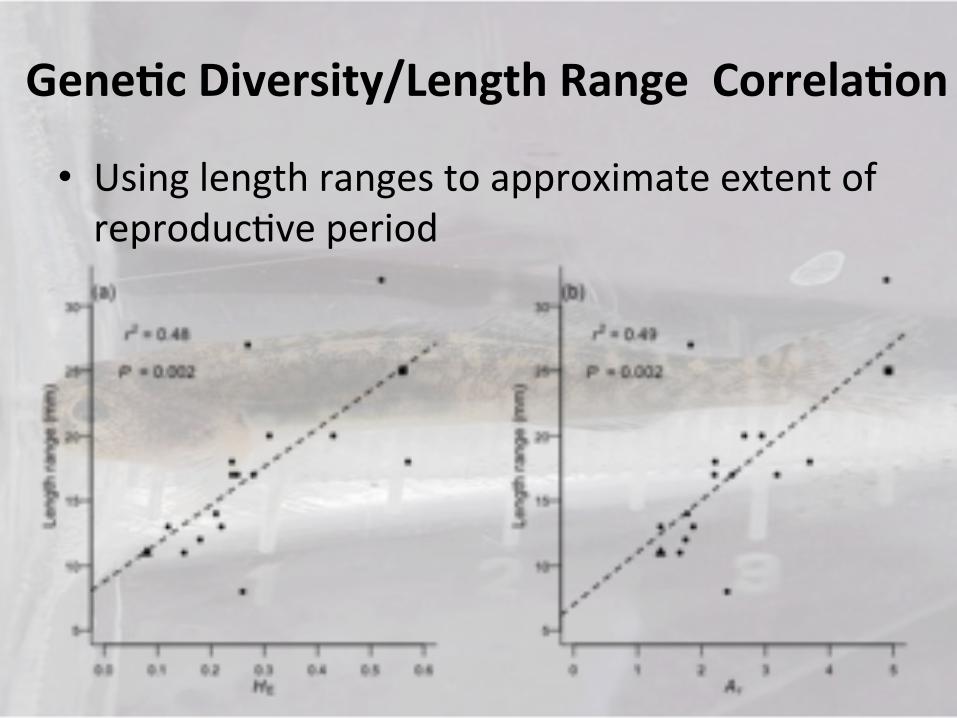
Gene-c)Diversity/Length)Range))Correla-on)
• Using!length!ranges!to!approximate!extent!of!reproduc9ve!period!

Summary)and)conclusions.....)
• Correla9on!between!varia9on/range!of!reproduc9ve!period!and!gene9c!diversity!
• Low!gene9c!diversity!is!associated!with!reduced!life!history!varia9on!
• Loss!of!lifeIhistory!safeguard!against!reproduc9ve!failure!
• Poriolio!effect:!applica9on!to!popula9on!level?!• Conserva9on!applica9on:!natural!dispersal!limited!to!adults?!
Acknowledgments)
• USFWS!
!
• T.!Laidig,!M.!Koenig,!G.!Hendrickson!&!J.!Varkey!
• Faculty!at!!!!Samples! were! collected! either! by! the! USFWS! or! under! California! Scien9fic!
Collec9ng!Permit!SCI10527!following!IACUC!protocol!(08/09.F.44.A)!
Increased Extinction Potential of Insular Fish Populationswith Reduced Life History Variation and Low GeneticDiversityMichael Hellmair1,2*, Andrew P. Kinziger1
1Department of Fisheries Biology, Humboldt State University, Arcata, California, United States of America, 2 FISHBIO, Chico, California, United States of America
Abstract
Theoretical work has shown that reduced phenotypic heterogeneity leads to population instability and can increaseextinction potential, yet few examples exist of natural populations that illustrate how varying levels expressed diversity mayinfluence population persistence, particularly during periods of stochastic environmental fluctuation. In this study, we assesslevels of expressed variation and genetic diversity among demographically independent populations of tidewater goby(Eucyclogobius newberryi), show that reductions in both factors typically coincide, and describe how low levels of diversitycontribute to the extinction risk of these isolated populations. We illustrate that, for this annual species, continuousreproduction is a safeguard against reproductive failure by any one population segment, as natural, stochastically drivensalinity increases frequently result in high mortality among juvenile individuals. Several study populations deviated from thenatural pattern of year-round reproduction typical for the species, rendering those with severely truncated reproductiveperiods vulnerable to extinction in the event of environmental fluctuation. In contrast, demographically diverse populationsare more likely to persist through such periods through the continuous presence of adults with broader physiologicaltolerance to abrupt salinity changes. Notably, we found a significant correlation between genetic diversity anddemographic variation in the study populations, which could be the result of population stressors that restrict both of thesediversity measures simultaneously, or suggestive of a causative relationship between these population characteristics. Thesefindings demonstrate the importance of biocomplexity at the population level, and assert that the maintenance of diversitycontributes to population resilience and conservation of this endangered species.
Citation: Hellmair M, Kinziger AP (2014) Increased Extinction Potential of Insular Fish Populations with Reduced Life History Variation and Low GeneticDiversity. PLoS ONE 9(11): e113139. doi:10.1371/journal.pone.0113139
Editor: Sofia Consuegra, Swansea University, United Kingdom
Received June 11, 2014; Accepted October 22, 2014; Published November 19, 2014
Copyright: ! 2014 Hellmair, Kinziger. This is an open-access article distributed under the terms of the Creative Commons Attribution License, which permitsunrestricted use, distribution, and reproduction in any medium, provided the original author and source are credited.
Data Availability: The authors confirm that all data underlying the findings are fully available without restriction. All relevant data are within the paper and itsSupporting Information files.
Funding: Funding for this study was provided by the United States Fish and Wildlife Service (www.fws.gov) to Andrew P. Kinziger, administered through theHumboldt State University Sponsored Programs Foundation. The funder had no active role in study design, data collection and analysis, or preparation of themanuscript, but consents to publication.
Competing Interests: The authors have declared that no competing interests exist.
* Email: [email protected]
Introduction
Life-history diversity and genetic variation are two forms ofbiodiversity deemed worthy of conservation by the WorldConservation Union (IUCN), and are considered essential toretaining fitness and long-term adaptive potential of populations[1]–[3]. Further, it is often invoked that expressed forms ofdiversity contribute to the stability of biological systems: highspecies diversity often stabilizes ecosystem processes [4]–[7], andvariation among populations of individual species buffers fluctu-ations in the species’ cumulative abundance and the ecosystemservices it provides [8]–[11]. However, the role of diversity withinindividual populations of a species has remained largely unex-plored, though there is some experimental evidence that post-disturbance variance in abundance is stabilized by diversity, andextinction risk becomes more predictable as a consequence [12].In this study, we investigated age composition and genetic
diversity among isolated populations of tidewater goby (Eucyclo-gobius newberryi), a short-lived, endangered fish that inhabitsdynamic coastal habitats subject to frequent environmental
changes [13]–[15]. We discuss the importance of life historyvariability within geographically isolated populations in thecontext of the species’ biology, and suggest that reduced levels ofvariation, particularly in the temporal extent of the reproductiveperiod, render affected populations more susceptible to localizedextirpation during periods of environmental disturbance.The tidewater goby is a small (,60 mm total length), annual
fish endemic to California, that occurs in brackish, isolated, andoften very small (less than 10 hectares) estuaries along the coast,from just south of the Oregon border to San Diego, USA [13]–[15]. Among insular populations of tidewater goby, levels ofgenetic differentiation are often very high, despite geographicproximity [16]. Further, the level of genetic diversity withinpopulations varies widely (as measured by allelic richness andheterozygosity; see [16] for a discussion on population structure ofthe species’ northern range; Figure 1; Table 1). Migrationbetween populations is unlikely, as suitable habitats are typicallyseparated from the Pacific Ocean by sandbars most of the year[13], [14], [16], [17], and requires coincident breaching eventsbetween sites. Breaching generally occurs 1–2 times annually
PLOS ONE | www.plosone.org 1 November 2014 | Volume 9 | Issue 11 | e113139