Embed Size (px)
Citation preview
THINKING beyond the canopy
FORAFAMA Carbon storage and logging activities: field assessment in Central Africa
Denis J. Sonwa1; Shu Gideon Neba2, Njome Daniel3, Djomo Jocelyne3; Valentina Robiglio4; Sufo Kankeu Richard1; Metet Arnauld3, Moankang Nkal Noelle Marlene3, Eba’a Atyi Richard1
• 1. Center for International Forestry Research, Yaoundé Cameroon. • 2. University of Helsinki (Finland) • 3.University of Dschang (Cameroon) • 4. IITA –Cameroon (Now ICRAF-Perou) • Corresponding Email [email protected]
Atelier de restitution finale sur le REDD+ dans les concessions forestières d’Afrique centrale et du Brésil (Projet FORAFAMA : Appui à la Gestion Durable des Forêts du Bassin du Congo et du Bassin Amazonien du Brésil), H Hôtel Mont Fébé, Yaoundé,18 Juin 2014
THINKING beyond the canopy
Plan
§ Background
§ Carbon stock assessment
• ètree-fall gaps • èAnnual Allowable Cut (AAC) • èDifferents logging regimes
§ Conclusion
* EDF 2008
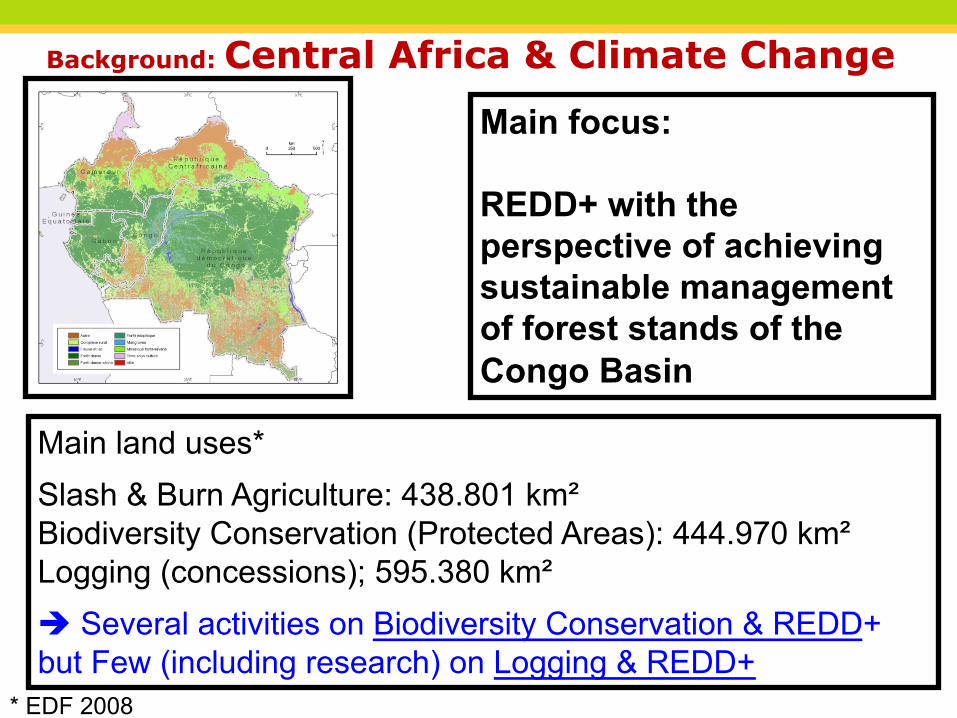
Main focus: REDD+ with the perspective of achieving sustainable management of forest stands of the Congo Basin
Background: Central Africa & Climate Change
Main land uses*
Slash & Burn Agriculture: 438.801 km² Biodiversity Conservation (Protected Areas): 444.970 km² Logging (concessions); 595.380 km²
è Several activities on Biodiversity Conservation & REDD+ but Few (including research) on Logging & REDD+
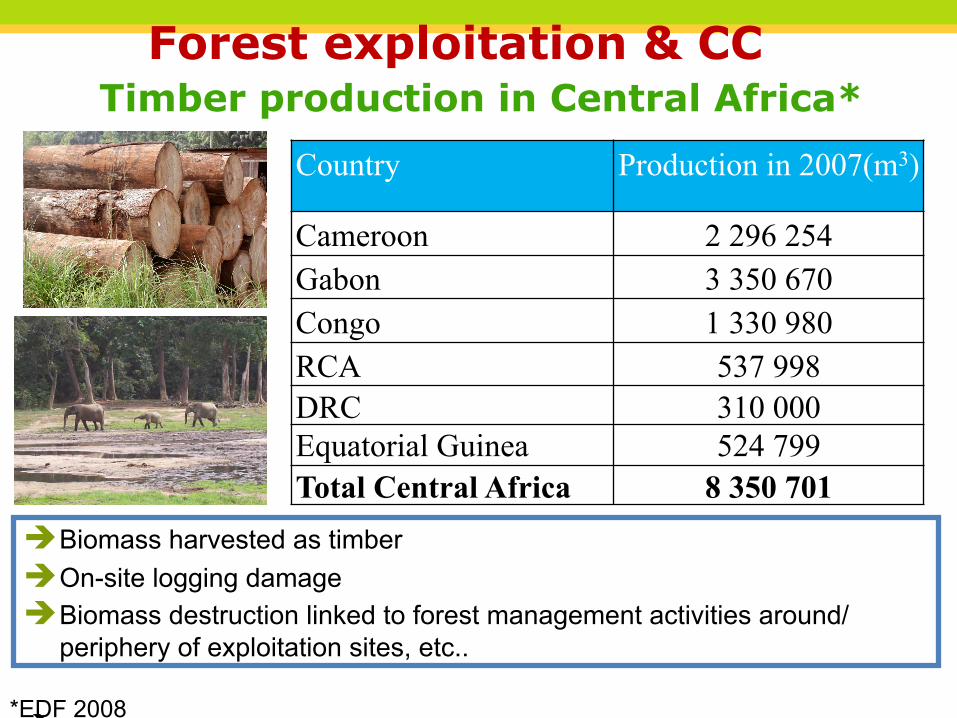
Country Production in 2007(m3)
Cameroon 2 296 254 Gabon 3 350 670 Congo 1 330 980 RCA 537 998 DRC 310 000 Equatorial Guinea 524 799 Total Central Africa 8 350 701
Timber production in Central Africa*
*EDF 2008
è Biomass harvested as timber è On-site logging damage è Biomass destruction linked to forest management activities around/
periphery of exploitation sites, etc.. è
Forest exploitation & CC
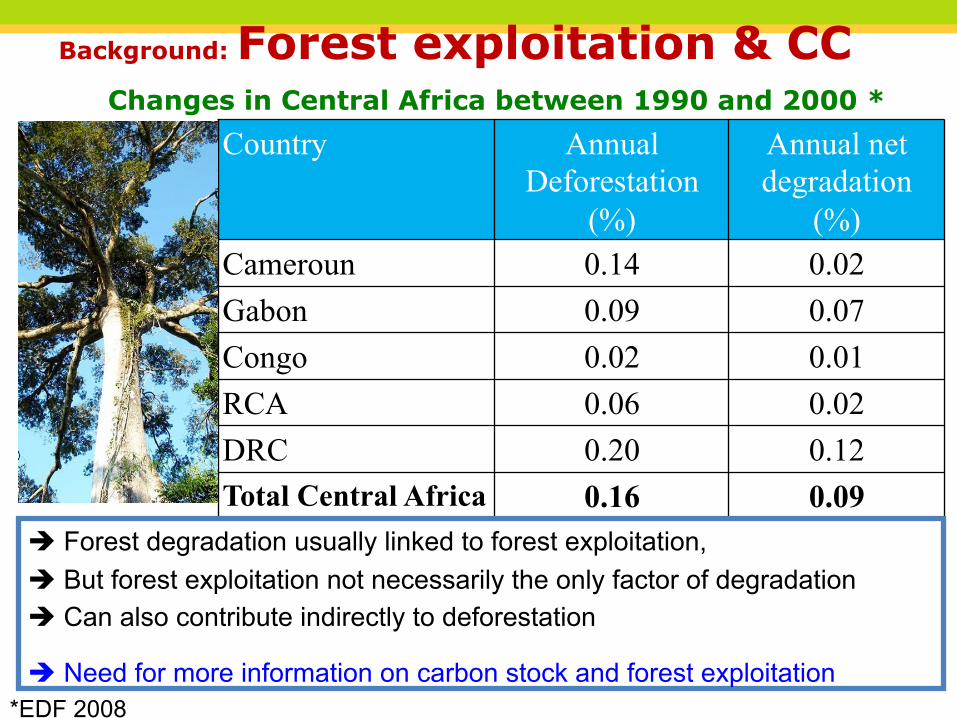
Country Annual Deforestation
(%)
Annual net degradation
(%) Cameroun 0.14 0.02 Gabon 0.09 0.07 Congo 0.02 0.01 RCA 0.06 0.02 DRC 0.20 0.12 Total Central Africa 0.16 0.09
Changes in Central Africa between 1990 and 2000 *
*EDF 2008
è Forest degradation usually linked to forest exploitation, è But forest exploitation not necessarily the only factor of degradation è Can also contribute indirectly to deforestation
è Need for more information on carbon stock and forest exploitation
Background: Forest exploitation & CC
THINKING beyond the canopy
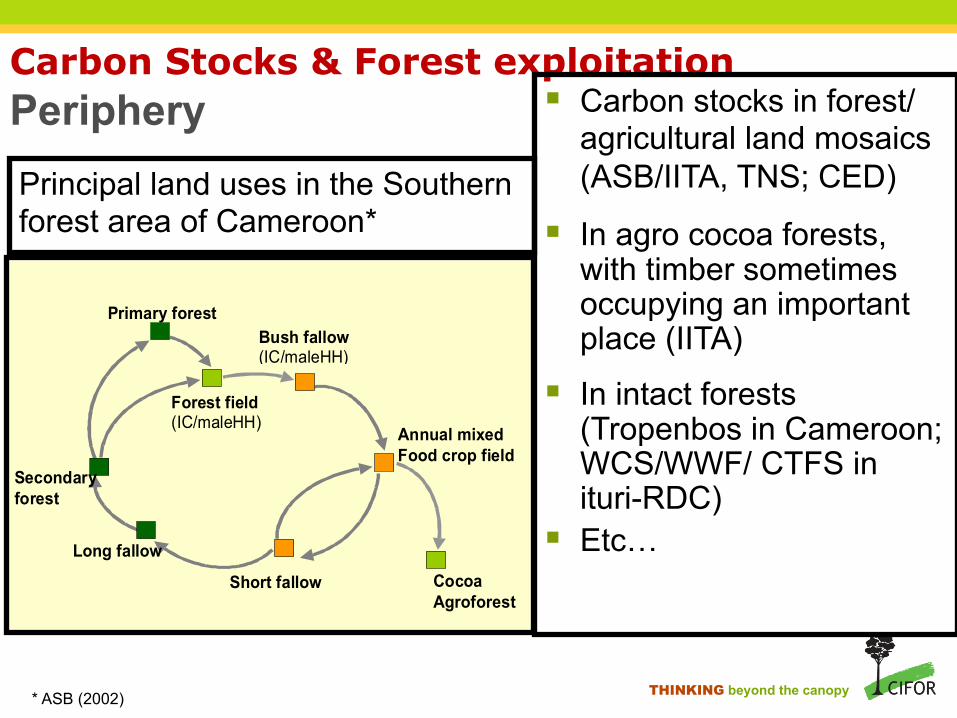
Carbon Stocks & Forest exploitation Periphery § Carbon stocks in forest/
agricultural land mosaics (ASB/IITA, TNS; CED)
§ In agro cocoa forests, with timber sometimes occupying an important place (IITA)
§ In intact forests (Tropenbos in Cameroon; WCS/WWF/ CTFS in ituri-RDC)
§ Etc…
Primary forest
Forest field (IC/maleHH)
Bush fallow (IC/maleHH)
Annual mixed Food crop field
Cocoa Agroforest
Short fallow
Long fallow
Secondary forest
Principal land uses in the Southern forest area of Cameroon*
* ASB (2002)
THINKING beyond the canopy
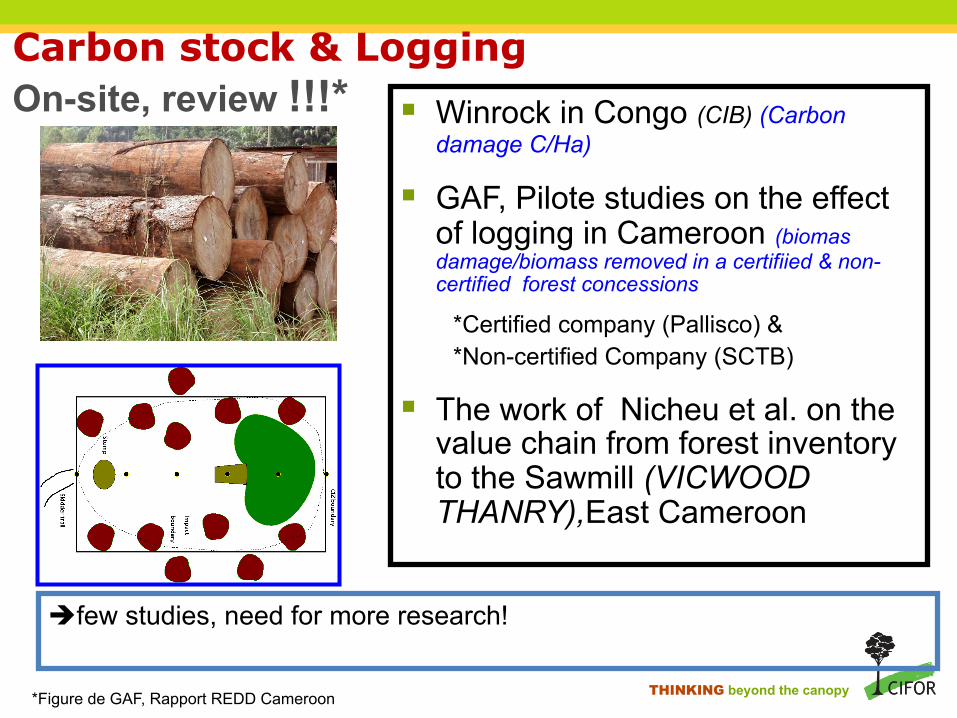
§ Winrock in Congo (CIB) (Carbon damage C/Ha)
§ GAF, Pilote studies on the effect of logging in Cameroon (biomas damage/biomass removed in a certifiied & non-certified forest concessions
*Certified company (Pallisco) & *Non-certified Company (SCTB)
§ The work of Nicheu et al. on the value chain from forest inventory to the Sawmill (VICWOOD THANRY),East Cameroon
èfew studies, need for more research!
Carbon stock & Logging On-site, review !!!*
*Figure de GAF, Rapport REDD Cameroon
THINKING beyond the canopy
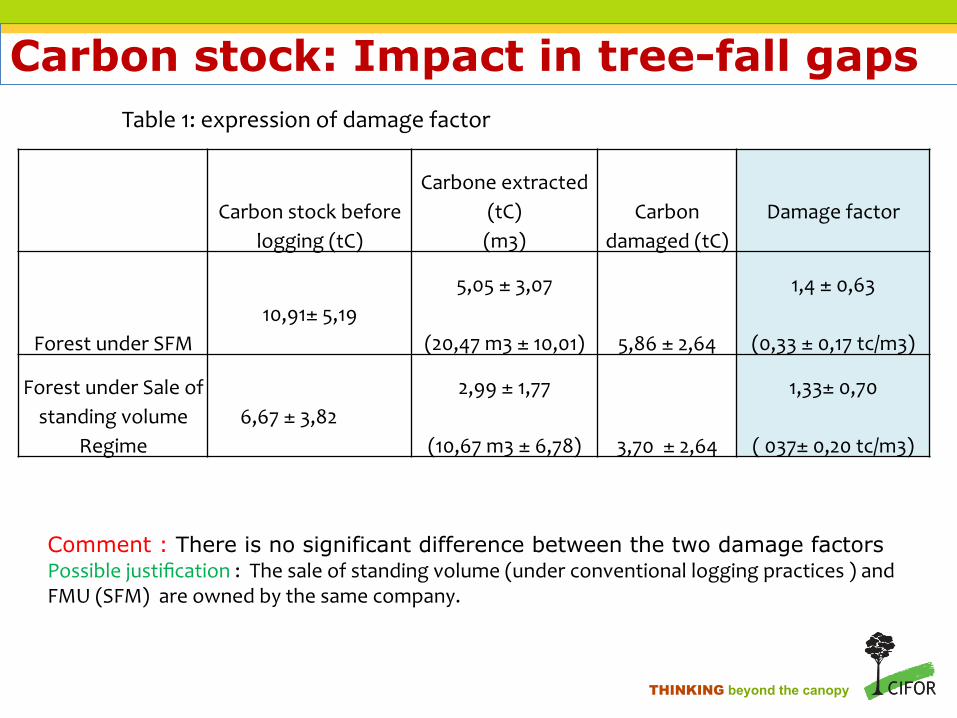
Table 1: expression of damage factor
Comment : There is no significant difference between the two damage factors Possible justification : The sale of standing volume (under conventional logging practices ) and FMU (SFM) are owned by the same company.
Carbon stock before logging (tC)
Carbone extracted (tC) (m3)
Carbon damaged (tC)
Damage factor
Forest under SFM 10,91± 5,19
5,05 ± 3,07
(20,47 m3 ± 10,01) 5,86 ± 2,64
1,4 ± 0,63
(0,33 ± 0,17 tc/m3)
Forest under Sale of standing volume
Regime 6,67 ± 3,82
2,99 ± 1,77
(10,67 m3 ± 6,78) 3,70 ± 2,64
1,33± 0,70
( 037± 0,20 tc/m3)
Carbon stock: Impact in tree-fall gaps
THINKING beyond the canopy
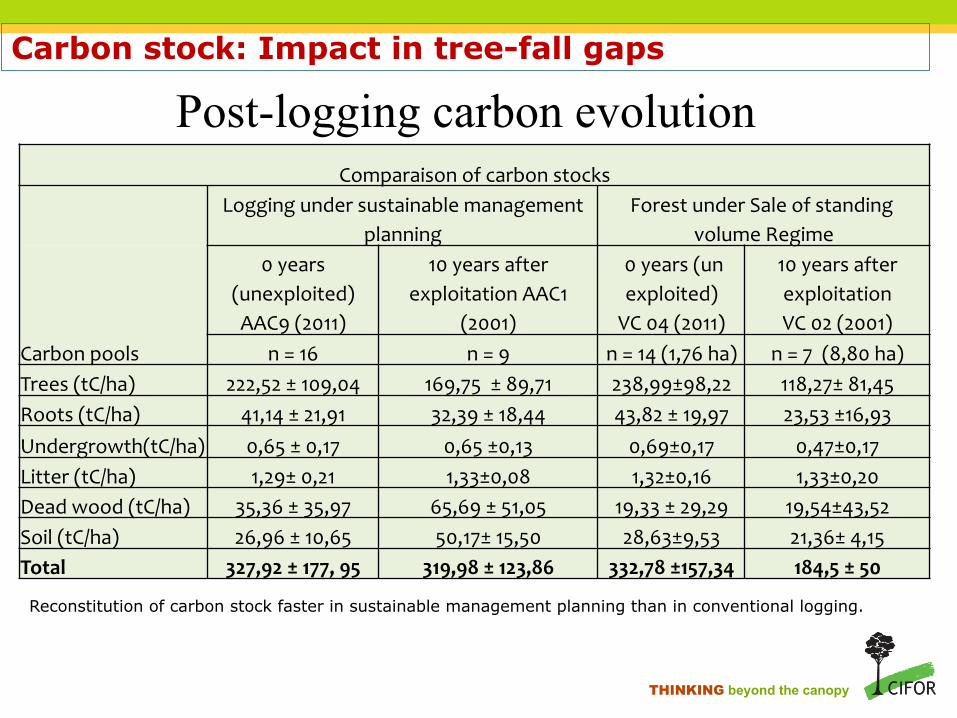
Reconstitution of carbon stock faster in sustainable management planning than in conventional logging.
Comparaison of carbon stocks
Logging under sustainable management
planning Forest under Sale of standing
volume Regime
0 years (unexploited) AAC9 (2011)
10 years after exploitation AAC1
(2001)
0 years (un exploited) VC 04 (2011)
10 years after exploitation VC 02 (2001)
Carbon pools n = 16 n = 9 n = 14 (1,76 ha) n = 7 (8,80 ha) Trees (tC/ha) 222,52 ± 109,04 169,75 ± 89,71 238,99±98,22 118,27± 81,45 Roots (tC/ha) 41,14 ± 21,91 32,39 ± 18,44 43,82 ± 19,97 23,53 ±16,93 Undergrowth(tC/ha) 0,65 ± 0,17 0,65 ±0,13 0,69±0,17 0,47±0,17 Litter (tC/ha) 1,29± 0,21 1,33±0,08 1,32±0,16 1,33±0,20 Dead wood (tC/ha) 35,36 ± 35,97 65,69 ± 51,05 19,33 ± 29,29 19,54±43,52 Soil (tC/ha) 26,96 ± 10,65 50,17± 15,50 28,63±9,53 21,36± 4,15 Total 327,92 ± 177, 95 319,98 ± 123,86 332,78 ±157,34 184,5 ± 50
Post-logging carbon evolution Carbon stock: Impact in tree-fall gaps
THINKING beyond the canopy
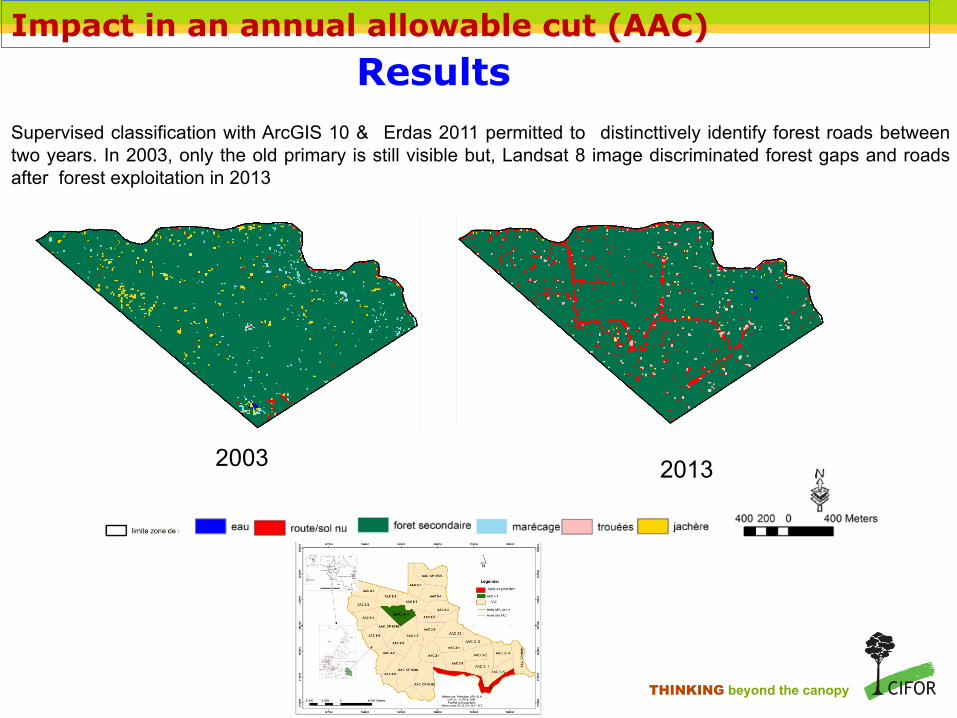
Results Supervised classification with ArcGIS 10 & Erdas 2011 permitted to distincttively identify forest roads between two years. In 2003, only the old primary is still visible but, Landsat 8 image discriminated forest gaps and roads after forest exploitation in 2013
2003 2013
Impact in an annual allowable cut (AAC)
THINKING beyond the canopy
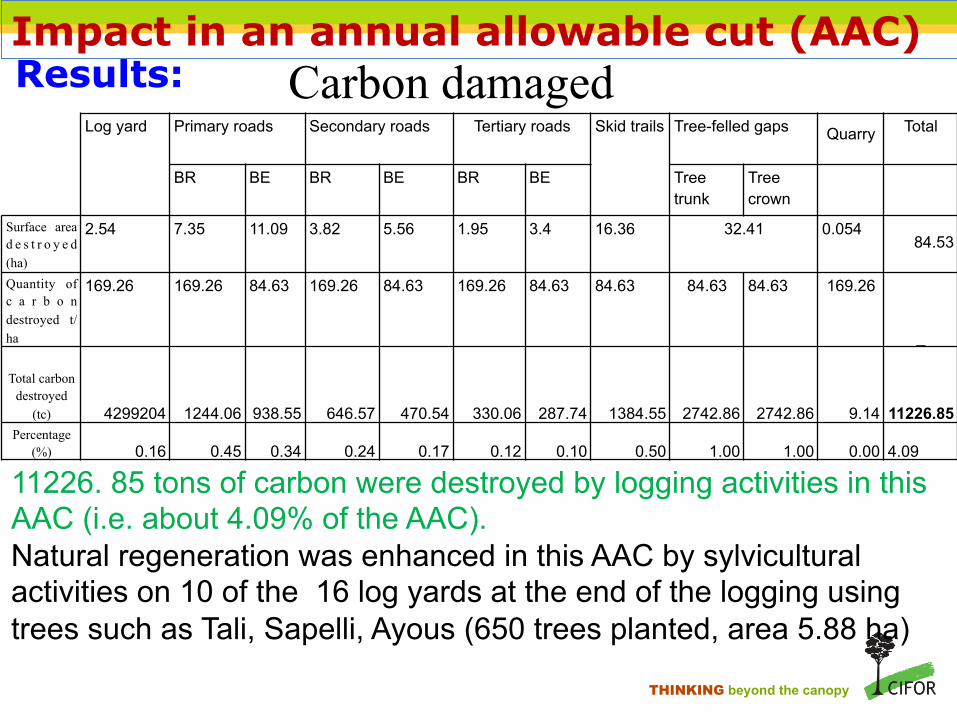
Results: Log yard Primary roads Secondary roads Tertiary roads Skid trails Tree-felled gaps Quarry
Total
BR BE BR BE BR BE Tree trunk
Tree crown
Surface area d e s t r o y e d (ha)
2.54 7.35 11.09 3.82 5.56 1.95 3.4 16.36 32.41 0.054 84.53
Quantity of c a r b o n destroyed t/ha
169.26 169.26 84.63 169.26 84.63 169.26 84.63 84.63 84.63 84.63 169.26
_
Total carbon destroyed
(tc) 4299204 1244.06 938.55 646.57 470.54 330.06 287.74 1384.55 2742.86 2742.86 9.14 11226.85 Percentage
(%) 0.16 0.45 0.34 0.24 0.17 0.12 0.10 0.50 1.00 1.00 0.00 4.09
11226. 85 tons of carbon were destroyed by logging activities in this AAC (i.e. about 4.09% of the AAC). Natural regeneration was enhanced in this AAC by sylvicultural activities on 10 of the 16 log yards at the end of the logging using trees such as Tali, Sapelli, Ayous (650 trees planted, area 5.88 ha)
Carbon damaged
Impact in an annual allowable cut (AAC)
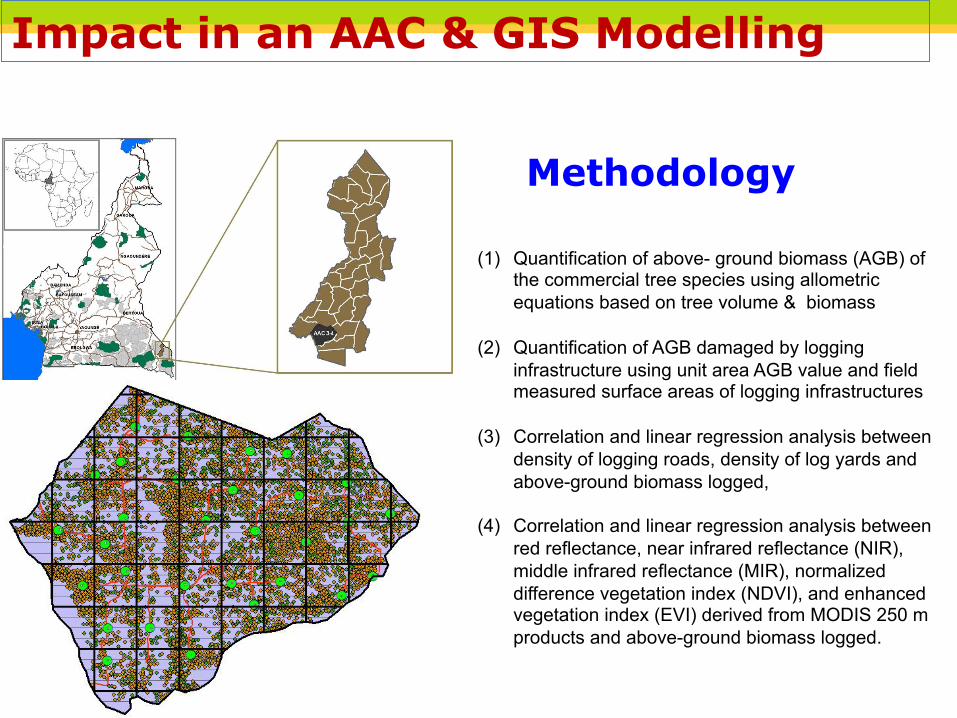
Methodology
(1) Quantification of above- ground biomass (AGB) of the commercial tree species using allometric equations based on tree volume & biomass
(2) Quantification of AGB damaged by logging infrastructure using unit area AGB value and field measured surface areas of logging infrastructures
(3) Correlation and linear regression analysis between density of logging roads, density of log yards and above-ground biomass logged,
(4) Correlation and linear regression analysis between red reflectance, near infrared reflectance (NIR), middle infrared reflectance (MIR), normalized difference vegetation index (NDVI), and enhanced vegetation index (EVI) derived from MODIS 250 m products and above-ground biomass logged.
Impact in an AAC & GIS Modelling
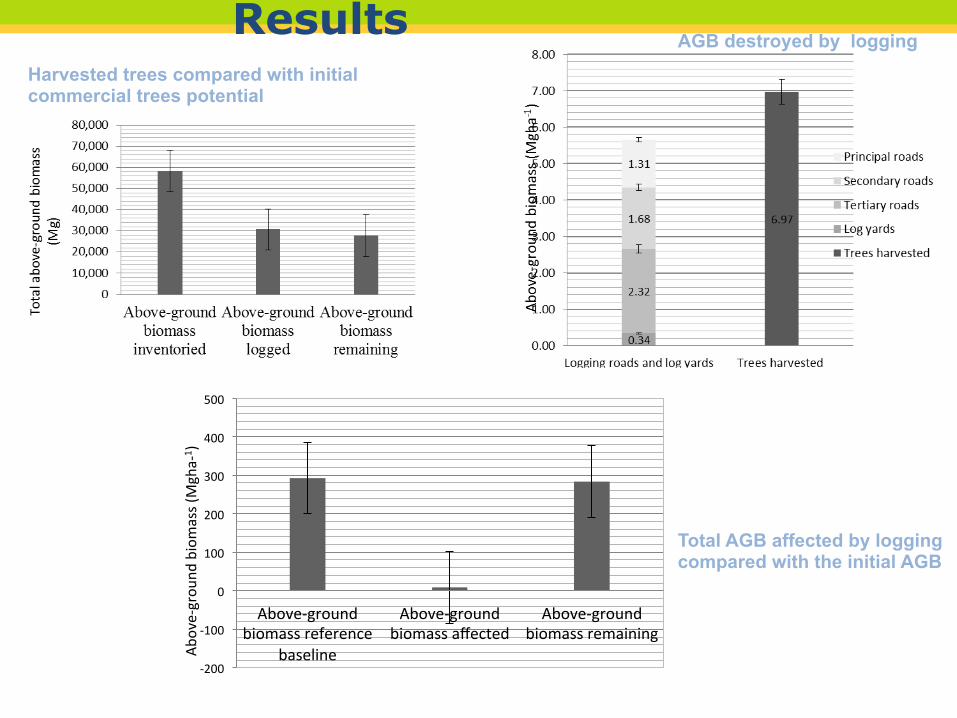
Results AGB destroyed by logging
Harvested trees compared with initial commercial trees potential
-‐200
-‐100
0
100
200
300
400
500
Above-‐ground biomass reference
baseline
Above-‐ground biomass affected
Above-‐ground biomass remaining
Above-‐grou
nd biomass (Mgha-‐
1 )
Total AGB affected by logging compared with the initial AGB
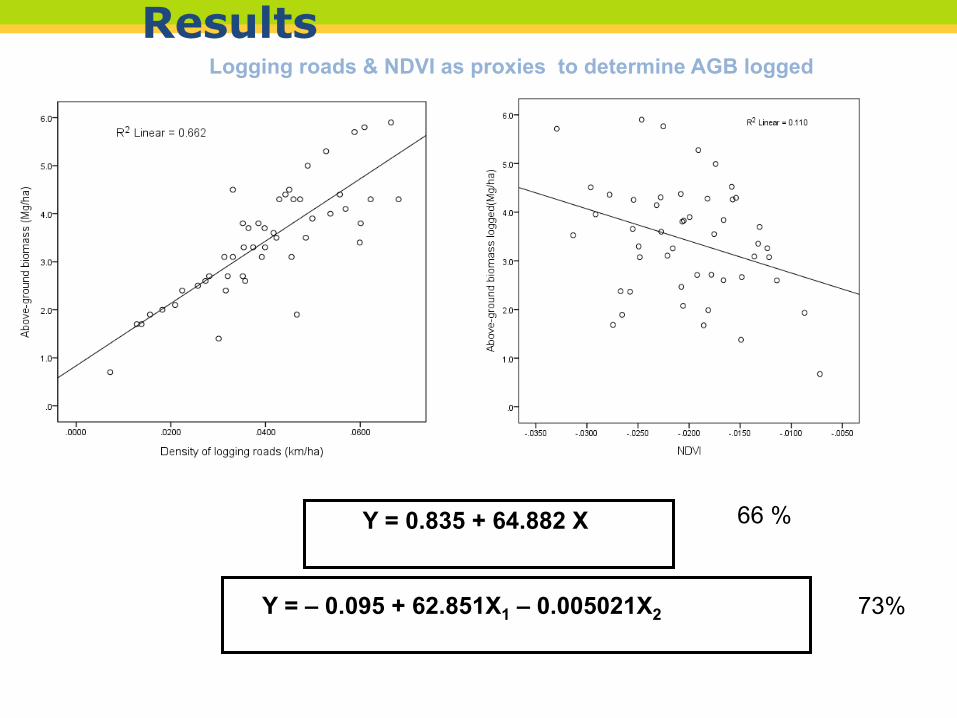
Results
Y = 0.835 + 64.882 X Y = – 0.095 + 62.851X1 – 0.005021X2
Logging roads & NDVI as proxies to determine AGB logged
66 %
73%
THINKING beyond the canopy
AAC4-1 UFA 10011
(SFM Logging
Regime)
AAC 2-2 F. Council/
communal forest
Sale of standing
volume
10 01 180
Community
Forestry
Carbon stock by logging
0tle (tC)
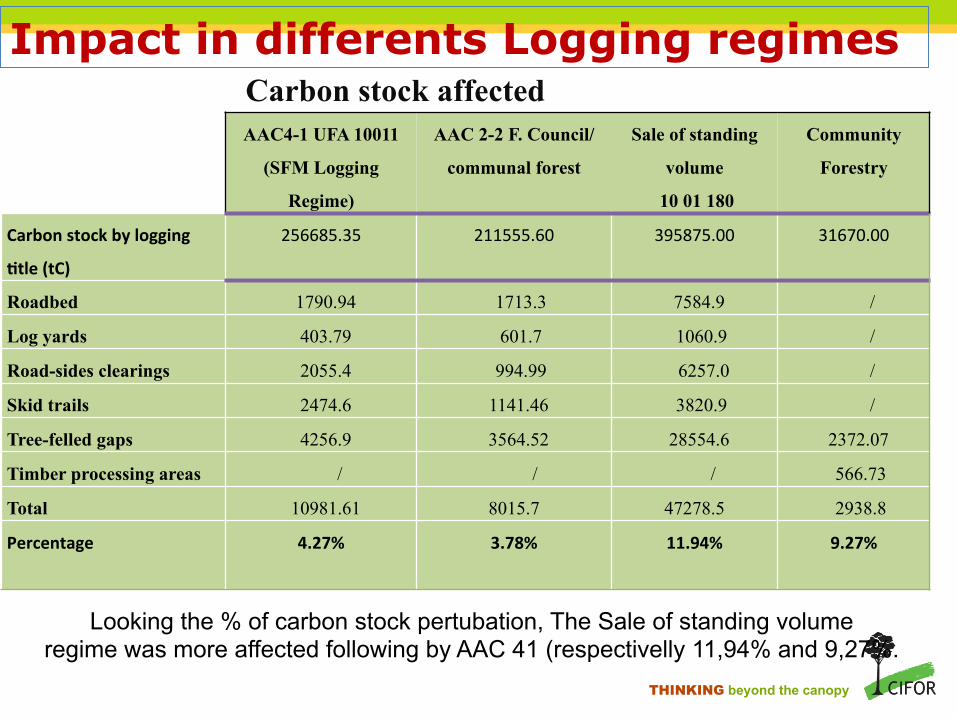
256685.35 211555.60 395875.00 31670.00
Roadbed 1790.94 1713.3 7584.9 /
Log yards 403.79 601.7 1060.9 /
Road-sides clearings 2055.4 994.99 6257.0 /
Skid trails 2474.6 1141.46 3820.9 /
Tree-felled gaps 4256.9 3564.52 28554.6 2372.07
Timber processing areas / / / 566.73
Total 10981.61 8015.7 47278.5 2938.8
Percentage
4.27% 3.78% 11.94% 9.27%
Looking the % of carbon stock pertubation, The Sale of standing volume regime was more affected following by AAC 41 (respectivelly 11,94% and 9,27%.
Impact in differents Logging regimes Carbon stock affected
THINKING beyond the canopy
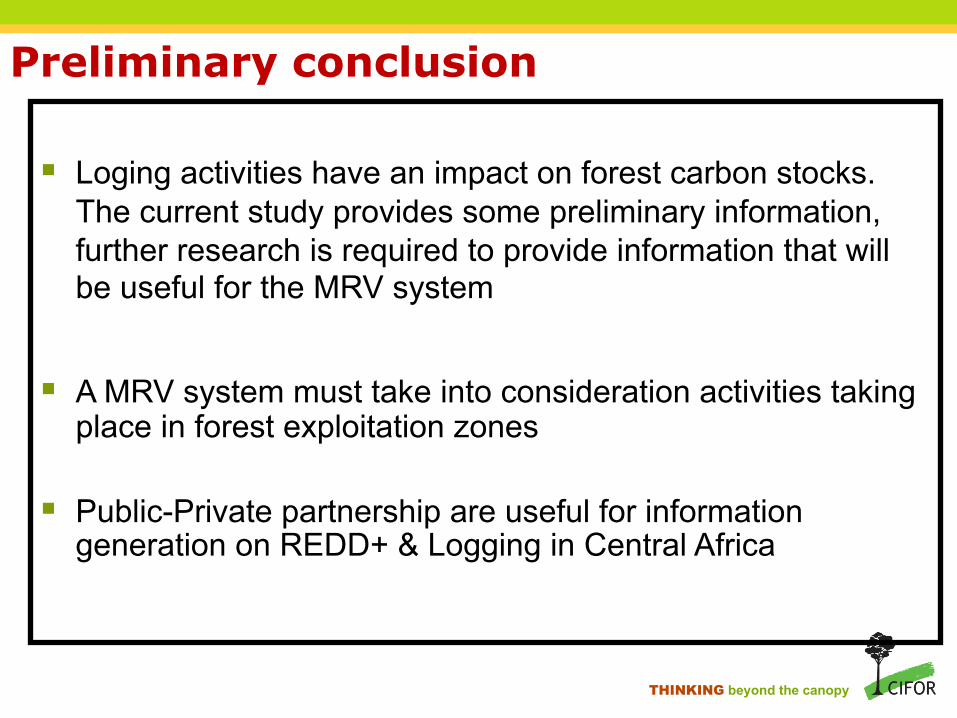
Preliminary conclusion
§ Loging activities have an impact on forest carbon stocks. The current study provides some preliminary information, further research is required to provide information that will be useful for the MRV system
§ A MRV system must take into consideration activities taking place in forest exploitation zones
§ Public-Private partnership are useful for information generation on REDD+ & Logging in Central Africa
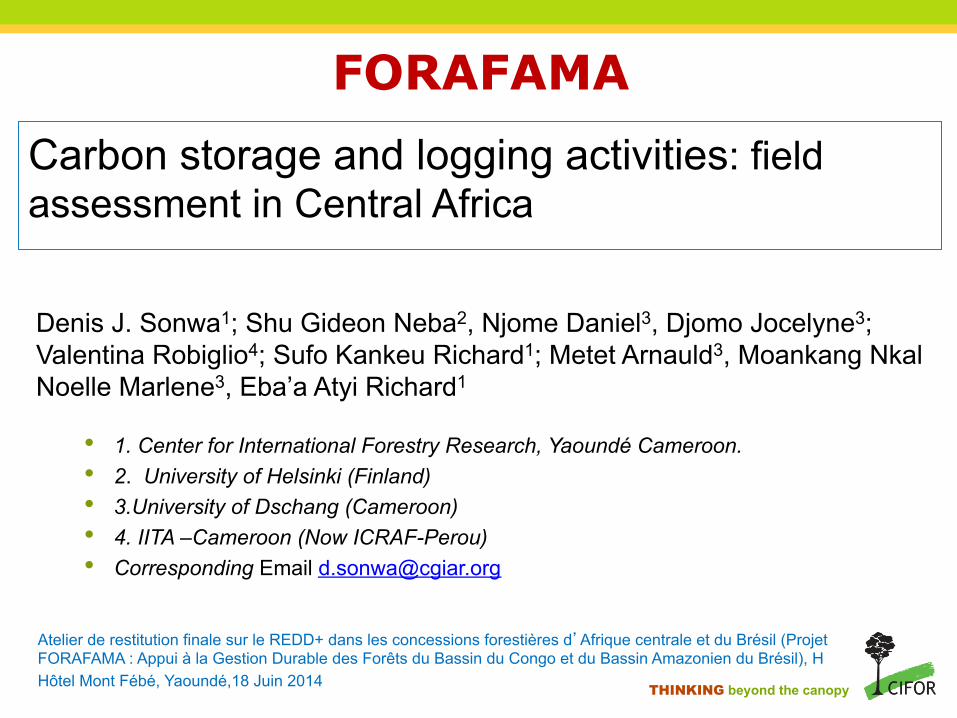
THINKING beyond the canopy
www.cifor.cgiar.org
[email protected] http://www.cifor.org/forafama/home.html
Thank you!!!!