Embed Size (px)
Citation preview
lable at ScienceDirect
Atmospheric Environment 100 (2015) 102e110
Contents lists avai
Atmospheric Environment
journal homepage: www.elsevier .com/locate/atmosenv
Seasonal trends in the composition and ROS activity of fine particulatematter in Baghdad, Iraq
Samera Hussein Hamad a, Martin Merrill Shafer a, b, Ahmed K.H. Kadhim c,Sabah M. Al-Omran c, James Jay Schauer a, b, d, *
a Environmental Chemistry and Technology Program, University of Wisconsin-Madison, 660 N. Park St., Madison, WI 53706, USAb Wisconsin State Laboratory of Hygiene, 2601 Agricultural Drive, Madison, WI 53718, USAc Iraqi Ministry of Environment, Al-Andalus Square, Baghdad, Iraqd Civil and Environmental Engineering, University of Wisconsin-Madison, 1415 Engineering Drive, Madison, WI 53706, USA
h i g h l i g h t s
� PM2.5 from Baghdad is higher than NAAQS-USEPA, and several other urban areas.� Lead is 5 times the summation of 35 other measured trace metals concentrations.� Higher levels of WSON compounds were observed in summertime compared to winter.� WSOC-biomass burning fraction is an important contributor to ROS activity of PM2.5.
a r t i c l e i n f o
Article history:Received 31 July 2014Received in revised form23 October 2014Accepted 24 October 2014Available online 24 October 2014
Keywords:Chemical compositionFine particlesROS-activityBaghdad-Iraq
* Corresponding author. Environmental ChemistrUniversity of Wisconsin-Madison, 660 N. Park St., Ma
E-mail addresses: [email protected] (S.H. H(M.M. Shafer), [email protected] (A.Kyahoo.com (S.M. Al-Omran), [email protected] (J.J. S
http://dx.doi.org/10.1016/j.atmosenv.2014.10.0431352-2310/© 2014 Elsevier Ltd. All rights reserved.
a b s t r a c t
Baghdad suffers from severe atmospheric particulate matter (PM) pollution and has limited infrastruc-ture to monitor and control PM-pollution. To help better understand the nature of particulate matter inBaghdad, daily PM2.5 samples were collected every 6th day from September, 2012 to September, 2013.The samples were analyzed for chemical composition and cellular oxidative stress activity using amacrophage-based assay. The annual average PM2.5 concentration was 50 ± 19 mg m�3, and wascomprised of approximately 28% crustal materials, 26% organic carbon (OC), 17% sulfate, 12% elementalcarbon (EC), and 8.0% ammonium ion. No clear seasonal trend was observed for the total PM2.5 mass andPM2.5 OC, but EC exhibited higher concentrations in the warmer months, likely due to the extensive useof electric generators operated by diesel and gasoline for cooling. April showed the lowest levels of bothEC and OC compared with other months due to both sand and rainstorm events which led to increaseddeposition and dispersion of local emissions. Concentrations of nitrate ion were low in all seasons due tothe high temperatures and low humidity, but slightly higher levels were observed in the cooler monthsof winter. The oxidative stress (reactive oxygen species (ROS)) activity (59 ± 35 mg Zymosan equivalentsm�3) of the PM was relatively lower than in other studied areas. Association between the water solublePM constituents and the oxidative activity was investigated using a multi-linear regression model whichshowed no strong relationships between ROS activity and the water soluble components of PM2.5, but amoderate correlation of water soluble organic carbon from biomass burning (WSOC-BB) was observed(R2 ¼ 0.52). Biomass burning PM has been shown to be an important contributor to ROS activity in otherpublished studies, but additional work is needed to better understand the sources leading to the ROSactivity in Baghdad.
© 2014 Elsevier Ltd. All rights reserved.
y and Technology Program,dison, WI 53706, USA.amad), [email protected]. Kadhim), sabahmikha@chauer).
1. Introduction
There is ample evidence that exposure to fine particulatematter is associated with adverse human health impacts,including respiratory disease and cardiovascular morbidity andmortality (Brook et al., 2004; Dockery and Pope, 1994; Donaldsonet al., 2001). In order to develop control strategies to mitigate the
Abbreviations
AIHL Air and Industrial Hygiene LaboratoryCI confidence intervalsCM crustal materialsDCF dichlorofluoresceinDCFH-DA20,70-dichlorodihydrofluorescein diacetateEC elemental carbonGC/MS gas chromatography/mass spectrometryIC ion chromatographyNAAQS National Ambient Air Quality StandardsOC organic carbonPM particulate matterROS reactive oxygen species
SF-ICP-MS Sector Field-Inductively Coupled Plasma-MassSpectrometry
SOA secondary organic aerosolUSEPA United States Environmental Protection AgencyWHO World Health OrganizationWIOC water insoluble organic carbonWSIN water soluble inorganic nitrogenWSLH Wisconsin State Laboratory of HygieneWSN water soluble nitrogenWSOC water soluble organic carbonWSOC-BB water soluble organic carbon-biomass burningWSOC-non-BB water soluble organic carbon-non-biomass
burningWSON water soluble organic nitrogen
S.H. Hamad et al. / Atmospheric Environment 100 (2015) 102e110 103
effects of exposures to elevated levels of particulate matter inurban areas, an accurate understanding of the chemical compo-sition and sources of particulate matter is needed. Often short-term intensive studies are used to understand the sources ofparticulate matter in urban areas, but such studies do not capturethe seasonal variation in pollutant concentrations and sources. InNorth America and Europe there are existing monitoring andregulatory programs to understand the concentrations, composi-tion, and sources of particulate matter in urban areas. Such pro-grams have not been established in much of the Middle East, andtherefore there is insufficient information to develop robust andcost-effective strategies to control particulate matter in heavilypolluted urban areas.
Baghdad, the capital of Iraq, is the second largest city in theMiddle East (DWUA, 2014). Baghdad has been subjected to seriousenvironmental degradation due in-part to continuous armedconflicts, which have not yet relented, and largely unabatedpollution sources (Programme, 2005). Non communicable diseaseshave been reported to pose the largest disease threat to Iraq'spopulation (Al Hilfi et al., 2013) and have been suggested to berelated to the severe environmental and infrastructure damageafter the 2003 invasion (WHO EMRO, 2009). Iraqi governmentstatistics have indicated an increase in the mortality and themorbidity of the respiratory and the cardiovascular diseases in theyears followed the 2003 invasion due to the deterioration of theenvironment, this has been found to be shifted towards young agegroups, which has been suggested to be a result of severe airpollution (Ala'din, 2004; Al Hilfi et al., 2013). Thus, the Iraqi gov-ernment has called for air pollution studies to better understandthe impact of environmental degradation on public health(Ala'din, 2004). PM2.5 mass concentrations in Baghdad have beenmeasured at about eight times the PM level that is recommendedby WHO (10 mg m�3), and the annual limit of the National AmbientAir Quality Standards (NAAQS)-U.S. Environmental ProtectionAgency (USEPA) (12 mg m�3) (Engelbrecht and Jayanty, 2013;USEPA, 2012; WHO, 2008). Given the large population and highconcentrations of particulate matter in Baghdad, there is greatinterest in developing strategies to reduce particulate matterconcentrations in this city. A requisite first step in developingcontrol strategies is to understand the trends in major compo-nents of particulate matter, and what sources should be targetedfor control, such as sulfate, dust, and carbonaceous particulatematter.
In Baghdad, there are several important potential PM sourcesincluding the continued use of leaded gasoline and high sulfurfuels, the extensive use of diesel and gas-powered electric-
generators that operate when electric power is disrupted, wasteburning, and uncontrolled emissions from industrial sources(Jones et al., 2012; UNEPA, 2014a, 2014b). Iraq is one of thecountries that has the highest diesel fuel sulfur levels in the world,with no control on its emission (UNEPA, 2014a). The United Na-tions Environment Programme (UNEP) Partnership for Clean Fuelsand Vehicles (PCFV) showed that Iraq is among the countries thathas the highest levels of sulfur in diesel which was above 5000parts per million (UNEP, 2014). Although emissions from somesources (e.g. stationary sources) have been mitigated to someextent recently due to the transition to natural gas operated powerplants, and the use of solar and wind energy in Iraq, the emissionsfrom mobile sources (e.g. vehicular emissions) continues largelyunabated, and is likely a major contributor to the high air pollutionlevels in this area (Dihrab and Sopian, 2010; Engelbrecht andJayanty, 2013). Therefore, in this study we conducted a one-year(every sixth day) sampling campaign in order to investigate theseasonal variation in the major components of fine particulatematter in Baghdad, and to understand the importance of thesecomponents to particulate matter concentrations and ROS activity.A PM2.5 air sampler was located on the roof of one of the IraqiMinistry of Environment offices in central Baghdad, and24 h integrated air samples were collected for the samplingcampaign (September 2012 through September 2013). Resultsfrom this study will help provide a better understanding of thechemical composition of the inhalable particulate matter, whosecomponent(s) are important and potentially contribute to oxida-tive stress, and should be controlled.
2. Materials and methods
2.1. Study area
Baghdad, the capital of Iraq, is located near the center of thecountry at 33.3191�N and 44.3920�E. The climate of this area is hotand dry in summers and cold in winters, with an average annualtemperature of 22.8 �C (73 �F) (Fig. S4, Supplementary materials).The total annual precipitation averages 156 mm, and there areabout 270 sunshine days per year (NCDC, 2014). Most of theannual rainfall in this area occurs between November and April,with brief, violent rainstorms in the winter. The remainingmonths, particularly the hottest ones (June, July and August) aredry (NCDC, 2014). Dust storms are very common in Iraq and maylast for several days (Shahsavani et al., 2012). The Iraqi Ministry ofEnvironment (IMOE) recorded 122 dust storms and 283 dusty days
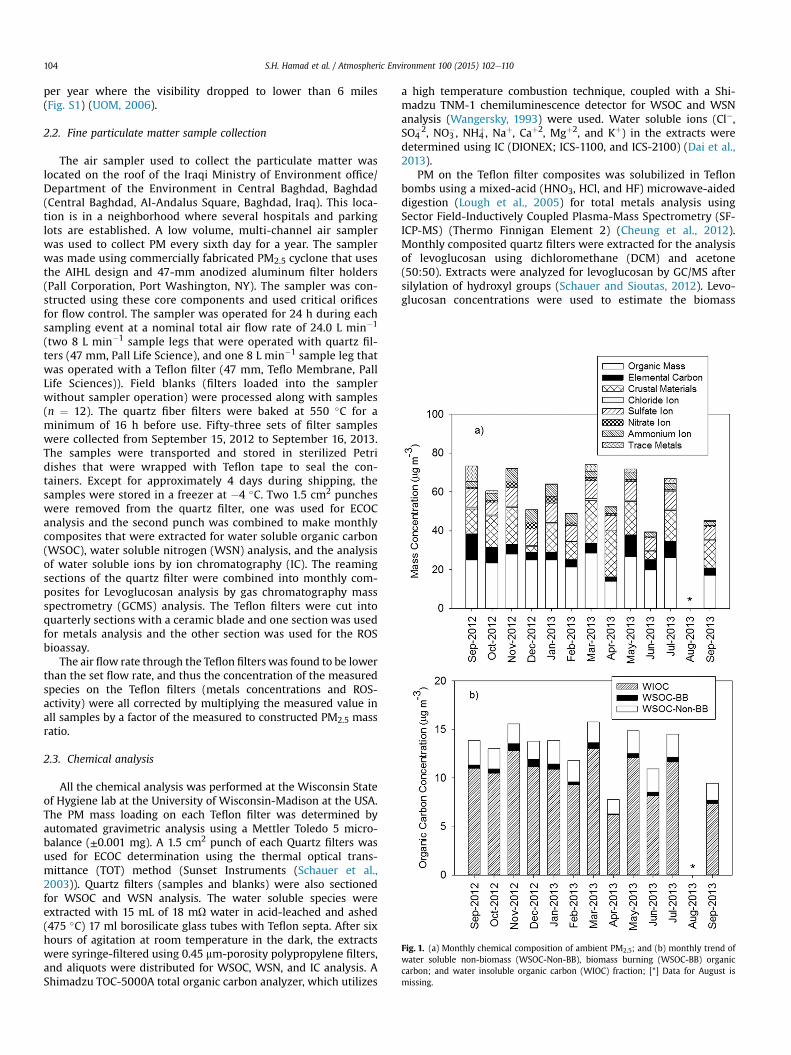
Fig. 1. (a) Monthly chemical composition of ambient PM2.5; and (b) monthly trend ofwater soluble non-biomass (WSOC-Non-BB), biomass burning (WSOC-BB) organiccarbon; and water insoluble organic carbon (WIOC) fraction; [*] Data for August ismissing.
S.H. Hamad et al. / Atmospheric Environment 100 (2015) 102e110104
per year where the visibility dropped to lower than 6 miles(Fig. S1) (UOM, 2006).
2.2. Fine particulate matter sample collection
The air sampler used to collect the particulate matter waslocated on the roof of the Iraqi Ministry of Environment office/Department of the Environment in Central Baghdad, Baghdad(Central Baghdad, Al-Andalus Square, Baghdad, Iraq). This loca-tion is in a neighborhood where several hospitals and parkinglots are established. A low volume, multi-channel air samplerwas used to collect PM every sixth day for a year. The samplerwas made using commercially fabricated PM2.5 cyclone that usesthe AIHL design and 47-mm anodized aluminum filter holders(Pall Corporation, Port Washington, NY). The sampler was con-structed using these core components and used critical orificesfor flow control. The sampler was operated for 24 h during eachsampling event at a nominal total air flow rate of 24.0 L min�1
(two 8 L min�1 sample legs that were operated with quartz fil-ters (47 mm, Pall Life Science), and one 8 L min�1 sample leg thatwas operated with a Teflon filter (47 mm, Teflo Membrane, PallLife Sciences)). Field blanks (filters loaded into the samplerwithout sampler operation) were processed along with samples(n ¼ 12). The quartz fiber filters were baked at 550 �C for aminimum of 16 h before use. Fifty-three sets of filter sampleswere collected from September 15, 2012 to September 16, 2013.The samples were transported and stored in sterilized Petridishes that were wrapped with Teflon tape to seal the con-tainers. Except for approximately 4 days during shipping, thesamples were stored in a freezer at �4 �C. Two 1.5 cm2 puncheswere removed from the quartz filter, one was used for ECOCanalysis and the second punch was combined to make monthlycomposites that were extracted for water soluble organic carbon(WSOC), water soluble nitrogen (WSN) analysis, and the analysisof water soluble ions by ion chromatography (IC). The reamingsections of the quartz filter were combined into monthly com-posites for Levoglucosan analysis by gas chromatography massspectrometry (GCMS) analysis. The Teflon filters were cut intoquarterly sections with a ceramic blade and one section was usedfor metals analysis and the other section was used for the ROSbioassay.
The air flow rate through the Teflon filters was found to be lowerthan the set flow rate, and thus the concentration of the measuredspecies on the Teflon filters (metals concentrations and ROS-activity) were all corrected by multiplying the measured value inall samples by a factor of the measured to constructed PM2.5 massratio.
2.3. Chemical analysis
All the chemical analysis was performed at the Wisconsin Stateof Hygiene lab at the University of Wisconsin-Madison at the USA.The PM mass loading on each Teflon filter was determined byautomated gravimetric analysis using a Mettler Toledo 5 micro-balance (±0.001 mg). A 1.5 cm2 punch of each Quartz filters wasused for ECOC determination using the thermal optical trans-mittance (TOT) method (Sunset Instruments (Schauer et al.,2003)). Quartz filters (samples and blanks) were also sectionedfor WSOC and WSN analysis. The water soluble species wereextracted with 15 mL of 18 mU water in acid-leached and ashed(475 �C) 17 ml borosilicate glass tubes with Teflon septa. After sixhours of agitation at room temperature in the dark, the extractswere syringe-filtered using 0.45 mm-porosity polypropylene filters,and aliquots were distributed for WSOC, WSN, and IC analysis. AShimadzu TOC-5000A total organic carbon analyzer, which utilizes
a high temperature combustion technique, coupled with a Shi-madzu TNM-1 chemiluminescence detector for WSOC and WSNanalysis (Wangersky, 1993) were used. Water soluble ions (Cl�,SO4
�2, NO3�, NH4
þ, Naþ, Caþ2, Mgþ2, and Kþ) in the extracts weredetermined using IC (DIONEX; ICS-1100, and ICS-2100) (Dai et al.,2013).
PM on the Teflon filter composites was solubilized in Teflonbombs using a mixed-acid (HNO3, HCl, and HF) microwave-aideddigestion (Lough et al., 2005) for total metals analysis usingSector Field-Inductively Coupled Plasma-Mass Spectrometry (SF-ICP-MS) (Thermo Finnigan Element 2) (Cheung et al., 2012).Monthly composited quartz filters were extracted for the analysisof levoglucosan using dichloromethane (DCM) and acetone(50:50). Extracts were analyzed for levoglucosan by GC/MS aftersilylation of hydroxyl groups (Schauer and Sioutas, 2012). Levo-glucosan concentrations were used to estimate the biomass
S.H. Hamad et al. / Atmospheric Environment 100 (2015) 102e110 105
burning fraction of water soluble organic carbon (WSOC-BB) usinga ratio of the measured levoglucosan to that of levoglucosan-associated biomass burning (Fine et al., 2004), and the fact that71% of the biomass burning organic carbon is water soluble(Sannigrahi et al., 2006).
The oxidative activity of extracts of the ambient fine particles(PM2.5) was determined with a macrophage-based ROS assay.Monthly composites of sections of the Teflon filters wereextracted with 5.0 mL of 0.22 mm filter-sterilized 18 mU water inacid-washed and rinsed polypropylene cryo-vials. The extractiontubes were continuously agitated for 16 h at room temperature inthe dark, and then the extracts were syringe-filtered (0.22 mmpolypropylene) for ROS activity determination. ROS activity wasassessed using an in vitro assay where the rat alveolar macro-phage (NR8383, ATCC# CRL-2192) cells were exposed to thefiltered water extracts of the PM. A membrane-permeable mo-lecular probe (DCFH-DA (20,70-dichlorodihydrofluorescein diac-etate)) was used to quantify intracellular ROS. DCFH-DA is de-acetylated by cellular enzymes in the cytoplasm and ROS spe-cies produced within the cell converts DCFH to the fluorescingspecies DCF. The method is detailed in Zhang et al., 2008. Thisassay quantifies the biologically mediated ROS production withinthe macrophage cells (Shafer et al., 2010). ROS is also naturallyproduced in cells as a byproduct of normal metabolic activity, andtherefore controls/blanks (cells that are not exposed to PM ex-tracts) were used in this assay to account for baseline ROS activity(Landreman et al., 2008).
All the results of the chemical analyses and ROS activity mea-surements were method and field blank corrected; field blank wassignificantly lower than all the samples. For total and water solubleorganic chemical species and ions, the precision of duplicates werewithin 15%; spikes recoveries were between 90 and 125 percent.Uncertainties were determined based on the propagation of theanalytical uncertainties and the uncertainties of field blanks. Sta-tistical checks were conducted to evaluate and confirm data accu-racy including 95% Confidence Intervals (CI) for all species in eachsample; thus, all the reported data are at least twice the mea-surement uncertainties. Values less than twice the propagateduncertainty were considered non-detectable.
3. Results and discussion
3.1. PM2.5 mass and major chemical components
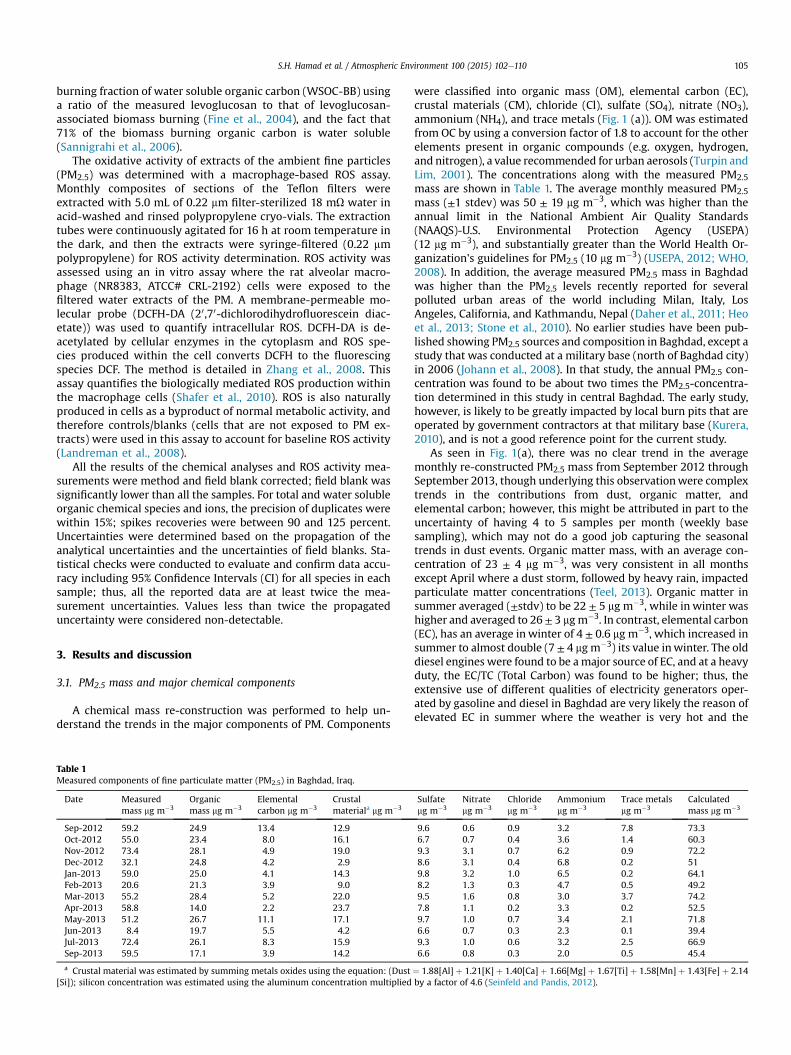
A chemical mass re-construction was performed to help un-derstand the trends in the major components of PM. Components
Table 1Measured components of fine particulate matter (PM2.5) in Baghdad, Iraq.
Date Measuredmass mg m�3
Organicmass mg m�3
Elementalcarbon mg m�3
Crustalmateriala mg m�3
Sep-2012 59.2 24.9 13.4 12.9Oct-2012 55.0 23.4 8.0 16.1Nov-2012 73.4 28.1 4.9 19.0Dec-2012 32.1 24.8 4.2 2.9Jan-2013 59.0 25.0 4.1 14.3Feb-2013 20.6 21.3 3.9 9.0Mar-2013 55.2 28.4 5.2 22.0Apr-2013 58.8 14.0 2.2 23.7May-2013 51.2 26.7 11.1 17.1Jun-2013 8.4 19.7 5.5 4.2Jul-2013 72.4 26.1 8.3 15.9Sep-2013 59.5 17.1 3.9 14.2
a Crustal material was estimated by summing metals oxides using the equation: (Dust[Si]); silicon concentration was estimated using the aluminum concentration multiplied
were classified into organic mass (OM), elemental carbon (EC),crustal materials (CM), chloride (Cl), sulfate (SO4), nitrate (NO3),ammonium (NH4), and trace metals (Fig. 1 (a)). OM was estimatedfrom OC by using a conversion factor of 1.8 to account for the otherelements present in organic compounds (e.g. oxygen, hydrogen,and nitrogen), a value recommended for urban aerosols (Turpin andLim, 2001). The concentrations along with the measured PM2.5mass are shown in Table 1. The average monthly measured PM2.5mass (±1 stdev) was 50 ± 19 mg m�3, which was higher than theannual limit in the National Ambient Air Quality Standards(NAAQS)-U.S. Environmental Protection Agency (USEPA)(12 mg m�3), and substantially greater than the World Health Or-ganization's guidelines for PM2.5 (10 mg m�3) (USEPA, 2012; WHO,2008). In addition, the average measured PM2.5 mass in Baghdadwas higher than the PM2.5 levels recently reported for severalpolluted urban areas of the world including Milan, Italy, LosAngeles, California, and Kathmandu, Nepal (Daher et al., 2011; Heoet al., 2013; Stone et al., 2010). No earlier studies have been pub-lished showing PM2.5 sources and composition in Baghdad, except astudy that was conducted at a military base (north of Baghdad city)in 2006 (Johann et al., 2008). In that study, the annual PM2.5 con-centration was found to be about two times the PM2.5-concentra-tion determined in this study in central Baghdad. The early study,however, is likely to be greatly impacted by local burn pits that areoperated by government contractors at that military base (Kurera,2010), and is not a good reference point for the current study.
As seen in Fig. 1(a), there was no clear trend in the averagemonthly re-constructed PM2.5 mass from September 2012 throughSeptember 2013, though underlying this observationwere complextrends in the contributions from dust, organic matter, andelemental carbon; however, this might be attributed in part to theuncertainty of having 4 to 5 samples per month (weekly basesampling), which may not do a good job capturing the seasonaltrends in dust events. Organic matter mass, with an average con-centration of 23 ± 4 mg m�3, was very consistent in all monthsexcept April where a dust storm, followed by heavy rain, impactedparticulate matter concentrations (Teel, 2013). Organic matter insummer averaged (±stdv) to be 22 ± 5 mg m�3, while in winter washigher and averaged to 26 ± 3 mgm�3. In contrast, elemental carbon(EC), has an average in winter of 4 ± 0.6 mg m�3, which increased insummer to almost double (7 ± 4 mg m�3) its value inwinter. The olddiesel engines were found to be amajor source of EC, and at a heavyduty, the EC/TC (Total Carbon) was found to be higher; thus, theextensive use of different qualities of electricity generators oper-ated by gasoline and diesel in Baghdad are very likely the reason ofelevated EC in summer where the weather is very hot and the
Sulfatemg m�3
Nitratemg m�3
Chloridemg m�3
Ammoniummg m�3
Trace metalsmg m�3
Calculatedmass mg m�3
9.6 0.6 0.9 3.2 7.8 73.36.7 0.7 0.4 3.6 1.4 60.39.3 3.1 0.7 6.2 0.9 72.28.6 3.1 0.4 6.8 0.2 519.8 3.2 1.0 6.5 0.2 64.18.2 1.3 0.3 4.7 0.5 49.29.5 1.6 0.8 3.0 3.7 74.27.8 1.1 0.2 3.3 0.2 52.59.7 1.0 0.7 3.4 2.1 71.86.6 0.7 0.3 2.3 0.1 39.49.3 1.0 0.6 3.2 2.5 66.96.6 0.8 0.3 2.0 0.5 45.4
¼ 1.88[Al] þ 1.21[K] þ 1.40[Ca] þ 1.66[Mg] þ 1.67[Ti] þ 1.58[Mn] þ 1.43[Fe] þ 2.14by a factor of 4.6 (Seinfeld and Pandis, 2012).
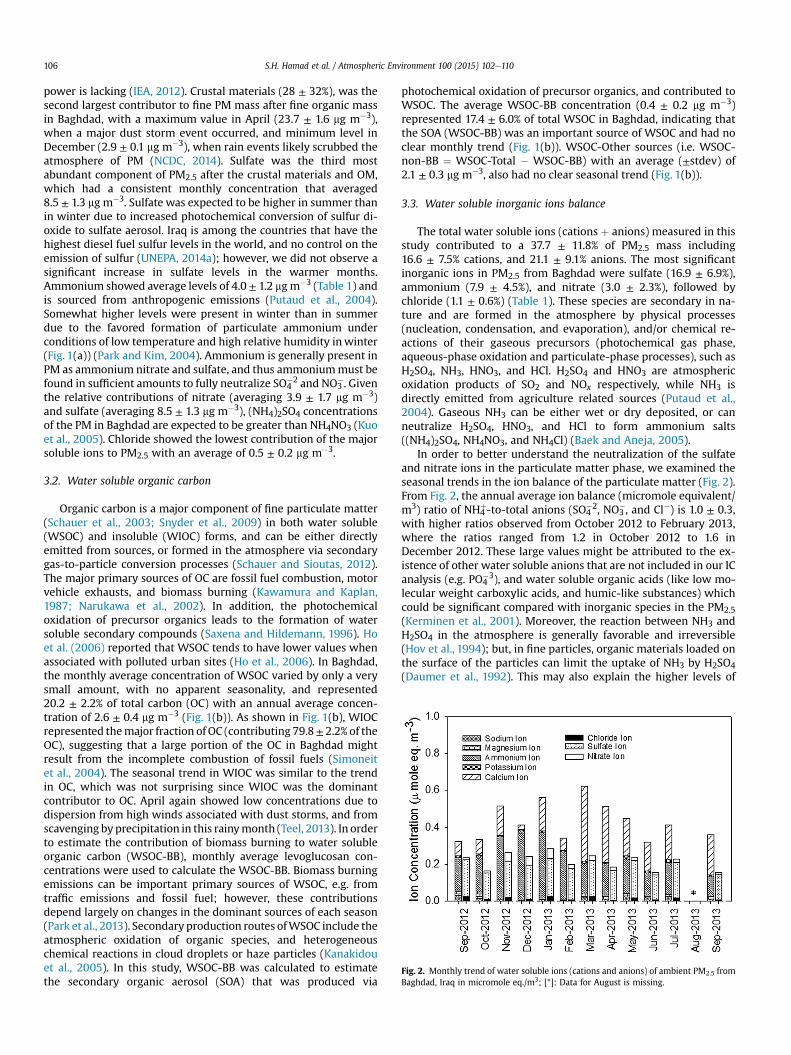
Fig. 2. Monthly trend of water soluble ions (cations and anions) of ambient PM2.5 fromBaghdad, Iraq in micromole eq./m3; [*]: Data for August is missing.
S.H. Hamad et al. / Atmospheric Environment 100 (2015) 102e110106
power is lacking (IEA, 2012). Crustal materials (28 ± 32%), was thesecond largest contributor to fine PM mass after fine organic massin Baghdad, with a maximum value in April (23.7 ± 1.6 mg m�3),when a major dust storm event occurred, and minimum level inDecember (2.9 ± 0.1 mg m�3), when rain events likely scrubbed theatmosphere of PM (NCDC, 2014). Sulfate was the third mostabundant component of PM2.5 after the crustal materials and OM,which had a consistent monthly concentration that averaged8.5 ± 1.3 mg m�3. Sulfate was expected to be higher in summer thanin winter due to increased photochemical conversion of sulfur di-oxide to sulfate aerosol. Iraq is among the countries that have thehighest diesel fuel sulfur levels in the world, and no control on theemission of sulfur (UNEPA, 2014a); however, we did not observe asignificant increase in sulfate levels in the warmer months.Ammonium showed average levels of 4.0 ± 1.2 mgm�3 (Table 1) andis sourced from anthropogenic emissions (Putaud et al., 2004).Somewhat higher levels were present in winter than in summerdue to the favored formation of particulate ammonium underconditions of low temperature and high relative humidity inwinter(Fig. 1(a)) (Park and Kim, 2004). Ammonium is generally present inPM as ammonium nitrate and sulfate, and thus ammoniummust befound in sufficient amounts to fully neutralize SO4
�2 and NO3�. Given
the relative contributions of nitrate (averaging 3.9 ± 1.7 mg m�3)and sulfate (averaging 8.5 ± 1.3 mg m�3), (NH4)2SO4 concentrationsof the PM in Baghdad are expected to be greater than NH4NO3 (Kuoet al., 2005). Chloride showed the lowest contribution of the majorsoluble ions to PM2.5 with an average of 0.5 ± 0.2 mg m�3.
3.2. Water soluble organic carbon
Organic carbon is a major component of fine particulate matter(Schauer et al., 2003; Snyder et al., 2009) in both water soluble(WSOC) and insoluble (WIOC) forms, and can be either directlyemitted from sources, or formed in the atmosphere via secondarygas-to-particle conversion processes (Schauer and Sioutas, 2012).The major primary sources of OC are fossil fuel combustion, motorvehicle exhausts, and biomass burning (Kawamura and Kaplan,1987; Narukawa et al., 2002). In addition, the photochemicaloxidation of precursor organics leads to the formation of watersoluble secondary compounds (Saxena and Hildemann, 1996). Hoet al. (2006) reported that WSOC tends to have lower values whenassociated with polluted urban sites (Ho et al., 2006). In Baghdad,the monthly average concentration of WSOC varied by only a verysmall amount, with no apparent seasonality, and represented20.2 ± 2.2% of total carbon (OC) with an annual average concen-tration of 2.6 ± 0.4 mg m�3 (Fig. 1(b)). As shown in Fig. 1(b), WIOCrepresented themajor fraction of OC (contributing 79.8± 2.2% of theOC), suggesting that a large portion of the OC in Baghdad mightresult from the incomplete combustion of fossil fuels (Simoneitet al., 2004). The seasonal trend in WIOC was similar to the trendin OC, which was not surprising since WIOC was the dominantcontributor to OC. April again showed low concentrations due todispersion from high winds associated with dust storms, and fromscavenging by precipitation in this rainymonth (Teel, 2013). In orderto estimate the contribution of biomass burning to water solubleorganic carbon (WSOC-BB), monthly average levoglucosan con-centrations were used to calculate the WSOC-BB. Biomass burningemissions can be important primary sources of WSOC, e.g. fromtraffic emissions and fossil fuel; however, these contributionsdepend largely on changes in the dominant sources of each season(Park et al., 2013). Secondary production routes ofWSOC include theatmospheric oxidation of organic species, and heterogeneouschemical reactions in cloud droplets or haze particles (Kanakidouet al., 2005). In this study, WSOC-BB was calculated to estimatethe secondary organic aerosol (SOA) that was produced via
photochemical oxidation of precursor organics, and contributed toWSOC. The average WSOC-BB concentration (0.4 ± 0.2 mg m�3)represented 17.4 ± 6.0% of total WSOC in Baghdad, indicating thatthe SOA (WSOC-BB) was an important source of WSOC and had noclear monthly trend (Fig. 1(b)). WSOC-Other sources (i.e. WSOC-non-BB ¼ WSOC-Total � WSOC-BB) with an average (±stdev) of2.1 ± 0.3 mg m�3, also had no clear seasonal trend (Fig. 1(b)).
3.3. Water soluble inorganic ions balance
The total water soluble ions (cations þ anions) measured in thisstudy contributed to a 37.7 ± 11.8% of PM2.5 mass including16.6 ± 7.5% cations, and 21.1 ± 9.1% anions. The most significantinorganic ions in PM2.5 from Baghdad were sulfate (16.9 ± 6.9%),ammonium (7.9 ± 4.5%), and nitrate (3.0 ± 2.3%), followed bychloride (1.1 ± 0.6%) (Table 1). These species are secondary in na-ture and are formed in the atmosphere by physical processes(nucleation, condensation, and evaporation), and/or chemical re-actions of their gaseous precursors (photochemical gas phase,aqueous-phase oxidation and particulate-phase processes), such asH2SO4, NH3, HNO3, and HCl. H2SO4 and HNO3 are atmosphericoxidation products of SO2 and NOx respectively, while NH3 isdirectly emitted from agriculture related sources (Putaud et al.,2004). Gaseous NH3 can be either wet or dry deposited, or canneutralize H2SO4, HNO3, and HCl to form ammonium salts((NH4)2SO4, NH4NO3, and NH4Cl) (Baek and Aneja, 2005).
In order to better understand the neutralization of the sulfateand nitrate ions in the particulate matter phase, we examined theseasonal trends in the ion balance of the particulate matter (Fig. 2).From Fig. 2, the annual average ion balance (micromole equivalent/m3) ratio of NH4
þ-to-total anions (SO4�2, NO3
�, and Cl�) is 1.0 ± 0.3,with higher ratios observed from October 2012 to February 2013,where the ratios ranged from 1.2 in October 2012 to 1.6 inDecember 2012. These large values might be attributed to the ex-istence of other water soluble anions that are not included in our ICanalysis (e.g. PO4
�3), and water soluble organic acids (like low mo-lecular weight carboxylic acids, and humic-like substances) whichcould be significant compared with inorganic species in the PM2.5(Kerminen et al., 2001). Moreover, the reaction between NH3 andH2SO4 in the atmosphere is generally favorable and irreversible(Hov et al., 1994); but, in fine particles, organic materials loaded onthe surface of the particles can limit the uptake of NH3 by H2SO4(Daumer et al., 1992). This may also explain the higher levels of
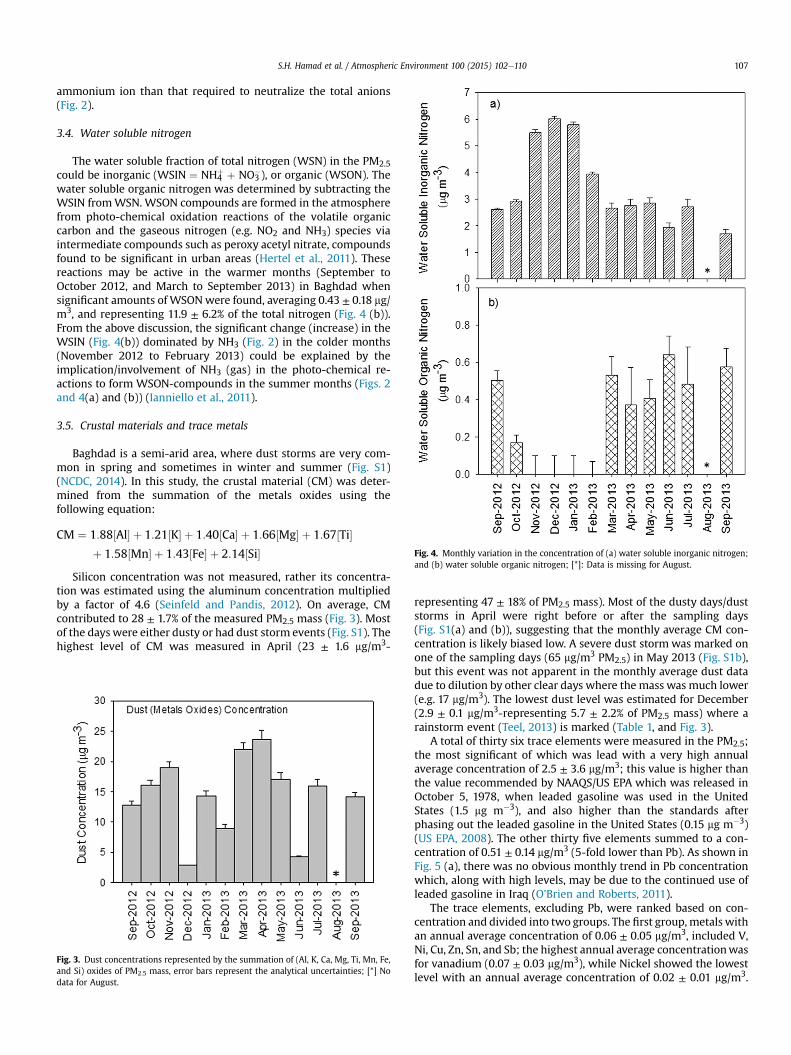
Fig. 4. Monthly variation in the concentration of (a) water soluble inorganic nitrogen;and (b) water soluble organic nitrogen; [*]: Data is missing for August.
S.H. Hamad et al. / Atmospheric Environment 100 (2015) 102e110 107
ammonium ion than that required to neutralize the total anions(Fig. 2).
3.4. Water soluble nitrogen
The water soluble fraction of total nitrogen (WSN) in the PM2.5could be inorganic (WSIN ¼ NH4
þ þ NO3�), or organic (WSON). The
water soluble organic nitrogen was determined by subtracting theWSIN fromWSN. WSON compounds are formed in the atmospherefrom photo-chemical oxidation reactions of the volatile organiccarbon and the gaseous nitrogen (e.g. NO2 and NH3) species viaintermediate compounds such as peroxy acetyl nitrate, compoundsfound to be significant in urban areas (Hertel et al., 2011). Thesereactions may be active in the warmer months (September toOctober 2012, and March to September 2013) in Baghdad whensignificant amounts of WSONwere found, averaging 0.43 ± 0.18 mg/m3, and representing 11.9 ± 6.2% of the total nitrogen (Fig. 4 (b)).From the above discussion, the significant change (increase) in theWSIN (Fig. 4(b)) dominated by NH3 (Fig. 2) in the colder months(November 2012 to February 2013) could be explained by theimplication/involvement of NH3 (gas) in the photo-chemical re-actions to form WSON-compounds in the summer months (Figs. 2and 4(a) and (b)) (Ianniello et al., 2011).
3.5. Crustal materials and trace metals
Baghdad is a semi-arid area, where dust storms are very com-mon in spring and sometimes in winter and summer (Fig. S1)(NCDC, 2014). In this study, the crustal material (CM) was deter-mined from the summation of the metals oxides using thefollowing equation:
CM ¼ 1:88½Al� þ 1:21½K� þ 1:40½Ca� þ 1:66½Mg� þ 1:67½Ti�þ 1:58½Mn� þ 1:43½Fe� þ 2:14½Si�
Silicon concentration was not measured, rather its concentra-tion was estimated using the aluminum concentration multipliedby a factor of 4.6 (Seinfeld and Pandis, 2012). On average, CMcontributed to 28 ± 1.7% of the measured PM2.5 mass (Fig. 3). Mostof the days were either dusty or had dust storm events (Fig. S1). Thehighest level of CM was measured in April (23 ± 1.6 mg/m3-
Fig. 3. Dust concentrations represented by the summation of (Al, K, Ca, Mg, Ti, Mn, Fe,and Si) oxides of PM2.5 mass, error bars represent the analytical uncertainties; [*] Nodata for August.
representing 47 ± 18% of PM2.5 mass). Most of the dusty days/duststorms in April were right before or after the sampling days(Fig. S1(a) and (b)), suggesting that the monthly average CM con-centration is likely biased low. A severe dust storm was marked onone of the sampling days (65 mg/m3 PM2.5) in May 2013 (Fig. S1b),but this event was not apparent in the monthly average dust datadue to dilution by other clear days where the mass was much lower(e.g. 17 mg/m3). The lowest dust level was estimated for December(2.9 ± 0.1 mg/m3-representing 5.7 ± 2.2% of PM2.5 mass) where arainstorm event (Teel, 2013) is marked (Table 1, and Fig. 3).
A total of thirty six trace elements were measured in the PM2.5;the most significant of which was lead with a very high annualaverage concentration of 2.5 ± 3.6 mg/m3; this value is higher thanthe value recommended by NAAQS/US EPA which was released inOctober 5, 1978, when leaded gasoline was used in the UnitedStates (1.5 mg m�3), and also higher than the standards afterphasing out the leaded gasoline in the United States (0.15 mg m�3)(US EPA, 2008). The other thirty five elements summed to a con-centration of 0.51 ± 0.14 mg/m3 (5-fold lower than Pb). As shown inFig. 5 (a), there was no obvious monthly trend in Pb concentrationwhich, along with high levels, may be due to the continued use ofleaded gasoline in Iraq (O'Brien and Roberts, 2011).
The trace elements, excluding Pb, were ranked based on con-centration and divided into two groups. The first group,metals withan annual average concentration of 0.06 ± 0.05 mg/m3, included V,Ni, Cu, Zn, Sn, and Sb; the highest annual average concentrationwasfor vanadium (0.07 ± 0.03 mg/m3), while Nickel showed the lowestlevel with an annual average concentration of 0.02 ± 0.01 mg/m3.
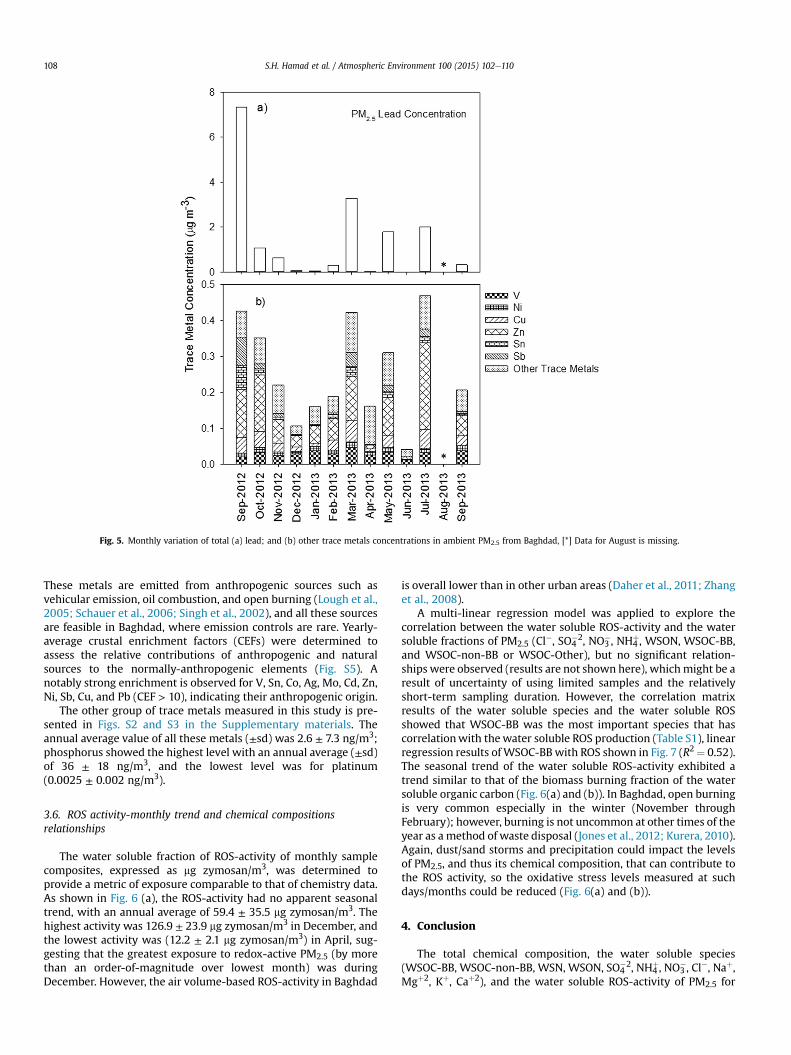
Fig. 5. Monthly variation of total (a) lead; and (b) other trace metals concentrations in ambient PM2.5 from Baghdad, [*] Data for August is missing.
S.H. Hamad et al. / Atmospheric Environment 100 (2015) 102e110108
These metals are emitted from anthropogenic sources such asvehicular emission, oil combustion, and open burning (Lough et al.,2005; Schauer et al., 2006; Singh et al., 2002), and all these sourcesare feasible in Baghdad, where emission controls are rare. Yearly-average crustal enrichment factors (CEFs) were determined toassess the relative contributions of anthropogenic and naturalsources to the normally-anthropogenic elements (Fig. S5). Anotably strong enrichment is observed for V, Sn, Co, Ag, Mo, Cd, Zn,Ni, Sb, Cu, and Pb (CEF > 10), indicating their anthropogenic origin.
The other group of trace metals measured in this study is pre-sented in Figs. S2 and S3 in the Supplementary materials. Theannual average value of all these metals (±sd) was 2.6 ± 7.3 ng/m3;phosphorus showed the highest level with an annual average (±sd)of 36 ± 18 ng/m3, and the lowest level was for platinum(0.0025 ± 0.002 ng/m3).
3.6. ROS activity-monthly trend and chemical compositionsrelationships
The water soluble fraction of ROS-activity of monthly samplecomposites, expressed as mg zymosan/m3, was determined toprovide a metric of exposure comparable to that of chemistry data.As shown in Fig. 6 (a), the ROS-activity had no apparent seasonaltrend, with an annual average of 59.4 ± 35.5 mg zymosan/m3. Thehighest activity was 126.9 ± 23.9 mg zymosan/m3 in December, andthe lowest activity was (12.2 ± 2.1 mg zymosan/m3) in April, sug-gesting that the greatest exposure to redox-active PM2.5 (by morethan an order-of-magnitude over lowest month) was duringDecember. However, the air volume-based ROS-activity in Baghdad
is overall lower than in other urban areas (Daher et al., 2011; Zhanget al., 2008).
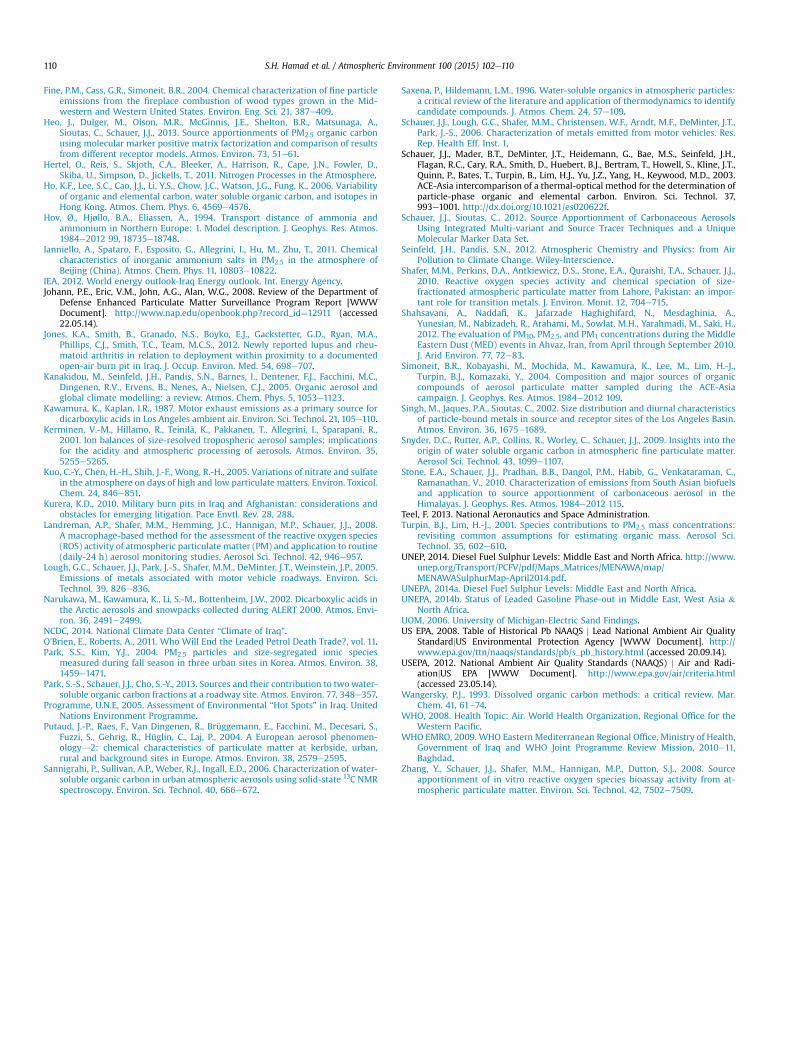
A multi-linear regression model was applied to explore thecorrelation between the water soluble ROS-activity and the watersoluble fractions of PM2.5 (Cl�, SO4
�2, NO3�, NH4
þ, WSON, WSOC-BB,and WSOC-non-BB or WSOC-Other), but no significant relation-ships were observed (results are not shown here), whichmight be aresult of uncertainty of using limited samples and the relativelyshort-term sampling duration. However, the correlation matrixresults of the water soluble species and the water soluble ROSshowed that WSOC-BB was the most important species that hascorrelationwith thewater soluble ROS production (Table S1), linearregression results ofWSOC-BBwith ROS shown in Fig. 7 (R2¼ 0.52).The seasonal trend of the water soluble ROS-activity exhibited atrend similar to that of the biomass burning fraction of the watersoluble organic carbon (Fig. 6(a) and (b)). In Baghdad, open burningis very common especially in the winter (November throughFebruary); however, burning is not uncommon at other times of theyear as a method of waste disposal (Jones et al., 2012; Kurera, 2010).Again, dust/sand storms and precipitation could impact the levelsof PM2.5, and thus its chemical composition, that can contribute tothe ROS activity, so the oxidative stress levels measured at suchdays/months could be reduced (Fig. 6(a) and (b)).
4. Conclusion
The total chemical composition, the water soluble species(WSOC-BB, WSOC-non-BB, WSN, WSON, SO4
�2, NH4þ, NO3
�, Cl�, Naþ,Mgþ2, Kþ, Caþ2), and the water soluble ROS-activity of PM2.5 for
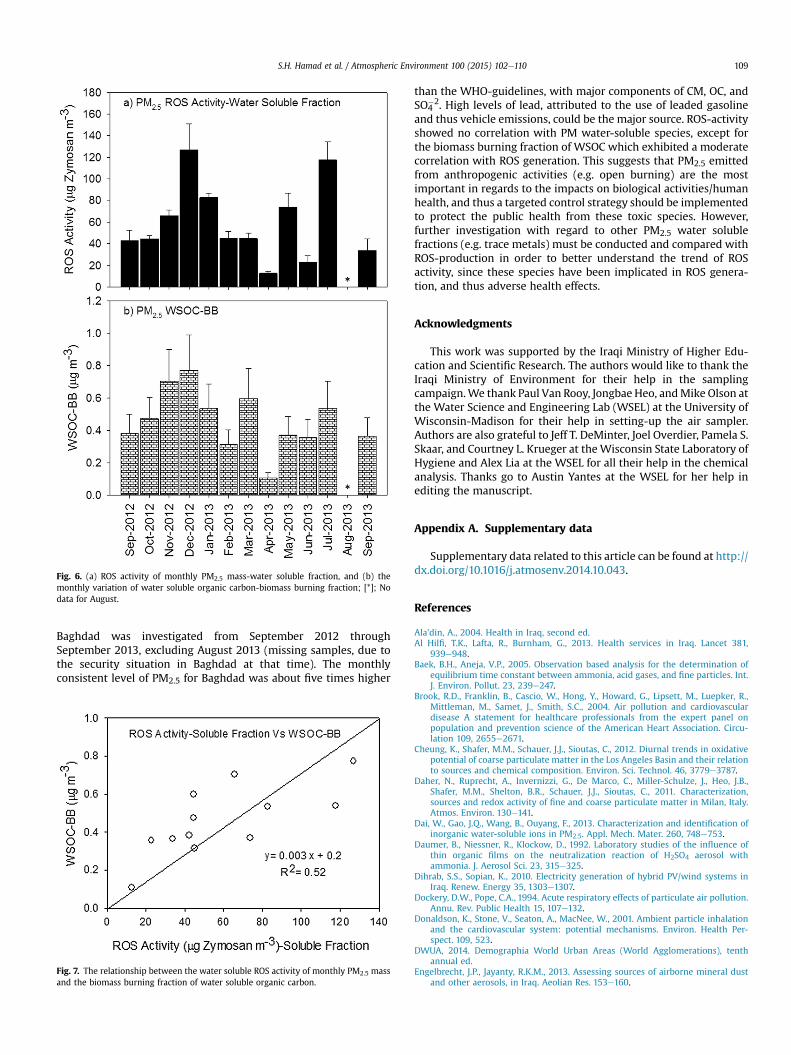
Fig. 6. (a) ROS activity of monthly PM2.5 mass-water soluble fraction, and (b) themonthly variation of water soluble organic carbon-biomass burning fraction; [*]; Nodata for August.
S.H. Hamad et al. / Atmospheric Environment 100 (2015) 102e110 109
Baghdad was investigated from September 2012 throughSeptember 2013, excluding August 2013 (missing samples, due tothe security situation in Baghdad at that time). The monthlyconsistent level of PM2.5 for Baghdad was about five times higher
Fig. 7. The relationship between the water soluble ROS activity of monthly PM2.5 massand the biomass burning fraction of water soluble organic carbon.
than the WHO-guidelines, with major components of CM, OC, andSO4
�2. High levels of lead, attributed to the use of leaded gasolineand thus vehicle emissions, could be the major source. ROS-activityshowed no correlation with PM water-soluble species, except forthe biomass burning fraction of WSOC which exhibited a moderatecorrelation with ROS generation. This suggests that PM2.5 emittedfrom anthropogenic activities (e.g. open burning) are the mostimportant in regards to the impacts on biological activities/humanhealth, and thus a targeted control strategy should be implementedto protect the public health from these toxic species. However,further investigation with regard to other PM2.5 water solublefractions (e.g. trace metals) must be conducted and compared withROS-production in order to better understand the trend of ROSactivity, since these species have been implicated in ROS genera-tion, and thus adverse health effects.
Acknowledgments
This work was supported by the Iraqi Ministry of Higher Edu-cation and Scientific Research. The authors would like to thank theIraqi Ministry of Environment for their help in the samplingcampaign.We thank Paul Van Rooy, Jongbae Heo, andMike Olson atthe Water Science and Engineering Lab (WSEL) at the University ofWisconsin-Madison for their help in setting-up the air sampler.Authors are also grateful to Jeff T. DeMinter, Joel Overdier, Pamela S.Skaar, and Courtney L. Krueger at theWisconsin State Laboratory ofHygiene and Alex Lia at the WSEL for all their help in the chemicalanalysis. Thanks go to Austin Yantes at the WSEL for her help inediting the manuscript.
Appendix A. Supplementary data
Supplementary data related to this article can be found at http://dx.doi.org/10.1016/j.atmosenv.2014.10.043.
References
Ala'din, A., 2004. Health in Iraq, second ed.Al Hilfi, T.K., Lafta, R., Burnham, G., 2013. Health services in Iraq. Lancet 381,
939e948.Baek, B.H., Aneja, V.P., 2005. Observation based analysis for the determination of
equilibrium time constant between ammonia, acid gases, and fine particles. Int.J. Environ. Pollut. 23, 239e247.
Brook, R.D., Franklin, B., Cascio, W., Hong, Y., Howard, G., Lipsett, M., Luepker, R.,Mittleman, M., Samet, J., Smith, S.C., 2004. Air pollution and cardiovasculardisease A statement for healthcare professionals from the expert panel onpopulation and prevention science of the American Heart Association. Circu-lation 109, 2655e2671.
Cheung, K., Shafer, M.M., Schauer, J.J., Sioutas, C., 2012. Diurnal trends in oxidativepotential of coarse particulate matter in the Los Angeles Basin and their relationto sources and chemical composition. Environ. Sci. Technol. 46, 3779e3787.
Daher, N., Ruprecht, A., Invernizzi, G., De Marco, C., Miller-Schulze, J., Heo, J.B.,Shafer, M.M., Shelton, B.R., Schauer, J.J., Sioutas, C., 2011. Characterization,sources and redox activity of fine and coarse particulate matter in Milan, Italy.Atmos. Environ. 130e141.
Dai, W., Gao, J.Q., Wang, B., Ouyang, F., 2013. Characterization and identification ofinorganic water-soluble ions in PM2.5. Appl. Mech. Mater. 260, 748e753.
Daumer, B., Niessner, R., Klockow, D., 1992. Laboratory studies of the influence ofthin organic films on the neutralization reaction of H2SO4 aerosol withammonia. J. Aerosol Sci. 23, 315e325.
Dihrab, S.S., Sopian, K., 2010. Electricity generation of hybrid PV/wind systems inIraq. Renew. Energy 35, 1303e1307.
Dockery, D.W., Pope, C.A., 1994. Acute respiratory effects of particulate air pollution.Annu. Rev. Public Health 15, 107e132.
Donaldson, K., Stone, V., Seaton, A., MacNee, W., 2001. Ambient particle inhalationand the cardiovascular system: potential mechanisms. Environ. Health Per-spect. 109, 523.
DWUA, 2014. Demographia World Urban Areas (World Agglomerations), tenthannual ed.
Engelbrecht, J.P., Jayanty, R.K.M., 2013. Assessing sources of airborne mineral dustand other aerosols, in Iraq. Aeolian Res. 153e160.
S.H. Hamad et al. / Atmospheric Environment 100 (2015) 102e110110
Fine, P.M., Cass, G.R., Simoneit, B.R., 2004. Chemical characterization of fine particleemissions from the fireplace combustion of wood types grown in the Mid-western and Western United States. Environ. Eng. Sci. 21, 387e409.
Heo, J., Dulger, M., Olson, M.R., McGinnis, J.E., Shelton, B.R., Matsunaga, A.,Sioutas, C., Schauer, J.J., 2013. Source apportionments of PM2.5 organic carbonusing molecular marker positive matrix factorization and comparison of resultsfrom different receptor models. Atmos. Environ. 73, 51e61.
Hertel, O., Reis, S., Skjoth, C.A., Bleeker, A., Harrison, R., Cape, J.N., Fowler, D.,Skiba, U., Simpson, D., Jickells, T., 2011. Nitrogen Processes in the Atmosphere.
Ho, K.F., Lee, S.C., Cao, J.J., Li, Y.S., Chow, J.C., Watson, J.G., Fung, K., 2006. Variabilityof organic and elemental carbon, water soluble organic carbon, and isotopes inHong Kong. Atmos. Chem. Phys. 6, 4569e4576.
Hov, Ø., Hjøllo, B.A., Eliassen, A., 1994. Transport distance of ammonia andammonium in Northern Europe: 1. Model description. J. Geophys. Res. Atmos.1984e2012 99, 18735e18748.
Ianniello, A., Spataro, F., Esposito, G., Allegrini, I., Hu, M., Zhu, T., 2011. Chemicalcharacteristics of inorganic ammonium salts in PM2.5 in the atmosphere ofBeijing (China). Atmos. Chem. Phys. 11, 10803e10822.
IEA, 2012. World energy outlook-Iraq Energy outlook. Int. Energy Agency.Johann, P.E., Eric, V.M., John, A.G., Alan, W.G., 2008. Review of the Department of
Defense Enhanced Particulate Matter Surveillance Program Report [WWWDocument]. http://www.nap.edu/openbook.php?record_id¼12911 (accessed22.05.14).
Jones, K.A., Smith, B., Granado, N.S., Boyko, E.J., Gackstetter, G.D., Ryan, M.A.,Phillips, C.J., Smith, T.C., Team, M.C.S., 2012. Newly reported lupus and rheu-matoid arthritis in relation to deployment within proximity to a documentedopen-air burn pit in Iraq. J. Occup. Environ. Med. 54, 698e707.
Kanakidou, M., Seinfeld, J.H., Pandis, S.N., Barnes, I., Dentener, F.J., Facchini, M.C.,Dingenen, R.V., Ervens, B., Nenes, A., Nielsen, C.J., 2005. Organic aerosol andglobal climate modelling: a review. Atmos. Chem. Phys. 5, 1053e1123.
Kawamura, K., Kaplan, I.R., 1987. Motor exhaust emissions as a primary source fordicarboxylic acids in Los Angeles ambient air. Environ. Sci. Technol. 21, 105e110.
Kerminen, V.-M., Hillamo, R., Teinil€a, K., Pakkanen, T., Allegrini, I., Sparapani, R.,2001. Ion balances of size-resolved tropospheric aerosol samples: implicationsfor the acidity and atmospheric processing of aerosols. Atmos. Environ. 35,5255e5265.
Kuo, C.-Y., Chen, H.-H., Shih, J.-F., Wong, R.-H., 2005. Variations of nitrate and sulfatein the atmosphere on days of high and low particulate matters. Environ. Toxicol.Chem. 24, 846e851.
Kurera, K.D., 2010. Military burn pits in Iraq and Afghanistan: considerations andobstacles for emerging litigation. Pace Envtl. Rev. 28, 288.
Landreman, A.P., Shafer, M.M., Hemming, J.C., Hannigan, M.P., Schauer, J.J., 2008.A macrophage-based method for the assessment of the reactive oxygen species(ROS) activity of atmospheric particulate matter (PM) and application to routine(daily-24 h) aerosol monitoring studies. Aerosol Sci. Technol. 42, 946e957.
Lough, G.C., Schauer, J.J., Park, J.-S., Shafer, M.M., DeMinter, J.T., Weinstein, J.P., 2005.Emissions of metals associated with motor vehicle roadways. Environ. Sci.Technol. 39, 826e836.
Narukawa, M., Kawamura, K., Li, S.-M., Bottenheim, J.W., 2002. Dicarboxylic acids inthe Arctic aerosols and snowpacks collected during ALERT 2000. Atmos. Envi-ron. 36, 2491e2499.
NCDC, 2014. National Climate Data Center “Climate of Iraq”.O'Brien, E., Roberts, A., 2011. Who Will End the Leaded Petrol Death Trade?, vol. 11.Park, S.S., Kim, Y.J., 2004. PM2.5 particles and size-segregated ionic species
measured during fall season in three urban sites in Korea. Atmos. Environ. 38,1459e1471.
Park, S.-S., Schauer, J.J., Cho, S.-Y., 2013. Sources and their contribution to two water-soluble organic carbon fractions at a roadway site. Atmos. Environ. 77, 348e357.
Programme, U.N.E, 2005. Assessment of Environmental “Hot Spots” in Iraq. UnitedNations Environment Programme.
Putaud, J.-P., Raes, F., Van Dingenen, R., Brüggemann, E., Facchini, M., Decesari, S.,Fuzzi, S., Gehrig, R., Hüglin, C., Laj, P., 2004. A European aerosol phenomen-ologyd2: chemical characteristics of particulate matter at kerbside, urban,rural and background sites in Europe. Atmos. Environ. 38, 2579e2595.
Sannigrahi, P., Sullivan, A.P., Weber, R.J., Ingall, E.D., 2006. Characterization of water-soluble organic carbon in urban atmospheric aerosols using solid-state 13C NMRspectroscopy. Environ. Sci. Technol. 40, 666e672.
Saxena, P., Hildemann, L.M., 1996. Water-soluble organics in atmospheric particles:a critical review of the literature and application of thermodynamics to identifycandidate compounds. J. Atmos. Chem. 24, 57e109.
Schauer, J.J., Lough, G.C., Shafer, M.M., Christensen, W.F., Arndt, M.F., DeMinter, J.T.,Park, J.-S., 2006. Characterization of metals emitted from motor vehicles. Res.Rep. Health Eff. Inst. 1.
Schauer, J.J., Mader, B.T., DeMinter, J.T., Heidemann, G., Bae, M.S., Seinfeld, J.H.,Flagan, R.C., Cary, R.A., Smith, D., Huebert, B.J., Bertram, T., Howell, S., Kline, J.T.,Quinn, P., Bates, T., Turpin, B., Lim, H.J., Yu, J.Z., Yang, H., Keywood, M.D., 2003.ACE-Asia intercomparison of a thermal-optical method for the determination ofparticle-phase organic and elemental carbon. Environ. Sci. Technol. 37,993e1001. http://dx.doi.org/10.1021/es020622f.
Schauer, J.J., Sioutas, C., 2012. Source Apportionment of Carbonaceous AerosolsUsing Integrated Multi-variant and Source Tracer Techniques and a UniqueMolecular Marker Data Set.
Seinfeld, J.H., Pandis, S.N., 2012. Atmospheric Chemistry and Physics: from AirPollution to Climate Change. Wiley-Interscience.
Shafer, M.M., Perkins, D.A., Antkiewicz, D.S., Stone, E.A., Quraishi, T.A., Schauer, J.J.,2010. Reactive oxygen species activity and chemical speciation of size-fractionated atmospheric particulate matter from Lahore, Pakistan: an impor-tant role for transition metals. J. Environ. Monit. 12, 704e715.
Shahsavani, A., Naddafi, K., Jafarzade Haghighifard, N., Mesdaghinia, A.,Yunesian, M., Nabizadeh, R., Arahami, M., Sowlat, M.H., Yarahmadi, M., Saki, H.,2012. The evaluation of PM10, PM2.5, and PM1 concentrations during the MiddleEastern Dust (MED) events in Ahvaz, Iran, from April through September 2010.J. Arid Environ. 77, 72e83.
Simoneit, B.R., Kobayashi, M., Mochida, M., Kawamura, K., Lee, M., Lim, H.-J.,Turpin, B.J., Komazaki, Y., 2004. Composition and major sources of organiccompounds of aerosol particulate matter sampled during the ACE-Asiacampaign. J. Geophys. Res. Atmos. 1984e2012 109.
Singh, M., Jaques, P.A., Sioutas, C., 2002. Size distribution and diurnal characteristicsof particle-bound metals in source and receptor sites of the Los Angeles Basin.Atmos. Environ. 36, 1675e1689.
Snyder, D.C., Rutter, A.P., Collins, R., Worley, C., Schauer, J.J., 2009. Insights into theorigin of water soluble organic carbon in atmospheric fine particulate matter.Aerosol Sci. Technol. 43, 1099e1107.
Stone, E.A., Schauer, J.J., Pradhan, B.B., Dangol, P.M., Habib, G., Venkataraman, C.,Ramanathan, V., 2010. Characterization of emissions from South Asian biofuelsand application to source apportionment of carbonaceous aerosol in theHimalayas. J. Geophys. Res. Atmos. 1984e2012 115.
Teel, F. 2013. National Aeronautics and Space Administration.Turpin, B.J., Lim, H.-J., 2001. Species contributions to PM2.5 mass concentrations:
revisiting common assumptions for estimating organic mass. Aerosol Sci.Technol. 35, 602e610.
UNEP, 2014. Diesel Fuel Sulphur Levels: Middle East and North Africa. http://www.unep.org/Transport/PCFV/pdf/Maps_Matrices/MENAWA/map/MENAWASulphurMap-April2014.pdf.
UNEPA, 2014a. Diesel Fuel Sulphur Levels: Middle East and North Africa.UNEPA, 2014b. Status of Leaded Gasoline Phase-out in Middle East, West Asia &
North Africa.UOM, 2006. University of Michigan-Electric Sand Findings.US EPA, 2008. Table of Historical Pb NAAQS j Lead National Ambient Air Quality
StandardjUS Environmental Protection Agency [WWW Document]. http://www.epa.gov/ttn/naaqs/standards/pb/s_pb_history.html (accessed 20.09.14).
USEPA, 2012. National Ambient Air Quality Standards (NAAQS) j Air and Radi-ationjUS EPA [WWW Document]. http://www.epa.gov/air/criteria.html(accessed 23.05.14).
Wangersky, P.J., 1993. Dissolved organic carbon methods: a critical review. Mar.Chem. 41, 61e74.
WHO, 2008. Health Topic: Air. World Health Organization, Regional Office for theWestern Pacific.
WHO EMRO, 2009. WHO Eastern Mediterranean Regional Office, Ministry of Health,Government of Iraq and WHO Joint Programme Review Mission, 2010e11,Baghdad.
Zhang, Y., Schauer, J.J., Shafer, M.M., Hannigan, M.P., Dutton, S.J., 2008. Sourceapportionment of in vitro reactive oxygen species bioassay activity from at-mospheric particulate matter. Environ. Sci. Technol. 42, 7502e7509.