Embed Size (px)
Citation preview
Ag/Climate Decision Support Tools for Farmers and Ag. Advisors: The Products, Outreach and Evaluation
*Evaluation Associate, University of Wisconsin ExtensionSWCS 7.27.15 Greensboro, NC
Jenna Klink, Dennis Todey, Vikram Koundinya*, Chad Hart & Linda Prokopy
U2U Project

About the Project
About U2U
• Useful to Usable (U2U) is a USDA-funded research and extension project focused on improving the uptake of climate information
• U2U is a team of climatologists, crop modelers, agronomists, IT specialists, economists, sociologists, Extension, evaluators and more


The Decision Support Tools (DSTs)

• Corn Growing Degree Days (GDD): Track real-time GDD accumulations and learn about climate risks for corn development
• Climate Patterns Viewer (CPV): Connect global climate conditions to local climate impacts
• Corn Split Nitrogen: Determine the feasibility and profitability of using in-season nitrogen application for corn production
• AgClimate View (ACV): Customize historical climate and crop yield data for the U.S. Corn Belt

Outreach
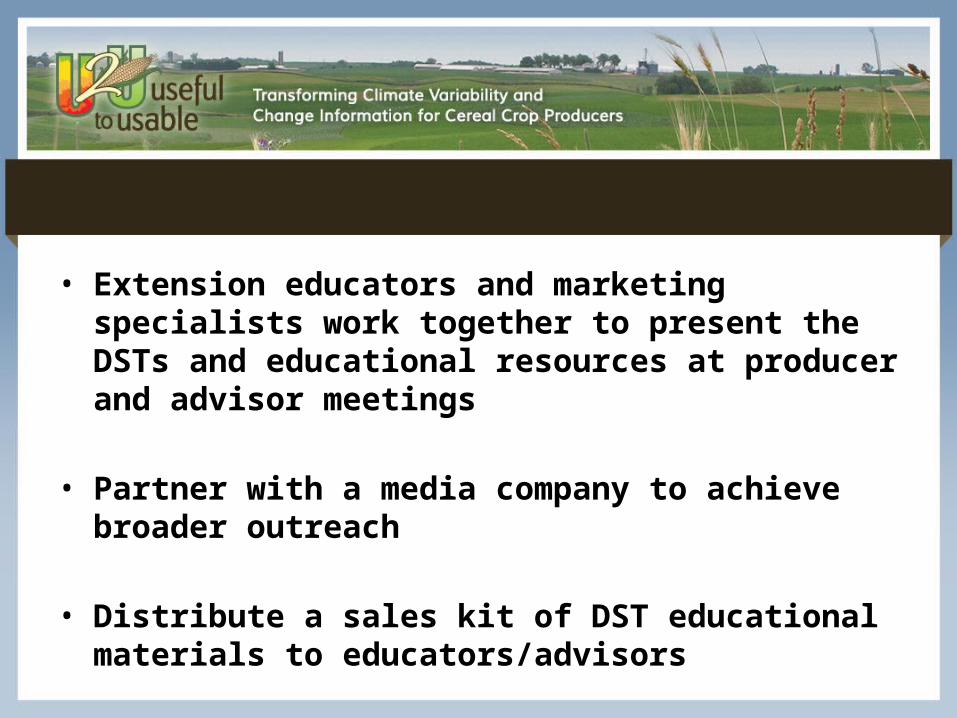
• Extension educators and marketing specialists work together to present the DSTs and educational resources at producer and advisor meetings
• Partner with a media company to achieve broader outreach
• Distribute a sales kit of DST educational materials to educators/advisors


Track using Smartsheet.com
Likelihood to use, relevance, point of contact for various sign-ups
Based on what you’ve seen, what other tools or products would you like to see developed in the future?
Evaluation

Why evaluate? Learning & accountability
• Formative– impact– Collaborative tool development
• Summative– impact

How do we evaluate?
• Gather & analyze feedback; report to team
– From team– From testers: experts & those with occupations
“closely tied to farming industry”– From potential & actual users
• Our target audiences: agricultural advisors & farmers in 12 states

The deliverables / tools
1. UserTesting.com
2. “Expert” testing using Qualtrics online surveying
Changes have been made to tools based on this feedback:• GDD zoom capabilities – easier to get information now• Split N default values – yield penalties & formatting of economics• Help button easier to find
3. Surveys now linked to tool webpages


% of respondents who are likely and very likely to use each U2U tool, with the overall percent of “at least somewhat likely” displayed above each bar.
The bar on the far right represents the percentage of respondents that are at least somewhat likely to use at least one of the tools.
Gro
wing D
egree D
ay (n
=483)
Climate
Patte
rns
Viewer (
n=47)
Split Nitr
ogen (n=235)
AgClimate
Vie
w (n=139)
Probable
Fie
ld W
ork D
ays (n
=19)
Combin
ed (n=549)
0%
90%
53%66%
51% 53%26%
81%
29% 6%18% 17%
21%
81%72% 69% 69%
47%
81%
Likely Very Likely
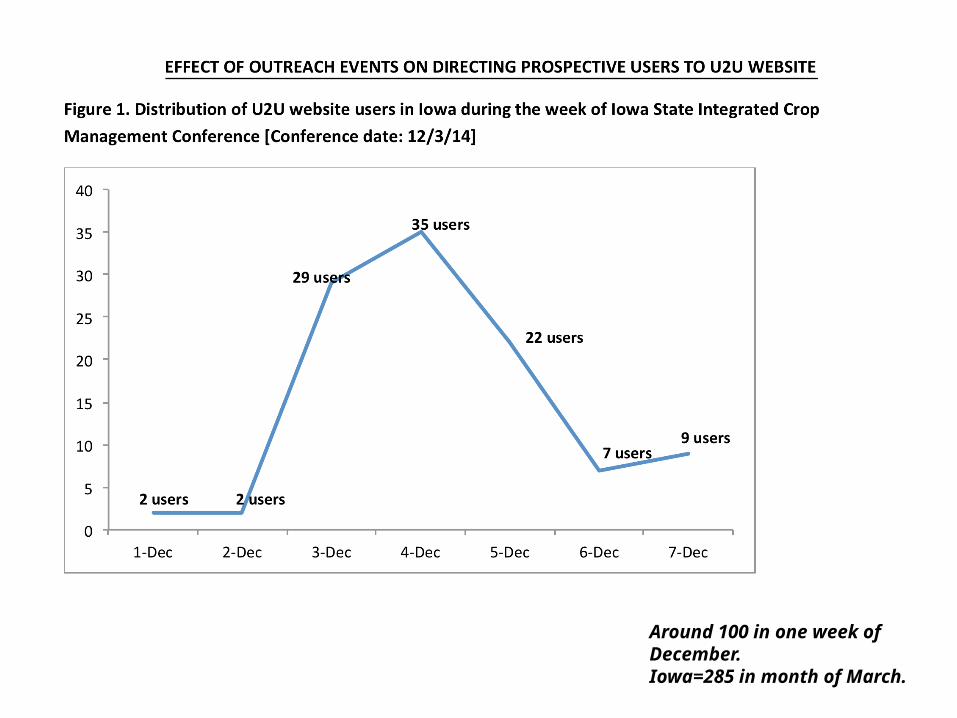
Around 100 in one week of December.Iowa=285 in month of March.

The marketing/dissemination
• >12,000 mail; <7,000 email • Quarterly beginning in March 2015• Learning & accountability (10K per quarter)
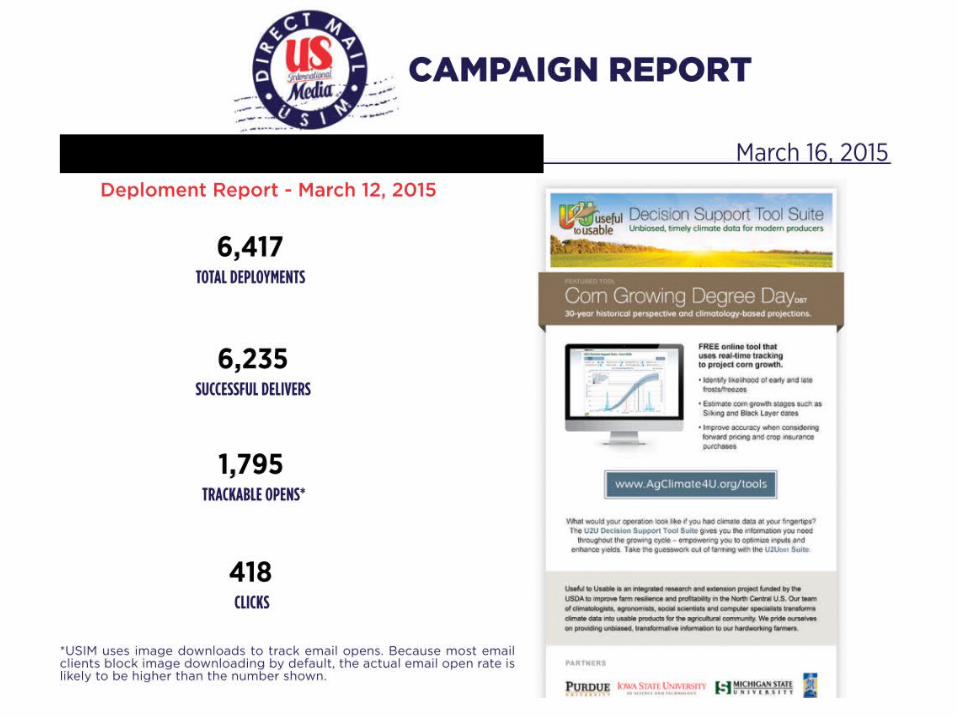
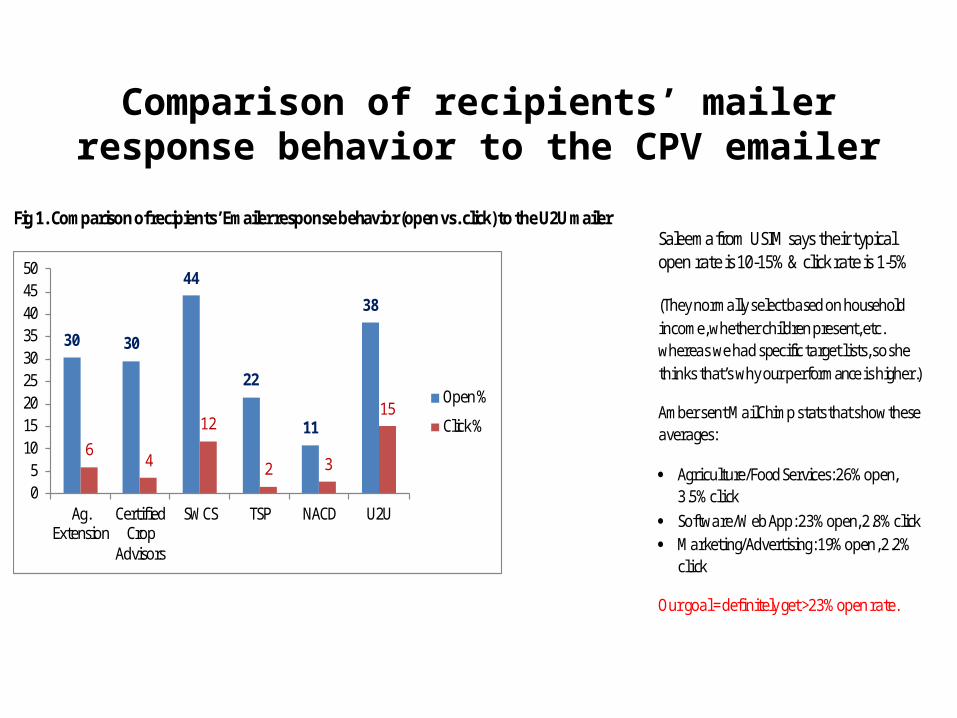
Fig 1. Comparison of recipients’ Emailer response behavior (open vs. click) to the U2U mailer
30 30
44
22
11
38
64
12
2 3
15
05
101520253035404550
Ag.Extension
CertifiedCrop
Advisors
SWCS TSP NACD U2U
Open %
Click %
Saleema from USIM says their typical open rate is 10-15% & click rate is 1-5%
(They normally select based on household income, whether children present, etc. whereas we had specific target l ists, so she thinks that’s why our performance is higher.)
Amber sent MailChimp stats that show these averages:
Agriculture/Food Services: 26% open, 3.5% click
Software/Web App: 23% open, 2.8% click Marketing/Advertising: 19% open, 2.2%
click
Our goal = definitely get >23% open rate.
Comparison of recipients’ mailer response behavior to the CPV emailer
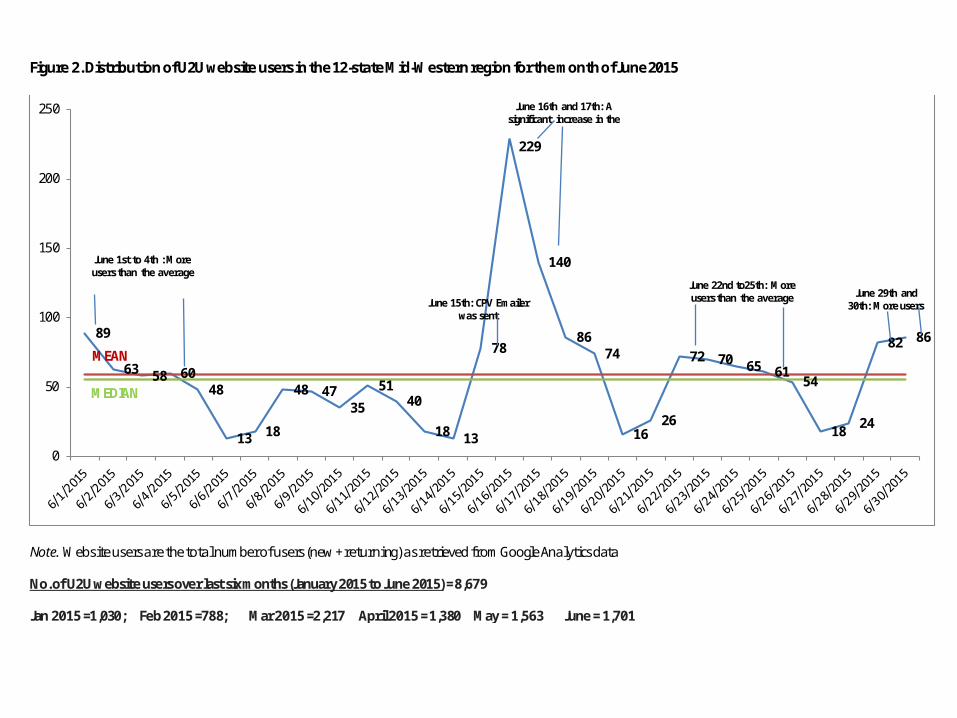
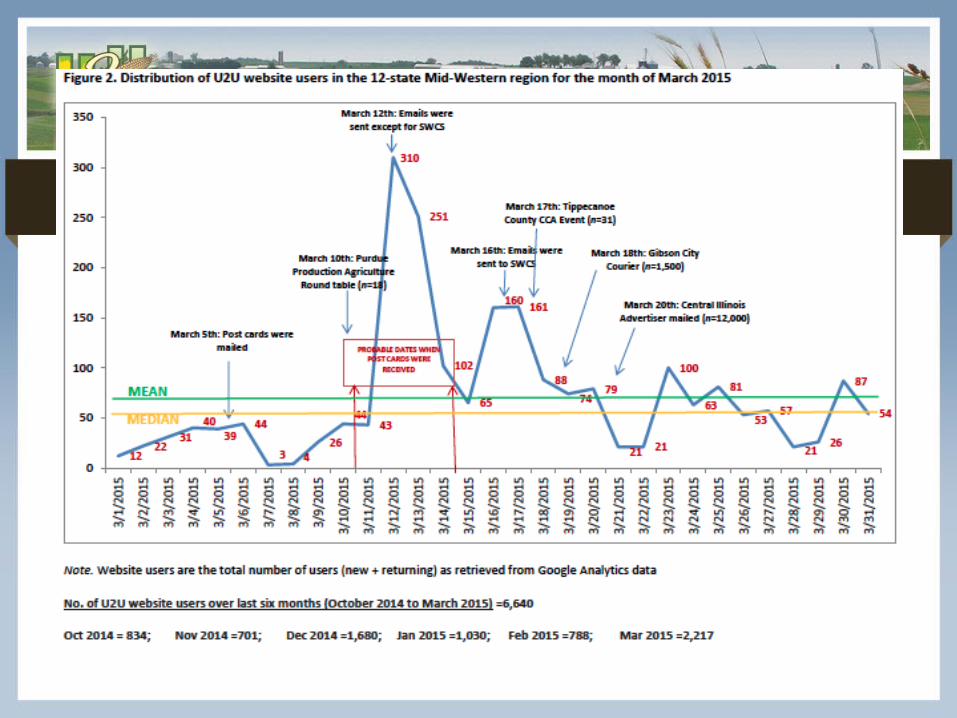
Figure 2. Distribution of U2U website users in the 12-state Mid-Western region for the month of June 2015
Note. Website users are the total number of users (new + returning) as retrieved from Google Analytics data
No. of U2U website users over last six months (January 2015 to June 2015) = 8,679
Jan 2015 =1,030; Feb 2015 =788; Mar 2015 =2,217 April 2015 = 1,380 May = 1,563 June = 1,701
89
63 58 6048
13 18
48 4735
5140
18 13
78
229
140
8674
1626
72 70 65 6154
18 24
82 86
0
50
100
150
200
250
June 15th: CPV Emailer was sent
June 16th and 17th: Asignificant increase in the
June 22nd to25th: More users than the average June 29th and
30th: More users
June 1st to 4th : More users than the average
MEDIAN
MEAN
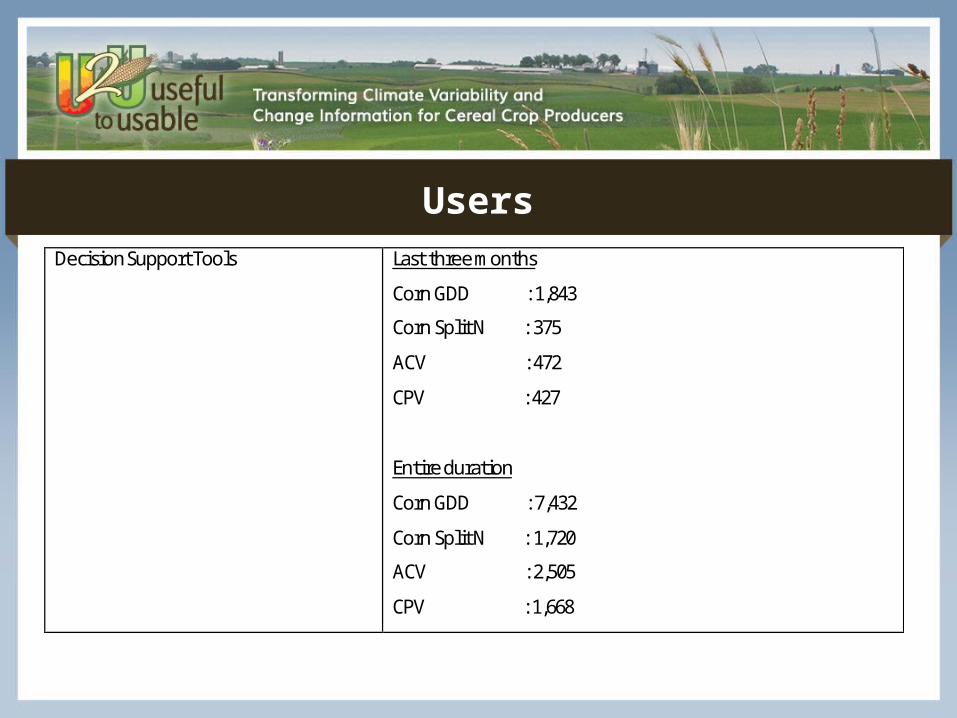
UsersDecision Support Tools Last three months
Corn GDD : 1,843
Corn Split N : 375
ACV : 472
CPV : 427
Entire duration
Corn GDD : 7,432
Corn Split N : 1,720
ACV : 2,505
CPV : 1,668
Thank you!
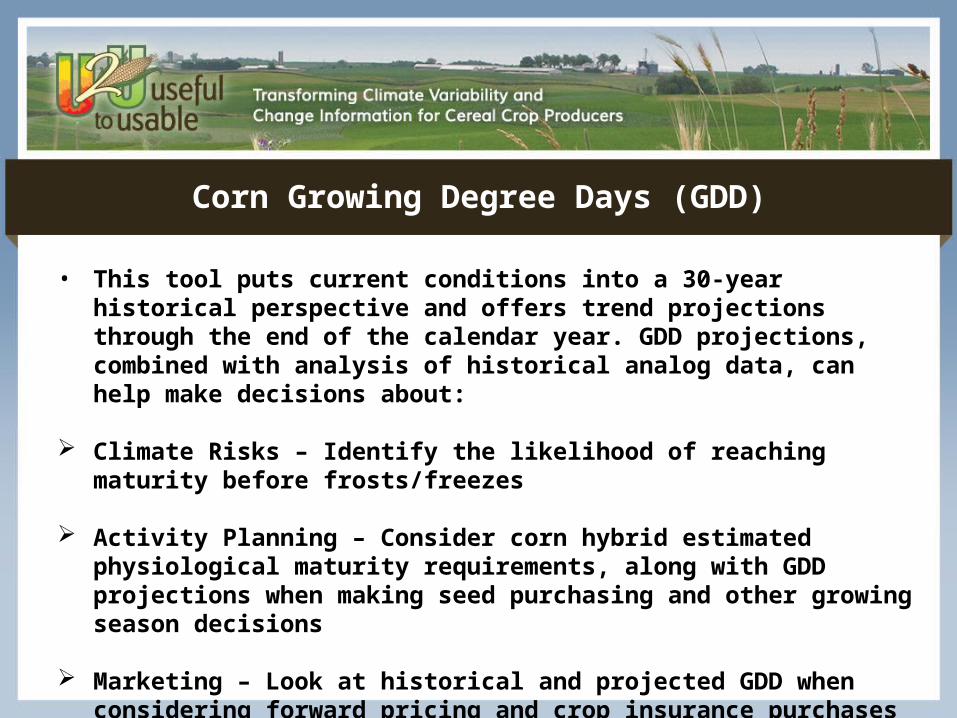
Corn Growing Degree Days (GDD)
• This tool puts current conditions into a 30-year historical perspective and offers trend projections through the end of the calendar year. GDD projections, combined with analysis of historical analog data, can help make decisions about:
Climate Risks – Identify the likelihood of reaching maturity before frosts/freezes
Activity Planning – Consider corn hybrid estimated physiological maturity requirements, along with GDD projections when making seed purchasing and other growing season decisions
Marketing – Look at historical and projected GDD when considering forward pricing and crop insurance purchases
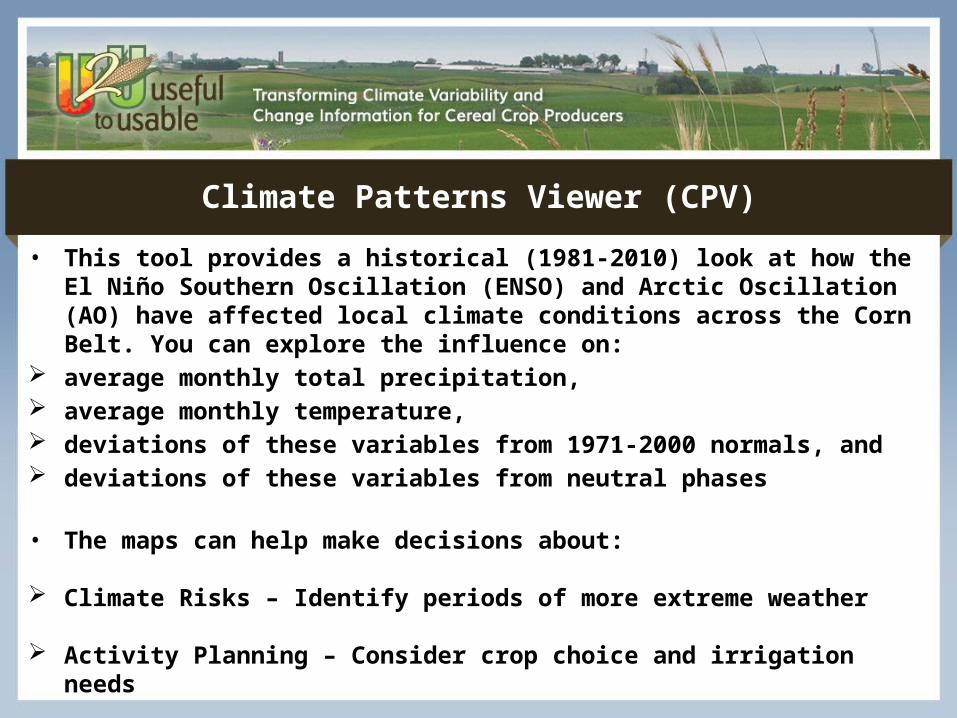
Climate Patterns Viewer (CPV)
• This tool provides a historical (1981-2010) look at how the El Niño Southern Oscillation (ENSO) and Arctic Oscillation (AO) have affected local climate conditions across the Corn Belt. You can explore the influence on:
average monthly total precipitation, average monthly temperature, deviations of these variables from 1971-2000 normals, and deviations of these variables from neutral phases
• The maps can help make decisions about:
Climate Risks – Identify periods of more extreme weather
Activity Planning – Consider crop choice and irrigation needs
Marketing – Explore forward pricing alternatives

Corn Split Nitrogen
• This tool is designed to help farmers and farm advisors understand the risks and benefits of using post-planting nitrogen (N) application for corn production. The tool combines historical weather and fieldwork data with economic considerations to determine the feasibility and profitability of completing a second (split) N application within a user-specified time period. This tool may help you with decisions that:
Increase corn yields
Reduce nitrogen costs
Reduce nitrogen losses to the environment
Affect the likelihood of completing in-season fieldwork

AgClimate View (ACV)
• This tool helps:
Plot local temperature and precipitation variation as far back as 1980,
Track county crop yields and trends, and
Consider crop yields in the context of temperature, precipitation, and growing degree day data
• Used in tandem with other decision resources, AgClimate View can help you find long-term correlations between climate trends and yields, while helping you put your recent crop experience into historical context

Comparison of recipients’ mailer response behavior to the GDD mailer
About U2U
• Transform existing climate information into usable knowledge for agricultural decision making
• Give farmers the resources and training to more effectively manage variable climate conditions
• Increase Extension’s capacity to address agro-climate issues

The users
• Our “cohort”
• Random sample will assess our reach among farmers
• Metrics: actual use, use in decisions, willingness to consider climate info in future
• Stories/qualitative