Embed Size (px)
Citation preview


The policy case for EMAS
Why public bodies should
promote voluntary environmental
measures in companies

Key research-questions
• If a public body promotes EMAS, is it effectively pursuingenvironmental improvement?
– EMAS and environmental performance
– The real effectiveness of EMAS
– EMAS and legal compliance
• What are the different roles for a public body?
– Public bodies exerting « pressures » on companies
– Public bodies and regulatory relief
– The pivotal role of public bodies in supporting companies

4
What 467 EMAS registered organisations
perceive: a recent survey
• Nearly all surveyed and interviewed organisations reported
performance improvement, although that improvement was often
confined to a few core indicators.
• Our results are in line with previous research.
• Research indicates that EMS in general and EMAS in particular can lead
to performance improvements, with most showing a somewhat more
positive trend for EMAS than for ISO 14001.
• Results did not show duration as a core decisive variable/factor for the
variation in performance. One explanation is that the quality of EMS
implementation (i.e.: the “internalisation”) is more important.
Source: EMAS Evaluation Study, 2015, adelphi
and Sant’Anna School, submitted to DG Env.

Deteriorated a
lot
Deteriorated
somewhatNo change
Improved
somewhat
Improved
signficantly
Energy efficiency 0.23% 2.72% 11.79% 41.50% 43.76%
Efficiency in the use
of materials0.47% 0.94% 22.82% 48.47% 27.29%
Water consumption 0.46% 3.45% 24.14% 42.30% 29.66%
Waste production 0.46% 2.29% 20.59% 44.85% 31.81%
Biodiversity 1.35% 1.35% 64.96% 20.49% 11.86%
Quality/quantity of
wastewater effluents0.77% 1.29% 48.45% 28.61% 20.88%
Quality/quantity of air
emissions0.49% 1.73% 37.04% 38.02% 22.72%
Noise emissions 0.25% 2.02% 54.55% 29.55% 13.64%
Protection of soil and
groundwater0.77% 0.77% 49.23% 30.51% 18.72%
Odours 0.83% 1.67% 67.22% 19.72% 10.56%
Prevention of risks
and accidents0.48% 0.72% 22.54% 45.56% 30.70%
Environmental Performance improvementsaccording to the interviewees:

7
What is proven by
the EMAS Staments:
The environmental statement analysis presented the most extensive
investigation to date into EMAS's influence on multiple aspects of
organisations' environmental performance.
• Data was collected from the most recent environmental statements of
122 EMAS registered organisations.
• Six energy-intensive sectors were analysed: e.g. waste collection,
various manufacturing sectors
• Focus: performance over a time period of two years (n-2; e.g. 2012-
2014).
Source: EMAS Evaluation Study, 2015, adelphi
and Sant’Anna School, submitted to DG Env.

Environmental statement
analysis: the results
Source: EMAS Evaluation Study, 2015, adelphi
and Sant’Anna School, submitted to DG Env.

9
A comparative study on
EMAS and ISO 14001
«effectiveness» (considering CO2 emissions)
0
0,5
1
1,5
2
2,5
3
3,5
4
4,5
1 2 3 4 5 6 7 8
EMAS
ISO 14001
Variable Mean Std.Dev. Minimum Maximum NumCases
CO2 emissions 2007-
2010 3.89 1.29 1 7 194
EMAS Adoption (2007) 0.24 0.43 0 1 229
ISO 14001 Adoption
(2007) 0.43 0.49 0 1 229
EMAS maturity 1.12 2.36 0 13 229
ISO 14001 maturity 2.38 3.34 0 17 229
N° of employees (log) 6.77 2.45 0 11.22 175
Trend of operation
revenues (2007-2010) 2.78 29.30 -0.77 397.30 187
Testa F., Rizzi F, Daddi, T.,
Gusmerotti NM., Iraldo, F., Frey,
M., 2014. EMAS and ISO 14001:
the differences in effectively
improving environmental
performance. Journal of Cleaner
Production 68 165-173

10
What factors lead to
performance improvements?How would you rate the following
factors in terms of their importance for achieving environmental
improvement?
Value Standard deviation
Technical progress 3.98 0.82
Environmental management system used to fulfil EMAS requirements
3.89 0.80
Environmental regulation/public policy intervention
3.85 0.90
Environmental reporting 3.78 0.90
Cost (savings) of production inputs 3.65 1.00
1-5 Likert scale, "1 = option is not effective at all" to "5
= option is very effective"Source: EMAS Evaluation Study, 2015, adelphi
and Sant’Anna School, submitted to DG Env.

11
What factors lead to
performance improvements?How would you rate the following
factors in terms of their importance for achieving environmental
improvement?
Value Standard deviation
Technical progress 3.98 0.82
Environmental management system used to fulfil EMAS requirements
3.89 0.80
Environmental regulation/public policy intervention
3.85 0.90
Environmental reporting 3.78 0.90
Cost (savings) of production inputs 3.65 1.00
1-5 Likert scale, "1 = option is not effective at all" to "5
= option is very effective"Source: EMAS Evaluation Study, 2015, adelphi
and Sant’Anna School, submitted to DG Env.

EMAS benefits for registered organisations ValueImproved legislative compliance 3.83
Reduced risk of incurring environmental sanctions through improved compliance 3.54
Better identification of overall corporate responsibilities (e.g. clear identification of roles and
responsibilities for managing environmental requirements)3.51
Fewer environmental accidents 3.29
Cost savings through reuse, recycling, or decrease in resource or energy use 3.25
Improved relations with public stakeholders and the local community 3.15
Increased employees involvement and satisfaction 3.09
Consistent environmental management practices (incl. legal compliance check; reporting) worldwide
through EMAS Global3.07
Added value from having a uniform environmental management standard that is recognized across the EU
(i.e. more visible than national or local standards, meets environmental requirements across EU)3.01
Meeting environmental reporting obligations (based on national/EU legislation) through EMAS 2.96
Increased customer satisfaction 2.91
Improved relations with private stakeholders (suppliers, competitors, trade associations, markets, etc.) 2.82
Increased marketing opportunities 2.77
Improvement of the quality of products/services offered on the market 2.73
Improved competitive advantage on the domestic market 2.62
Obtaining administrative simplifications and regulatory relief (e.g. longer duration of permits, less frequent
environmental inspections by authorities)2.58
Who says performance is the only
(or main) improvement?
Source: EMAS Evaluation Study, 2015, adelphi
and Sant’Anna School, submitted to DG Env.

EMAS benefits for registered organisations ValueImproved legislative compliance 3.83
Reduced risk of incurring environmental sanctions through improved compliance 3.54
Better identification of overall corporate responsibilities (e.g. clear identification of roles and
responsibilities for managing environmental requirements)3.51
Fewer environmental accidents 3.29
Cost savings through reuse, recycling, or decrease in resource or energy use 3.25
Improved relations with public stakeholders and the local community 3.15
Increased employees involvement and satisfaction 3.09
Consistent environmental management practices (incl. legal compliance check; reporting) worldwide
through EMAS Global3.07
Added value from having a uniform environmental management standard that is recognized across the EU
(i.e. more visible than national or local standards, meets environmental requirements across EU)3.01
Meeting environmental reporting obligations (based on national/EU legislation) through EMAS 2.96
Increased customer satisfaction 2.91
Improved relations with private stakeholders (suppliers, competitors, trade associations, markets, etc.) 2.82
Increased marketing opportunities 2.77
Improvement of the quality of products/services offered on the market 2.73
Improved competitive advantage on the domestic market 2.62
Obtaining administrative simplifications and regulatory relief (e.g. longer duration of permits, less
frequent environmental inspections by authorities)2.58
Who says performance is the only
(or main) improvement?
Source: EMAS Evaluation Study, 2015, adelphi
and Sant’Anna School, submitted to DG Env.

What can public bodies do?
First: exerting their influence.Model 1
Internalization of requirements on
planning
Model 2
Internalization of requirements on
training and employee involvement
Model 3
Internalization of requirements on
operational activities
Coefficient Standard Error Coefficient Standard Error Coefficient Standard Error
Influence of public
authorities
0.043 0.088 -0.024 0.082 0.208** 0.092
Influence of
customers
-0.231** 0.099 -0.005 0.080 -0.293*** 0.104
Influence of suppliers 0.090 0.130 0.224** 0.108 0.189** 0.128
Influence of
shareholders
0.037 0.078 0.159** 0.081 0.180*** 0.082
Influence of banks 0.194** 0.103 0.168** 0.109 0.118** 0.104
Influence of industrial
associations
-0.052* 0.108 -0.110* 0.105 -0.078* 0.105
Influence of
community groups
0.083 0.101 -0.039 0.099 -0.046 0.104
Testa F., Boiral O., Iraldo F., Internalisation of
environmental practices and institutional complexity:
can stakeholders pressures encourage greenwashing?
R&R, Journal of Business Ethics, Springer.
17
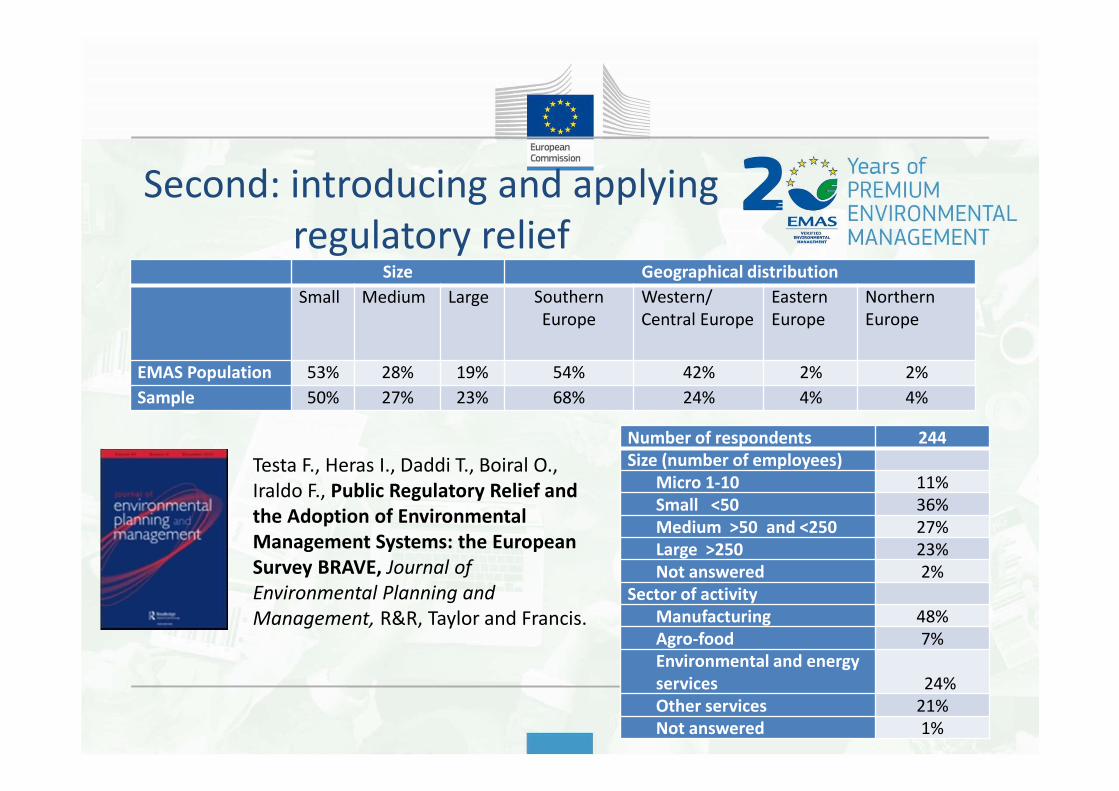
Second: introducing and applying
regulatory reliefSize Geographical distribution
Small Medium Large Southern
Europe
Western/
Central Europe
Eastern
Europe
Northern
Europe
EMAS Population 53% 28% 19% 54% 42% 2% 2%
Sample 50% 27% 23% 68% 24% 4% 4%
Number of respondents 244
Size (number of employees)
Micro 1-10 11%
Small <50 36%
Medium >50 and <250 27%
Large >250 23%
Not answered 2%
Sector of activity
Manufacturing 48%
Agro-food 7%
Environmental and energy
services 24%
Other services 21%
Not answered 1%
Testa F., Heras I., Daddi T., Boiral O.,
Iraldo F., Public Regulatory Relief and
the Adoption of Environmental
Management Systems: the European
Survey BRAVE, Journal of
Environmental Planning and
Management, R&R, Taylor and Francis.

18
Are relief measures and incentives
effective? (% of «users»)Yes No Mean
Co
un
try
Germany 40% 60% 0.400
Italy 50% 50% 0.503
Austria 54% 46% 0.545
Spain 30% 70% 0.296
Follower countries 16% 84% 0.161
Siz
e
Micro 1-10 41% 59% 0.413
Small <50 40% 60% 0.402
Medium >50 and
<25042% 58% 0.424
Large >250 38% 62% 0.385
Se
cto
r
Manufacturing 42% 58% 0.422
Agro-food 18% 82% 0.176
Environmental and
energy services 52% 48% 0.525
Other services 28% 72% 0.280
Total 40% 60% 0.400

19
Yes No Mean
Co
un
try
Germany 40% 60% 0.400
Italy 50% 50% 0.503
Austria 54% 46% 0.545
Spain 30% 70% 0.296
Follower countries 16% 84% 0.161
Siz
e
Micro 1-10 41% 59% 0.413
Small <50 40% 60% 0.402
Medium >50 and
<25042% 58% 0.424
Large >250 38% 62% 0.385
Se
cto
r
Manufacturing 42% 58% 0.422
Agro-food 18% 82% 0.176
Environmental and
energy services 52% 48% 0.525
Other services 28% 72% 0.280
Total 40% 60% 0.400
Are relief measures and incentives
effective? (% of «users»)

20
Which are the
most «used»
measures?

21
Public bodies promoting a public
scheme…

THRESHOLDS ON SIZE
INCREASED TO APPLY
EIA IN LOMBARDY (L.R.
14/2014)
Few practical examples:
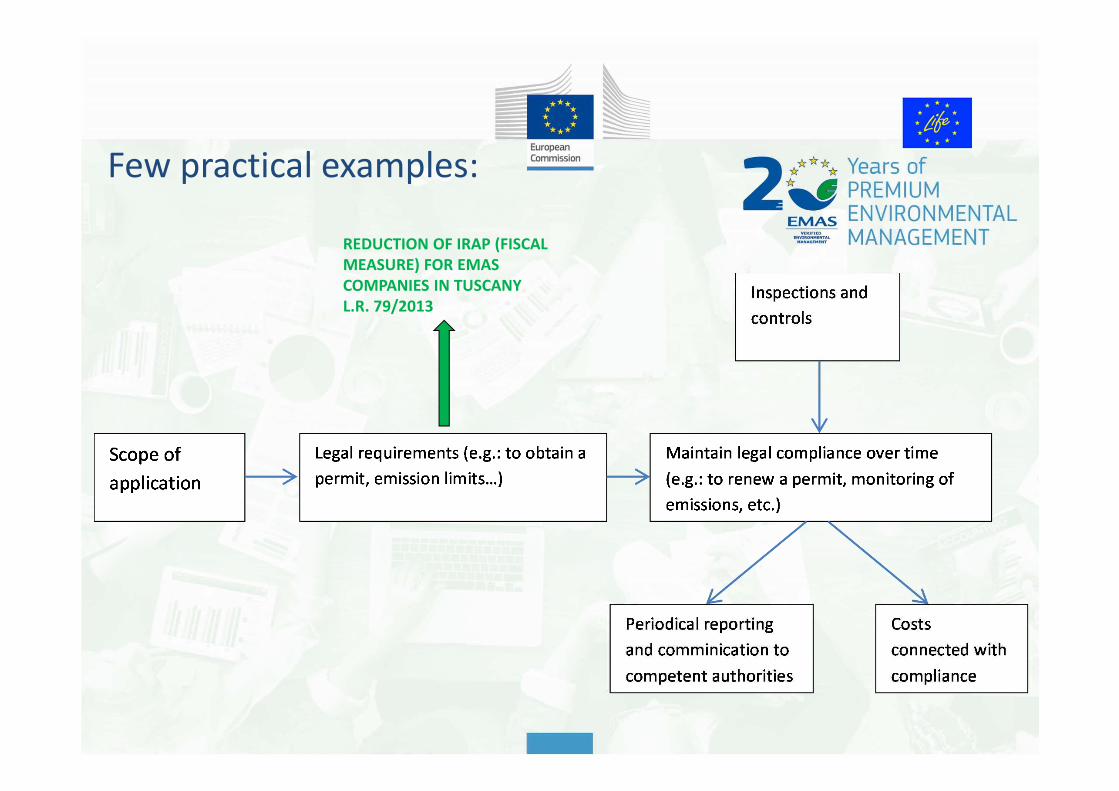
REDUCTION OF IRAP (FISCAL
MEASURE) FOR EMAS
COMPANIES IN TUSCANY
L.R. 79/2013
Few practical examples:

LONGER DURATION OF
PERMITS AND
AUTHORISATIONS IN
TUSCANY L.R. (PdL
356/2014)
Few practical examples:

EMAS COMPANIES SUBJECT
TO CONTROLS AND
INSPECTION WITH A LOWER
FREQUENCY IN LOMBARDY
L.R. 19/2014
Few practical examples:

EMAS STATEMENT AS AN OFFICIAL
SUBSTITUTE FOR REQUESTED
DOCUMENTATION IN LOMBARDY L.R.
19/2014
Few practical examples:

Third: institutional «in-field»
support: does it work?
Environmental aspect
Performance indicator
Lucca cluster performance (2003-2010)
Packaging paper
%
2003 2010
Electricity consumption
kwh/t 486.6 383.3 -21.2
Air emissions kg NOX/t 0.74 0.16 -78.4
Waste water kg BOD/t 0.39 0.09 -76.9
kg COD/t 2.83 0.74 -73.9
Environmental aspect
Performance indicator
CEPI (2004-2010)
2004 2010 %
Electricity consumption
kwh/t 990 1,050 6,07
Air emissions kg NOX/t 0.81 0.85 4,9
Waste water kg BOD/t 1,2 0.89 -25,8
kg COD/t 6.8 6.26 -7,9