Embed Size (px)
Citation preview
Volume 7 • Issue 11 • 1000373J Earth Sci Clim Change, an open access journalISSN: 2157-7617
Research Article Open Access
Potter, J Earth Sci Clim Change 2016, 7:11DOI: 10.4172/2157-7617.1000373
Research Article OMICS International
Journal ofEarth Science & Climatic ChangeJo
urna
l of E
arth Science & Climatic Change
ISSN: 2157-7617
*Corresponding author: Christopher Potter, NASA Ames Research Center, Moffett Field, CA 94035, USA, Tel: 6506046164; E-mail: [email protected]
Received november 04, 2016; Accepted November 16, 2016; Published November 23, 2016
Citation: Potter C (2016) Response of Central California Oak Woodlands to Extreme Drought. J Earth Sci Clim Change 7: 373. doi: 10.4172/2157-7617.1000373
Copyright: © 2016 Potter C. This is an open-access article distributed under the terms of the Creative Commons Attribution License, which permits unrestricted use, distribution, and reproduction in any medium, provided the original author and source are credited.
Keywords: California; Drought; MODIS; Oak woodlands; Precipitation; Shrubland
IntroductionOak woodlands of California provide a wide range of societal values
and ecosystem services, including forage for livestock, wildlife habitat, recreation, soil conservation, and watershed protection [1]. The future of these ecosystems is threatened by a combination grazing pressure, competition from exotic grasses, wildfire severity, and climate change [2]. Kueppers et al. [3] predicted that by the year 2099 the ranges of California endemic oaks would shrink by over 50% of modern potential range sizes, and would shift northward due to climate warming trends and larger precipitation deficits during the growing season.
The year 2013 was the driest on record in California, with a total of just 30% of average statewide precipitation [4]. The year 2014 was nearly as dry as 2013 on the Central California coast [5]. The geographic areas within the Central California coastal region that were most severely impacted by the 2013 drought included the Carmel River Valley of northern Monterey County. An expanded area of severe vegetation moisture stress was detected by May 2014 in this same watershed [5].
The objective of this study was to assess the impacts of the historic 2013-2015 drought period on oak woodland ecosystems of the Carmel River drainage in central California using a combination of satellite image analysis and in situ measurements of soil moisture. The novel study approach incorporated more than 15 years of satellite image data (starting in the year 2000) in correlations with precipitation records to understand variations in canopy cover of different oak woodland communities, shrublands, and grasslands [6].
Study Area DescriptionClimate of the Carmel River basin located near Monterey, California
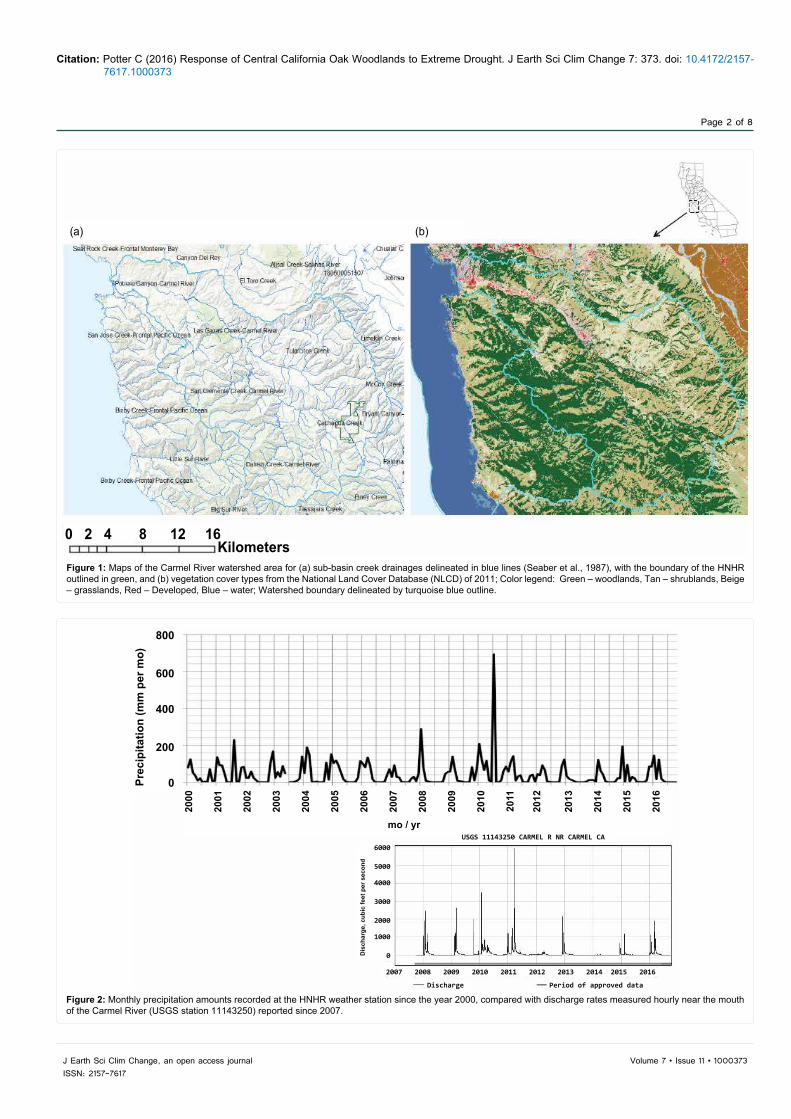
(Figure 1a) is Mediterranean, with the majority of annual precipitation falling from October to May, and late summer air temperatures regularly reaching 38° C (over 100° F). Precipitation over the past two decades has been highly variable in the upper Carmel River basin, ranging from a high of 690 mm in the water year (October to May) ending 2010 to a low of 267 mm in 2014 (Figure 2a). The mean annual rainfall total since the year 2000 has been 460 mm, an amount that was approximately reached only in the years 2008 and 2016. Other extreme dry years, during which the rainfall totals were greater than 1 standard
deviation below annual mean total, were 2007, 2012, 2013, and 2014. Discharge rates measured hourly near the mouth of the Carmel River reflected monthly rainfall amounts (Figure 2b), with the exception of the water years 2012 and 2014, during which flow rates remained near zero on the vast majority of days.
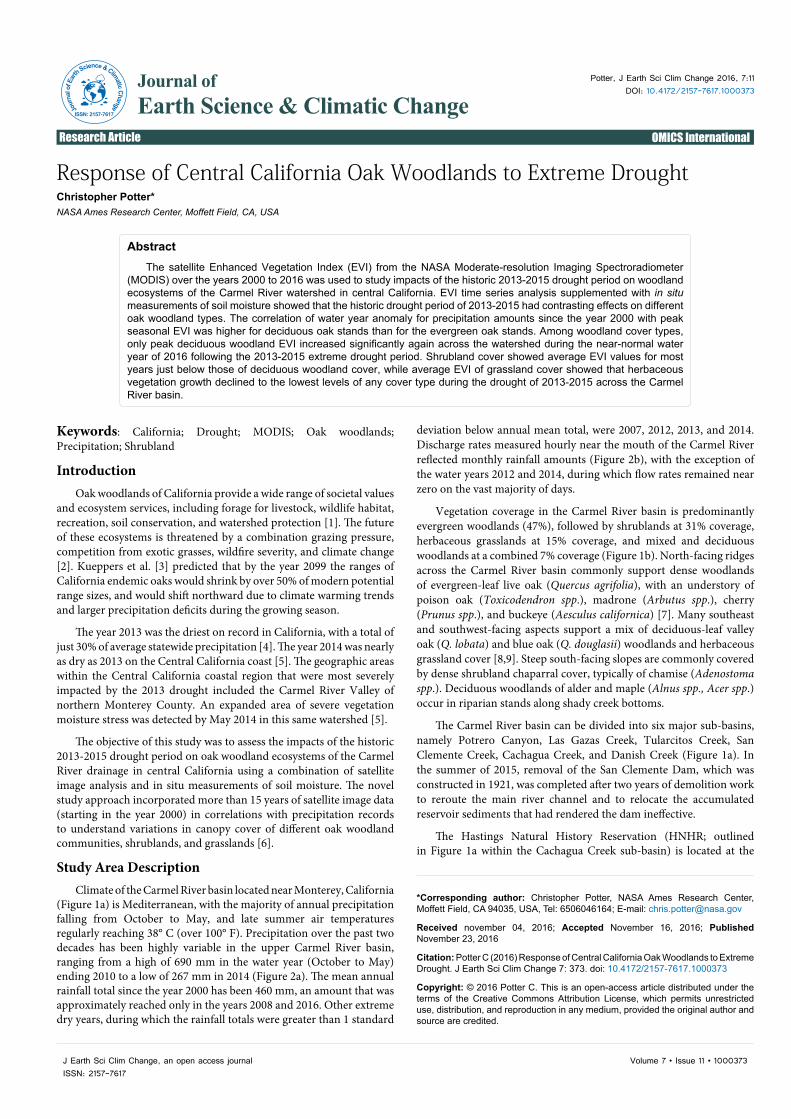
Vegetation coverage in the Carmel River basin is predominantly evergreen woodlands (47%), followed by shrublands at 31% coverage, herbaceous grasslands at 15% coverage, and mixed and deciduous woodlands at a combined 7% coverage (Figure 1b). North-facing ridges across the Carmel River basin commonly support dense woodlands of evergreen-leaf live oak (Quercus agrifolia), with an understory of poison oak (Toxicodendron spp.), madrone (Arbutus spp.), cherry (Prunus spp.), and buckeye (Aesculus californica) [7]. Many southeast and southwest-facing aspects support a mix of deciduous-leaf valley oak (Q. lobata) and blue oak (Q. douglasii) woodlands and herbaceous grassland cover [8,9]. Steep south-facing slopes are commonly covered by dense shrubland chaparral cover, typically of chamise (Adenostoma spp.). Deciduous woodlands of alder and maple (Alnus spp., Acer spp.) occur in riparian stands along shady creek bottoms.
The Carmel River basin can be divided into six major sub-basins, namely Potrero Canyon, Las Gazas Creek, Tularcitos Creek, San Clemente Creek, Cachagua Creek, and Danish Creek (Figure 1a). In the summer of 2015, removal of the San Clemente Dam, which was constructed in 1921, was completed after two years of demolition work to reroute the main river channel and to relocate the accumulated reservoir sediments that had rendered the dam ineffective.
The Hastings Natural History Reservation (HNHR; outlined in Figure 1a within the Cachagua Creek sub-basin) is located at the
Response of Central California Oak Woodlands to Extreme DroughtChristopher Potter*NASA Ames Research Center, Moffett Field, CA, USA
AbstractThe satellite Enhanced Vegetation Index (EVI) from the NASA Moderate-resolution Imaging Spectroradiometer
(MODIS) over the years 2000 to 2016 was used to study impacts of the historic 2013-2015 drought period on woodland ecosystems of the Carmel River watershed in central California. EVI time series analysis supplemented with in situ measurements of soil moisture showed that the historic drought period of 2013-2015 had contrasting effects on different oak woodland types. The correlation of water year anomaly for precipitation amounts since the year 2000 with peak seasonal EVI was higher for deciduous oak stands than for the evergreen oak stands. Among woodland cover types, only peak deciduous woodland EVI increased significantly again across the watershed during the near-normal water year of 2016 following the 2013-2015 extreme drought period. Shrubland cover showed average EVI values for most years just below those of deciduous woodland cover, while average EVI of grassland cover showed that herbaceous vegetation growth declined to the lowest levels of any cover type during the drought of 2013-2015 across the Carmel River basin.
Citation: Potter C (2016) Response of Central California Oak Woodlands to Extreme Drought. J Earth Sci Clim Change 7: 373. doi: 10.4172/2157-7617.1000373
Page 2 of 8
Volume 7 • Issue 11 • 1000373J Earth Sci Clim Change, an open access journalISSN: 2157-7617
(a)
0 2 4 8 12 16Kilometers
(b)
Figure 1: Maps of the Carmel River watershed area for (a) sub-basin creek drainages delineated in blue lines (Seaber et al., 1987), with the boundary of the HNHR outlined in green, and (b) vegetation cover types from the National Land Cover Database (NLCD) of 2011; Color legend: Green – woodlands, Tan – shrublands, Beige – grasslands, Red – Developed, Blue – water; Watershed boundary delineated by turquoise blue outline.
800
600
400
200
0
2000
2001
2002
2003
2004
2005
2006
2007
2008
2009
2010
2011
2012
2013
2014
2015
2016
mo / yr
6000
5000
4000
3000
2000
1000
0
2007 2008 2009 2010 2011 2012 2013 2014 2015 2016
Discharge
USGS 11143250 CARMEL R NR CARMEL CA
Period of approved data
Dis
char
ge, c
ubic
feet
per
sec
ond
Prec
ipita
tion
(mm
per
mo)
Figure 2: Monthly precipitation amounts recorded at the HNHR weather station since the year 2000, compared with discharge rates measured hourly near the mouth of the Carmel River (USGS station 11143250) reported since 2007.
Citation: Potter C (2016) Response of Central California Oak Woodlands to Extreme Drought. J Earth Sci Clim Change 7: 373. doi: 10.4172/2157-7617.1000373
Page 3 of 8
Volume 7 • Issue 11 • 1000373J Earth Sci Clim Change, an open access journalISSN: 2157-7617
Soil moisture monitoring
Volumetric water content (VWC) of oak woodland soils at the HNHR was monitored under four large oak trees using EC-5 frequency domain probes (Decagon Devices Inc.) placed at soil depths of 10 cm and 30 cm (and one tree with a sensor at 50 cm depth) for hourly measurements of VWC during the 2013-2016 period. Hourly soil water potential and soil temperature was measured at 10 cm depth with MPS-2 dielectric sensors (Decagon Devices Inc.). Decagon Devices EM-50 data-loggers were programmed to collect continuous hourly data.
Once a season (wet and dry) during the field study period, mid-day spatial measurements of surface soil VWC to 3.8 cm depth were made using a FieldScout 300 Soil Moisture Meter (Spectrum Technologies, Inc.). At each oak tree sampled, five VWC measurements were taken per date, starting closest to the canopy center, then at the middle, at the canopy edge, and at 1-m and 2-m distance from the canopy edge in open grass cover. A total of six oak trees were sampled for soil moisture variations, out of many oaks tagged and numbered in 1980 as part of a long-term study of acorn production and oak water use [7].
ResultsTime Series of MODIS EVI
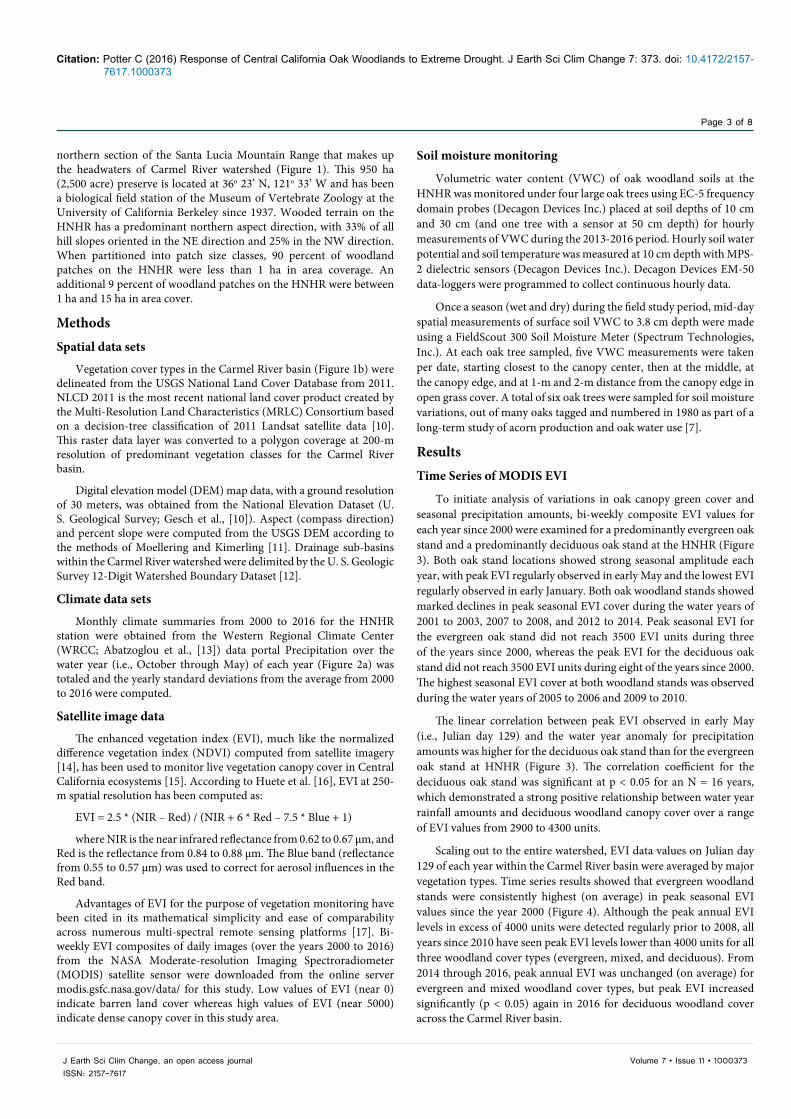
To initiate analysis of variations in oak canopy green cover and seasonal precipitation amounts, bi-weekly composite EVI values for each year since 2000 were examined for a predominantly evergreen oak stand and a predominantly deciduous oak stand at the HNHR (Figure 3). Both oak stand locations showed strong seasonal amplitude each year, with peak EVI regularly observed in early May and the lowest EVI regularly observed in early January. Both oak woodland stands showed marked declines in peak seasonal EVI cover during the water years of 2001 to 2003, 2007 to 2008, and 2012 to 2014. Peak seasonal EVI for the evergreen oak stand did not reach 3500 EVI units during three of the years since 2000, whereas the peak EVI for the deciduous oak stand did not reach 3500 EVI units during eight of the years since 2000. The highest seasonal EVI cover at both woodland stands was observed during the water years of 2005 to 2006 and 2009 to 2010.
The linear correlation between peak EVI observed in early May (i.e., Julian day 129) and the water year anomaly for precipitation amounts was higher for the deciduous oak stand than for the evergreen oak stand at HNHR (Figure 3). The correlation coefficient for the deciduous oak stand was significant at p < 0.05 for an N = 16 years, which demonstrated a strong positive relationship between water year rainfall amounts and deciduous woodland canopy cover over a range of EVI values from 2900 to 4300 units.
Scaling out to the entire watershed, EVI data values on Julian day 129 of each year within the Carmel River basin were averaged by major vegetation types. Time series results showed that evergreen woodland stands were consistently highest (on average) in peak seasonal EVI values since the year 2000 (Figure 4). Although the peak annual EVI levels in excess of 4000 units were detected regularly prior to 2008, all years since 2010 have seen peak EVI levels lower than 4000 units for all three woodland cover types (evergreen, mixed, and deciduous). From 2014 through 2016, peak annual EVI was unchanged (on average) for evergreen and mixed woodland cover types, but peak EVI increased significantly (p < 0.05) again in 2016 for deciduous woodland cover across the Carmel River basin.
northern section of the Santa Lucia Mountain Range that makes up the headwaters of Carmel River watershed (Figure 1). This 950 ha (2,500 acre) preserve is located at 36o 23’ N, 121o 33’ W and has been a biological field station of the Museum of Vertebrate Zoology at the University of California Berkeley since 1937. Wooded terrain on the HNHR has a predominant northern aspect direction, with 33% of all hill slopes oriented in the NE direction and 25% in the NW direction. When partitioned into patch size classes, 90 percent of woodland patches on the HNHR were less than 1 ha in area coverage. An additional 9 percent of woodland patches on the HNHR were between 1 ha and 15 ha in area cover.
MethodsSpatial data sets
Vegetation cover types in the Carmel River basin (Figure 1b) were delineated from the USGS National Land Cover Database from 2011. NLCD 2011 is the most recent national land cover product created by the Multi-Resolution Land Characteristics (MRLC) Consortium based on a decision-tree classification of 2011 Landsat satellite data [10]. This raster data layer was converted to a polygon coverage at 200-m resolution of predominant vegetation classes for the Carmel River basin.
Digital elevation model (DEM) map data, with a ground resolution of 30 meters, was obtained from the National Elevation Dataset (U. S. Geological Survey; Gesch et al., [10]). Aspect (compass direction) and percent slope were computed from the USGS DEM according to the methods of Moellering and Kimerling [11]. Drainage sub-basins within the Carmel River watershed were delimited by the U. S. Geologic Survey 12-Digit Watershed Boundary Dataset [12].
Climate data sets
Monthly climate summaries from 2000 to 2016 for the HNHR station were obtained from the Western Regional Climate Center (WRCC; Abatzoglou et al., [13]) data portal Precipitation over the water year (i.e., October through May) of each year (Figure 2a) was totaled and the yearly standard deviations from the average from 2000 to 2016 were computed.
Satellite image data
The enhanced vegetation index (EVI), much like the normalized difference vegetation index (NDVI) computed from satellite imagery [14], has been used to monitor live vegetation canopy cover in Central California ecosystems [15]. According to Huete et al. [16], EVI at 250-m spatial resolution has been computed as:
EVI = 2.5 * (NIR – Red) / (NIR + 6 * Red – 7.5 * Blue + 1)
where NIR is the near infrared reflectance from 0.62 to 0.67 μm, and Red is the reflectance from 0.84 to 0.88 μm. The Blue band (reflectance from 0.55 to 0.57 μm) was used to correct for aerosol influences in the Red band.
Advantages of EVI for the purpose of vegetation monitoring have been cited in its mathematical simplicity and ease of comparability across numerous multi-spectral remote sensing platforms [17]. Bi-weekly EVI composites of daily images (over the years 2000 to 2016) from the NASA Moderate-resolution Imaging Spectroradiometer (MODIS) satellite sensor were downloaded from the online server modis.gsfc.nasa.gov/data/ for this study. Low values of EVI (near 0) indicate barren land cover whereas high values of EVI (near 5000) indicate dense canopy cover in this study area.
Citation: Potter C (2016) Response of Central California Oak Woodlands to Extreme Drought. J Earth Sci Clim Change 7: 373. doi: 10.4172/2157-7617.1000373
Page 4 of 8
Volume 7 • Issue 11 • 1000373J Earth Sci Clim Change, an open access journalISSN: 2157-7617
Since the year 2000, EVI patterns for shrubland cover (Figure 4) tracked just below average EVI values each year for deciduous woodland cover, with the exceptions of the years 2009 and 2013, when peak EVI for shrublands declined while peak EVI for deciduous woodland increased significantly (p < 0.05) from the previous year. EVI patterns for grassland cover showed that average annual growth has remained below 3000 EVI units since the year 2011 across the Carmel River basin, and in 2015 reached its lowest overall average level during the past decade and a half. Peak EVI in 2016 increased significantly
(p < 0.05) from average 2015 levels for both shrubland and grassland cover types.
Watershed Mapping of MODIS EVI
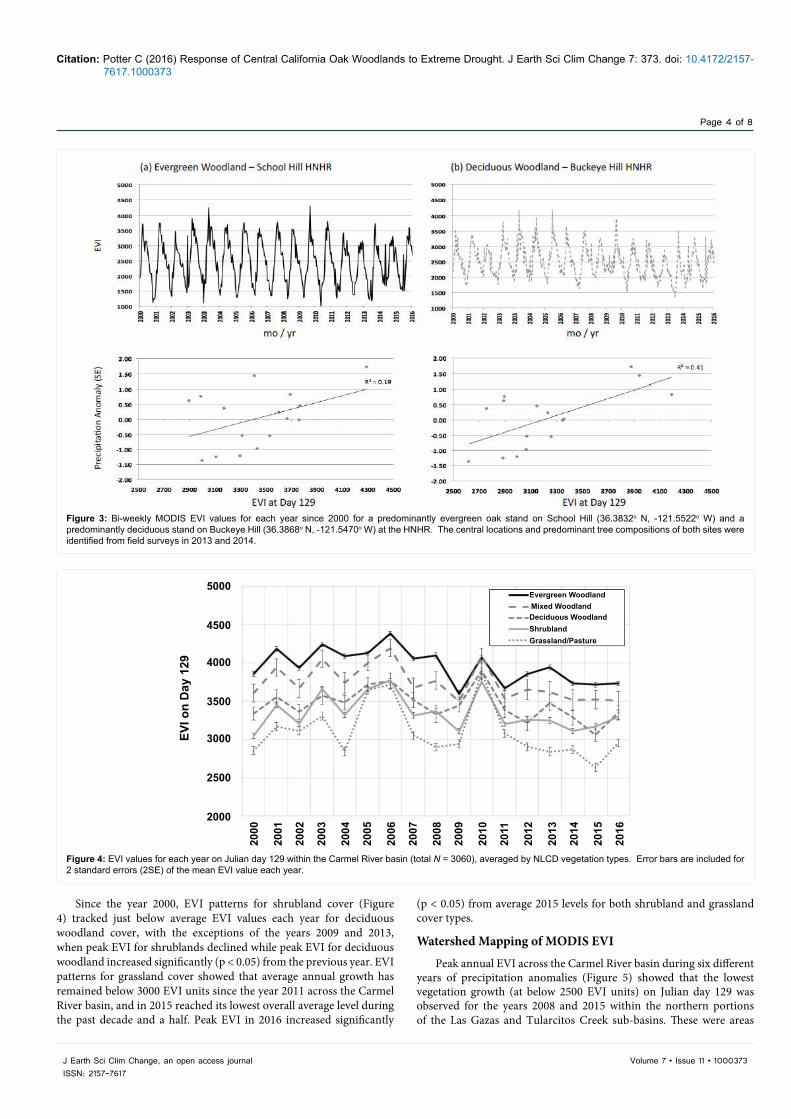
Peak annual EVI across the Carmel River basin during six different years of precipitation anomalies (Figure 5) showed that the lowest vegetation growth (at below 2500 EVI units) on Julian day 129 was observed for the years 2008 and 2015 within the northern portions of the Las Gazas and Tularcitos Creek sub-basins. These were areas
Figure 3: Bi-weekly MODIS EVI values for each year since 2000 for a predominantly evergreen oak stand on School Hill (36.3832o N, -121.5522o W) and a predominantly deciduous stand on Buckeye Hill (36.3868o N, -121.5470o W) at the HNHR. The central locations and predominant tree compositions of both sites were identified from field surveys in 2013 and 2014.
5000
4500
4000
3500
3000
2500
2000
Evergreen WoodlandMixed WoodlandDeciduous WoodlandShrublandGrassland/Pasture
2000
2001
2002
2003
2004
2005
2006
2007
2008
2009
2010
2011
2012
2013
2014
2015
2016
EVI o
n D
ay 1
29
Figure 4: EVI values for each year on Julian day 129 within the Carmel River basin (total N = 3060), averaged by NLCD vegetation types. Error bars are included for 2 standard errors (2SE) of the mean EVI value each year.
Citation: Potter C (2016) Response of Central California Oak Woodlands to Extreme Drought. J Earth Sci Clim Change 7: 373. doi: 10.4172/2157-7617.1000373
Page 5 of 8
Volume 7 • Issue 11 • 1000373J Earth Sci Clim Change, an open access journalISSN: 2157-7617
covered by a mix of sparse shrubland and grassland vegetation. Non-woodland areas of these sub-basins showed notably higher peak growth (in excess of 3200 EVI units) in the years 2005 and 2010.
The highest oak woodland canopy cover, regularly exceeding 5000 EVI units, was observed during all years on the western margins of the upper San Clemente Creek sub-basin, generally above 700-m elevation. These woodlands surrounding Mount Carmel and Devils Peak (near 1250-m elevation) in upper Carmel River basin remained unchanged in EVI levels even during the low rainfall years of 2002 and 2015 (Figure 5).
Peak annual EVI cover for oak woodlands in the southern portion of the HNHR varied between 3900 and 4300 EVI units since the year 2000. The lowest EVI in early May of each year was detected in 2002, 2014, and 2015 in woodlands of the HNHR. From 2015 to 2016, peak EVI typically increased in woodlands of the HNHR by only about 5% (200 EVI units).
Soil moisture variations
To better understand observed changes in woodland EVI since 2013, soil volumetric water content (VWC) measured under oak trees
2002 2005 2008
2010
0 2 4 8 12 16
0 3000 6000Kilometers
2015 2016
Figure 5: Maps of EVI at 250-m resolution on Julian day 129 for selected years across the Carmel River basin (outlined by the turquoise blue line). The boundary of the HNHR is outlined in green.
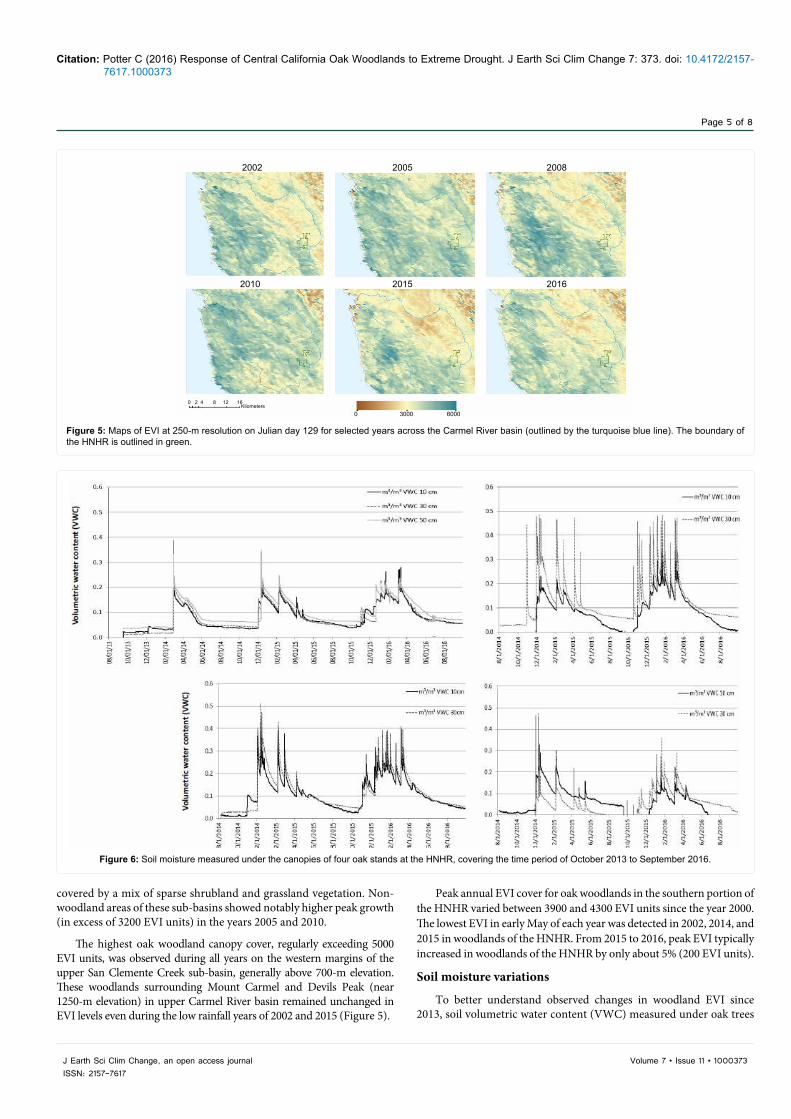
Figure 6: Soil moisture measured under the canopies of four oak stands at the HNHR, covering the time period of October 2013 to September 2016.
Citation: Potter C (2016) Response of Central California Oak Woodlands to Extreme Drought. J Earth Sci Clim Change 7: 373. doi: 10.4172/2157-7617.1000373
Page 6 of 8
Volume 7 • Issue 11 • 1000373J Earth Sci Clim Change, an open access journalISSN: 2157-7617
at the HNHR since September 2013 showed a long period of extreme dry conditions lasting until February 2014 (Figure 6). Surface soils then dried out quickly again after May 2014 to near detection levels at three
depths (10 cm, 30 cm, and 50 cm). Soil VWC sensors at the HNHR showed only two major soil wetting events between November 2013 and the end of April 2014.
24
20
16
12
8
4
0Center
Canopy location
Mid Edge 1-m 2-m
Dry season dates
Wet season dates
9/21/2014
3/6/2015
9/30/2015
2/9/2016
VWC
(per
cent
)
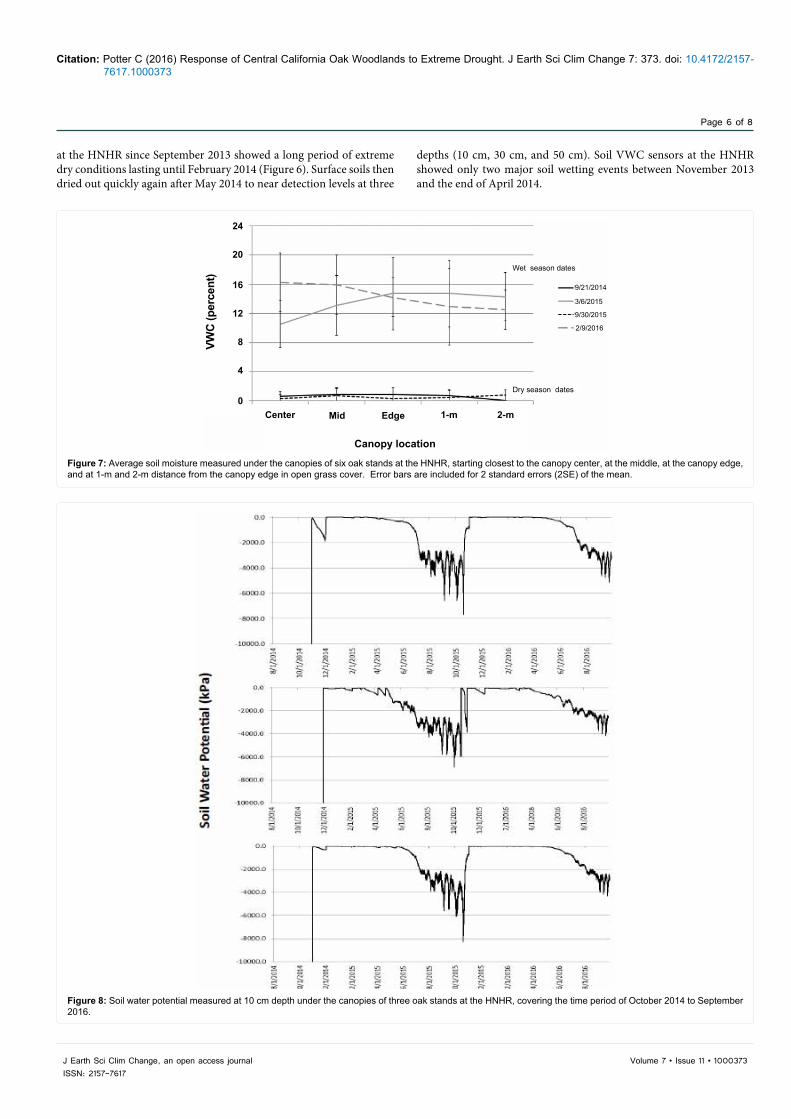
Figure 7: Average soil moisture measured under the canopies of six oak stands at the HNHR, starting closest to the canopy center, at the middle, at the canopy edge, and at 1-m and 2-m distance from the canopy edge in open grass cover. Error bars are included for 2 standard errors (2SE) of the mean.
Figure 8: Soil water potential measured at 10 cm depth under the canopies of three oak stands at the HNHR, covering the time period of October 2014 to September 2016.
Citation: Potter C (2016) Response of Central California Oak Woodlands to Extreme Drought. J Earth Sci Clim Change 7: 373. doi: 10.4172/2157-7617.1000373
Page 7 of 8
Volume 7 • Issue 11 • 1000373J Earth Sci Clim Change, an open access journalISSN: 2157-7617
Between November 2014 and the end of April 2015, all VWC sensors under oak trees at the HNHR showed only three major rainfall wetting events (Figure 6). Soil water levels rarely reached 0.2 m3 m-3 VWC throughout the water year of 2014-2015. In contrast, between November 2015 and the end of April 2016, the VWC sensors under oak trees recorded 6-8 major rainfall wetting events that maintained soil water levels near 0.2 m3 m-3 VWC throughout the water year 2015-2016 period.
As expected, VWC sensors closer to the soil surface (at 10-cm depth) dried out the most rapidly at every oak tree site on the HNHR (Figure 6). However, the spatial pattern of VWC from the canopy center to 2-m outside the oak tree edge showed no significant variations with distance from the center tree bole, either during wet season (February-March) dates or during dry season (September) dates (Figure 7).
Soil water potential levels at 10-cm depth (Figure 8) of between –33 kPa (field capacity) and –9 kPa (saturation) from November to May each year began to decline to below –2000 kPa (wilting point; Saxton and Rawls, [18]) by early June of each year. By the end of the water year (September) of 2015, soil water potential levels had declined to below –6000 kPa. In contrast, at end of the water year of 2016, soil water potential levels had declined to just under –4000 kPa.
DiscussionAnalysis of more than 15 years of MODIS vegetation cover data
(EVI) across the entire wooded landscape of the Carmel River drainage verified site-specific results from hill slopes on the HNHR in the upper watershed that peak annual growth of deciduous oak stands is more strongly controlled by variations in annual precipitation than is annual growth in evergreen oak stands. The four consecutive water years of 2012 to 2015 were all well below-average in terms of rainfall at the HNHR, constituting an extreme drought period. Only about 60% of average precipitation amounts were recorded during the water years of 2013 and 2014 at the location. Although the water year of 2016 saw a return to the long-term average rainfall total of about 460 mm, peak annual EVI in 2016 was unchanged from 2015 (on average) for evergreen and mixed woodland cover types in the Carmel River basin. Among forested cover types, only peak deciduous woodland EVI increased significantly again during the near-normal water year of 2016 following the 2012-2015 drought period across the watershed.
Soil moisture measurements under oaks in the upper watershed showed that the water years of 2014 and 2015 offered fewer wetting events to recharge soil moisture levels than did the water year of 2016. According to MODIS EVI observations, deciduous oak stands recovered a significant fraction of foliage density in 2016 in response to more consistently high soil water content for the months of May and June of that year, whereas evergreen oaks were less responsive (in terms of EVI) to the drought period of 2013-2015 and to higher soil moisture availability in 2016. It may take several years of above-average rainfall in the Carmel Valley for evergreen oaks to recover full canopy cover to typical pre-2013 levels.
Previous studies have shown that mature oak trees can tap into deep groundwater sources during periods of water shortage [19,20]. During the dry summer months in California, tree water demand exceeds surface soil water supply, so that groundwater sources start to be tapped by mature oak roots. At night, some of that water from the shallow aquifer can be transferred into root-associated mycorrhizal fungi by the process known as “hydraulic lift” [21]. This process can rehydrate foliage that has dried out during the hot summer days [22].
Deep water lift can influence the plant community around oak trees, sometimes creating herbaceous green rings around the tree canopy visible from a distance, as other small plants growing above the lateral roots of the oak tree are able to use the water lifted up to toward the surface [23].
As oak taproots grow deeper, they may locate fractures in the granite bedrock, and if the granite has weathered sufficiently, hyphae from mycorrhizal fungi may provide a large water source to the deeper-rooted plants [24]. When taproots of young blue oak and coast live oak trees come into contact with dry soils, their roots first expand laterally, whereas the taproot of a valley oak will penetrate deeper into dry soil [25]. This may explain why deciduous valley oaks can establish and grow more frequently in habitats with relatively deep soils.
Even during the lowest rainfall years since 2000 and the extreme drought period of 2013-2015, woodlands of the upper San Clemente Creek sub-basin (mostly above 1000-m elevation) remained largely unchanged, with the highest EVI levels (> 5000 units) in the entire Carmel River watershed. This resiliency of woodland productivity in the face of rainfall deficits might be explained by several factors: (1) local proximity to the headwaters of the upper watershed creeks, which puts these tree stands at the relatively untapped source of groundwater, relative to stands further downstream, (2) regional proximity to the Pacific Ocean’s on-shore flow of moisture from the marine boundary, which can move ashore with sustained summer winds to generate a cooling influence over the Santa Lucia range [26], and (3) a more diverse mix of drought-tolerant tree species than in the lower watershed, including highly developed valley oak-Coulter pine communities in protected locations [27].
In conclusion, satellite image analysis supplemented with in situ measurements of soil moisture showed that the historic drought period of 2013-2015 had different effects on oak woodland types of the Carmel River drainage in central California. Correlations of annual precipitation amounts with variations in canopy cover of different woodland communities indicated that deciduous oak stands had a significant positive relationship with rainfall, whereas evergreen oak stands had a weak positive relationship over the time period of 2000 to 2016. Shrubland cover regularly showed average EVI values each year just below those of deciduous woodland cover, while average EVI of grassland cover showed that herbaceous vegetation growth declined to the lowest levels of any cover type during the drought of 2013-2015 across the Carmel River basin.
Acknowledgements
The author gratefully acknowledges the assistance of Vince Voegeli, Resident Director of the Hastings Natural History Reservation, in field measurements of soil moisture.
References
1. McCreary DD, Tecklin J (2005) Restoring native California oaks on grazed rangelands, In: Dumroese, R. K. Riley, L. E. Landis, T. D., (Tech. Coords.), Proc. RMRS-P-35., U. S. Department of Agriculture Forest Service, Rocky Mountain Research Station. Fort Collins, CO.
2. Koenig WD, Knops JMH (2007) Long-term growth and persistence of blue oak (Quercus douglasii) seedlings in a California oak savanna, Madroño 54: 269-274.
3. Kueppers LM, Snyder MA, Sloan LC, Zavaleta ES, Fulfrost B (2005) Modeled regional climate change and California endemic oak ranges. Proc Natl Acad Sci USA 102: 16281-16286.
4. Hanak E, Mount J, Chappelle C (2014) California’s latest drought, Public Policy Institute of California.
5. Potter CS (2015) Assessment of the immediate impacts of the 2013-2014

Citation: Potter C (2016) Response of Central California Oak Woodlands to Extreme Drought. J Earth Sci Clim Change 7: 373. doi: 10.4172/2157-7617.1000373
Page 8 of 8
Volume 7 • Issue 11 • 1000373J Earth Sci Clim Change, an open access journalISSN: 2157-7617
drought on ecosystems of the California Central Coast. Western North Am Naturalist 75: 129-145.
6. Stromberg MR (2009) Oak woodland in Monterey County. University of California Hastings Reserve, Carmel Valley, CA, 28 pp.
7. Knops JMH, Koenig WD (1994) Water use strategies of five sympatric oaks in central coastal California. Madroño 41: 290-301.
8. Pearse IS, Griswold S, Pizarro D, Koenig WD (2014) Stage and size structure of three species of oaks in central coastal California. Madroño 61: 1-8.
9. Homer CG, Dewitz JA, Yang L, Jin S, Danielson P, et al. (2015) Completion of the 2011 National land cover database for the conterminous USA - Representing a decade of land cover change information. Photogrammetric Eng and Remote Sensing 81: 345-354.
10. Gesch D, Oimoen M, Greenlee S, Nelson C, Steuck M, et al. (2002) The national elevation dataset. Photogrammetric Eng & Remote Sensing 68: 5-11.
11. Moellering H, Kimerling AJ (1990) A new digital slope-aspect display process. Cartography and Geographic Information Systems 17: 151-159.
12. Seaber PR, Kapinos FP, Knapp GL (1987) Hydrologic Unit Maps: U.S. Geological Survey Water-Supply Paper 2294, 63 pp.
13. Abatzoglou JT, Redmond KT, Edwards LM (2009) Classification of regional climate variability in the state of California. J Appl Meteorol Climatol 48: 1527-1541.
14. Wagtendonk-Van JW, Root RR (2003) The use of multi-temporal Landsat Normalized Difference Vegetation Index (NDVI) data for mapping fuel models in Yosemite National Park, USA, Int J Rem Sens 24: 1639-1651.
15. Potter CS (2014) Monitoring the production of Central California coastal rangelands using satellite remote sensing. J Coastal Conservation 18: 213-220.
16. Huete A, Didan K, Miura T, Rodriguez E (2002) Overview of the radiometric and biophysical performance of the MODIS vegetation indices. Remote Sens Environ 83: 195-213.
17. Lentile L, Holden A, Smith A, Falkowski M, Hudak A, et al. (2006) Remote sensing techniques to assess active fire characteristics and post-fire effects. Int J Wildland Fire 15: 319-345.
18. Saxton KE, Rawls WJ (2006) Soil water characteristic estimates by texture and organic matter for hydrologic solutions. Soil Sci Soc Am J 70: 1569-1578.
19. Kitajima K, Allen MF, Goulden ML (2013) Contribution of hydraulically lifted deep moisture to the water budget in a southern California mixed forest. J Geophysical Research- Biogeosciences 118: 1561-1572.
20. Allen MF (2014) How oaks respond to water limitation, Proceedings of the 7th California Oak Symposium: Managing oak woodlands in a Dynamic World, General Technical Report PSW-GTR-251, Albany, CA: Pacific Southwest Research Station, Forest Service, U.S. Department of Agriculture. 9 pp.
21. Querejeta J, Egerton-Warburton LM, Allen MF (2003) Direct nocturnal water transfer from oaks to their mycorrhizal symbionts during severe soil drying. Oecologia 134: 55-64.
22. Fisher JB, Baldocchi DD, Misson L, Dawson TE, Goldstein AH (2007) What the towers don't see at night: nocturnal sap flow in trees and shrubs at two AmeriFlux sites in California, Tree Physiol 27: 597-610.
23. Caldwell MM, Dawson TE, Richards JH (1998) Hydraulic lift: Consequences of water efflux from the roots of plants. Oecologia 113: 151-161.
24. Bornyasz MA, Graham R, Allen MF (2005) Ectomycorrhizae in a soil-weathered granitic bedrock regolith: linking matrix resources to plants. Geoderma 126: 141-160.
25. Callaway RM (1990) Effects of soil water distribution on the lateral root development of three species of California oaks. Am J Botany 77: 1469-1474.
26. Potter CS (2016) Measurements of fog water interception by shrubs on the California central coast. J Coastal Conservation 4: 315-325.
27. Griffin JR (1975) Plants of the highest Santa Lucia and Diablo Range peaks, California. USDA Forest Service Paper PSW-110. Pacific Southwest Forest and Range Experimental Station, Berkeley. 50 pp.
OMICS International: Open Access Publication Benefits & FeaturesUnique features:
• Increased global visibility of articles through worldwide distribution and indexing• Showcasing recent research output in a timely and updated manner• Special issues on the current trends of scientific research
Special features:
• 700+ Open Access Journals• 50,000+ editorial team• Rapid review process• Quality and quick editorial, review and publication processing• Indexing at major indexing services• Sharing Option: Social Networking Enabled• Authors, Reviewers and Editors rewarded with online Scientific Credits• Better discount for your subsequent articles
Submit your manuscript at: www.omicsonline.org/submission
Citation: Potter C (2016) Response of Central California Oak Woodlands to Extreme Drought. J Earth Sci Clim Change 7: 373. doi: 10.4172/2157-7617.1000373