Embed Size (px)
Citation preview
International Journal of Innovative Research in Advanced Engineering (IJIRAE) ISSN: 2349-2163 Volume 1 Issue 6 (July 2014) http://ijirae.com
_____________________________________________________________________________________________________ © 2014, IJIRAE- All Rights Reserved Page -1
STUDY OF NOISE POLLUTION DURING DEEPAWALI FESTIVAL
ABSTRACT- Noise pollution has been well recognized as one of the pollutions that affect the quality of life in urban areas across the globe. In a city like Mumbai, apart from traffic noise and noise generated due to construction activity, major contributing source is noise produced during festivals. Present study analyses the trend and status of noise generated during an important festival Deepawali festival at different location in Mumbai city for last four years. As per data obtained from Maharashtra Pollution Control Board (MPCB), it is observed that there is no significant decrease in noise level at most of the places in year 2012 as compere to earlier years. At half of the places L(A)eq was well above 75 dB during day time. Keywords- Noise Pollution, Festival, Deepawali, Mumbai, Environmental Engineering
I. INTRODUCTION Noise pollution is a significant environmental problem in many urban areas that has not been properly recognised, despite
the fact that it is steadily growing in developing countries [1]. Noise produces damaging effects among exposed person. It is said, "You may forgive noise but your body will never" [2]. At present, noise pollution is considered as one of the key problems of urban communities that has numerous hazardous effects on the urban environment and may result in a great deal of costs on the society [3]. There is no question that noise is both a public health hazard and an environmental pollutant as well. It is present in every human activity and is classified as either occupational noise i.e. noise in workplace, or as environmental noise, which includes noise in all other settings, whether at community, residential or domestic level when assessing its impact on human well-being [4].
The sources of noise pollution are extremely diverse and they are mainly classified as community noise and industrial noise. During festivals and functions loudspeakers produce a lot of annoying noise. Indian festivals are traditionally celebrated with song and dance in large groups, using musical instruments, drums etc. Bursting of fire crackers during celebrations produce intermittent and high frequency ‘impulse noise’ [5].
Deepawali festival showed an average noise level of 74.24 dB (A), 62.52 dB (A), 58.88 dB (A), and 50.02 dB (A) at industrial, commercial, residential and silent zones respectively. The result showed that there was an enhanced pressure of noise at all sites due to increase in number of vehicles and facilities of transportation. All the sites under study showed higher sound level than the prescribed limits of the Central Pollution Control Board (CPCB) [6].
Noise levels of ten sites were found to be above permissible limit during Deepawali festival weeks in Sangamner city in Maharashtra. The noise level was higher in the morning and evening but lower at noon. Pre-deepawali showed 0.1% to 20.6%, deepawali revealed 2.7% and post-deepawali showed 0.4% to20.3% higher sound level limit. The combination of various types of vehicular noise was found to be minimum 70.2 (0.3% higher) and maximum 90.0 (29% higher). The contributions of individual levels were found to be more than the traffic noise limit of 70dB (A) and varied from vehicle to vehicle [7]. A. About the Study Area There were a total of 45 locations covered during Deepawali festival in Mumbai by MPCB. The detailed list of location is as follows:-
Table 1: List of Monitoring Location (Source: Ref. [8], [9], [10], [11])
Monitoring Location
Mumbai South Mumbai Eastern Suburbs Mumbai Western Suburbs Colaba Chembur (E) Sahar
Mantralaya Trombay Santacruz (E) Mazgaon Kurla Vile Parle Girgaon Ghatkopar East Bandra Worli Ghatkopar West Goregaon
Nitinkumar L. Patel*
M-Tech scholar Veermata Jijabai Technological Institute Mumbai, India
Prashant P. Bhave Associate Professor Veermata Jijabai Technological Institute Mumbai, India
International Journal of Innovative Research in Advanced Engineering (IJIRAE) ISSN: 2349-2163 Volume 1 Issue 6 (July 2014) http://ijirae.com
_____________________________________________________________________________________________________ © 2014, IJIRAE- All Rights Reserved Page -2
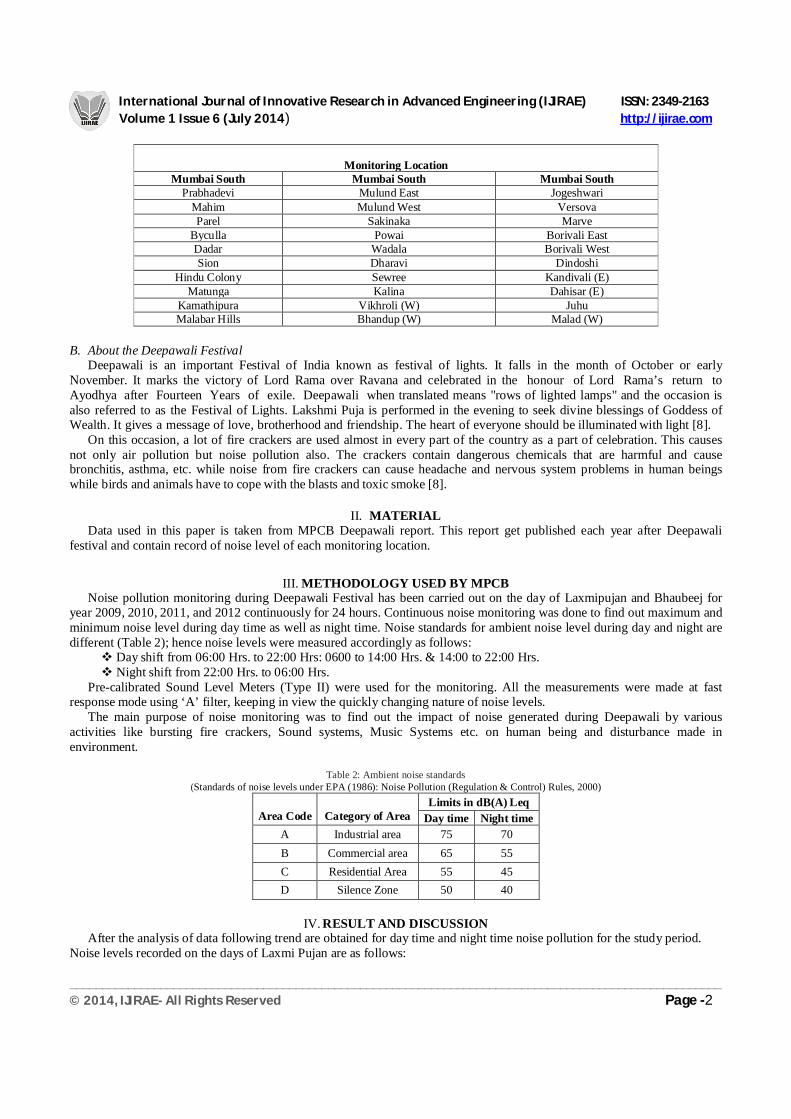
Monitoring Location
Mumbai South Mumbai South Mumbai South Prabhadevi Mulund East Jogeshwari
Mahim Mulund West Versova Parel Sakinaka Marve
Byculla Powai Borivali East Dadar Wadala Borivali West Sion Dharavi Dindoshi
Hindu Colony Sewree Kandivali (E) Matunga Kalina Dahisar (E)
Kamathipura Vikhroli (W) Juhu Malabar Hills Bhandup (W) Malad (W)
B. About the Deepawali Festival
Deepawali is an important Festival of India known as festival of lights. It falls in the month of October or early November. It marks the victory of Lord Rama over Ravana and celebrated in the honour of Lord Rama’s return to Ayodhya after Fourteen Years of exile. Deepawali when translated means "rows of lighted lamps" and the occasion is also referred to as the Festival of Lights. Lakshmi Puja is performed in the evening to seek divine blessings of Goddess of Wealth. It gives a message of love, brotherhood and friendship. The heart of everyone should be illuminated with light [8].
On this occasion, a lot of fire crackers are used almost in every part of the country as a part of celebration. This causes not only air pollution but noise pollution also. The crackers contain dangerous chemicals that are harmful and cause bronchitis, asthma, etc. while noise from fire crackers can cause headache and nervous system problems in human beings while birds and animals have to cope with the blasts and toxic smoke [8].
II. MATERIAL Data used in this paper is taken from MPCB Deepawali report. This report get published each year after Deepawali
festival and contain record of noise level of each monitoring location.
III. METHODOLOGY USED BY MPCB Noise pollution monitoring during Deepawali Festival has been carried out on the day of Laxmipujan and Bhaubeej for
year 2009, 2010, 2011, and 2012 continuously for 24 hours. Continuous noise monitoring was done to find out maximum and minimum noise level during day time as well as night time. Noise standards for ambient noise level during day and night are different (Table 2); hence noise levels were measured accordingly as follows:
Day shift from 06:00 Hrs. to 22:00 Hrs: 0600 to 14:00 Hrs. & 14:00 to 22:00 Hrs. Night shift from 22:00 Hrs. to 06:00 Hrs.
Pre-calibrated Sound Level Meters (Type II) were used for the monitoring. All the measurements were made at fast response mode using ‘A’ filter, keeping in view the quickly changing nature of noise levels.
The main purpose of noise monitoring was to find out the impact of noise generated during Deepawali by various activities like bursting fire crackers, Sound systems, Music Systems etc. on human being and disturbance made in environment.
Table 2: Ambient noise standards (Standards of noise levels under EPA (1986): Noise Pollution (Regulation & Control) Rules, 2000)
Area Code
Category of Area
Limits in dB(A) Leq Day time Night time
A Industrial area 75 70 B Commercial area 65 55 C Residential Area 55 45 D Silence Zone 50 40
IV. RESULT AND DISCUSSION
After the analysis of data following trend are obtained for day time and night time noise pollution for the study period. Noise levels recorded on the days of Laxmi Pujan are as follows:
International Journal of Innovative Research in Advanced Engineering (IJIRAE) ISSN: 2349-2163 Volume 1 Issue 6 (July 2014) http://ijirae.com
_____________________________________________________________________________________________________ © 2014, IJIRAE- All Rights Reserved Page -3
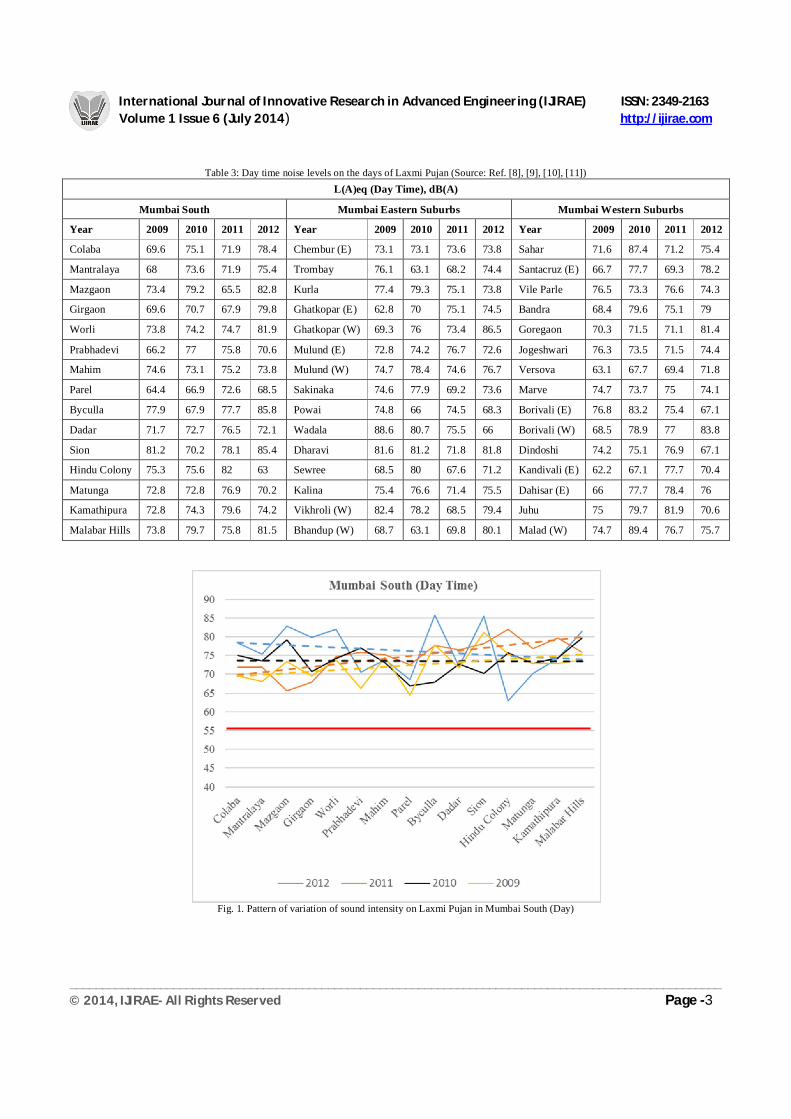
Table 3: Day time noise levels on the days of Laxmi Pujan (Source: Ref. [8], [9], [10], [11])
L(A)eq (Day Time), dB(A)
Mumbai South Mumbai Eastern Suburbs Mumbai Western Suburbs
Year 2009 2010 2011 2012 Year 2009 2010 2011 2012 Year 2009 2010 2011 2012
Colaba 69.6 75.1 71.9 78.4 Chembur (E) 73.1 73.1 73.6 73.8 Sahar 71.6 87.4 71.2 75.4
Mantralaya 68 73.6 71.9 75.4 Trombay 76.1 63.1 68.2 74.4 Santacruz (E) 66.7 77.7 69.3 78.2
Mazgaon 73.4 79.2 65.5 82.8 Kurla 77.4 79.3 75.1 73.8 Vile Parle 76.5 73.3 76.6 74.3
Girgaon 69.6 70.7 67.9 79.8 Ghatkopar (E) 62.8 70 75.1 74.5 Bandra 68.4 79.6 75.1 79
Worli 73.8 74.2 74.7 81.9 Ghatkopar (W) 69.3 76 73.4 86.5 Goregaon 70.3 71.5 71.1 81.4
Prabhadevi 66.2 77 75.8 70.6 Mulund (E) 72.8 74.2 76.7 72.6 Jogeshwari 76.3 73.5 71.5 74.4
Mahim 74.6 73.1 75.2 73.8 Mulund (W) 74.7 78.4 74.6 76.7 Versova 63.1 67.7 69.4 71.8
Parel 64.4 66.9 72.6 68.5 Sakinaka 74.6 77.9 69.2 73.6 Marve 74.7 73.7 75 74.1
Byculla 77.9 67.9 77.7 85.8 Powai 74.8 66 74.5 68.3 Borivali (E) 76.8 83.2 75.4 67.1
Dadar 71.7 72.7 76.5 72.1 Wadala 88.6 80.7 75.5 66 Borivali (W) 68.5 78.9 77 83.8
Sion 81.2 70.2 78.1 85.4 Dharavi 81.6 81.2 71.8 81.8 Dindoshi 74.2 75.1 76.9 67.1
Hindu Colony 75.3 75.6 82 63 Sewree 68.5 80 67.6 71.2 Kandivali (E) 62.2 67.1 77.7 70.4
Matunga 72.8 72.8 76.9 70.2 Kalina 75.4 76.6 71.4 75.5 Dahisar (E) 66 77.7 78.4 76
Kamathipura 72.8 74.3 79.6 74.2 Vikhroli (W) 82.4 78.2 68.5 79.4 Juhu 75 79.7 81.9 70.6
Malabar Hills 73.8 79.7 75.8 81.5 Bhandup (W) 68.7 63.1 69.8 80.1 Malad (W) 74.7 89.4 76.7 75.7
Fig. 1. Pattern of variation of sound intensity on Laxmi Pujan in Mumbai South (Day)

International Journal of Innovative Research in Advanced Engineering (IJIRAE) ISSN: 2349-2163 Volume 1 Issue 6 (July 2014) http://ijirae.com
_____________________________________________________________________________________________________ © 2014, IJIRAE- All Rights Reserved Page -4
Fig. 2. Pattern of variation of sound intensity on Laxmi Pujan in Mumbai Eastern Suburb (Day)
Fig. 3. Pattern of variation of sound intensity on Laxmi Pujan in Mumbai Western Suburb (Day)
International Journal of Innovative Research in Advanced Engineering (IJIRAE) ISSN: 2349-2163 Volume 1 Issue 6 (July 2014) http://ijirae.com
_____________________________________________________________________________________________________ © 2014, IJIRAE- All Rights Reserved Page -5
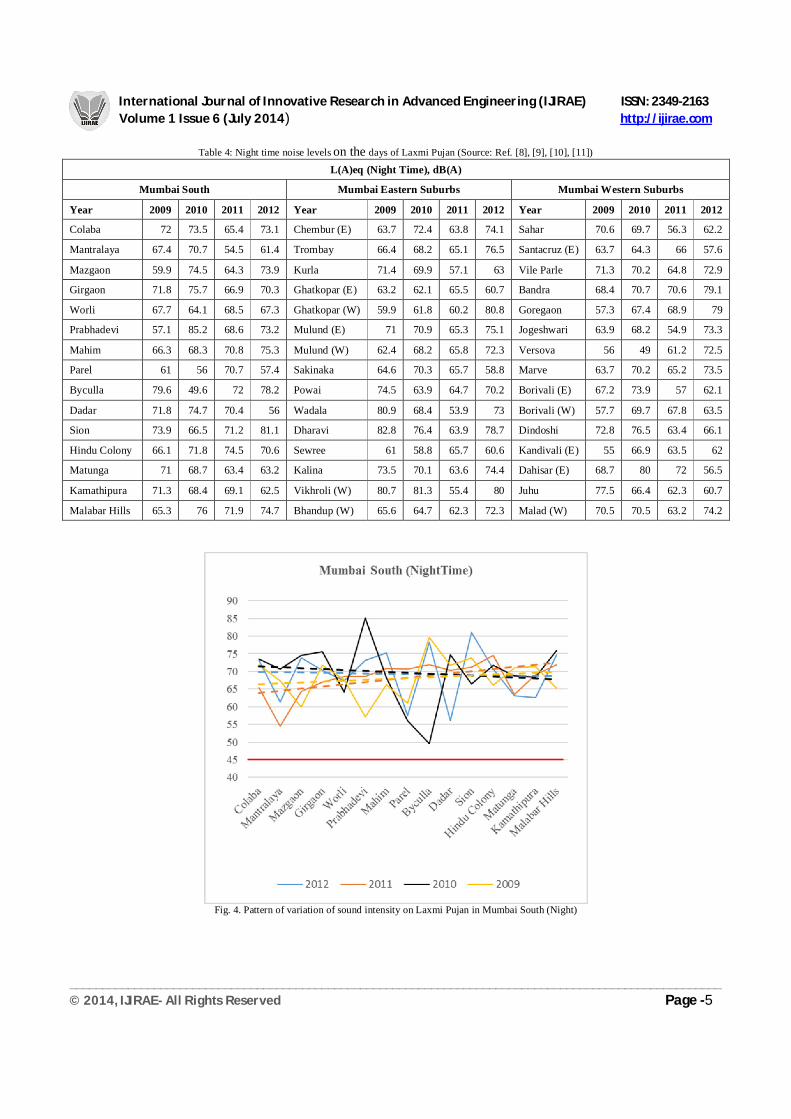
Table 4: Night time noise levels on the days of Laxmi Pujan (Source: Ref. [8], [9], [10], [11])
L(A)eq (Night Time), dB(A)
Mumbai South Mumbai Eastern Suburbs Mumbai Western Suburbs
Year 2009 2010 2011 2012 Year 2009 2010 2011 2012 Year 2009 2010 2011 2012
Colaba 72 73.5 65.4 73.1 Chembur (E) 63.7 72.4 63.8 74.1 Sahar 70.6 69.7 56.3 62.2
Mantralaya 67.4 70.7 54.5 61.4 Trombay 66.4 68.2 65.1 76.5 Santacruz (E) 63.7 64.3 66 57.6
Mazgaon 59.9 74.5 64.3 73.9 Kurla 71.4 69.9 57.1 63 Vile Parle 71.3 70.2 64.8 72.9
Girgaon 71.8 75.7 66.9 70.3 Ghatkopar (E) 63.2 62.1 65.5 60.7 Bandra 68.4 70.7 70.6 79.1
Worli 67.7 64.1 68.5 67.3 Ghatkopar (W) 59.9 61.8 60.2 80.8 Goregaon 57.3 67.4 68.9 79
Prabhadevi 57.1 85.2 68.6 73.2 Mulund (E) 71 70.9 65.3 75.1 Jogeshwari 63.9 68.2 54.9 73.3
Mahim 66.3 68.3 70.8 75.3 Mulund (W) 62.4 68.2 65.8 72.3 Versova 56 49 61.2 72.5
Parel 61 56 70.7 57.4 Sakinaka 64.6 70.3 65.7 58.8 Marve 63.7 70.2 65.2 73.5
Byculla 79.6 49.6 72 78.2 Powai 74.5 63.9 64.7 70.2 Borivali (E) 67.2 73.9 57 62.1
Dadar 71.8 74.7 70.4 56 Wadala 80.9 68.4 53.9 73 Borivali (W) 57.7 69.7 67.8 63.5
Sion 73.9 66.5 71.2 81.1 Dharavi 82.8 76.4 63.9 78.7 Dindoshi 72.8 76.5 63.4 66.1
Hindu Colony 66.1 71.8 74.5 70.6 Sewree 61 58.8 65.7 60.6 Kandivali (E) 55 66.9 63.5 62
Matunga 71 68.7 63.4 63.2 Kalina 73.5 70.1 63.6 74.4 Dahisar (E) 68.7 80 72 56.5
Kamathipura 71.3 68.4 69.1 62.5 Vikhroli (W) 80.7 81.3 55.4 80 Juhu 77.5 66.4 62.3 60.7
Malabar Hills 65.3 76 71.9 74.7 Bhandup (W) 65.6 64.7 62.3 72.3 Malad (W) 70.5 70.5 63.2 74.2
Fig. 4. Pattern of variation of sound intensity on Laxmi Pujan in Mumbai South (Night)

International Journal of Innovative Research in Advanced Engineering (IJIRAE) ISSN: 2349-2163 Volume 1 Issue 6 (July 2014) http://ijirae.com
_____________________________________________________________________________________________________ © 2014, IJIRAE- All Rights Reserved Page -6
Fig. 5. Pattern of variation of sound intensity on Laxmi Pujan in Mumbai Eastern Suburb (Night)
Fig. 6. Pattern of variation of sound intensity on Laxmi Pujan in Mumbai Western Suburb (Night)
International Journal of Innovative Research in Advanced Engineering (IJIRAE) ISSN: 2349-2163 Volume 1 Issue 6 (July 2014) http://ijirae.com
_____________________________________________________________________________________________________ © 2014, IJIRAE- All Rights Reserved Page -7
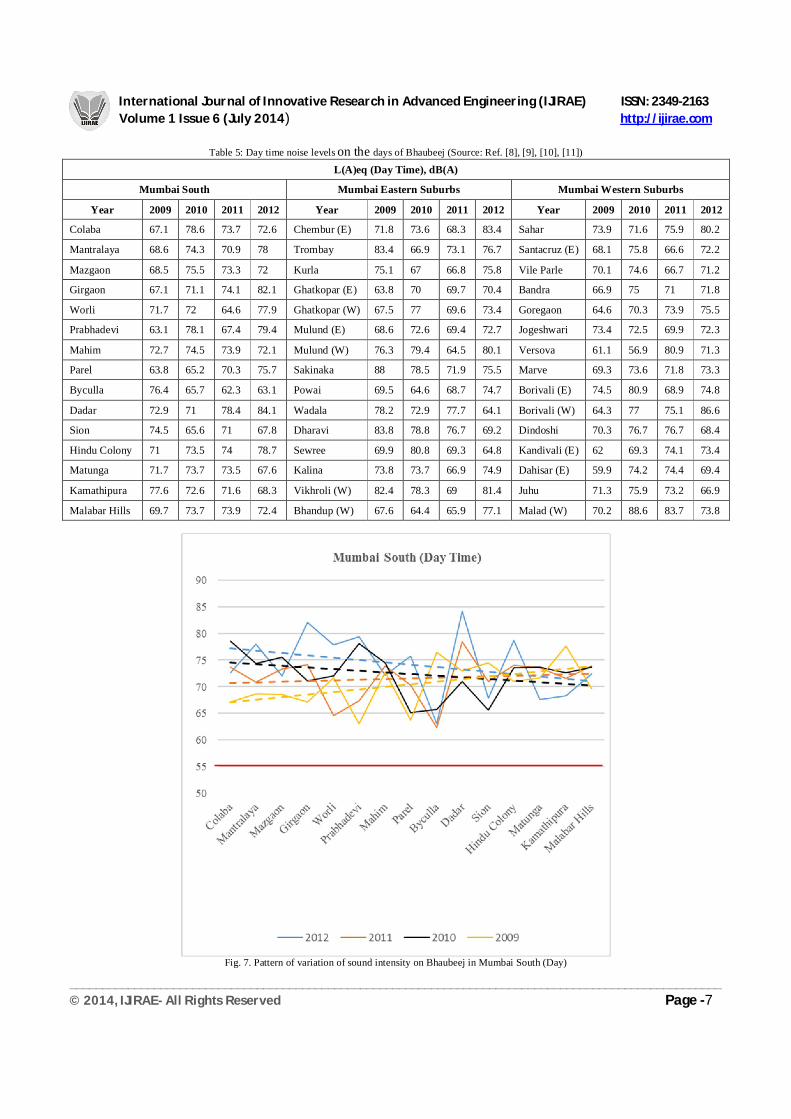
Table 5: Day time noise levels on the days of Bhaubeej (Source: Ref. [8], [9], [10], [11])
L(A)eq (Day Time), dB(A)
Mumbai South Mumbai Eastern Suburbs Mumbai Western Suburbs
Year 2009 2010 2011 2012 Year 2009 2010 2011 2012 Year 2009 2010 2011 2012
Colaba 67.1 78.6 73.7 72.6 Chembur (E) 71.8 73.6 68.3 83.4 Sahar 73.9 71.6 75.9 80.2
Mantralaya 68.6 74.3 70.9 78 Trombay 83.4 66.9 73.1 76.7 Santacruz (E) 68.1 75.8 66.6 72.2
Mazgaon 68.5 75.5 73.3 72 Kurla 75.1 67 66.8 75.8 Vile Parle 70.1 74.6 66.7 71.2
Girgaon 67.1 71.1 74.1 82.1 Ghatkopar (E) 63.8 70 69.7 70.4 Bandra 66.9 75 71 71.8
Worli 71.7 72 64.6 77.9 Ghatkopar (W) 67.5 77 69.6 73.4 Goregaon 64.6 70.3 73.9 75.5
Prabhadevi 63.1 78.1 67.4 79.4 Mulund (E) 68.6 72.6 69.4 72.7 Jogeshwari 73.4 72.5 69.9 72.3
Mahim 72.7 74.5 73.9 72.1 Mulund (W) 76.3 79.4 64.5 80.1 Versova 61.1 56.9 80.9 71.3
Parel 63.8 65.2 70.3 75.7 Sakinaka 88 78.5 71.9 75.5 Marve 69.3 73.6 71.8 73.3
Byculla 76.4 65.7 62.3 63.1 Powai 69.5 64.6 68.7 74.7 Borivali (E) 74.5 80.9 68.9 74.8
Dadar 72.9 71 78.4 84.1 Wadala 78.2 72.9 77.7 64.1 Borivali (W) 64.3 77 75.1 86.6
Sion 74.5 65.6 71 67.8 Dharavi 83.8 78.8 76.7 69.2 Dindoshi 70.3 76.7 76.7 68.4
Hindu Colony 71 73.5 74 78.7 Sewree 69.9 80.8 69.3 64.8 Kandivali (E) 62 69.3 74.1 73.4
Matunga 71.7 73.7 73.5 67.6 Kalina 73.8 73.7 66.9 74.9 Dahisar (E) 59.9 74.2 74.4 69.4
Kamathipura 77.6 72.6 71.6 68.3 Vikhroli (W) 82.4 78.3 69 81.4 Juhu 71.3 75.9 73.2 66.9
Malabar Hills 69.7 73.7 73.9 72.4 Bhandup (W) 67.6 64.4 65.9 77.1 Malad (W) 70.2 88.6 83.7 73.8
Fig. 7. Pattern of variation of sound intensity on Bhaubeej in Mumbai South (Day)

International Journal of Innovative Research in Advanced Engineering (IJIRAE) ISSN: 2349-2163 Volume 1 Issue 6 (July 2014) http://ijirae.com
_____________________________________________________________________________________________________ © 2014, IJIRAE- All Rights Reserved Page -8
Fig. 8. Pattern of variation of sound intensity on Bhaubeej an in Mumbai Eastern Suburb (Day)
Fig. 9. Pattern of variation of sound intensity on Bhaubeej in Mumbai Western Suburb (Day)

International Journal of Innovative Research in Advanced Engineering (IJIRAE) ISSN: 2349-2163 Volume 1 Issue 6 (July 2014) http://ijirae.com
_____________________________________________________________________________________________________ © 2014, IJIRAE- All Rights Reserved Page -9
Table 6: Night time noise levels on the days of Bhaubeej (Source: Ref. [8], [9], [10], [11])
L(A)eq (Night Time), dB(A)
Mumbai South Mumbai Eastern Suburbs Mumbai Western Suburbs
Year 2009 2010 2011 2012 Year 2009 2010 2011 2012 Year 2009 2010 2011 2012
Colaba 66.8 64.3 62.6 79.3 Chembur (E) 70.1 73.5 62.4 67.4 Sahar 69.1 66.6 60.5 61.4
Mantralaya 63.2 72.5 60.8 69.1 Trombay 82.4 71.7 61.5 69.7 Santacruz (E) 63.5 65.7 66.1 56
Mazgaon 62.8 72.8 59.9 71.9 Kurla 69.9 72.7 69.2 75.4 Vile Parle 64.3 70 64.9 55
Girgaon 67.2 72.9 58.6 76.6 Ghatkopar (E) 64.5 58.6 65.5 64.2 Bandra 67.3 65.6 47.7 57.1
Worli 67.8 68.8 56.7 70.4 Ghatkopar (W) 55.1 62.4 60.6 71.5 Goregaon 67 67.7 60.9 66.4
Prabhadevi 57.6 82.2 56.7 67.7 Mulund (E) 65.2 68.4 60.4 86.7 Jogeshwari 70.1 81.8 69.8 71.6
Mahim 66.3 69.6 62.4 70.3 Mulund (W) 69.5 69.6 62.9 72.9 Versova 56.6 47.7 66.5 71.3
Parel 58.6 62.2 56.2 71.9 Sakinaka 87.7 69.5 63 74.5 Marve 70.1 60.9 57.9 65
Byculla 70.8 60.9 59 77 Powai 67.1 61.3 64.9 74.3 Borivali (E) 68.3 69.8 62 69.3
Dadar 66.5 74.7 66.5 73.3 Wadala 83.7 66.5 71 67.6 Borivali (W) 57.8 66.5 66.9 60.3
Sion 76.7 70.9 65.4 79 Dharavi 76.2 75.9 64.8 66.6 Dindoshi 72.6 64.8 71.6 55.3
Hindu Colony 65.2 65.2 62.4 62.7 Sewree 67.7 70.9 60.5 73.2 Kandivali (E) 54.5 60.5 59.6 67.2
Matunga 70.6 64.2 66.5 69 Kalina 68 76.4 67.1 61.2 Dahisar (E) 52.5 74.9 64.8 57.2
Kamathipura 74.7 71.8 60.5 68.4 Vikhroli (W) 80.7 63.2 64.3 59.8 Juhu 73.2 59.8 60.5 59.9
Malabar Hills 68.1 72.6 67.3 71.9 Bhandup (W) 61.7 66 58.2 70 Malad (W) 71.5 67.9 67.6 60.3
Fig. 10. Pattern of variation of sound intensity on Bhaubeej in Mumbai South (Night)

International Journal of Innovative Research in Advanced Engineering (IJIRAE) ISSN: 2349-2163 Volume 1 Issue 6 (July 2014) http://ijirae.com
_____________________________________________________________________________________________________ © 2014, IJIRAE- All Rights Reserved Page -10
404550556065707580859095
Mumbai Eastern Suburbs (NightTime)
2012 2011 2010 2009
Fig. 11. Pattern of variation of sound intensity on Bhaubeej in Mumbai Eastern Suburb (Night)
Fig. 12. Pattern of variation of sound intensity on Bhaubeej in Mumbai Western Suburb (Night)
International Journal of Innovative Research in Advanced Engineering (IJIRAE) ISSN: 2349-2163 Volume 1 Issue 6 (July 2014) http://ijirae.com
_____________________________________________________________________________________________________ © 2014, IJIRAE- All Rights Reserved Page -11
It is observed that though the permissible L(A)eq noise level set by CPCB is 55 dB(A) and 45 dB(A) for day and night
time respectively for residential zone, the levels obtained at all places are much more than permissible limit for all 4 years. It is observed that on Laxmi Pujan L(A)eq sound levels are highest at 17 places during day time and 16 places during night time in year 2012 compared to all previous years. Similarly for Bhaubeej also at 18 places for day time and 17 places for night time L(A)eq are highest in the year 2012.
Permissible noise level for industrial area is 75 dB(A) and 70 dB(A) for day and night respectively. The readings observed are even more than that at many location though most of the places are residential area. At 21 places during day time and 27 places during night time & at 17 places during day and 20 places during night noise levels are more than the limits set for industrial area on Laxmi Pujan & Bhaubeej respectively in the year 2012.
Maximum high levels for day time are recorded in Mumbai South and at Suburban part of Mumbai noise levels are higher during night time one reason of this can be that this part of Mumbai is residential zone and people celebrate this festival mostly in night.
V. CONCLUSION During the present study the noise levels observed by MPCB were analysed for the year 2009 to 2012 during the festival
Deepawali in Mumbai. The Noise levels were found to have a range bound trend, which remained same for study period. The noise levels observed to be much higher than the permissible standard for the noise in the residential area. There was no reduction in the noise levels during these four years.
VI. RECOMMENDATIONS The monitoring locations consist of areas belonging to residential, commercial and sensitive zones. The noise so produced
during the festival are area source, so it is very hard to locate one particular high noise emitting source. To counter this problem following steps can be taken, Proper supervision is required to make sure that cracker manufacturers/sellers following the noise standards set for
crackers. Making people more aware about the effects of noise pollution. And to make sure that all existing laws, such as the time limit on the use of firecrackers, are followed by citizens.
REFERENCES
[1] Jamrah, A., Al-omari, A. And Sharabi, R. Evaluation of traffic noise pollution in Amman, Jordan. Environmenatal monitoring assessment 120 (1-3), 499-525, 2006.
[2] Agarwal, S., Yadav, S. Noise Pollution and Its Impact on Health. International Institute for Science, Technology and Education (IISTE), vol 3, no 6, 2013.
[3] Martin, M. A., Tarrero, M. A., Gonzaler, A. And Machimbarrena, M. Exposure effect relationships between road traffic noise annoyance and cost valuations in Valladolid, Spain. Journal of applied acoustics 67 (10), 945-652, 2006.
[4] Chien, M. K. And Shih, L. H. An imperical study of the implementation of green supply chain management practices in the electrical and electronics industry and their relation to organisational performances. International journal of environment, science and technology 4 (2) 383–394, 2007.
[5] Concha-Barrientos, M., Campbell-Lendrum, D. and Steenland, K. Occupational noise, assessing the burden of decease from work related hearing impairment at national and local levels. Environmental burden disease series, no 9, World Health protection of the human environment, Geneva, 2004.
[6] Saler, P., Vibhute, S. (2012). Ganeshotasv- A festival of noise. Journal of Engineering Research and Studies, vol. 3, No 1, 81-83, 2012.
[7] Mangalekar, S. B., Jadhav, A. S. And Raut P. D. Study of noise pollution in Kolhapur city, Maharashtra, India. Vol. 2 issue 1, 65-69, 2012.
[8] http://mpcb.gov.in/images/pdf/NoiseDeepawali09-new.pdf. [9] http://mpcb.gov.in/images/pdf/Report_Noise_Deepawali_2010.pdf. [10] http://mpcb.gov.in/images/pdf/Noise_deepawaliReport2011.pdf [11] http://mpcb.gov.in/images/pdf/MPCBDeepawaliNoise_2012.pdf.
![F--K-teko-Diwali Assignment-11 SOLUTIONS ASSGNMENT PDFs/DEEPAWALI ASS… · , Bhopal, Ph.: (0755) 32 00 000 , Deepawali Assignment [1] of 16 CLASS 11 FOR TARGET IIT JEE 2012 SOLUTION](https://img.pdfslide.us/doc/110x75/5fc1134952b11f765047bce4/f-k-teko-diwali-assignment-11-solutions-assgnment-pdfsdeepawali-ass-bhopal.jpg)