Embed Size (px)
Citation preview
Optimum Weight Design of Ship’s Structures
with Application to a Barge’s Deck
By: Mohamed Moanes Abdel Salam
Prof. El-Sayed HegazyProfessor of Ship’s Structures
Department of Marine EngineeringPort-Said University
Dr. Ahmed Naguib
Asst. Prof of Ship’s Structures
Department of Marine Engineering
Arab Academy (AAST)
Supervisors
1

2
Contents
• Chapter One: Introduction• Chapter Two: Principles of Design Optimization• Chapter Three: Reference Deck Stress Analysis• Chapter Four: Optimum Design for Barge’s Deck• Chapter Five: Conclusion

3
Chapter One: IntroductionBackground and Motivation


5
Minimizing structural weight can have significant impacts on;
• Production cost• Vessel Speed • Lifecycle cost• Pollution
Design for Minimum Weight
Chapter One: Background and Motivation
6
Stiffened PanelsStiffened panels are main member in marine structures since half of twentieth century, as they are used in several usages such as; bottom, side, deck and bulkhead constructions etc.
Chapter One: Background and Motivation
They are more cost-effective by offering a desirable strength/weight ratio.
Why ?
7
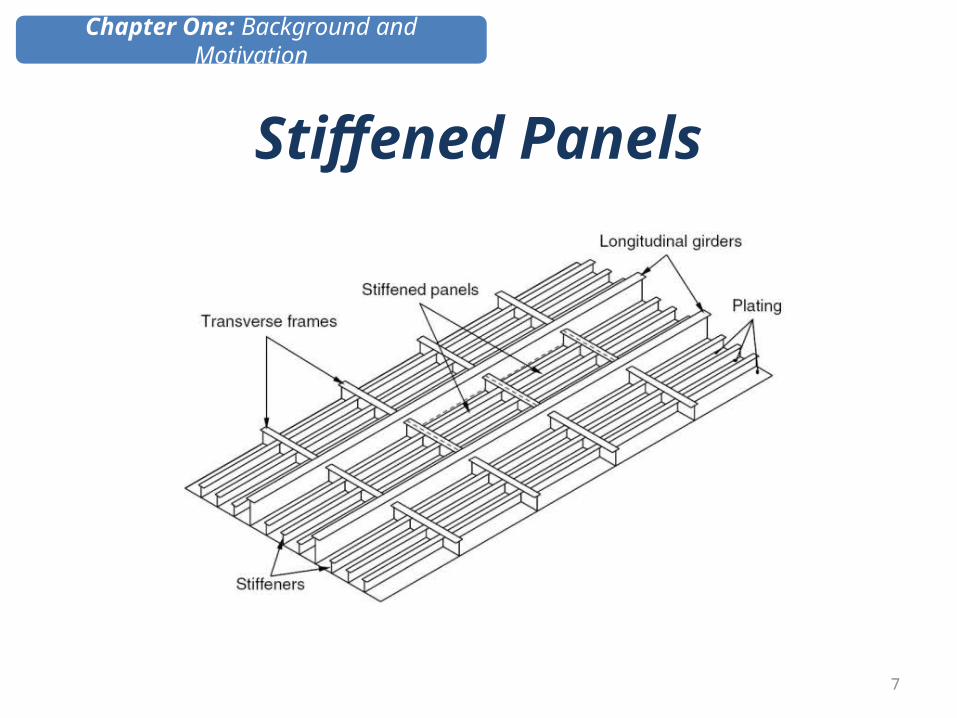
Stiffened Panels
Chapter One: Background and Motivation

8
Chapter Two: Principles of Design Optimization

9
Chapter Two: Design Optimization
Design Optimization Goal
Design Optimization is to design better, more efficient and less expensive systems. By determining the best case without actually testing all possible cases and identify the relationship between the performance of the product (Maximum stress, Deformation, Mass etc.) and the design variables (Dimensions, Material, Loads etc.).

10
Chapter Two: Design Optimization
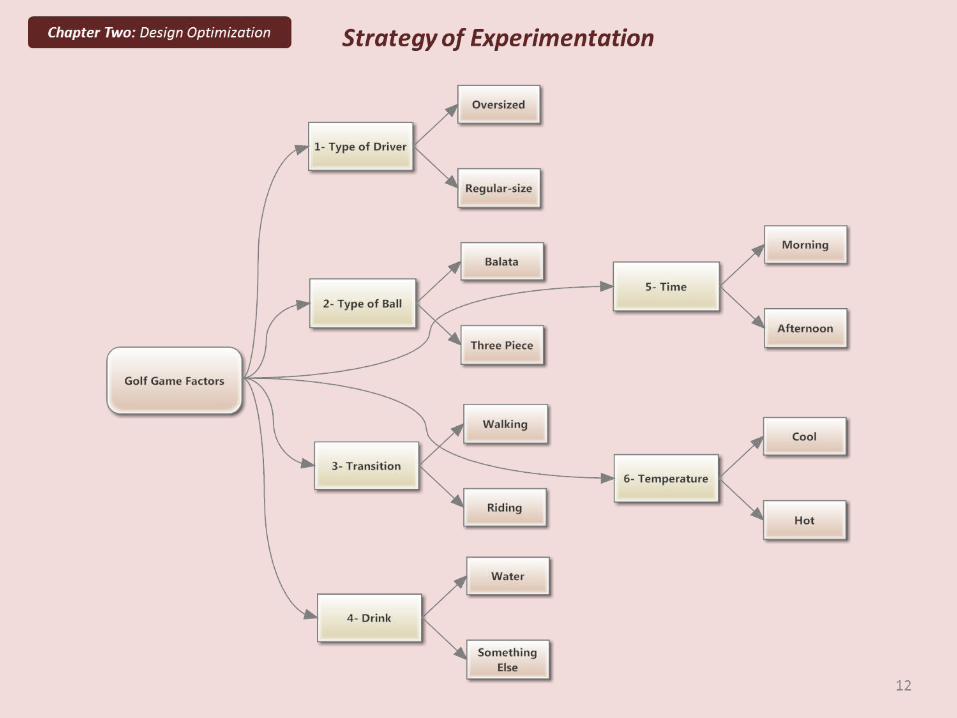
Strategy of Experimentation
Best guess approach One-factor-at-a-time Factorial Approach

Chapter Two: Design Optimization
Strategy of Experimentation
Golf Example
11

Chapter Two: Design Optimization
Strategy of Experimentation
13
Best guess approach (trial and error)
• Can continue indefinitely.• Cannot guarantee that best solution has been found.

14
One-factor-at-a-time (OFAT)
Chapter Two: Design Optimization
Strategy of Experimentation

Chapter Two: Design Optimization
Strategy of Experimentation
One-factor-at-a-time (OFAT) approach
15
• Inefficient (requires many test runs).• Fails to consider any possible interaction between factors.
16
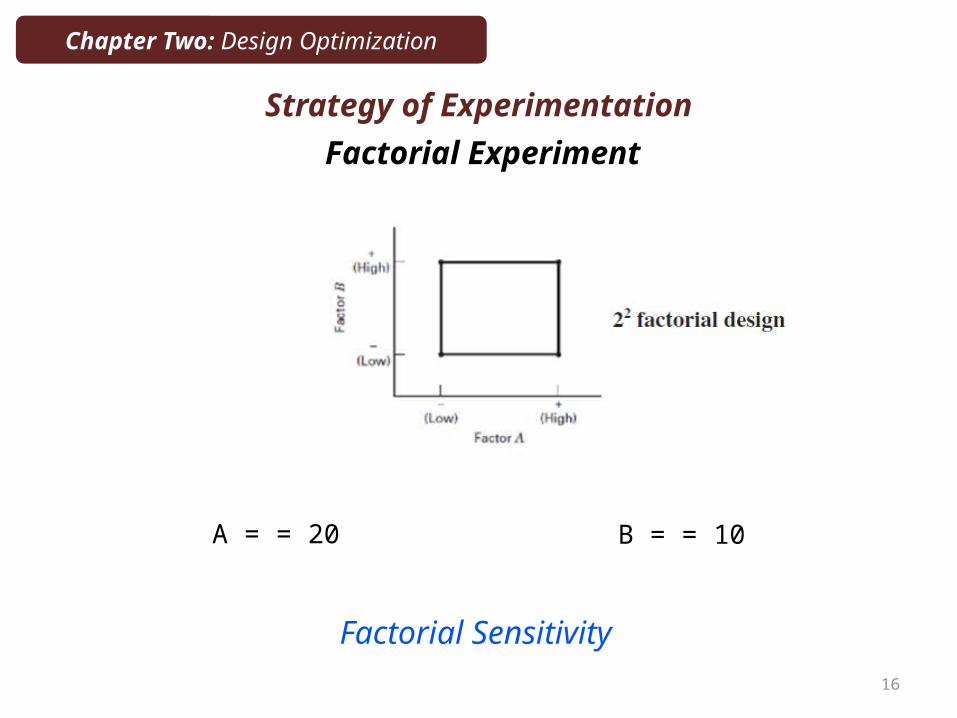
Factorial Experiment
Chapter Two: Design Optimization
Strategy of Experimentation
A = = 20 B = = 10
Factorial Sensitivity
17
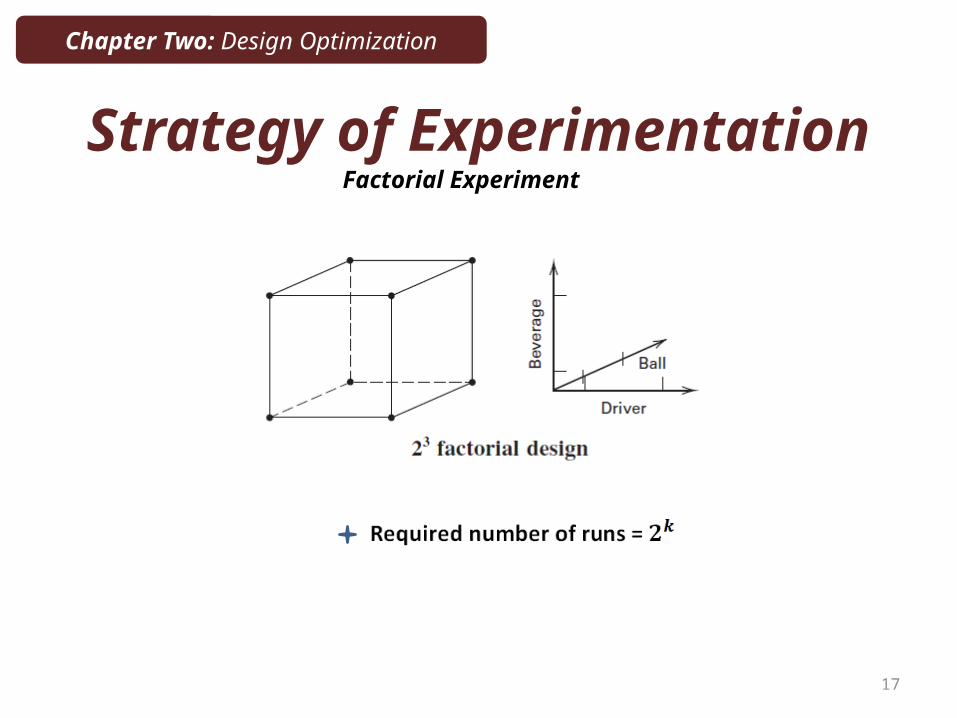
Strategy of Experimentation
Chapter Two: Design Optimization
Factorial Experiment

18
Factorial Experiment
Strategy of Experimentation
Chapter Two: Design Optimization
19
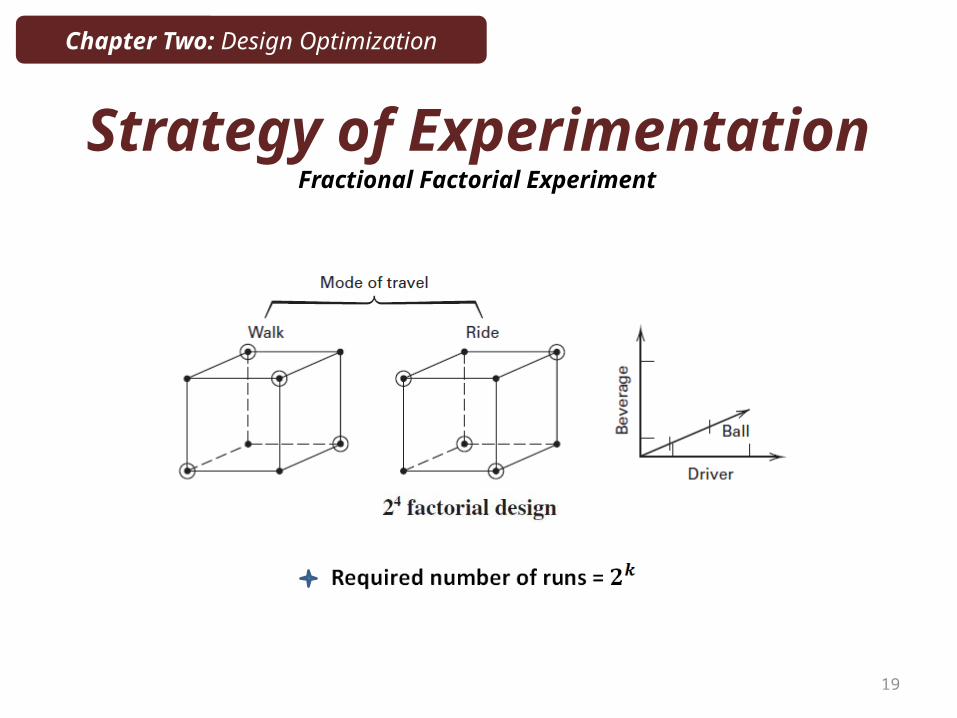
Fractional Factorial Experiment
Strategy of Experimentation
Chapter Two: Design Optimization
20
Chapter Two: Design Optimization
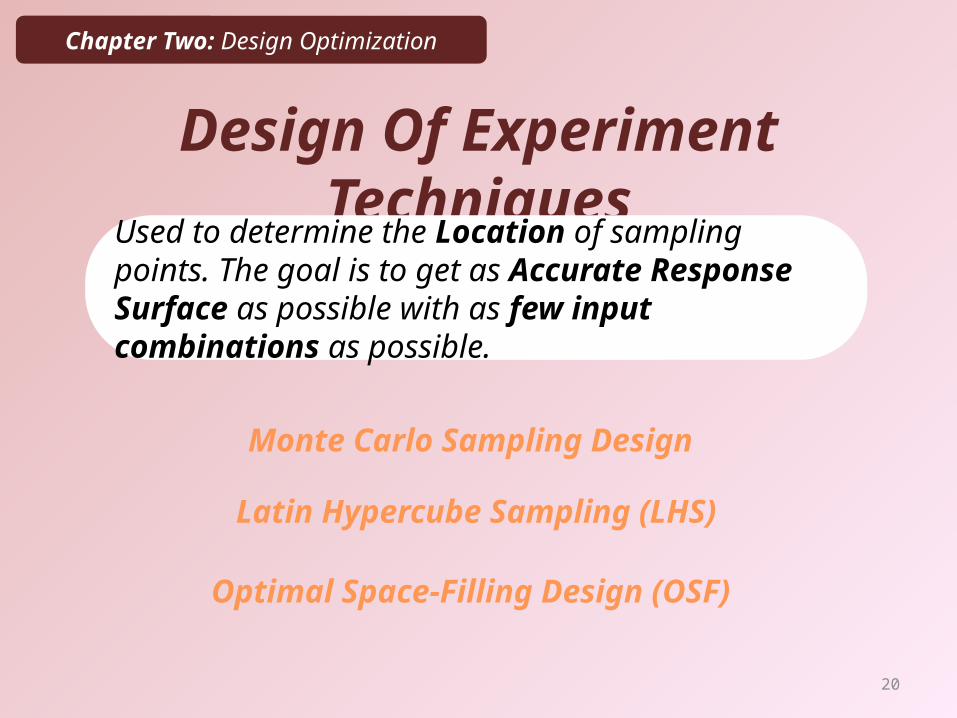
Design Of Experiment Techniques
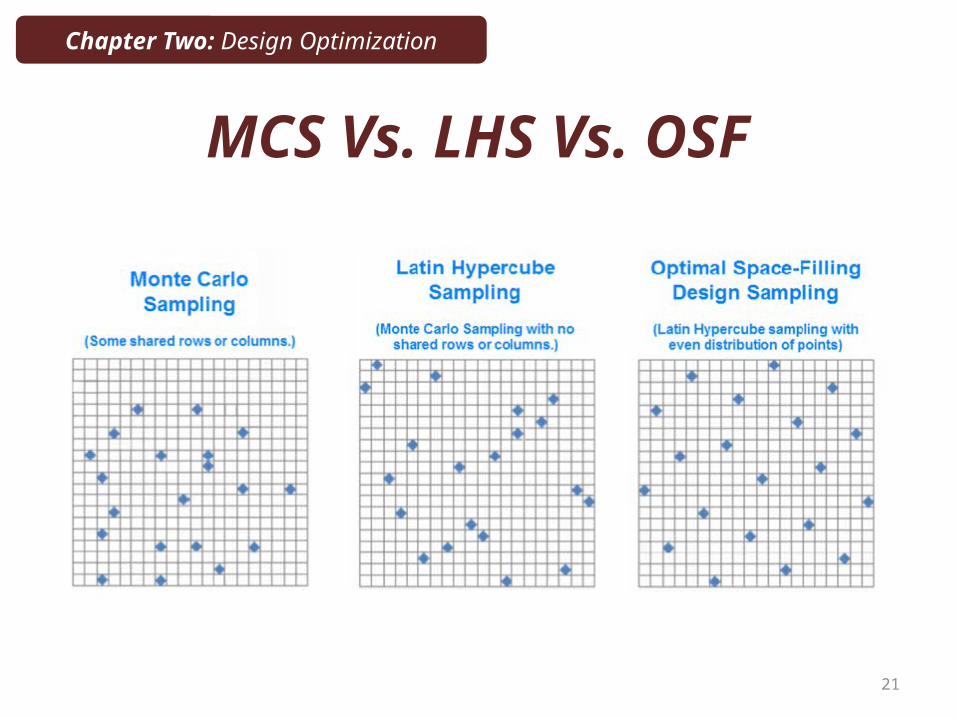
Used to determine the Location of sampling points. The goal is to get as Accurate Response Surface as possible with as few input combinations as possible.
Latin Hypercube Sampling (LHS)
Optimal Space-Filling Design (OSF)
Monte Carlo Sampling Design
21
Chapter Two: Design Optimization
MCS Vs. LHS Vs. OSF

22
Chapter Two: Design Optimization
Multi-Objective Optimization
Screening Optimization Multi-Objective Screening Optimization
24
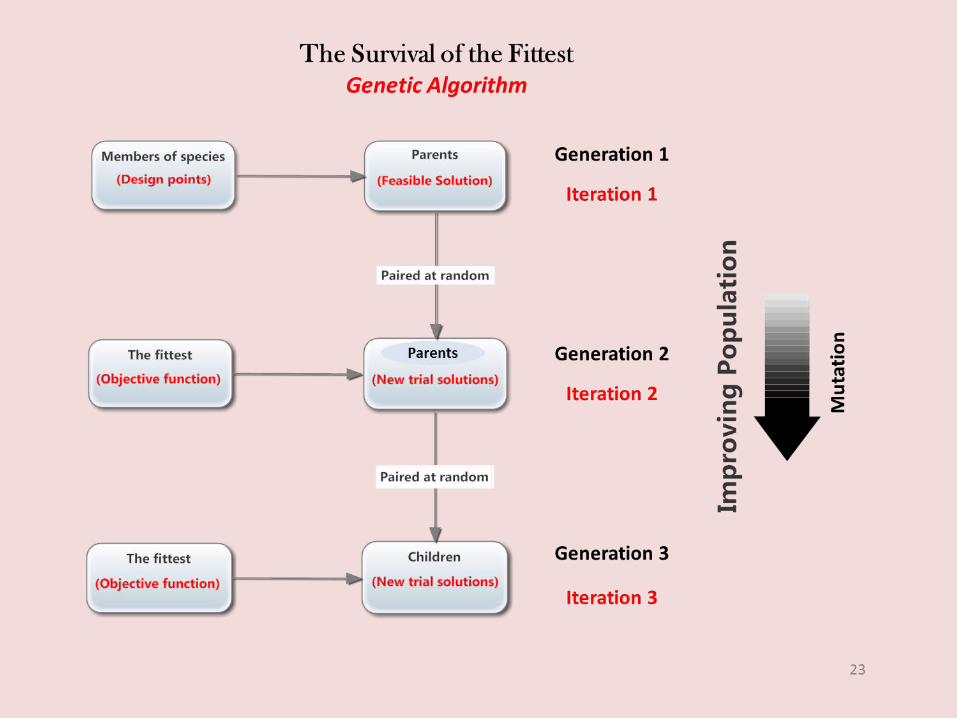
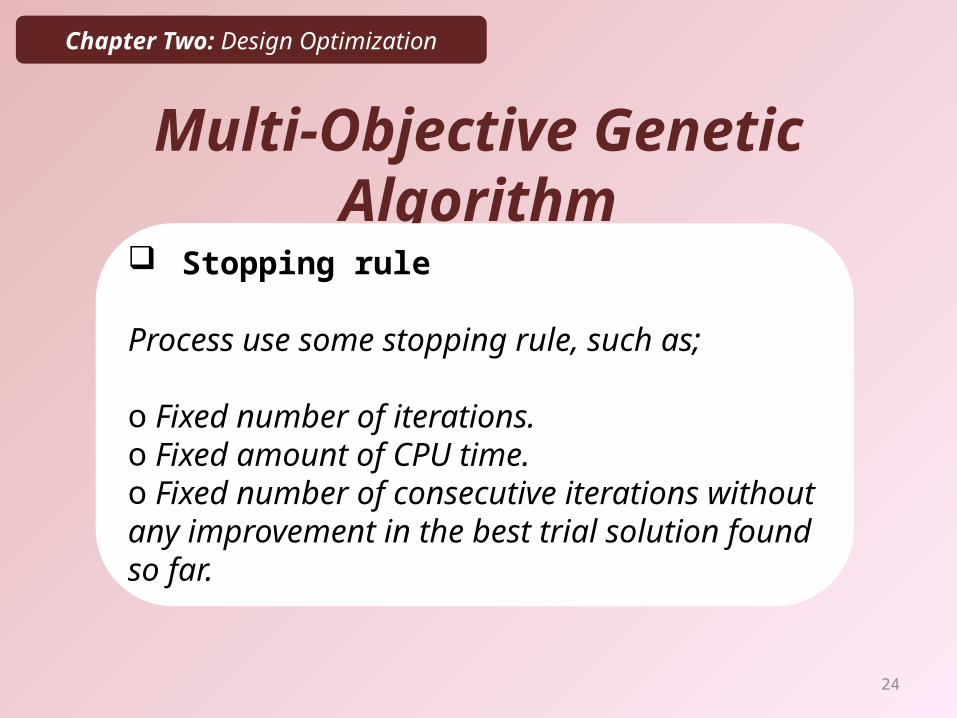
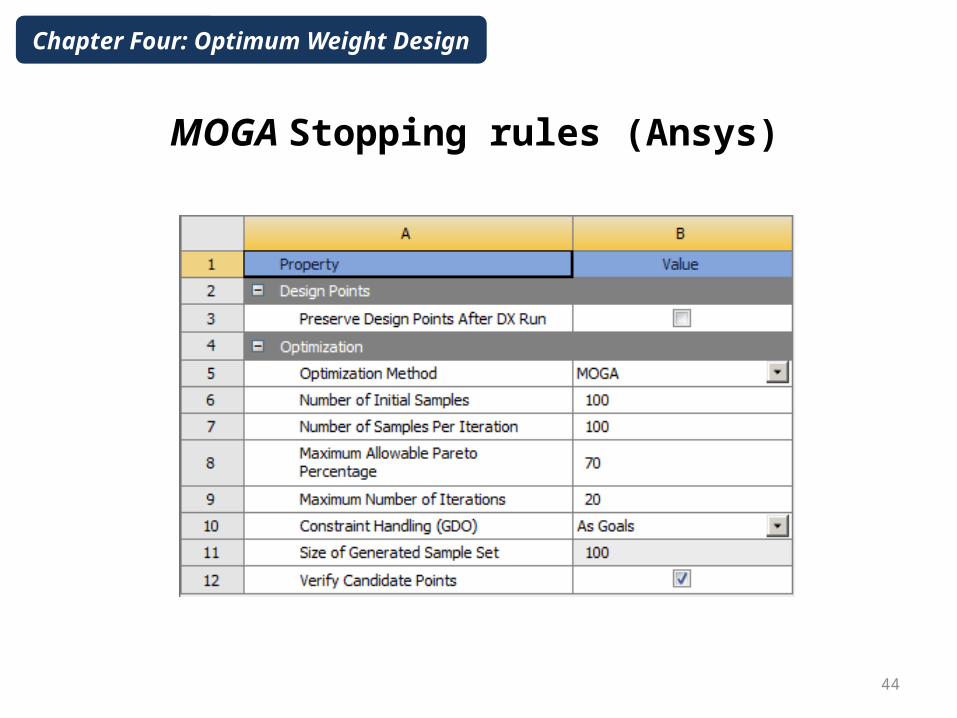
Multi-Objective Genetic Algorithm
Stopping rule
Process use some stopping rule, such as;
o Fixed number of iterations.o Fixed amount of CPU time.o Fixed number of consecutive iterations without any improvement in the best trial solution found so far.
Chapter Two: Design Optimization

25
Chapter Three:Finite Element Analysis for a
Barge’s Deck

26
A barge is a flat-Deck boat, built mainly to transport heavy goods such as; containers, gravel and construction equipment.
Chapter Three: FEA for a Barge’s Deck

27
Reference Barge’s design
Length Overall 330 ft (100.58m)Breadth Moulded 100 ft (30.48m)Depth Moulded 20 ft (6.10m)
Design Draft 4.5m (Approx.)Deadweight 10,500 Tons (Approx.)
Deck Strength 20 Ton/m2
Principal Dimensions
Chapter Three: FEA for a Barge’s Deck

28
Methodology Over view


30
Deck Element Model
Name Dimensions (mm)Deck Element Plate 12.8 m x 7.62 m x 18
Longitudinal Stiffeners 150 x 90 x 12Transverse Webs 609 x 203 x 14DK Side Girder 609 x 345 x 12
Spacing of Longitudinal Beams 508Spacing of Transverse Webs 1829
Deck Element Weight is 22.647 T
Chapter Three: FEA for a Barge’s Deck

31
Applying Symmetry Boundary Conditions
Reduces the CPU time to the half, while delivering the same level of accuracy in the results.
Chapter Three: FEA for a Barge’s Deck

32
Element Size(mm)
No. of Elements
Equ. Stress Max. (MPa)
110 8130 221100 11664 221.3695 12426 222.4790 14954 225.9585 16556 226.3880 17590 226.4975 20622 226.57
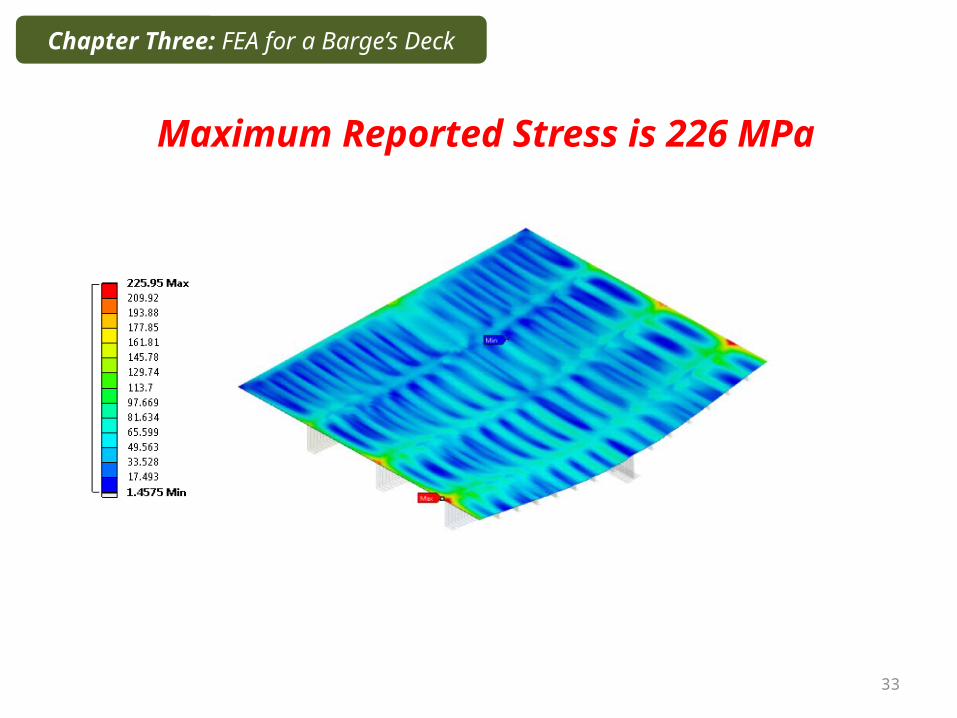
More elements in a mesh might give more accurate results but can significantly increase the computational time. 14954 elements (9mm quadratic) used to create a fine mesh.
Chapter Three: FEA for a Barge’s Deck
Meshing
33
Maximum Reported Stress is 226 MPa
Chapter Three: FEA for a Barge’s Deck

34
Chapter Four:Optimum Weight Design for the
Barge’s Deck
35
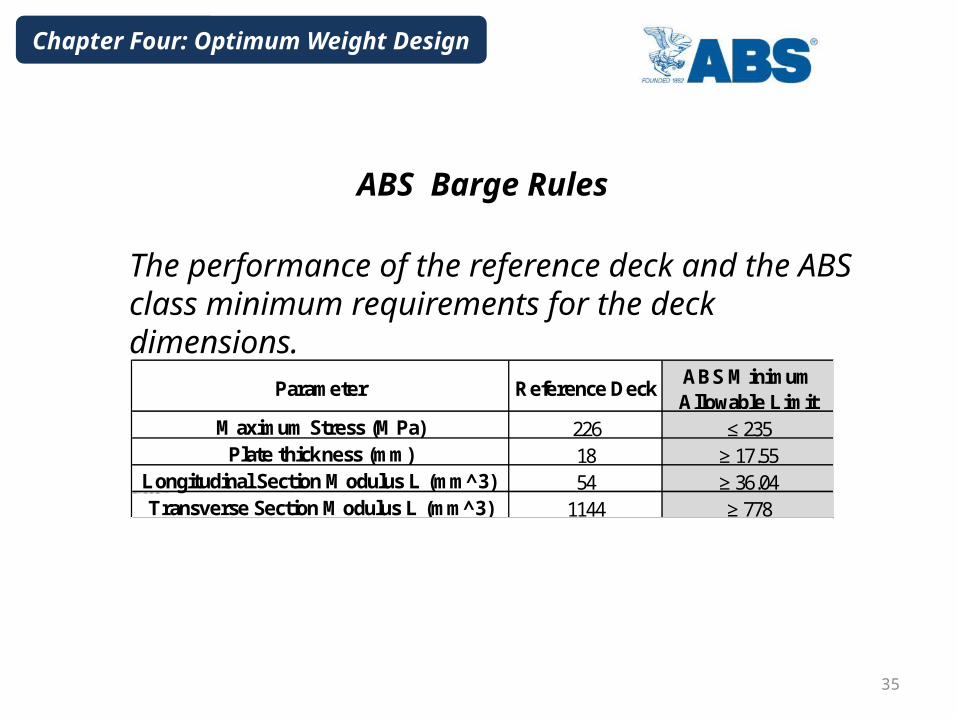
ABS Barge Rules
The performance of the reference deck and the ABS class minimum requirements for the deck dimensions.
Chapter Four: Optimum Weight Design
Parameter Reference DeckABS Minimum Allowable Limit
Maximum Stress (MPa) 226 ≤ 235Plate thickness (mm) 18 ≥ 17.55
Longitudinal Section Modulus L (mm^3) 54 ≥ 36.04Transverse Section Modulus L (mm^3) 1144 ≥ 778
36
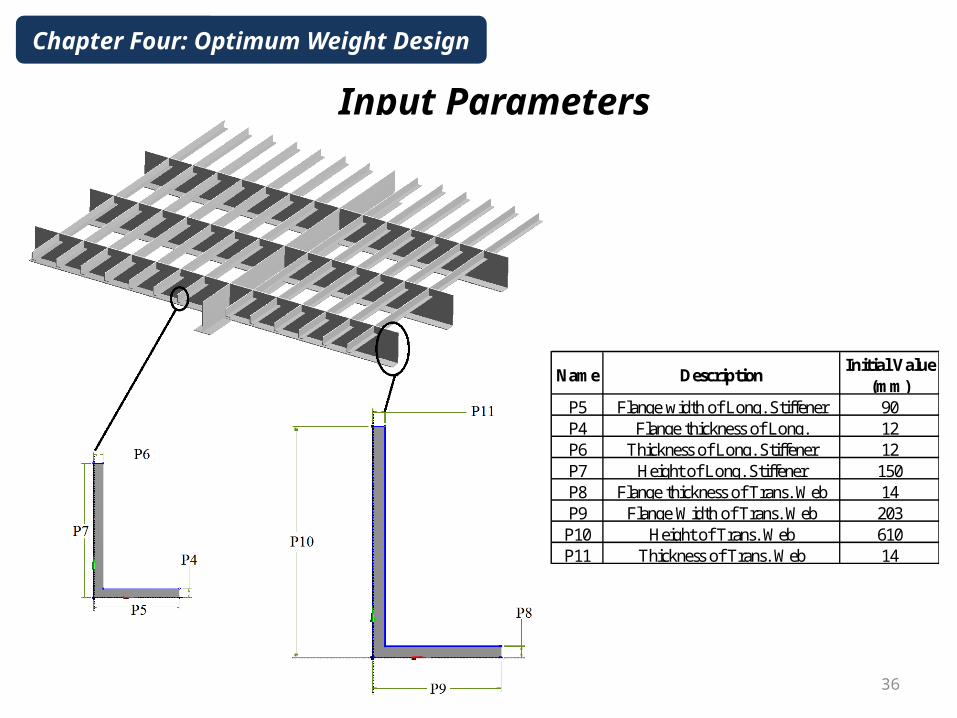
Input Parameters
Name DescriptionInitial Value
(mm)P5 Flange width of Long. Stiffener 90P4 Flange thickness of Long. 12P6 Thickness of Long. Stiffener 12P7 Height of Long. Stiffener 150P8 Flange thickness of Trans. Web 14P9 Flange Width of Trans. Web 203
P10 Height of Trans. Web 610P11 Thickness of Trans. Web 14
Chapter Four: Optimum Weight Design
37
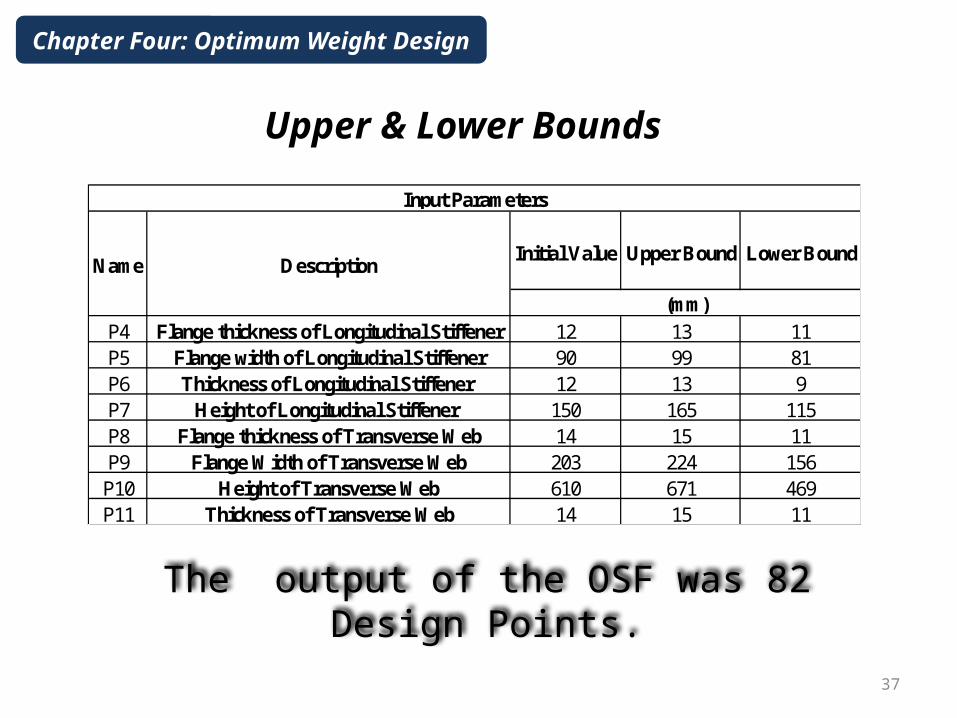
Upper & Lower Bounds
The output of the OSF was 82 Design Points.
Chapter Four: Optimum Weight Design
Initial Value Upper Bound Lower Bound
P4 Flange thickness of Longitudinal Stiffener 12 13 11P5 Flange width of Longitudinal Stiffener 90 99 81P6 Thickness of Longitudinal Stiffener 12 13 9P7 Height of Longitudinal Stiffener 150 165 115P8 Flange thickness of Transverse Web 14 15 11P9 Flange Width of Transverse Web 203 224 156P10 Height of Transverse Web 610 671 469P11 Thickness of Transverse Web 14 15 11
Name Description
Input Parameters
(mm)
38
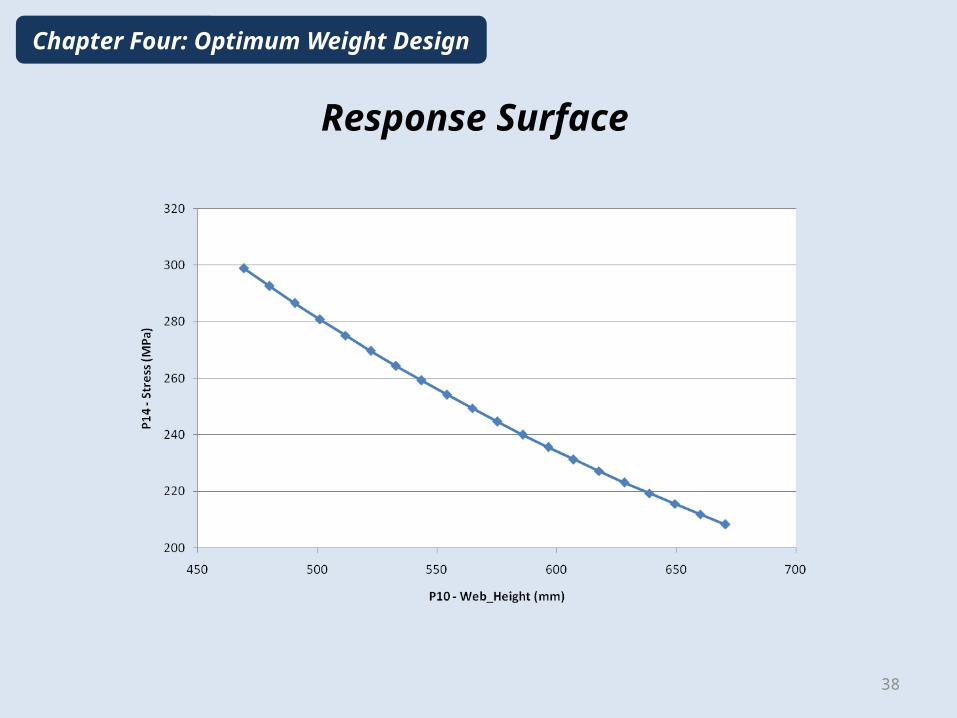
Response Surface
Chapter Four: Optimum Weight Design
39
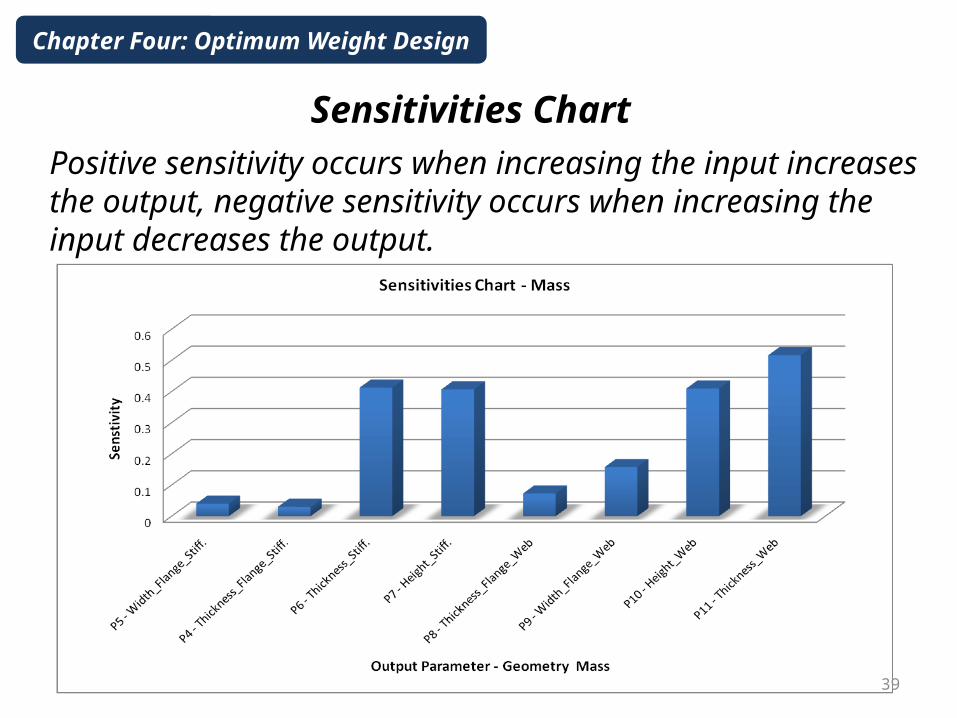
Sensitivities ChartPositive sensitivity occurs when increasing the input increases the output, negative sensitivity occurs when increasing the input decreases the output.
Chapter Four: Optimum Weight Design
40
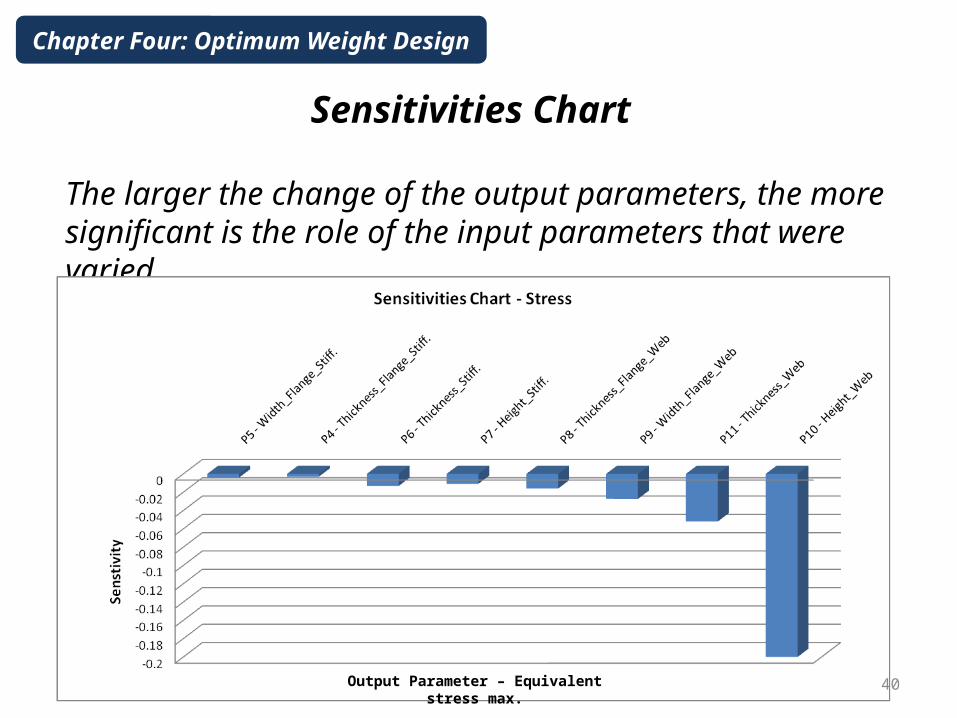
Sensitivities Chart
The larger the change of the output parameters, the more significant is the role of the input parameters that were varied.
Output Parameter – Equivalent stress max.
Chapter Four: Optimum Weight Design

41
Number Of Parameters Vs. Number of Design Points
Chapter Four: Optimum Weight Design
After disabling P4 & P5 the number of design points that created by OSF method reduced from 82 design points for 8 input parameters to 45 design points for 6 parameters.
42
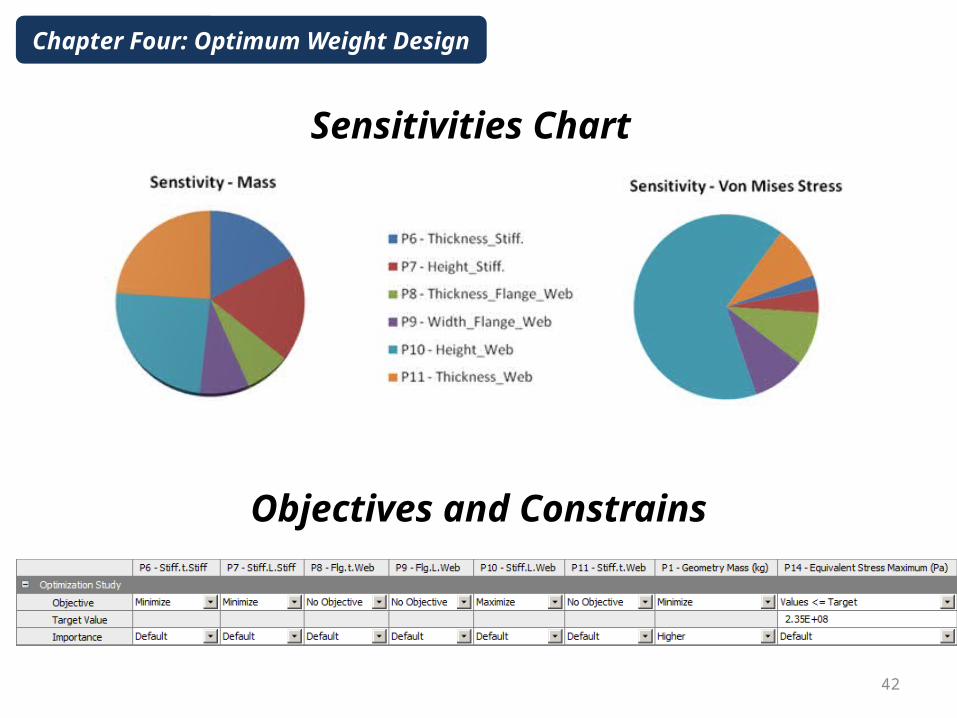
Sensitivities Chart
Objectives and Constrains
Chapter Four: Optimum Weight Design
43
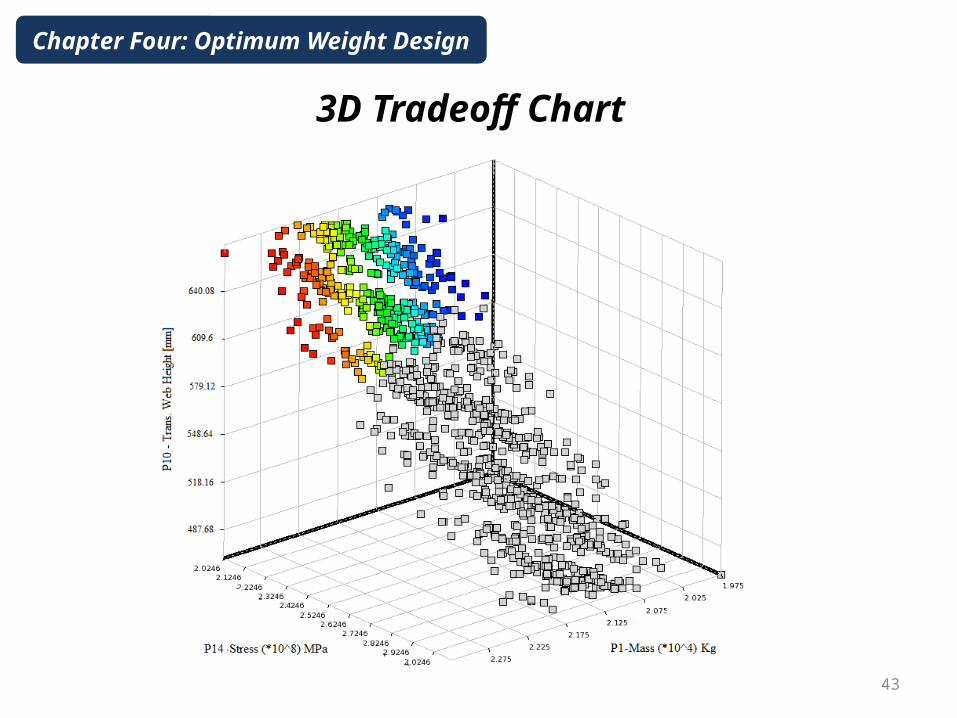
3D Tradeoff Chart
Chapter Four: Optimum Weight Design
44
MOGA Stopping rules (Ansys)
Chapter Four: Optimum Weight Design

45
Samples Chart for MOGA Optimization
Chapter Four: Optimum Weight Design
46
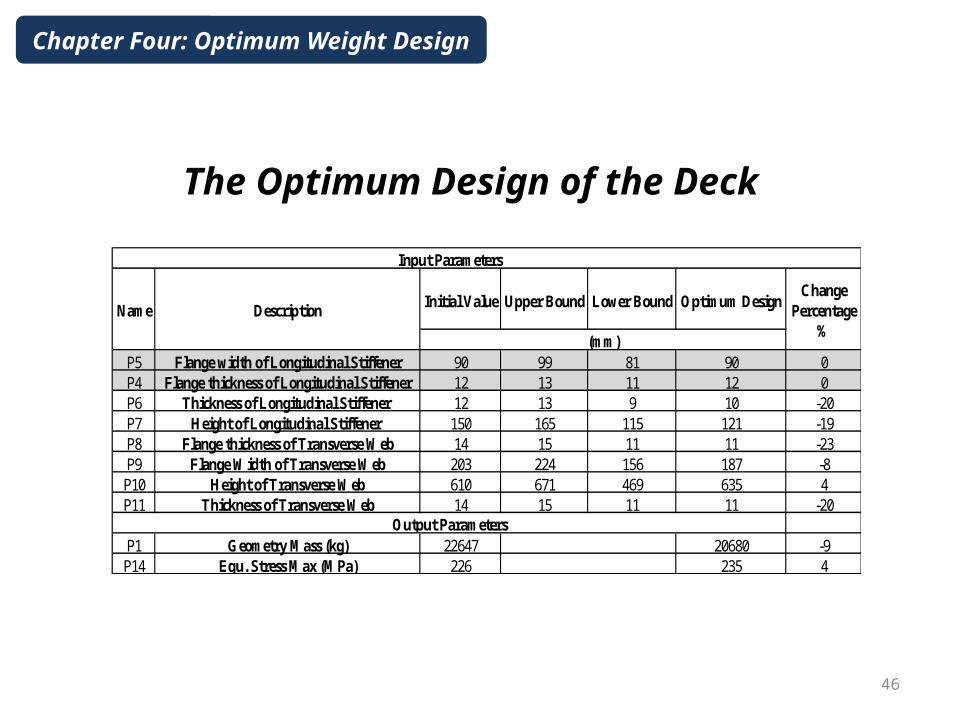
The Optimum Design of the Deck
Chapter Four: Optimum Weight Design
Initial Value Upper Bound Lower Bound Optimum Design
P5 Flange width of Longitudinal Stiffener 90 99 81 90 0P4 Flange thickness of Longitudinal Stiffener 12 13 11 12 0P6 Thickness of Longitudinal Stiffener 12 13 9 10 -20P7 Height of Longitudinal Stiffener 150 165 115 121 -19P8 Flange thickness of Transverse Web 14 15 11 11 -23P9 Flange Width of Transverse Web 203 224 156 187 -8P10 Height of Transverse Web 610 671 469 635 4P11 Thickness of Transverse Web 14 15 11 11 -20
P1 Geometry Mass (kg) 22647 20680 -9P14 Equ. Stress Max (MPa) 226 235 4
Change Percentage
%
Input Parameters
Name Description
(mm)
Output Parameters
47
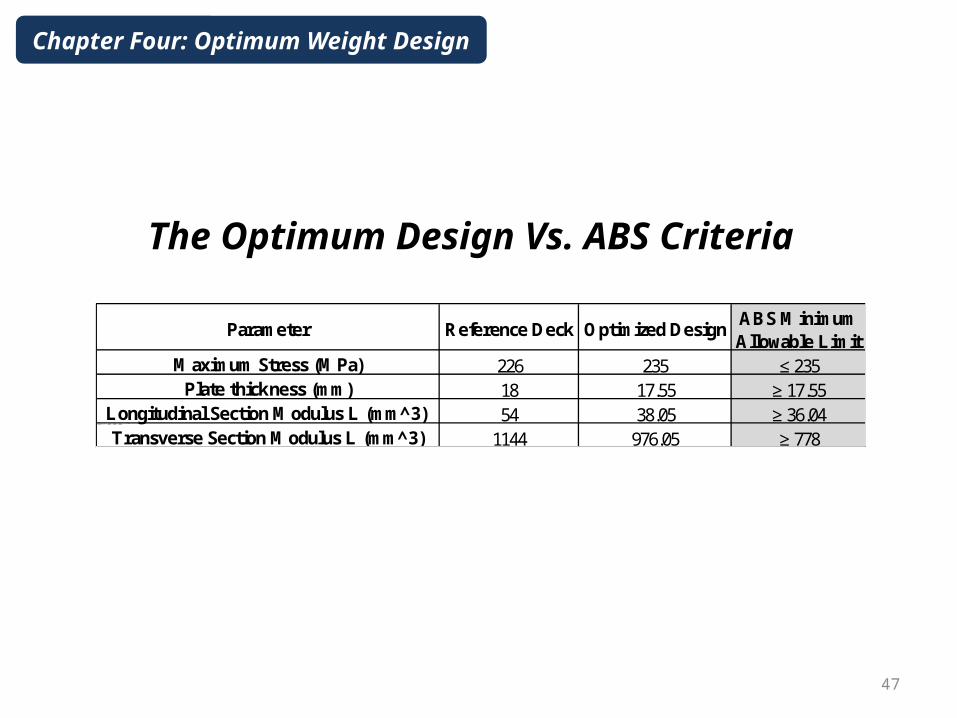
The Optimum Design Vs. ABS Criteria
Chapter Four: Optimum Weight Design
Parameter Reference Deck Optimized DesignABS Minimum Allowable Limit
Maximum Stress (MPa) 226 235 ≤ 235Plate thickness (mm) 18 17.55 ≥ 17.55
Longitudinal Section Modulus L (mm^3) 54 38.05 ≥ 36.04Transverse Section Modulus L (mm^3) 1144 976.05 ≥ 778
48
Conclusion

49
Sensitivity tests used to explore the design and understand how each output parameter is driven by input parameters and how the design can be modified. “The Web Height” is playing a major role and has the significant impact in changing the stress with relatively small increase in weight.
On the other hand, two parameters “Flange thickness of Longitudinal Stiffener & Flange width of Longitudinal Stiffener” have a very small impact on the output parameters.MOGA optimization shows its effectiveness, as in the final iteration, the weight of the deck was reduced by 9 percent.
Chapter Five: Conclusion
50
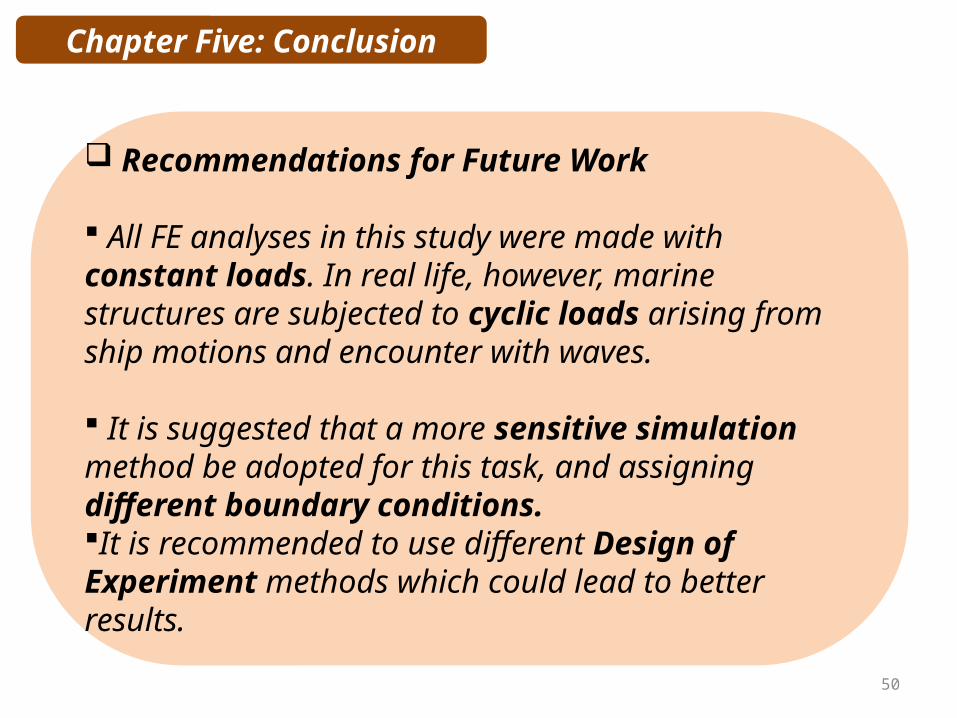
Recommendations for Future Work
All FE analyses in this study were made with constant loads. In real life, however, marine structures are subjected to cyclic loads arising from ship motions and encounter with waves.
It is suggested that a more sensitive simulation method be adopted for this task, and assigning different boundary conditions.It is recommended to use different Design of Experiment methods which could lead to better results.
Chapter Five: Conclusion
51
Thank You