Embed Size (px)
Citation preview

THE IMPACT OF MICROPHYSICAL SCHEMES ON THE SKILL THE IMPACT OF MICROPHYSICAL SCHEMES ON THE SKILL OF FORECASTING THE TRACK AND INTENSITY OF OF FORECASTING THE TRACK AND INTENSITY OF TROPICAL CYCLONES USING ARW MODELTROPICAL CYCLONES USING ARW MODEL
PRESENTED BYPRESENTED BYDEVANIL CHOUDHURYDEVANIL CHOUDHURY
M.TECH. ATMOSPHERIC SCIENCESM.TECH. ATMOSPHERIC SCIENCES

OUTLINEOUTLINE✔ OBJECTIVEOBJECTIVE✔ BACKGROUNDBACKGROUND✔ MICROPHYSICAL SCHEMESMICROPHYSICAL SCHEMES✔ THE TROPICAL CYCLONESTHE TROPICAL CYCLONES✔ EXPERIMENTAL SETUPEXPERIMENTAL SETUP✔ MODEL CONFIGURATIONMODEL CONFIGURATION✔ MODEL INITIAL AND BOUNDARY CONDITIONS MODEL INITIAL AND BOUNDARY CONDITIONS ✔ VERIFICATIONAL METHODVERIFICATIONAL METHOD✔ PRECIPITATION ANALYSISPRECIPITATION ANALYSIS✔ WIND ANALYSISWIND ANALYSIS✔ VERTICAL CROSS-SECTIONSVERTICAL CROSS-SECTIONS✔ VALUE OF HYDROMETEORSVALUE OF HYDROMETEORS✔ TAYLOR DIAGRAMSTAYLOR DIAGRAMS✔ VERIFICATION OF MSWVERIFICATION OF MSW✔ CYCLONE TRACKSCYCLONE TRACKS✔ AVERAGED DPEAVERAGED DPE✔ RMSE of MSWRMSE of MSW✔ THE SKILL ON TRACKTHE SKILL ON TRACK✔ THE SKILL IN INTENSITYTHE SKILL IN INTENSITY✔ SUMMARYSUMMARY✔ CONCLUSIONCONCLUSION✔ RMC-DELHIRMC-DELHI✔ ACKNOWLEDGEMENTACKNOWLEDGEMENT✔ REFRENCESREFRENCES✔ THANKS GIVINGTHANKS GIVING

OBJECTIVEOBJECTIVEThe main objectives of this study are -
➔ to use a regional cloud-scale model with very high resolution
WRF-ARW model.
➔ to simulate the tropical cyclones 'Hudhud' (2014), 'Lehar' (2013),
'Phailin' (2013).
➔ to investigate the impact of microphysical schemes on the track
and intensity of the tropical cyclones over the Bay of Bengal.
➔ to find the skill of forecasting the track and intensity of the
tropical cyclones.

BACKGROUNDBACKGROUNDFew modeling studies have investigated microphysics in tropical cyclones and hurricanes using high-resolution ( about 5 km or less) numerical models. In general, all of the studies show that microphysics schemes do not have a major impact on track forecasts but do have more of an effect on the simulated intensity (Tao et al. 2010).
Based on a study of impact of cloud microphysics on hurricane Charley, Pattnaik and Krishnamurti (2007) reported that the microphysical parameterization schemes have strong impact on the intensity prediction of hurricane but have negligible impact on the track forecast.
Yang and Ching also concluded that the MRF in PBL and Grell in convective parameterization scheme (CPS) combined with the Goddard Graupel in cloud microphysics scheme give the best performance in the study of typhoon Toraji (2001) (Yang and Ching, 2005).
Srinivas et al (2011) found from 65 sensitivity experiments for five severe tropical cyclones over the BoB that the combinations of Kain-Fritsch (KF) convection, Yonsei University (YSU) planetary boundary layer (PBL), LIN explicit microphysics and NOAA land surface schemes provide the best simulations for intensity and track prediction.

MICROPHYSICAL SCHEMESMICROPHYSICAL SCHEMESThe representation of cloud microphysical process is a key component of the NWP models, and during the past decade both research and operational NWP models have started using more complex microphysical schemes.
Microphysics includes explicitly resolved water vapor, cloud, and precipitation processes.
The microphysical schemes were originally developed for high resolution cloud resolving models (CRM). CRMs explicitly simulate complex dynamical and microphysical processes associated with deep, precipitating atmospheric convection.
The explicit and realistic representation of microphysics in the high-resolution numericalweather forecast model is crucial for accurate prediction of the tropical mesoscale convective systems and the intensity and track of tropical cyclones.
The microphysical schemes which are included in ARW framework are Kessler(1), Lin(2), WSM3(3), WSM5(4), Eta(5), WSM6(6), Goddard(7), Thompson(8), Milbrandt (9),Morrison(10), SBU-YLin(13), WDM5(14), WDM6(16), NSSL-2 moment(17), NSSL 2-moment+CCN(18), NSSL 1-moment(19).
THE TROPICAL CYCLONESTHE TROPICAL CYCLONES
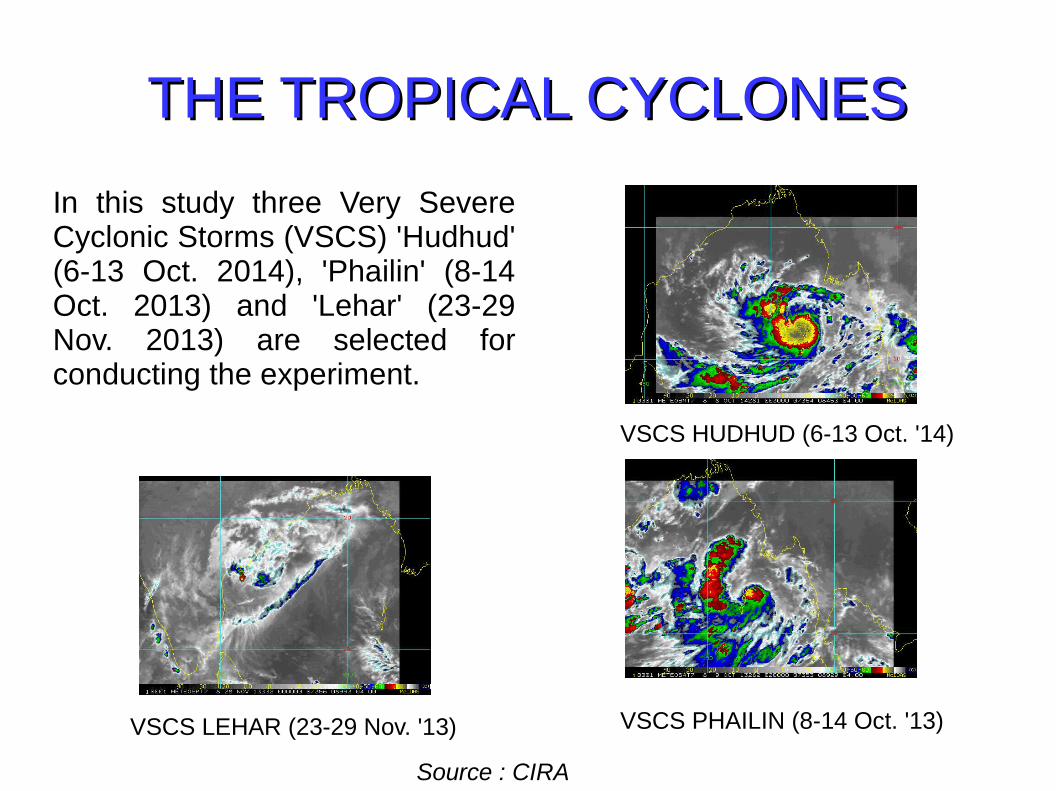
In this study three Very Severe Cyclonic Storms (VSCS) 'Hudhud' (6-13 Oct. 2014), 'Phailin' (8-14 Oct. 2013) and 'Lehar' (23-29 Nov. 2013) are selected for conducting the experiment.
VSCS LEHAR (23-29 Nov. '13) VSCS PHAILIN (8-14 Oct. '13)
VSCS HUDHUD (6-13 Oct. '14)
Source : CIRA

EXPERIMENTAL SETUPEXPERIMENTAL SETUP
Expt. No. mp_physics cu_physics bl_pbl_physics sf_surface_physics
1. (CONTROL)
LIN (2) KF (1) YSU (1) NOAA (2)
2.(LIN)
LIN (2) X YSU (1) NOAA (2)
3.(NSSL)
NSSL (17) X YSU (1) NOAA (2)
4.(THOMPSON)
THOMPSON(8)
X YSU (1) NOAA (2)
5.(GODDARD)
GODDARD(7)
X YSU (1) NOAA (2)
Using the best combination of schemes suggested by Srinivas et al. (2011) as control run (CONTROL) four other microphysical schemes selected to carry out the experiment to investigate the impact of microphysics on the forecasting skill for 9 km and 3 km two-way nested ARW simulations.
The physics schemes for nested domain (parent domain is same as the control run for all the experiments)

MODEL CONFIGURATIONMODEL CONFIGURATION
DOMAIN DETAILSDOMAIN DETAILS●Map projection : Mercator●Reference latitude : 22.273˚ N
●Reference longitude :83.08˚ E
●No. of domains : 2●No. of vertical layers : 27 sigma levels
●Horizontal grid distance : 9 km and 3 km
●Time steps : 45 s●No. of grid points : e_we = 373, 634e_sn = 418, 565
●Resolution of geographical data : 10' , 2'●Nesting : two-way interactive Experimental Domain

MODEL INITIAL AND BOUNDARY MODEL INITIAL AND BOUNDARY CONDITIONSCONDITIONS
Cyclones Start Date, Time
End Date, Time
Hudhud 08-10-2014_00
13-10-2014_00
Phailin 09-10-2013_00
14-10-2013_00
Lehar 24-11-2013_00
29-11-2013_00
Computing resource 'Aditya HPCS'Computing resource 'Aditya HPCS'790+ TeraFlops, 38,144 Intel Sandy 790+ TeraFlops, 38,144 Intel Sandy Bridge processors and 149 TB of Bridge processors and 149 TB of memory memory
Initial and boundary conditions : 0.25° resolution GFS real time prediction from IMD
Lateral boundary conditions : 06 hourly intervals. Forecast period : 120 hours.

VERIFICATIONAL METHODVERIFICATIONAL METHODARW Model (version 3.6.1) with two-way interactive nested grid is used on the 'Aditya HPC' to study the effects of microphysical schemes on track and intensity of these cyclones.
Direct Positional Error (DPE) is taken as track errors. DPE was calculated from haversine formula.haversine formula gives great-circle distances between two points on a sphere from their longitudes and latitudes.
haversin (d/r) = haversin ( φ2 - φ
1 ) + cos(φ
1 ) cos(φ
2 ) haversin (λ
2 – λ
1 )
haversin(θ) = sin2(θ/2) = 1-cos(θ)/2
d = 2r arcsin ( √ ( haversin ( φ2 - φ
1 ) + cos(φ
1 ) cos(φ
2 ) haversin (λ
2 – λ
1 ) ) )
[d = distance between two points , r = radius of the earth , 6378 km]
For track gain(loss) in skill in terms of DPE =
For intensity gain(loss) in skill in terms of MSW =
Bias/Error = IMD Observations – Model Forecasts => +ve (Underestimate) -ve (Overestimate)
CONTROL DPE−DPECONTROL DPE
×100
CONTROL RMSE−RMSECONTROL RMSE
×100

PRECIPITATION ANALYSIS PRECIPITATION ANALYSIS (THOMPSON) (THOMPSON)
HUDHUD
LEHAR
PHAILIN
mp_physics = THOMPSON (8)
LEHAR
PHAILIN

WIND ANALYSIS WIND ANALYSIS (GODDARD) (GODDARD)
HUDHUD
LEHAR
PHAILIN
mp_physics = GODDARD (8)

VERTICAL CROSS-SECTION: VERTICAL CROSS-SECTION: HUDHUDHUDHUD
1.GODDARD 2. LIN 3. NSSL
4. CONTROL 5. THOMPSON
Meridional wind (v_wind) cross-section at time and position of peak intensity based on minimum CSLP
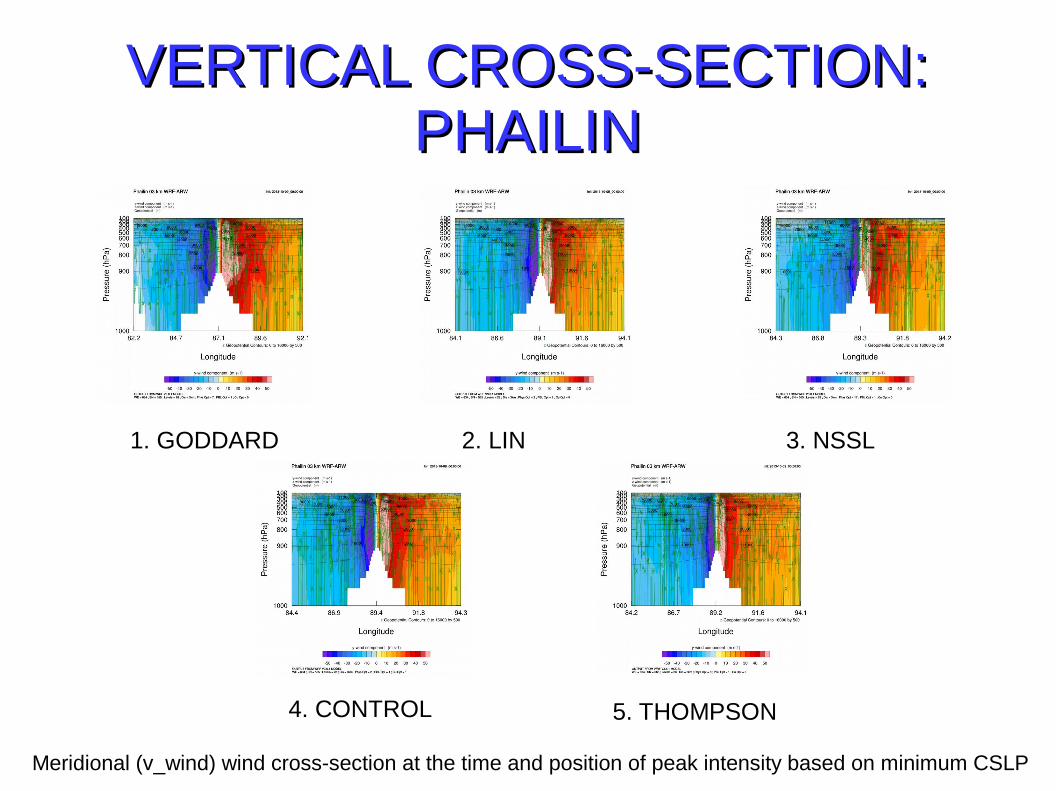
VERTICAL CROSS-SECTION: VERTICAL CROSS-SECTION: PHAILINPHAILIN
1. GODDARD 2. LIN 3. NSSL
4. CONTROL 5. THOMPSON
Meridional (v_wind) wind cross-section at the time and position of peak intensity based on minimum CSLP

VERTICAL CROSS-SECTION: VERTICAL CROSS-SECTION: LEHARLEHAR
1. GODDARD 2. LIN 3. NSSL
4. CONTROL 5. THOMPSON
Meridional wind (v_wind) cross-section at the time and position of peak intensity based on minimum CSLP

VALUE OF HYDROMETEORSVALUE OF HYDROMETEORSSchemes Rainfall
(mm)Hail (mm) Graupel
(mm)Max. dBZ
GODDARD 251.75 0 0 50
LIN 233.02 0 0 40
NSSL 172.24 0.017 0.042 35
CONTROL 105.71 0 0 48
THOMPSON 200.23 0 0 55
GODDARD 203.71 0 0 40
LIN 210.74 0 0 60
NSSL 172.59 0.11 0.10 53
CONTROL 182.46 0 0 58
THOMPSON 310.62 0 0 60
GODDARD 232.05 0 0 60
LIN 207.13 0 0 58
NSSL 152.43 0.002 0.13 60
CONTROL 258.75 0 0 60
THOMPSON 237.07 0 0 55
1. HUDHUD
2. PHAILIN
3. LEHAR

TAYLOR DIAGRAMTAYLOR DIAGRAM
● The Taylor diagrams are drawn based on standard deviation and correlation of CSLP and MSW from the sensitivity experiments at 72h forecast using NCAR Command Language (NCL). Taylor diagram summarizes multiple aspects of model performance in a single diagram.
2.PHAILIN 3.LEHAR
1.HUDHUD

MSW VERIFICATIONMSW VERIFICATION
● Simulated Maximum Sustained Wind (MSW) speed (m/s) from model output is verified with IMD observation (Ash line). MSW is taken as Intensity skill measurement.
Row 1 Row 2 Row 3 Row 40
2
4
6
8
10
12
Column 1
Column 2
Column 3
0 12 24 36 48 60 72 84 96 108 1200
10
20
30
40
50
60
70
LEHAR CYCLONEMaximum Sustained Wind (MSW)
GODDARD
LIN
NSSL
CONTROL
THOMPSON
IMD
Forecast Lead Time (h)
MS
W (
m/s
)
0 12 24 36 48 60 72 84 96 108 120 1320
10
20
30
40
50
60
70
PHAILIN CYCLONE Maximum Sustained Wind (MSW)
GODDARD
LIN
NSSL
CONTROL
THOMPSON
IMD
Forecast Lead Time (h)
MS
W (
m/s
)
0 12 24 36 48 60 72 84 96 108 120 1320
10
20
30
40
50
60
70
HUDHUD CYCLONEMaximum Sustained Wind Speed (MSW)
IMD
GODDARD
LIN
NSSL
CONTROL
THOMPSON
Forecast Lead Time (h)
MS
W (
m/s
)

CYCLONE TRACKSCYCLONE TRACKSModel simulated cyclone tracks varying with different microphysical schemes along with India Met. Dept. observations (black line) for five days.
1. HUDHUD 2. PHAILIN 3. LEHAR
GODDARD (blue line) microphysical scheme produced consistently better track of the each tropical cyclones.
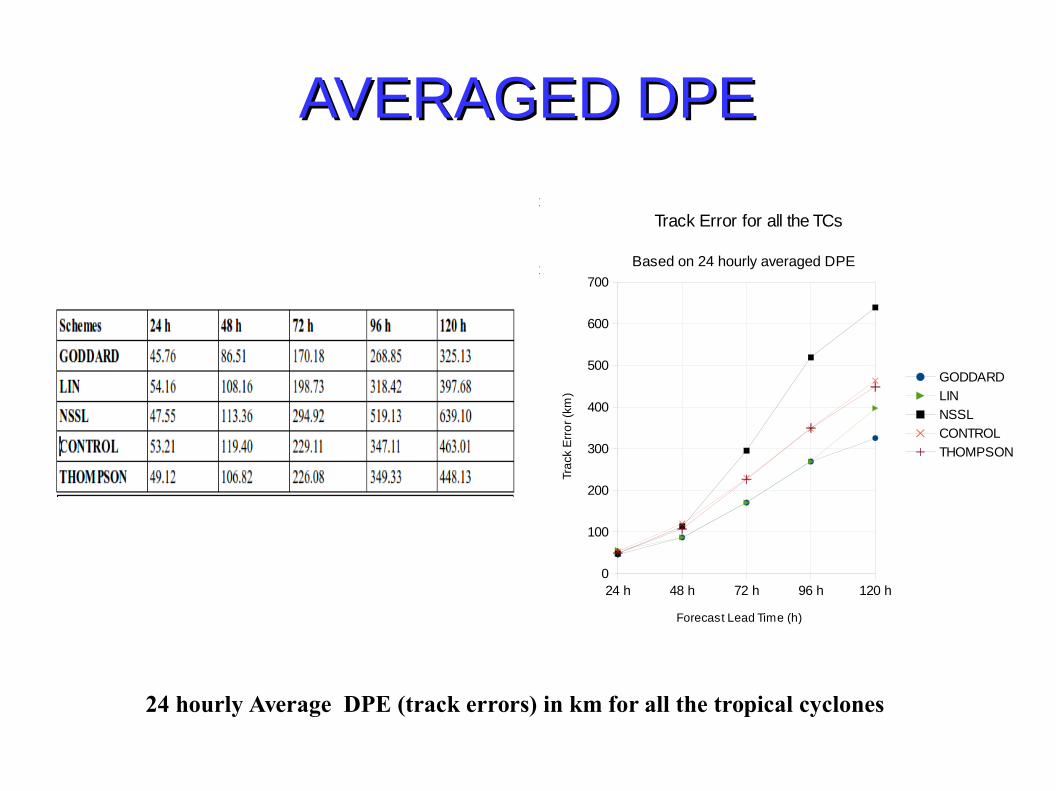
AVERAGED DPEAVERAGED DPE
Row 1 Row 2 Row 3 Row 40
2
4
6
8
10
12
Column 1
Column 2
Column 3
24 h 48 h 72 h 96 h 120 h0
100
200
300
400
500
600
700
Track Error for all the TCs
Based on 24 hourly averaged DPE
GODDARD
LIN
NSSL
CONTROL
THOMPSON
Forecast Lead Time (h)
Tra
ck E
rro
r (k
m)
24 hourly Average DPE (track errors) in km for all the tropical cyclones

RMSE of MSWRMSE of MSW
24 h 48 h 72 h 96 h 120 h0
2
4
6
8
10
12
RMSE of Intensity for all the TCs
Based on 24 hourly averaged RMSE
GODDARD
LIN
NSSL
CONTROL
THOMPSON
Forecast Lead Time (h)
RM
SE
(m
/s)
24 hourly averaged RMSE of MSW (m/s) for all the tropical cyclones

THE SKILL ON TRACKTHE SKILL ON TRACK
24 h 48 h 72 h 96 h 120 h-50
-40
-30
-20
-10
0
10
20
30
Skill Score on Track for all the TCs
Based on 24 hourly averaged DPE
GODDARD
LIN
NSSL
THOMPSON
Forecast Lead Time (h)
Ski
ll S
core
(%
)

THE SKILL IN INTENSITYTHE SKILL IN INTENSITY
24 h 48 h 72 h 96 h 120 h-30
-20
-10
0
10
20
30
40
50
Skill Score in Intensity for all the TCs
Based on 24 hourly averaged RMSE of MSW
GODDARD
LIN
NSSL
THOMPSON
Forecast Lead Time (h)
Ski
ll S
core
(%
)

SUMMARYSUMMARY
ARW model nested with 9 km and 3 km resolutions is evaluated statistically for examining the impact of microphysical schemes on the forecasting skill of track and intensity of very severe cyclonic storms by considering Hudhud (7-13 October, 2014), Phailin (8 -14 October, 2013) and Lehar (24 – 29 November, 2013). The results are summarized below.
1. 15 sensitivity experiments were carried out by varying the microphysics for the three cyclones. The least track error is found to vary from 45.76 km (at 24 h) to 325.16 km (at 120 h) using GODDARD microphysics.
2. The NSSL scheme performed better for the case of Lehar for intensity. All other schemes underestimated the central sea-level pressure (CSLP). This underestimation may be due to imperfectly balanced initial state, coarse grid resolution, and deficiency of model representation of physical processes.
SUMMARYSUMMARY3. The GODDARD scheme consistently performed better and provided highest gain of 14%, 27.54%, 25.72%, 22.54% and 29.78% at 24 h, 48 h, 72 h, 96 h, and 120 h forecasts respectively for the skill score of track.
4. The THOMPSON microphysical scheme provided the highest gain of 44.37%, 26.9%, and 11.91 % at 48 h, 72 h and 120 h forecast respectively for the skill in intensity whereas the GODDARD scheme indicated the highest gain of 18.59% and 8.21% at 24 h and 96 h forecast respectively.
5. The results indicated rapid deepening and over-intensification of tropical cyclones. It may be because all hydrometeors were very large raindrops, and fell out quickly at and near eye-wall region. This would hydrostatically produce the lowest pressure.
6. The variations in cloud microphysics were found to have a significant impact on inner core structure. Stronger storms tend to show more compact eye-walls with heavier precipitation and more symmetric structures in the warm cored eye and in the eye-wall. The vertical profiles of cloud hydrometeors and horizontal distribution of rain bands can be affected by the microphysics.

CONCLUSIONCONCLUSION This study is aimed to investigate the impact of microphysics on the
track and intensity with explicitly resolved convection scheme as it is desirable to resolve the convection with sufficiently high resolution and with the use of explicit cloud physics.
The GODDARD one-moment bulk liquid-ice microphysical scheme provided the highest skill on track.
The THOMPSON scheme indicated the highest skill in intensity at 48h, 96h and 120h whereas at 24h and 72h the GODDARD scheme provided the highest skill in intensity.
This study suggests that the Goddard cumulus ensemble (GCE) microphysical scheme is suitable for high resolution ARW simulation for tropical cyclone's track and intensity over the Bay of Bengal. It is useful for planning real-time predictions using ARW modeling system.
Additional case studies including more comprehensive microphysical sensitivity testing and diagnostics will be considered in future research.
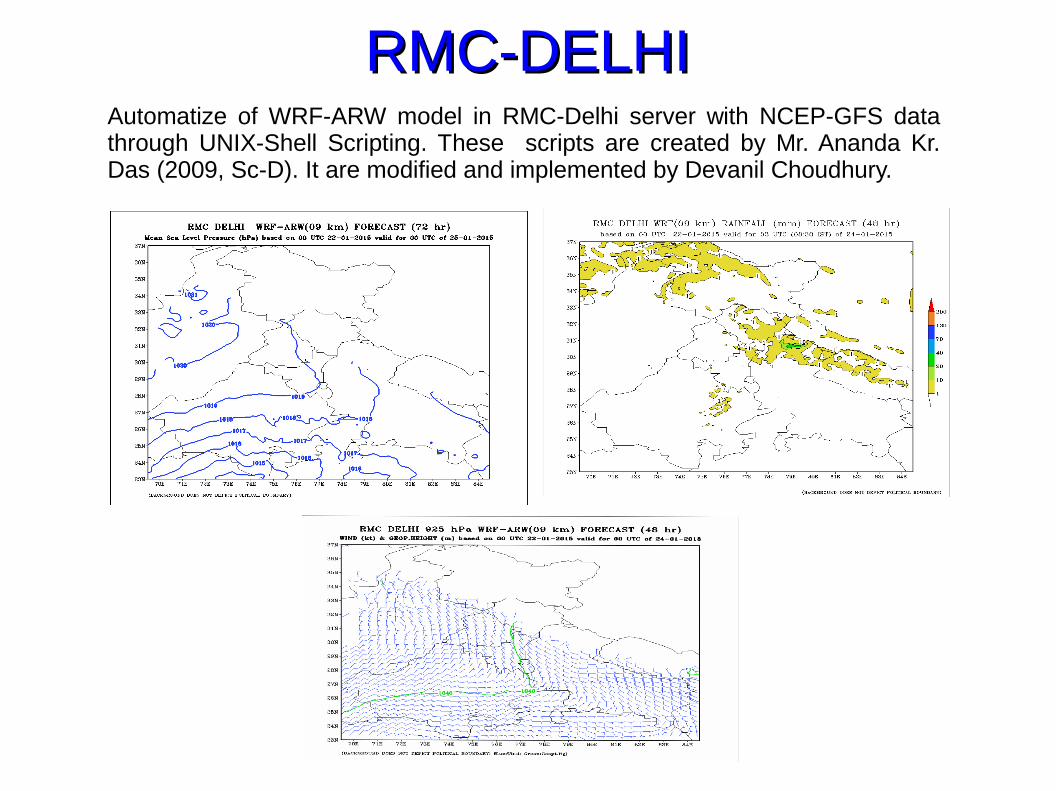
RMC-DELHIRMC-DELHIAutomatize of WRF-ARW model in RMC-Delhi server with NCEP-GFS data through UNIX-Shell Scripting. These scripts are created by Mr. Ananda Kr. Das (2009, Sc-D). It are modified and implemented by Devanil Choudhury.

ACKNOWLEDGEMENTACKNOWLEDGEMENT
It gives me great pleasure to express my heartfelt and profound sense of gratitude to my guide, Dr. Someshwar Das, for his invaluable guidance, constant encouragement and motivation.
I express my sincere gratitude to the Director General of Meteorology Dr. L. S. Rathore and and the Deputy Director General of Meteorology (NWP) Dr. Y. V. Ramarao for providing all the facilities to carry out this research work.
I would also like to express my deep and sincere gratitude to Mr. Ananda Kumar Das and Mr. V. R. Durai Without their additional guidance, this thesis would have never come to fruition.
I would like to acknowledge all the faculty members of Department of Atmospheric Sciences (CUSAT) and whole DAS-CUSAT family for their support and help.
I express my special thanks to all of my friends and whole IMD-NWP division.
Last but not the least I would like to thank my parents, without you none of this would indeed be possible.

REFERENCESREFERENCES
● Cooperative Institute for Research in the Atmosphere. Colorado State University.
https://www.cira.colostate.edu.
● Srinivas CV, Bhaskar Rao DV, Yesubabu V, Baskaran R, Venkatraman B. 2012. Tropical cyclone predictions over the Bay of Bengal using the high-resolution advanced research weather research and forecasting model. Q. J. R. Meteorol. Soc. DOI:10.1002/qj.2064.
● Tao W. K., Shi J. J., Chen s. S., Lang S., Lin P. L., Hong S. Y., Peters-Lidard C., Hou A. 2010. The Impact of Microphysical Schemes on Intensity and Track of Hurricane. Special issue of the Asia-Pacific Journal of Atmospheric Sciences (APJAS).
● Yang, M.-J. and L. Ching, 2005: A modeling study of Typhoon Toraji (2001): Physical parameterization sensitivity and topographic effect. TAO, 16, 177-213.

THANK YOU FOR YOUR PRECIOUS THANK YOU FOR YOUR PRECIOUS PRESENCE AND ATTENTIONPRESENCE AND ATTENTION