Embed Size (px)
Citation preview
Motion and Time Study
The Goals of Motion Study
• Improvement• Planning / Scheduling (Cost)• Safety
Know How Long to Complete Task for
• Scheduling (Sequencing)• Efficiency (Best Way)• Safety (Easiest Way)
How Does a Job Incumbent Spend a Day
• Value Added vs. Non-Value Added
The General Strategy of IE to Reduce and Control Cost
• Are people productive ALL of the time ?• Which parts of job are really necessary ?• Can the job be done EASIER, SAFER and
FASTER ?• Is there a sense of employee involvement?
Some Techniques of Industrial Engineering
• Measure– Time and Motion Study– Work Sampling
• Control– Work Standards (Best Practices)– Accounting – Labor Reporting
• Improve– Small group activities
Time Study
• Observation– Stop Watch– Computer / Interactive
• Engineering Labor Standards (Bad Idea)• Job Order / Labor reporting data
History
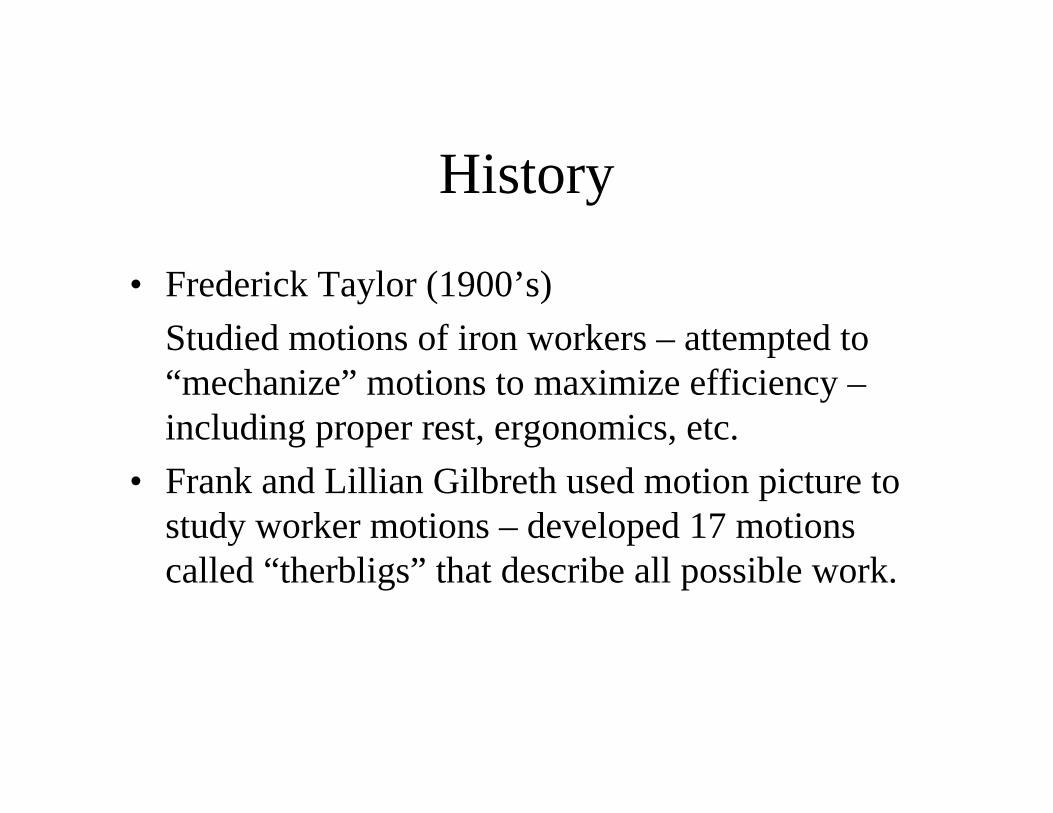
• Frederick Taylor (1900’s)Studied motions of iron workers – attempted to “mechanize” motions to maximize efficiency –including proper rest, ergonomics, etc.
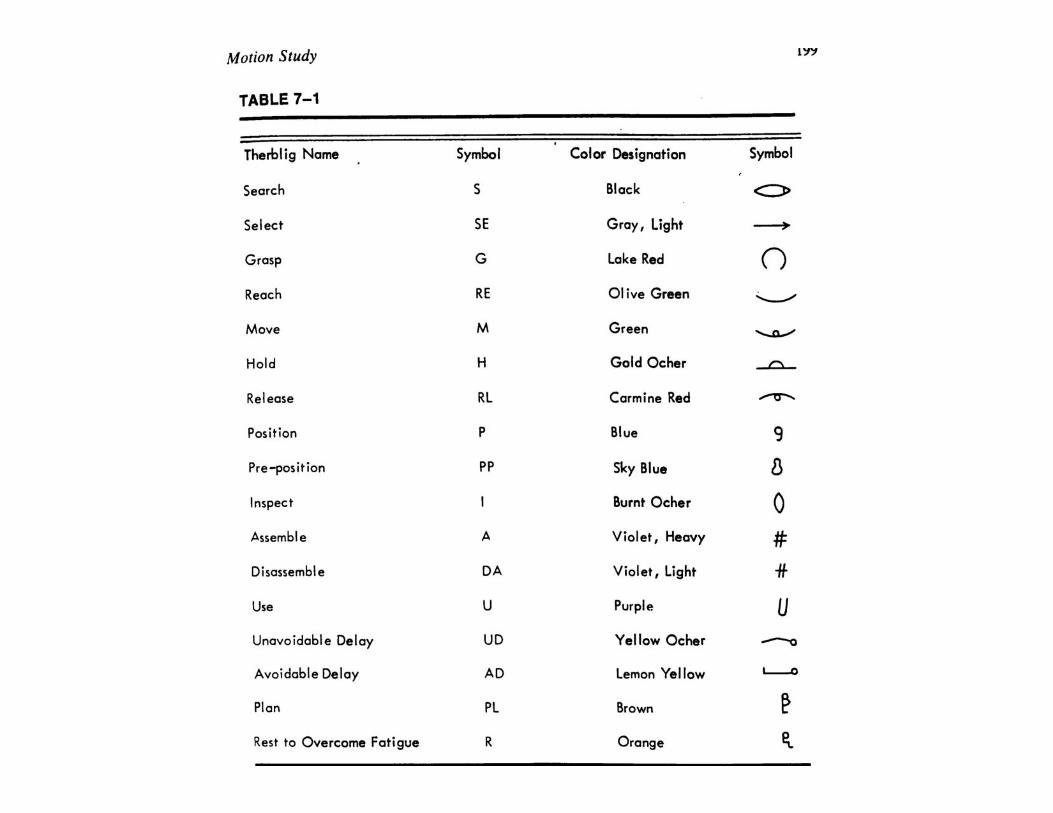
• Frank and Lillian Gilbreth used motion picture to study worker motions – developed 17 motions called “therbligs” that describe all possible work.
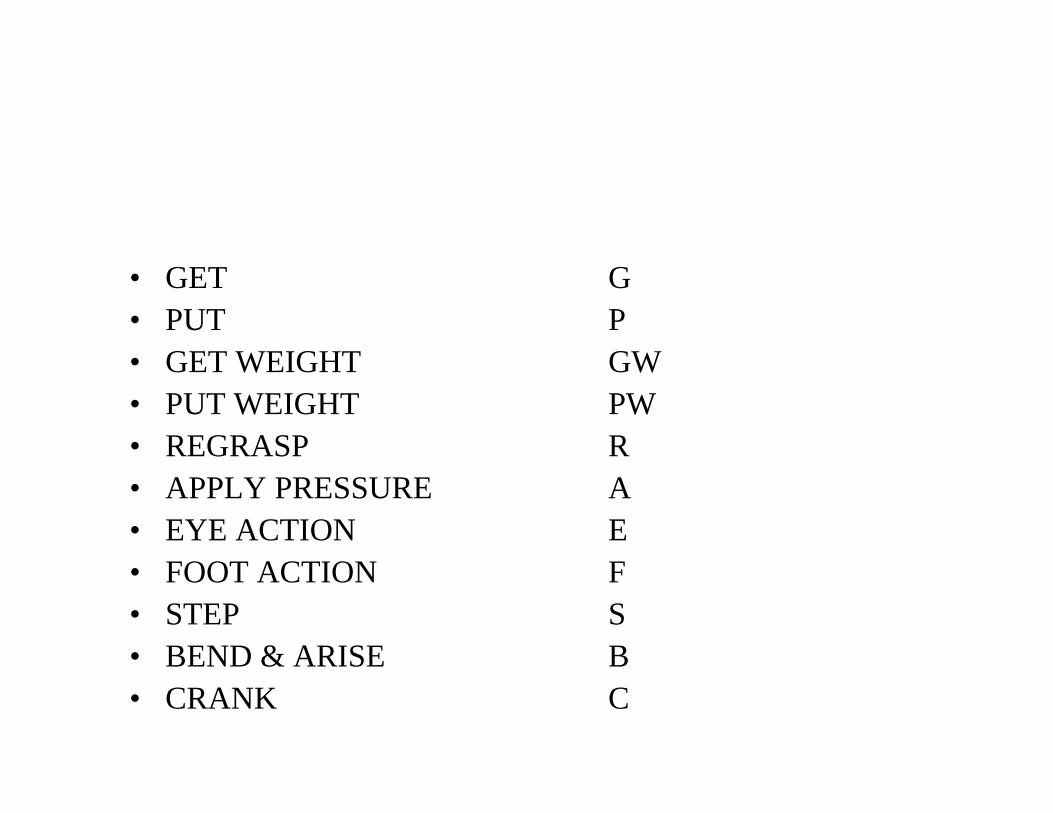
• GET G• PUT P• GET WEIGHT GW• PUT WEIGHT PW• REGRASP R• APPLY PRESSURE A• EYE ACTION E• FOOT ACTION F• STEP S• BEND & ARISE B• CRANK C
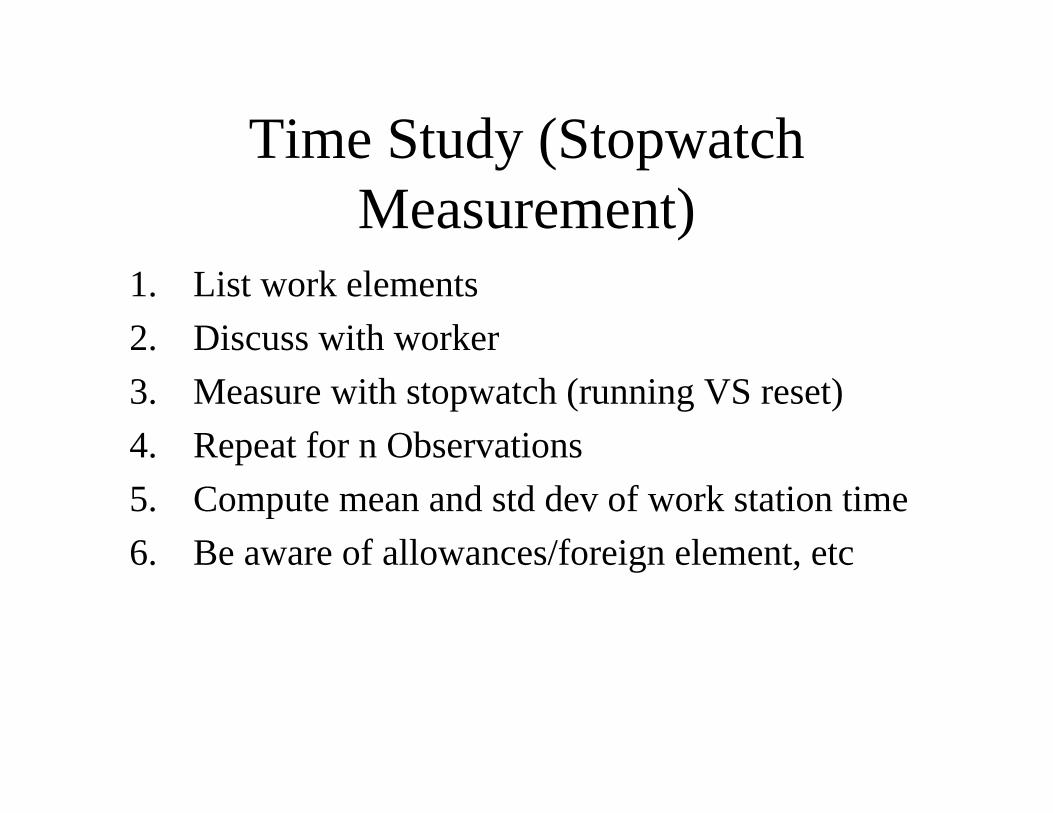
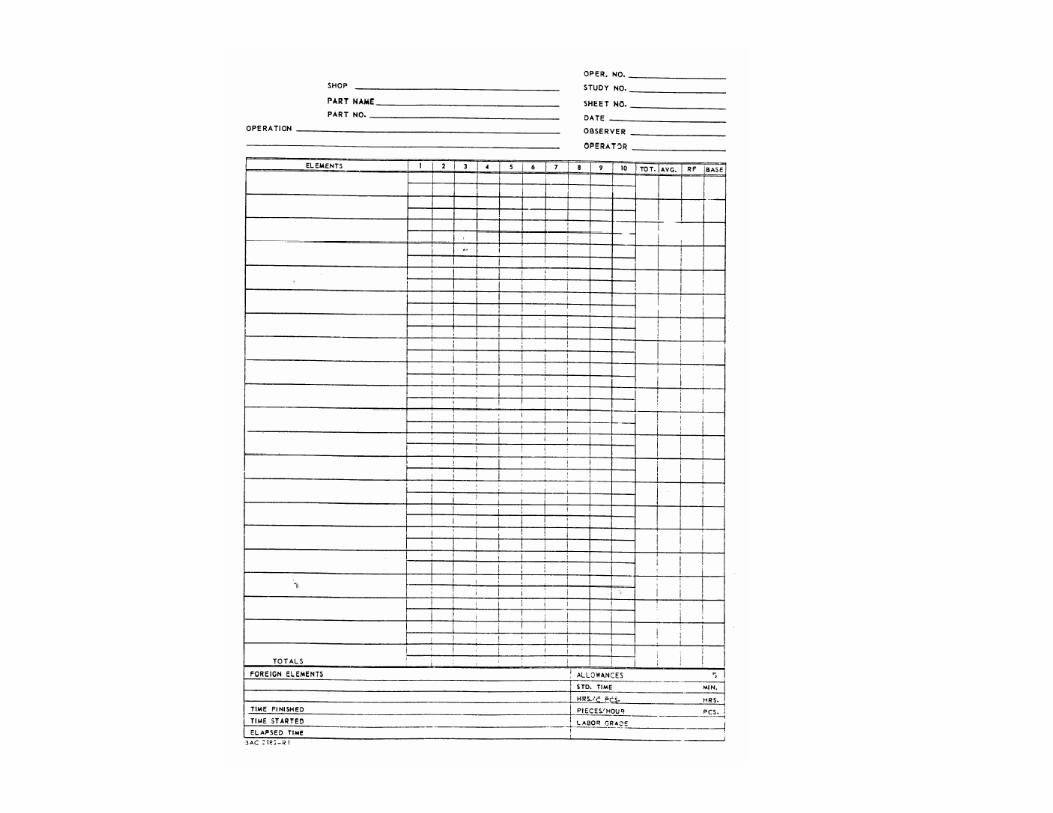
Time Study (Stopwatch Measurement)
1. List work elements2. Discuss with worker3. Measure with stopwatch (running VS reset)4. Repeat for n Observations5. Compute mean and std dev of work station time6. Be aware of allowances/foreign element, etc
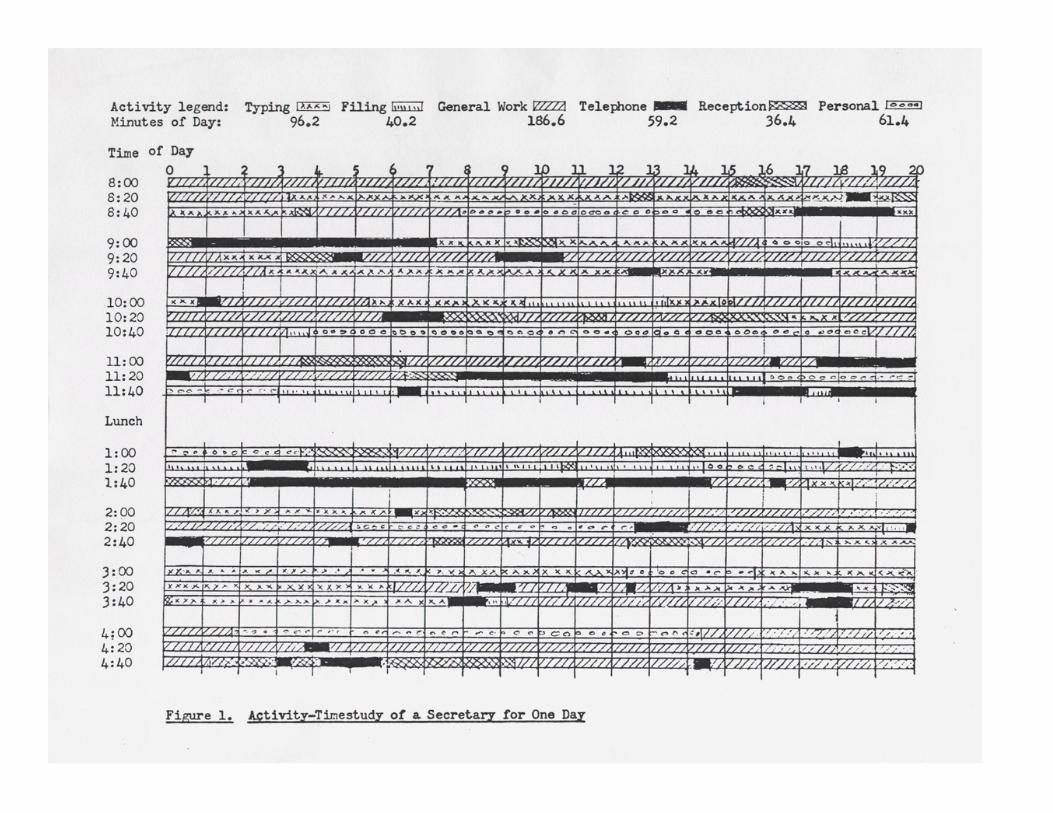
Work Sampling
• Determined what is done over typical day• Random Reporting• Periodic Reporting
Learning Curve
• For repetitive work, worker gains skill, knowledge of product/process, etc over time
• Thus we expect output to increase over time as more units are produced over time to complete task decreases as more units are produced
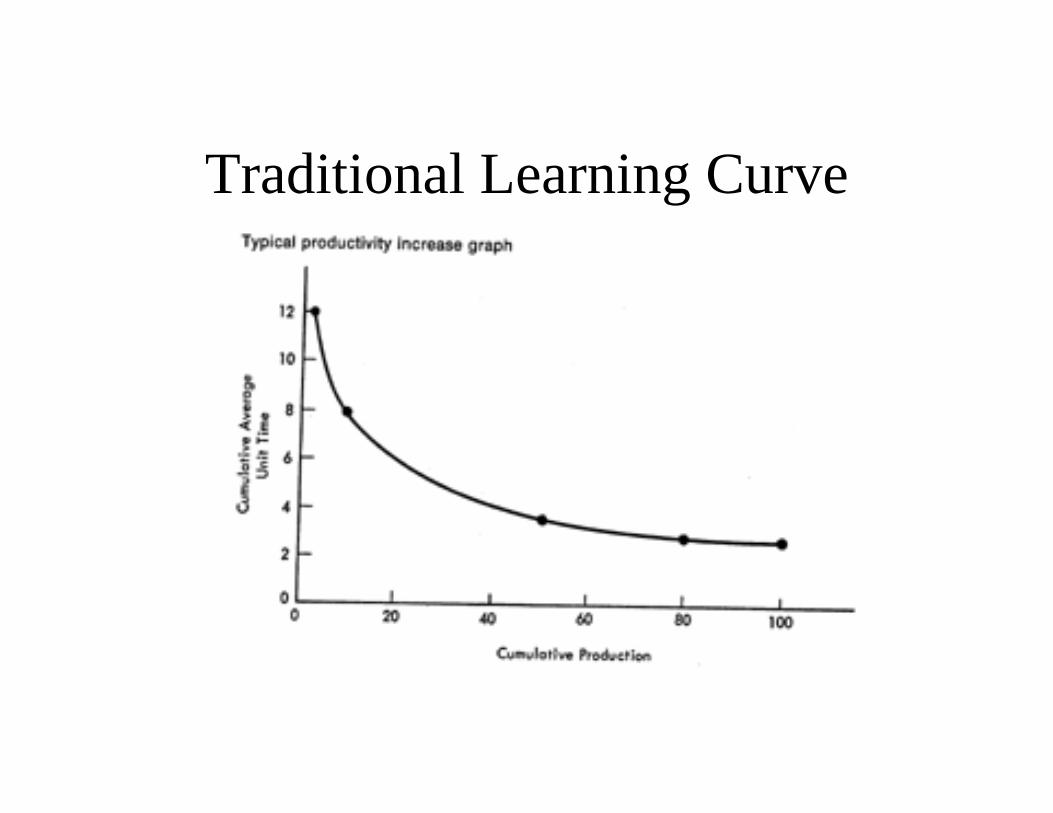
Traditional Learning Curve
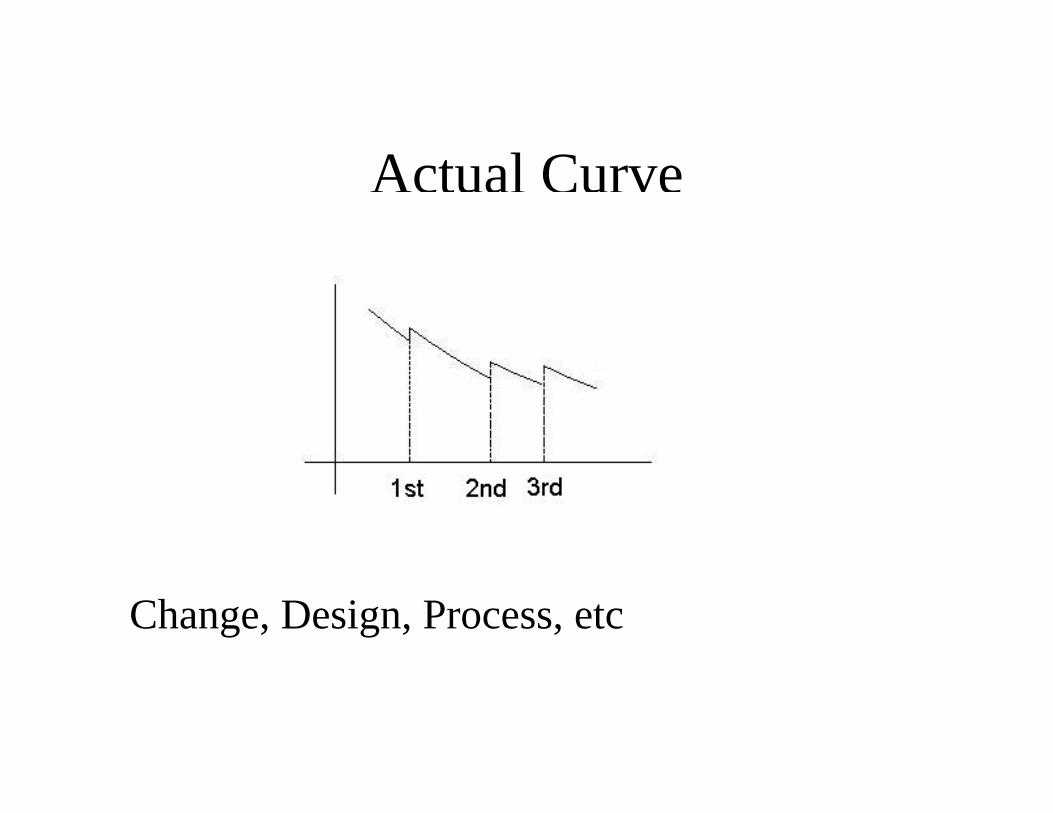
Actual Curve
Change, Design, Process, etc
Learning Curve
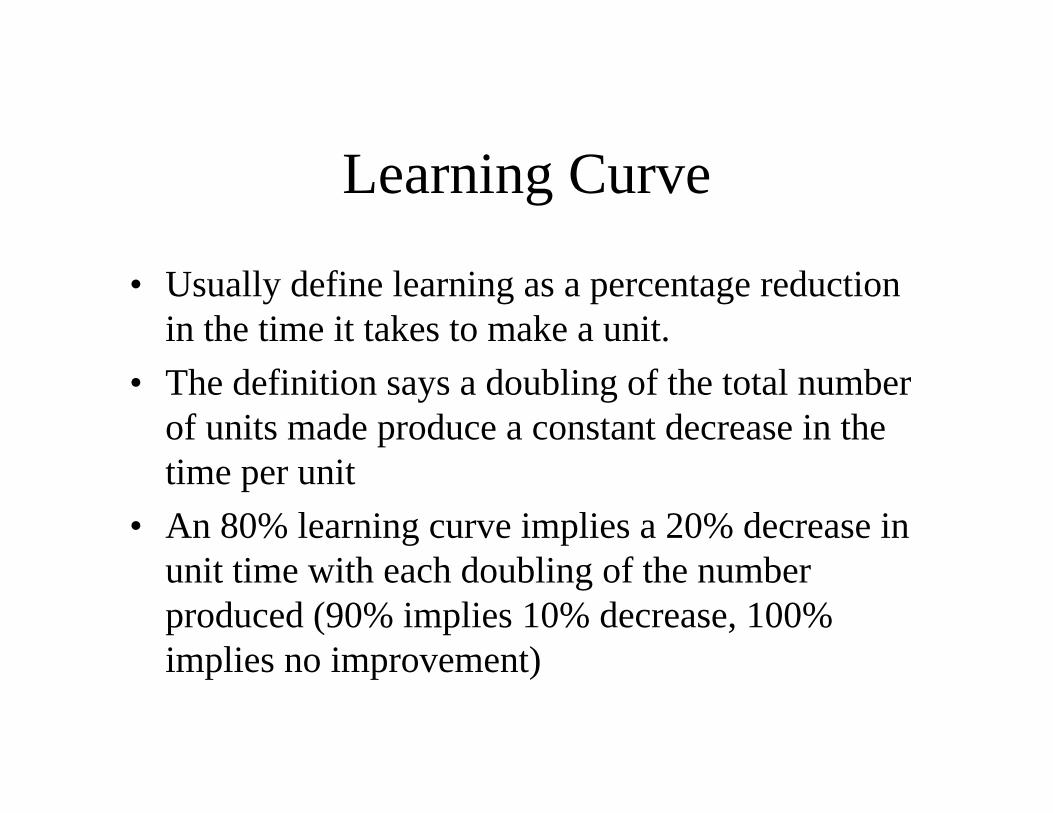
• Usually define learning as a percentage reduction in the time it takes to make a unit.
• The definition says a doubling of the total number of units made produce a constant decrease in the time per unit
• An 80% learning curve implies a 20% decrease in unit time with each doubling of the number produced (90% implies 10% decrease, 100% implies no improvement)
Learning Curve
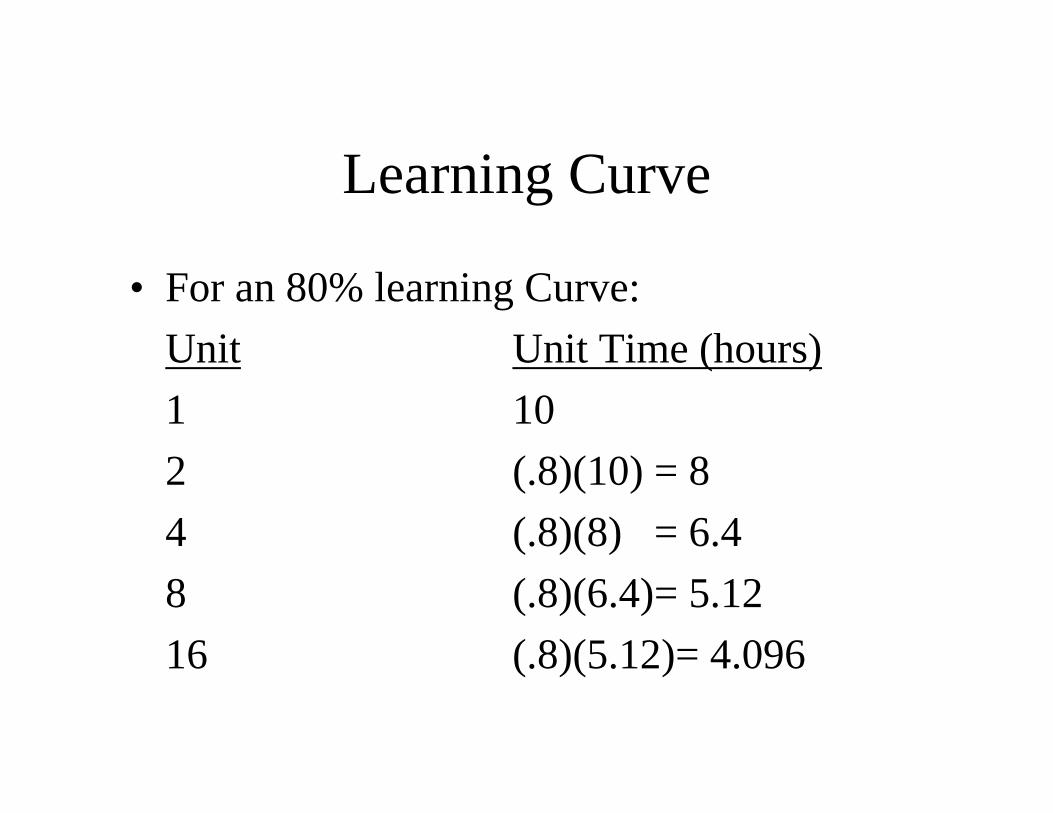
• For an 80% learning Curve:Unit Unit Time (hours)1 102 (.8)(10) = 84 (.8)(8) = 6.48 (.8)(6.4)= 5.1216 (.8)(5.12)= 4.096
Learning Curve
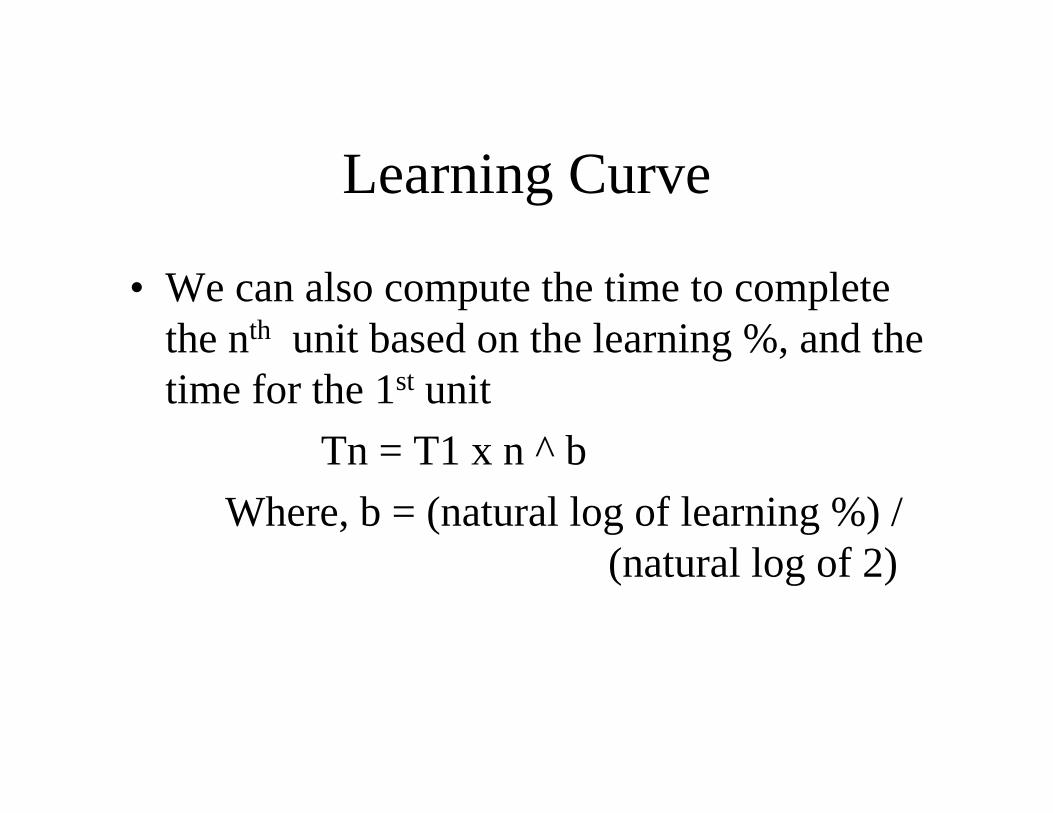
• We can also compute the time to complete the nth unit based on the learning %, and the time for the 1st unit
Tn = T1 x n ^ bWhere, b = (natural log of learning %) /
(natural log of 2)
Learning Curve
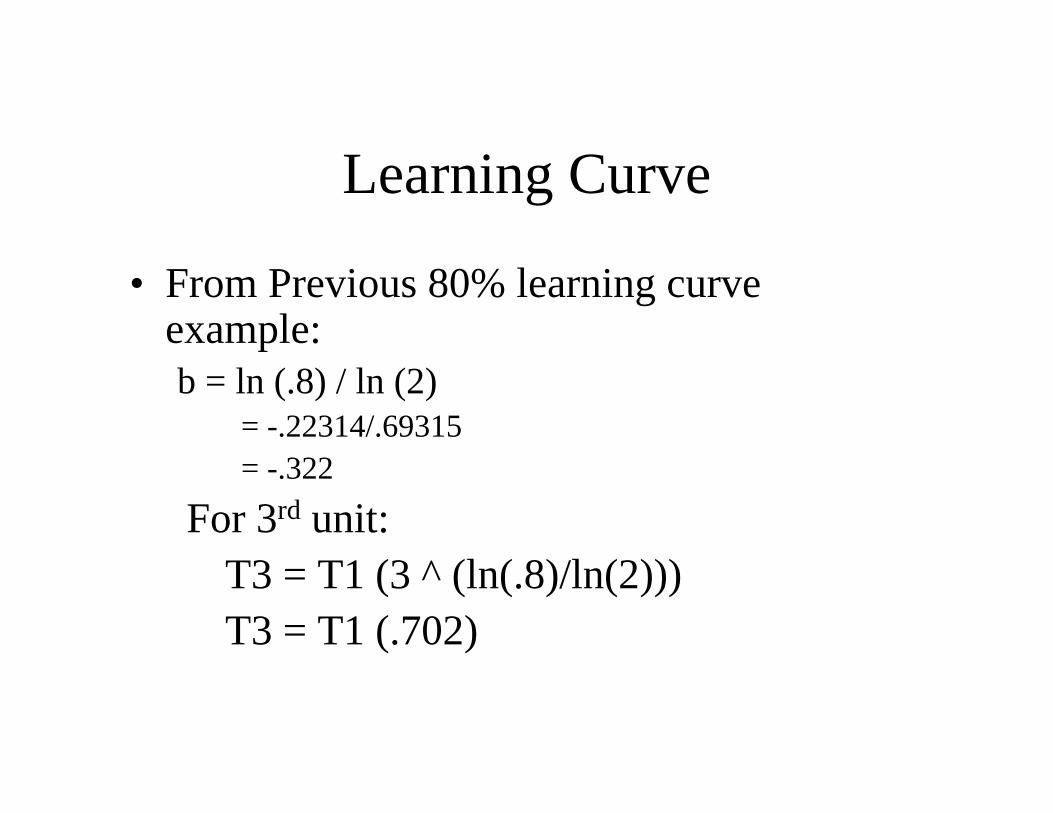
• From Previous 80% learning curve example:b = ln (.8) / ln (2)
= -.22314/.69315 = -.322
For 3rd unit:T3 = T1 (3 ^ (ln(.8)/ln(2)))T3 = T1 (.702)
Learning Curve
• Can plot using log/log paper as a straight line and can also got unit curve and average curve
Learning Curve Applies
• Mass Production – Assembly line• G.T. Cell – Repetitive work• Other places where rep. Works performed.