Embed Size (px)
Citation preview

Health Extension Workers Time Motion Study Complemented by In-depth Interviews within Primary Health Care Units in Ethiopia
2015
Report Prepared by HEPCAPS21 project
June 2015, Addis Ababa, Ethiopia
Yale
GLOBA
L H
EALTH LEADERSHIP IN
STITUTE

2
Health Extension Workers’ Time Motion Study Complemented by In-depth Interviews, Ethiopia
Table of Contents
ACRONYMS . . . . . . . . . . . . . . . . . . . . . . . . . . . . . . . . . . . . . . . . . . . . . . . . . . . . . . . . . . . . . . . . . . . . . . . . . . . . . . . . . . . . . . . . . . . . 5
EXECUTIVE SUMMARY . . . . . . . . . . . . . . . . . . . . . . . . . . . . . . . . . . . . . . . . . . . . . . . . . . . . . . . . . . . . . . . . . . . . . . . . . . . . . . . . . . 6
I. BACKGROUND AND RATIONALE. . . . . . . . . . . . . . . . . . . . . . . . . . . . . . . . . . . . . . . . . . . . . . . . . . . . . . . . . . . . . . . . . . . . . . . . . . 8
II. METHODS . . . . . . . . . . . . . . . . . . . . . . . . . . . . . . . . . . . . . . . . . . . . . . . . . . . . . . . . . . . . . . . . . . . . . . . . . . . . . . . . . . . . . . . . . . . . 10
II.A. Sample. . . . . . . . . . . . . . . . . . . . . . . . . . . . . . . . . . . . . . . . . . . . . . . . . . . . . . . . . . . . . . . . . . . . . . . . . . . . . . . . . . . . . . . . . . . . . . . 10
II.B. Data collection, quality assurance, and analysis . . . . . . . . . . . . . . . . . . . . . . . . . . . . . . . . . . . . . . . . . . . . . . . . . . . . . . . . . . 14
III. TIME MOTION STUDY RESULTS. . . . . . . . . . . . . . . . . . . . . . . . . . . . . . . . . . . . . . . . . . . . . . . . . . . . . . . . . . . . . . . . . . . . . . . . . . 17
III.A. Sample description . . . . . . . . . . . . . . . . . . . . . . . . . . . . . . . . . . . . . . . . . . . . . . . . . . . . . . . . . . . . . . . . . . . . . . . . . . . . . . . . . . . . .17
III.B. Training of HEWs . . . . . . . . . . . . . . . . . . . . . . . . . . . . . . . . . . . . . . . . . . . . . . . . . . . . . . . . . . . . . . . . . . . . . . . . . . . . . . . . . . . . . . .17
III.C. Seasonal activities. . . . . . . . . . . . . . . . . . . . . . . . . . . . . . . . . . . . . . . . . . . . . . . . . . . . . . . . . . . . . . . . . . . . . . . . . . . . . . . . . . . . . 19
III.D. Number of work days and observed time spent on various activities by HEWs. . . . . . . . . . . . . . . . . . . . . . . . . . . . . . . .20
III.E. Proportion of HEW observed time spent on different activities . . . . . . . . . . . . . . . . . . . . . . . . . . . . . . . . . . . . . . . . . . . . . . 24
III.F. Proportion of HEWs observed time spent on providing health education or services by location, type of service, and type of care (preventive/curative) . . . . . . . . . . . . . . . . . . . . . . . . . . . . . . . . . . . . . . . . . . . . . . . . . . . . . . . . . . . . . . . . . . . . 28
IV. IN-DEPTH INTERVIEW RESULTS. . . . . . . . . . . . . . . . . . . . . . . . . . . . . . . . . . . . . . . . . . . . . . . . . . . . . . . . . . . . . . . . . . . . . . . . . . 31
IV.A. Description of the sample: key informants and woredas. . . . . . . . . . . . . . . . . . . . . . . . . . . . . . . . . . . . . . . . . . . . . . . . . . . . 31
IV.B. Recurrent themes from all woredas . . . . . . . . . . . . . . . . . . . . . . . . . . . . . . . . . . . . . . . . . . . . . . . . . . . . . . . . . . . . . . . . . . . . . . 32
IV.C. Themes from higher performing woredas. . . . . . . . . . . . . . . . . . . . . . . . . . . . . . . . . . . . . . . . . . . . . . . . . . . . . . . . . . . . . . . . . 37
IV.D. Themes from lower performing woredas . . . . . . . . . . . . . . . . . . . . . . . . . . . . . . . . . . . . . . . . . . . . . . . . . . . . . . . . . . . . . . . . . 39
IV.E. Summary of interview results. . . . . . . . . . . . . . . . . . . . . . . . . . . . . . . . . . . . . . . . . . . . . . . . . . . . . . . . . . . . . . . . . . . . . . . . . . . . 40
V. CONCLUSIONS AND IMPLICATIONS . . . . . . . . . . . . . . . . . . . . . . . . . . . . . . . . . . . . . . . . . . . . . . . . . . . . . . . . . . . . . . . . . . . . . 41
APPENDIX 1. HEW ACTIVITIES CATEGORIZED WITHIN “PROVIDING HEALTH EDUCATION AND SERVICES” . . . . . . . . . . . 43
APPENDIX 2. DISCUSSION GUIDE FOR KEY INFORMANTS INTERVIEW . . . . . . . . . . . . . . . . . . . . . . . . . . . . . . . . . . . . . . . . . . . 46
1 Developing the Long-Term Capability of Ethiopia’s Primary Health Care Platform, 2nd phase (HEPCAPS2) project is implemented by the Harvard T.H. Chan School of Public Health in partnership with JSI Research & Training Institute, Inc. and Yale Global Health Leadership Institute under the guidance of Ethiopia’s Federal Ministry of Health and through funding and technical support from the Bill & Melinda Gates Foundation.

3
Health Extension Workers’ Time Motion Study Complemented by In-depth Interviews, Ethiopia
List of Tables
Table 1. Sample of PHCUs. . . . . . . . . . . . . . . . . . . . . . . . . . . . . . . . . . . . . . . . . . . . . . . . . . . . . . . . . . . . . . . . . . . . . . . . . . . . . . . . . . . . . . . . 11
Table 2. Final Sample of Woredas, Health Centers, and Health Posts . . . . . . . . . . . . . . . . . . . . . . . . . . . . . . . . . . . . . . . . . . . . . . . . 13
Table 3. Performance on five key indicators in lower and higher performing woredas . . . . . . . . . . . . . . . . . . . . . . . . . . . . . . . . . . 14
Table 4. Timeline for HEW observations by PHCU . . . . . . . . . . . . . . . . . . . . . . . . . . . . . . . . . . . . . . . . . . . . . . . . . . . . . . . . . . . . . . . . . 15
Table 5. Descriptive characteristics of study participants (N=44) . . . . . . . . . . . . . . . . . . . . . . . . . . . . . . . . . . . . . . . . . . . . . . . . . . . . . .17
Table 6. Number of HEWs who report participating in trainings in the past 12 months (N=44) . . . . . . . . . . . . . . . . . . . . . . . . . . . . 18
Table 7. Number of HEWs who self-reported participating in seasonal activities in the past 12 months, overall and by urban/rural (N=44) . . . . . . . . . . . . . . . . . . . . . . . . . . . . . . . . . . . . . . . . . . . . . . . . . . . . . . . . . . . . . . . . . . . . . . . . . . . . . . . . . . . . . . . . . . . 19
Table 8. Number of days and amount of HEW time observed by region (N=44) . . . . . . . . . . . . . . . . . . . . . . . . . . . . . . . . . . . . . . . .20
Table 9. Average number of days and amount of HEW time observed by urban and rural setting (N=44) . . . . . . . . . . . . . . . . . 21
Table 10. Average number of days and amount of HEW time observed in lower and higher performing woredas (N=44). . . . 22
Table 11. Average number of days and amount of HEW time observed in lower and higher performing woredas (RURAL ONLY) (N=32) . . . . . . . . . . . . . . . . . . . . . . . . . . . . . . . . . . . . . . . . . . . . . . . . . . . . . . . . . . . . . . . . . . . . . . . . . . . . . . . . . . . . . . . . . . . 23
Table 12. Percentage of HEWs observed time spent on different activities by region (N=44) . . . . . . . . . . . . . . . . . . . . . . . . . . . . . 24
Table 13. Percentage of HEWs observed time spent on different activities by urban and rural setting (N=44) . . . . . . . . . . . . . . 25
Table 14. Percentage of HEWs observed time spent on different activities in lower and higher performing woredas (N=44) . . . . 26
Table 15. Percentage of HEWs observed time spent on different activities in lower and higher performing woredas (RURAL ONLY) (N=32) . . . . . . . . . . . . . . . . . . . . . . . . . . . . . . . . . . . . . . . . . . . . . . . . . . . . . . . . . . . . . . . . . . . . . . . . . . . . . . . . . . . . . . . . . . . 27
Table 16. Time spent providing health education or services by location, service package, and preventive/curative split; overall and by region (N=44) . . . . . . . . . . . . . . . . . . . . . . . . . . . . . . . . . . . . . . . . . . . . . . . . . . . . . . . . . . . . . . . . . . . . . . . . . . . . . . . . . . . . 28
Table 17. Time spent providing health education or services by service package and preventive/curative split in urban and rural settings (N=44) . . . . . . . . . . . . . . . . . . . . . . . . . . . . . . . . . . . . . . . . . . . . . . . . . . . . . . . . . . . . . . . . . . . . . . . . . . . . . . . . . . . . . . . . 29
Table 18. Time spent providing health education or services by location, service package, and preventive/curative split in lower and higher performing woredas (N=44) . . . . . . . . . . . . . . . . . . . . . . . . . . . . . . . . . . . . . . . . . . . . . . . . . . . . . . . . . . . . . . . . . . . 29
Table 19. Time spent providing health education or services by location, service package, and preventive/curative split in lower and higher performing woredas (RURAL ONLY) (N=32) . . . . . . . . . . . . . . . . . . . . . . . . . . . . . . . . . . . . . . . . . . . . . . . . . . . . . . 30
Table 20. Key Informant Interview Sample (N=94 key informants) . . . . . . . . . . . . . . . . . . . . . . . . . . . . . . . . . . . . . . . . . . . . . . . . . . . . 31
List of Figures
Figure 1. Summary of Sampling Method. . . . . . . . . . . . . . . . . . . . . . . . . . . . . . . . . . . . . . . . . . . . . . . . . . . . . . . . . . . . . . . . . . . . . . . . . . . 10
Figure 2. Themes present in both high and low performing woredas . . . . . . . . . . . . . . . . . . . . . . . . . . . . . . . . . . . . . . . . . . . . . . . . . 32
Figure 3. Recurrent themes among higher performing woredas. . . . . . . . . . . . . . . . . . . . . . . . . . . . . . . . . . . . . . . . . . . . . . . . . . . . . . 37
Figure 4. Recurrent themes among lower performing woredas . . . . . . . . . . . . . . . . . . . . . . . . . . . . . . . . . . . . . . . . . . . . . . . . . . . . . . 39

4
Health Extension Workers’ Time Motion Study Complemented by In-depth Interviews, Ethiopia
Acknowledgements
The Developing the Long-Term Capability of Ethiopia’s Primary Health
Care Platform (HEPCAPS) project is funded by a grant from the Bill &
Melinda Gates Foundation to the President and Fellows of Harvard
College/Harvard T.H. Chan School of Public Health. The project
represents a partnership between the Harvard T.H. Chan School of Public
Health, the Yale Global Health Leadership Institute, and JSI Research &
Training Institute, Inc. to work with Ethiopia’s Federal Ministry of Health.
The project would like to extend a special thanks to Ethiopia’s Federal
Ministry of Health, the Regional Health Bureaus, Woreda Health Offices,
hospitals, health centers, health posts, and communities in Addis Ababa,
Amhara, Tigray, Oromia, and Southern Nations, Nationalities, and
People’s Region (SNNPR). Appreciations are forwarded to all of the
Health Extension Workers (HEWs) and interview participants for their
time and patience during the data collection period. Deep appreciation is
forwarded for the data collection team that worked alongside the HEWs
for 21 days and conducted in depth interviews across all levels of the
Primary Health Care Unit (PHCU).
Suggested Citation:
FMOH, HEPCAPS II Project. 2015. Health Extension Workers Time Motion Study Complemented by In-depth Interviews within Primary Health Care Units in Ethiopia. Ethiopian Federal Ministry of Health, Harvard T.H. Chan School of Public Health, Yale Global Health Leadership Institute, JSI Research & Training Institute, Inc.: Addis Ababa, Ethiopia, Boston, Massachusetts, and New Haven, Connecticut.

5
Health Extension Workers’ Time Motion Study Complemented by In-depth Interviews, Ethiopia
Acronyms
ANC Antenatal CareARM Annual Review MeetingART Antiretroviral TreatmentBG Benishangul-GumuzBIC Breakthrough International ConsultancyBOFED Bureau of Finance and Economic DevelopmentBPR Business Process Re-engineeringCBHI Community Based Health InsuranceCDC Center for Disease ControlCHAI Clinton Health Access InitiativeCMAM Community Management of Acute MalnutritionCMH Commission on Macroeconomics and HealthCSA Central Statistical AgencyDP Development PartnerDPT Diphtheria Pertussis TetanusDRS Developing Regional StatesEBP Evidence-Based PlanningEFY Ethiopian Fiscal YearEHIA Ethiopian Health Insurance AgencyEHSP Essential Health Service PackageEPHI Ethiopian Public Health InstituteETB Ethiopian BirrFGD Focus Group DiscussionFGR First Generation ReformFMHACA Food, Medicine and Health Care Administration and Control AgencyFMOH Federal Ministry of HealthFRM Financial Resource Mobilization Directorate (FMOH)FWB Fee Waiver BeneficiariesGBS General Budget SupportGDP Gross Domestic ProductGF Global FundGFATM Global Fund to Fight AIDS, Tuberculosis, and MalariaGGE General Government ExpenditureGMU Grants Management Unit (FMOH)GNI Gross National IncomeGoE Government of EthiopiaGTP Growth and Transformation PlanHC Health CenterHCF Health Care FinanceHCF TWG Health Care Finance Technical Working GroupHCFR Health Care Financing ReformHCFS Health Care Financing StrategyHEP Health Extension ProgramHEW Health Extension WorkerHF Health FacilityHFG/HSFR Health Financing and Governance/Health Sector Financing ReformHH Household(s)HHM HSDP Harmonization ManualHICES Household Income Consumption and Expenditure SurveyHIT Health Information TechnologyHIV/AIDS Human Immunodeficiency Virus/Acquired Immunodeficiency SyndromeHLTF Health Level Task ForceHMIS Health Management Information SystemHP Health Post
HPF Health Performance FundHPN Health Partners NetworkHRH Human Resources for HealthHRIS Human Resource Information SystemHSDP Health Sector Development PlanHSPH Harvard T.H. Chan School of Public HealthHSTP Health Sector Transformation PlanIBEX Integrated Budget and Expenditure (System)ICCM Integrated Community Case ManagementIP Implementing PartnersJANS Joint Assessment of National Health StrategiesJCCC Joint Core Coordinating CommitteeJCF Joint Consultative ForumJFA Joint Financial ArrangementJRM Joint Review Mission KII Key Informant InterviewsMBB Marginal Budgeting for BottlenecksMDG Millennium Development GoalMDG PF MDG Performance FundMOFED Ministry of Finance and Economic DevelopmentMTR Midterm Review NHA National Health AccountsNMEI New Medical Education InitiativeOOP Out-of-pocket OPD Outpatient DepartmentP4R Performance for ResultsPBF Performance-Based FinancingPBS Promotion of Basic ServicesPEPFAR President’s Emergency Plan for AIDS ReliefPFSA Pharmaceutical Fund Supply AgencyPHC Primary Health CarePHCU Primary Health Care UnitPMTCT Prevention of Mother-to-Child TransmissionPNC Postnatal CarePPD Policy and Planning Directorate (FMOH)PPP Public Private PartnershipPW Private WingRBF Results-Based Financing RDF Revolving Drug FundRHB Regional Health BureauRR&U Revenue Retention and UtilizationRTM Resource Tracking and ManagementSCMS Supply Chain Management System SHI Social Health InsuranceSNNPR Southern Nations, Nationalities, and Peoples’ RegionTA Technical AssistanceTB TuberculosisTHE Total Health ExpenditureUHC Universal Health CoverageUN United NationsUSAID United States Assistance for International DevelopmentUSG United States GovernmentWHO World Health OrganizationWMS Welfare Monitoring SurveyWoFED Woreda Office of Finance and Economic DevelopmentWorHO Woreda Health Office
Acronyms

6
Health Extension Workers’ Time Motion Study Complemented by In-depth Interviews, Ethiopia
Executive Summary
Executive SummaryThe purpose of the study was to quantify how health extension workers (HEWs) across selected regions spend their time and to understand relationships between HEWs and the Health Development Army (HDA), health centers, woreda health office, and hospitals.
A total of 22 woredas were selected to represent lower and higher performing woredas (based on 5 health coverage/utilization indictors) in both urban and rural locations across Amhara, Oromia, Southern Nations, Nationalities and Peoples Region (SNNPR), Tigray, and Addis Ababa. In 7 of these woredas, a total of 94 regional/zonal officials, PHCU staff and HDA members underwent in-depth, open-ended interviews pertaining to their roles and experiences. In each of the 22 woredas, 2 HEWs (for a total of 44 HEWs) were observed in detail for a 21-day period (3 weeks) between April and June 2014. The HEWs’ time at work was summarized as providing health education or services (i.e., delivering the 16 HEW service packages, usually in the health post or at the household level); participating in meetings and giving trainings (i.e., attending health and non-health development meetings, delivering had trainings); conducting community mapping and mobilization for upcoming activities; recordkeeping, reporting, managing family folders; managing commodities and supplies; receiving supervision; receiving training; travel between work activities. In addition, some amount of time between the start of the work day and the completion of the work day was spent in an unstructured way, which included time waiting in the health post (or health center in urban settings), building relationships in the community through general conversation, or other time that was not categorized by data collectors into any other activities noted. The classification of HEW time was based on another large time motion study in Ethiopia2, and is consistent with time motion studies of community health workers in other settings.3,4
The HEWs were followed for a full 21 days noting everything they did from the time they began work for the day until they left work for the day. Many schedules were irregular, as HEWs would work on weekends when needed, or work less than full days on certain weekdays. Overall, the average HEW had at least some time at work for 15.5 days out of the 21 day observation period. Most, but not all, of the idle days were weekends. On days when at least some time was spent at work, the hours of work per day (excluding breaks and meals) varied significantly across regions from about 4.5 hours per day and 25 hours per week (in SNNPR) to about 6.5 hours per day and 40 hours per week (Tigray). During the observation period, HEWs in rural settings had more days in which they worked at least some time than HEWs from urban settings (16.2 days and 13.8 days, respectively), including more working hours on the weekend.
Out of the total observed work time, the percentage of total time spent on various activities were as follows: providing health education or services (12.8%); participating in meetings and giving trainings (9.3%); conducting community mapping and mobilization (0.8%); recordkeeping, reporting, managing family folders (13.2%); managing commodities and supplies (1.3%); receiving supervision (3.2%); receiving training (1.6%); travel between work activities (15.5%); waiting for clients in the health post (or health center in urban settings) (24.9%); building relationships in the community (13.3%); and other activities that could not be meaningfully categorized (4%). The breakdown of health education and services by service package was as follows: hygiene and environmental sanitation (30.3%), family health service (44.7%), disease prevention and control (12.4%), non-communicable diseases (0.6%), and other (11.9%). In regard to regional variation in allocation of time, HEWs in Tigray allocated significantly more time to health education and services (17.3%) and participation in community meetings/giving trainings (18.3%) than did HEWs in other regions. HEWs in Addis Ababa spent a greater proportion of time receiving training (5.4%) and building relationships in the community (52.7%) than did HEWs in other regions.
Rural HEWs spent a significantly higher proportion time than their urban counterparts providing health education and services (14.4% vs 8.6%) and waiting for clients in the health post (29.3% vs 13.2%). Urban HEWs spent a greater proportion of their time in unstructured relationship building in the community (27.2% vs 8.2%). Of the time spent providing health education or services, HEWs in rural settings spent significant proportion of their time on curative services (14.2%).
2 Mangham-Jefferies et al., 2014. How do health extension workers in Ethiopia allocate their time? Human Resources for Health 2014, 12:61.3 Bryant M and Essomba RO. 1995. Measuring time utilization in rural health centres. Health Policy and Planning. 10(4): 415-421.4 Odendaal WA and Lewin S. 2014. The provision of TB and HIV/AIDS treatment support by lay health workers in South Africa: a time-and-motion study. Human Resources for Health 2014, 12:18.
7
Health Extension Workers’ Time Motion Study Complemented by In-depth Interviews, Ethiopia
Executive Summary
Distribution of time spent on different activities did not vary significantly between lower and higher performers, even when looking at rural sites only. Although not significant, HEWs from higher performing woredas spent less time waiting for clients in the health post than those from lower performing woredas (21.2% vs 28.6%), and more time in unstructured relationship building with the community (15.6% vs 11.1%). Of the time spent providing health education or services, HEWs from higher performing woredas trended toward spending more time on family health services (50.2% vs 38.1%) and disease prevention and control (14.5% vs 9.9%) than HEWs from lower performing woredas. HEWs from higher performing woredas also showed more focus on curative activities than HEWs from lower performing woredas (15.3% vs 9.7%).
There are few examples of comparable time-motion studies in other country settings, and other published time-motion studies in Ethiopia have relied on self-report and focused on structured, productive time only, but the proportion of HEW’s productive time allocated by service package and location in this study is comparable to other published studies from Ethiopia.5,6,7
The in-depth interviews suggested recurrent themes across woredas: 1) HEWs were motivated by service to the community and demotivated by slow professional career growth and resource limitations 2) HEWs staff faced challenges, and persistence is required to overcome these challenges, 3) community engagement and leadership were critical to HEW success, 4) hospitals were poorly connected to health centers; connections among health center, woreda health office, and HEWs varied across the woredas, and 5) the urban health extension program was viewed by staff across the PHCU as not meeting urban health needs.
In higher performing woredas, PHCU staff had many examples of successes in latrine construction, skilled birth attendance, and overall community engagement. Strong collaboration was apparent among the HDAs, kebele councils, HEWs, and health centers. Active use of data for problem solving was noted, supported by routine procedures to monitor and improve performance. HEWs were well respected by the community, and cross-sectoral coordination (e.g., agriculture, education) efforts were viewed positively, as part of promoting the overall health of the community.
In lower performing woredas, community support for the HEWs was reported to be weak with poor overall engagement of HEWs with the community.
Several broad conclusions can be drawn from this study. First, some woredas have been successful in the strong integration of services into the community through collaborative and positive relationships among the HEW, HDA, health posts, and health centers. In lower performing woredas, these relationships were described as limited. Second, even in top performing woredas, hospitals were generally poorly connected to health centers and HEWs. Third, The HEWs spent substantial portions of their time waiting for clients, which may suggest a need for greater community mobilization (demand generation). Last, HEWs spend substantial portions of their time in the community on relationship building activities, and this was more common among higher-performing PHCUs.
Implications of the study are several. First, the HEW model has been successful in many woredas, and their allocation of time did not differ significantly between higher- and lower- performing PHCUs. Second, cross-woreda alliances may be a useful approach to promote collaboration and sharing of best practices between higher and lower performing rural woredas. Third, greater community mobilization and demand generation by the HDA may improve HEW efficiency and impact. Last, participants in this study perceived that tailoring of health extension platform to urban settings would improve service.
5 Center for National Health Development in Ethiopia. 2008. Ethiopia Health Extension Program Evaluation Study, 2005-2007, Volume II. HEWs’ Performance Study. Addis Ababa, Ethiopia: Center for National Health Development in Ethiopia. 6 Marchant, T (2013) Maternal and newborn health care. Baseline findings from Ethiopia. Interactions between families and frontline workers (their frequency, quality, and equity), and coverage of interventions for mothers and newborns. Project Report.7 Miller NP, et al., 2014. Integrated Community Case Management of Childhood Illness in Ethiopia: Implementation Strength and Quality of Care. Am. J. Trop. Med. Hyg., 91(2), 2014, pp. 424–434.

8
Health Extension Workers’ Time Motion Study Complemented by In-depth Interviews, Ethiopia
Background and Rationale
I. Background and RationaleGiven the extensive deployment of HEWs to support Ethiopia’s primary care system, understanding how their time is spent is a critical element of evaluating current contributions and identifying opportunities for redesigning aspects of the position to improve HEW satisfaction, preparation, and effectiveness. Anecdotal evidence suggests that HEWs are overburdened, and the burden is expected to increase as the package of basic curative services offered at the health post level continues to expand.
Globally, several time motion studies of facility-based healthcare professionals have been reported; however, the number of comprehensive time motion studies of community based health workers, such as Ethiopia’s HEWs, are limited. A 1995 study8 of the time allocation of health workers in rural health centers in Cameroon revealed that only 27% of health workers’ time was spent on productive, health-related activities, and the majority of waiting/inactive time was spent waiting for patients. In the Cameroon study, productive time included performing administrative tasks, clinical work, promotion/prevention services, and maintaining general hygiene in the health center. Waiting/inactive time included social visits, waiting for patients, tea/lunch breaks, and explained/unexplained absences. A 2014 study9 of community health workers in peri-urban settings in South Africa found that even in very efficient, structured outreach, workers spent an average of 46% of their time in contact with patients and community members. The other time was spent walking, waiting, attempting to locate patients, and completing reports.
In Ethiopia, four previous studies of HEW time allocation have been conducted. The Ethiopia Health Extension Program Evaluation Study, a large-scale evaluation conducted from 2005 to 2007,10 used dairies kept by 63 HEWs in Amhara, Oromia, and SNNP regions over a two-week period. Results from this study showed that HEWs work for an average of 8.1 hours per day, with about 25% of their time spent at the health post, 35% spent at the community level, 19% spent at the household level, 17% spent outside their village, and 5% unspecified (average for all regions). With regard to HEP services, HEWs were on average spending 18% of their time on family health, 17% on hygiene and sanitation, 10% on disease prevention/control, 21% on supervision and education, 16% on travel, 13% on information exchange and communication, and 5% on personal activities. This study did not capture detail on HEW participation in community meetings, receipt of training and supervision, administrative tasks such as recordkeeping and managing supplies, or unstructured time spent building relationships or waiting for clients.
The IDEAS baseline study11 also assessed self-reported time allocation estimates from 42 HEWs in Amhara, Oromia, SNNP, and Tigray regions. On average, HEWs reported spending the majority of their time promoting water and sanitation issues, disease management, and essential newborn care. In the published project report, study authors did not report on time spent outside of direct provision of health services and education.
A recently published12 study of Save the Children’s Community-based Interventions for Newborns (COMBINE) trial sites summarized self-reported activities using diaries for 131 HEWs working in 69 COMBINE project sites in Oromia and SNNP over a median of 19 days per HEW. The HEWs reported working an average of 7 hours and 49 minutes on each workday. While at work, they accounted for approximately 5 hours (64%) of their time excluding breaks/meals, and 30% of their time was unaccounted for. On average HEWs in COMBINE sites spent 16% of their time on curative health activities, 39% on preventive health activities, 11% on travel, and 35% on other activities including training and supervision, administration, and community meetings/activities. The data collection tool from the COMBINE study was adapted for use in the present study.
8 Bryant M and Essomba RO. 1995. Measuring time utilization in rural health centres. Health Policy and Planning. 10(4): 415-421.9 Odendaal WA and Lewin S. 2014. The provision of TB and HIV/AIDS treatmentsupport by lay health workers in South Africa:a time-and-motion study. Human Resources for Health 2014, 12:18.10 Center for National Health Development in Ethiopia. 2008. Ethiopia Health Extension Program Evaluation Study, 2005-2007,Volume II. HEWs’ Performance Study. Addis Ababa, Ethiopia: Center for National Health Development in Ethiopia.11 Marchant, T (2013) Maternal and newborn health care. Baseline findings from Ethiopia. Interactions between families and frontline workers (their frequency, quality, and equity), and coverage of interventions for mothers and newborns. Project Report.12 Mangham-Jefferies et al., 2014. How do health extension workers in Ethiopiaallocate their time?Human Resources for Health 2014, 12:61.

9
Health Extension Workers’ Time Motion Study Complemented by In-depth Interviews, Ethiopia
Background and Rationale
A more recent study in Oromia13 also relied on self-reported time allocations of 201 HEWs (including HEWs trained in integrated community case management (iCCM) and a comparison HEW group who had not had the iCCM training). HEWs in the iCCM intervention reported spending an average of 6.1 hours per day at work. On average, they spent 4 hours providing services in the health post, 30 minutes providing services in the community, and 1 hour on community mobilization/awareness, representing a much greater proportion of time spent in the health post than the HEWs in the current study, as documented in the results section of this report. HEWs in the comparison group had fewer sick child visits per day and reported spending less time in the health post and more time in the community.
The present study, Health Extension Workers Time Motion Study Complemented by In-depth Interviews within Primary Health Care Units in Ethiopia, was designed to improve on the previous literature in three ways. First, it sought to enhance the validity of the data by using direct observation and using more detailed data collection tools for extended time periods of HEW work, rather than relying on self-reported diaries as done in the previous Ethiopian studies. Second, the data were collected for urban and rural woredas within diverse regions, as well as for higher and lower performing woredas within regions for a broader sample of experience. Third, based on its mixed methods approach, the study provided greater perspective on the nature of interactions among HEWs, health centers, hospitals, and woreda health offices in the defined catchment areas of approximately 100,000 people, affording additional insight concerning the HEW time allocations within the larger context of the PHCU.
The goals of the present study were to:
· Estimate how HEWs spend their time, and assess differences in time allocations between urban and rural woredas and between higher and lower performing woredas.
· Understand the relationships among HEWs, communities including the Health Development Army (HDA), health centers, and woreda health offices, as well as between health centers and hospitals, and characterize differences between urban and rural woredas and between lower and higher performing woredas.
13 Miller NP, et al., 2014. Integrated Community Case Management of Childhood Illness in Ethiopia: Implementation Strength and Quality of Care. Am. J. Trop. Med. Hyg., 91(2), 2014, pp. 424–434.

10
Health Extension Workers’ Time Motion Study Complemented by In-depth Interviews, Ethiopia
Methods
II. Methods
II.A. Sample
The time motion study was conducted among 44 HEWs (22 pairs) selected from 22 PHCUs/woredas (Table 1).14 PHCUs were selected to be diverse in region (Oromia, Tigray, SNNP, Amhara and Addis Ababa City Administration), setting (urban/rural), and performance (high/low). Although the number of HEWs examined was small relative to the several thousand working in Ethiopia, their selection resulted from a rigorous sampling methodology such that the data pertaining to their time allocations can be reliably generalized to the sampling frames from which the 44 HEWs were selected. Figure 1 shows a summary of the sampling method.
Figure 1. Summary of Sampling Method
Create sampling frames: List all woredas in each of the 4 regions + Addis Ababa, separate by urban and rural
Rank each woreda on 5 indicators using 2012-2013 HMIS data (ANC, SBA, Complete Immunization, Latrine Coverage, Model Families). For each indicator, woredas in the lowest quartile receive a score of 1, second quartile a score of 2, and so on. Sum the
scores across all 5 indicators to give each woreda a summary performances index (SPI) ranging from 5 (poor) to 20 (good). Use the SPI to identify the top and bottom 5% in performance in each sampling frame
Randomize the top and bottom 5% in each sampling frame
Select woredas from the top of each randomized list; confirm selection with local authorities
Rural PHCUs
Identify the highest (lowest) performing health center in the selected woreda by creating a summary score across the
same 5 indicators used in woreda selection
Identify the highest (lowest) performing health post in the selected woreda by creating a summary score across the
same 5 indicators used in woreda selection
Recruit HEWs in pairs from the selected health post. If a post has only one HEW, move to the next highest (lowest)
health post
Confirm final selection with local and regional authorities
Ask local authorities to identify the best (worst) performing HEW pair in the selected health center
Urban PHCUs (no health posts)
Identify the highest (lowest) performing health center in the selected woreda by creating a summary score across the
same 5 indicators used in woreda selection
14 In this report, we use the acronym HEW to refer to both health extension workers in rural settings and health extension professionals (HEPs) in urban settings.

11
Health Extension Workers’ Time Motion Study Complemented by In-depth Interviews, Ethiopia
Methods
Table 1. Sample of PHCUs
Region Urban (n=6) Rural (n=16) Number of PHCUs/woredas
Addis Ababa 1 Higher and 1 Lower Performer
N/A 2
Oromia1 Higher and 1 Lower Performer
2 Higher and 2 Lower Performers
5
SNNP 2 Higher and 2 Lower Performers
5
Tigray1 Higher and 1 Lower Performer
2 Higher and 2 Lower Performers
5
Amhara 2 Higher and 2 Lower Performers
5
TOTAL 22 PHCUs
Selection of the PHCU Sample
Within each region (Oromia, SNNP, Tigray, and Amhara), woredas were classified as urban or rural based on national designations. A total of 7 sampling frames (i.e., lists of woredas) were created: 1) Addis woredas, 2) Oromia and SNNP urban woredas, 3) Tigray and Amhara urban woredas, 4) Oromia rural woredas, 5) SNNPR rural woredas, 6) Tigray rural woredas, and 7) Amhara rural woredas.
Within each sampling frame, woredas were ranked on their performance using the 2012/2013 Health Management Information System (HMIS) performance report (reported as baseline in the 2012/2013 woreda-based plan). For each woreda, a summary performance index (SPI) was calculated based on performance in five indicators: 1) antenatal care coverage rate (1 visit), 2) skilled birth attendance rate, 3) infant complete immunization rate, 4) percentage of woreda with latrine, and 5) percentage of families certified as “model families.”
The SPI was calculated as follows. Woredas were assigned a quartile rank (1, 2, 3, and 4) within their sampling frame, where a rank of 4 mean the woreda was in the quartile of highest performance, and a rank of 1 meant the woreda was in the quartile of lowest performance, compared to all woredas within the sampling frame for the selected indicator. Then for each woreda, the quartile assignments were summed across the 5 indicators, so that each woreda was given an SPI, which ranged from 5 (lowest performance) to 20 (highest performance).
Woredas in the top 5% SPIs for their sampling frame were classified as high performing PHCUs, and the woredas in the bottom 5% SPIs for their sampling frame were classified as low performing PHCUs. The top and bottom 5% of woredas for each sampling frame were then randomized and the top of each randomized list was the recommended woreda for selection in consultation with local authorities, who were asked for any additional information on performance. In some cases, a recommended woreda was in the same zone as a woreda that had already been selected. In these cases, the second woreda from the zone was skipped and replaced with the next woreda from a novel zone in the randomized list. In Oromia, several sites were skipped based on local authority feedback on performance. Regional health bureau officials accepted the final list of study woredas prior to data collection. The selected woredas, health centers, and health posts are listed in Table 2. The performance of the lower and higher performing woredas is compared in Table 3.
Selection of HEWs for Observation
Within the selected higher performing woredas, the highest performing health center based on 2012/2013 performance in the same 5 indicators was selected. In 7 cases, the ranking was based on 3 of the 5 indicators as data were missing for the other 2 indicators. For each selected health center, the top performing health post connected with the selected health center was then selected using the same indicators and approach. Both HEWs at this highest performing health post were followed. In 3 health centers each in SNNP, Amhara, and Tigray, a health post was excluded because it had fewer than 2 HEWs, and 1 health post in Oromia was excluded because the woreda claimed the HEW did not have high performance.

12
Health Extension Workers’ Time Motion Study Complemented by In-depth Interviews, Ethiopia
Methods
All of the selected health posts had 2HEWsand a catchment area of within 2,000 people above or below the median for that woreda. The same approach was used for the lowest performing woredas.
Because urban woredas do not have health posts, HEWs were selected based on performance at the health center level. From the selected urban health centers, the woreda health officer identified the highest and lowest performing HEW based on the following criteria:
1. Degree of mapping and knowledge of catchment population
2. Strength of relationships with the community and local administration
3. Linkage with the health center
4. Dependability (time spent at work; honesty)
5. Receipt of recognition for performance
6. Success training volunteers for Health Development Army
7. Quality of her work
8. Organization of her data and time
Once the highest performing HEW was identified, both she and her partner (always recruiting in pairs) were recruited for the study.
The final sample of HEWs (N=44) included 12 from urban areas and 32 from rural areas. Of the 44 HEWs, 22 were from higher performing PHCUs and the other 22 were from lower performing PHCUs. Four HEWs were selected from Addis Ababa City administration and 10 HEWs were selected from each of Oromia, Tigray, SNNP, and Amhara regions (Table 1).

13
Health Extension Workers’ Time Motion Study Complemented by In-depth Interviews, Ethiopia
Methods
Table 2. Final Sample of Woredas, Health Centers, and Health Posts
Region Zone Woreda Urban/Rural, Higher/Lower Performing
Health Center
Health Post Number of interviews
Oromia Ilubabor Mettu Urban, Lower Kebele o1 Not Applicable 13
Kellem Gawo Kebe Rural, Higher Koyan KumbaleBulgo
West Arsi Gedeb Assassa Rural, Higher Assassa Bucho
S/West Shoa Keresa Rural, Lower Gibiso GutuHorji 14
Arsi Amigna Rural, Lower Sade MedaWalabu
Tigray West Shire Endasse-lassiye
Urban, Higher Oumer Kebele 01
North Asgedetsimbila Rural, Higher Maihanse Dedebit
South Alaje Rural, Higher Selenmiha Seret
East Seasuetsaed-amba
Rural, Lower Adikelebes Saesie/quahale 13
Central LailayMichew Rural, Lower Mihe Hatsebo
SNNPR Sidma Zone Hawassa Urban, Higher Millinium Not Applicable 14
Guraghe Mihur Aklil Rural, Higher Mojer Zenabener
Hadiya Misha Rural, Higher Mursito Hage 14
Sheka Yeki Rural, Lower Fedi Shosha
Keffa Gimbo Rural, Lower Dire Dire
Amhara South Gondar Debere Tabor Urban, Lower Hidar 11 Not Applicable
East Gojiam Gozamen Rural, Higher Aba Libanos Chimit
West Gojiam Jabi Tehinan Rural, Higher Mankusa Mana 14
South Wollo Mehal Sainet Rural, Lower Densa 034
South Gondar Lay Gaint Rural, Lower Segno Gebya Debresina
Addis AA City Nefas Silk Lafeto Sub-city
Urban, Higher Woreda 03 Not Applicable
AA City Kirkos Sub-city Urban, Lower Woreda 08 Not Applicable 12
Total number of interviews
94

14
Health Extension Workers’ Time Motion Study Complemented by In-depth Interviews, Ethiopia
Methods
Table 3. Performance on five key indicators in lower and higher performing woredas
Indicator Higher Performing (n=11)Mean (SD)
Lower Performing (n=11)Mean (SD)
Antenatal Care (1 visit) 100% (0%) 78% (13%)
Skilled Birth Attendance 59% (32%) 24% (28%)
Infant Complete Immunization 99% (2%) 63% (11%)
Households with Latrines 96% (5%) 60% (23%)
Model Families 84% (25%) 35% (18%)
Source: HMIS data; September 2012 - August 2013
II.B. Data collection, quality assurance, and analysis
Observation of HEWs
Health extension workers were observed by a team of trained data collectors using a standardized data collection checklist digitalized into an electronic tablet. Each HEW was followed in person for 21 consecutive calendar days, including weekends, during April – June 2014 (Table 4).
Each day, if the HEWs did any work, the start and stop times of each activity were noted throughout the day until she was done with work for the day. This proceeded for 21 days. On average, HEWs over the 21-day observation period did at least some work on 15.5 days. Most, but not all, of the remaining days were weekends.
Each day, activities were recorded continuously beginning with the HEW’s first work-related task of the day after arriving at work and ending when the HEW completed the last work-related task of the day before leaving for home. In addition to the continuous recording of HEW activities, observers also entered end-of-day reflections to facilitate the interpretation of the quantitative data. Responses to a set of one-time questions were also recorded to capture HEW demographic characteristics and participation in activities that may not occur during the observation period, including training/refresher sessions and seasonal activities. Data quality were ensured through (1) careful selection of data collectors and ensuring 5 days of data collector training prior to deployment, including supervised practice in the field, (2) intensive field supervision by fulltime experts, (3) data review every two to three days to identify problems and take corrective measures in a timely manner, and (4) data cleaning by experienced analysts to look for gaps and anomalies.

15
Health Extension Workers’ Time Motion Study Complemented by In-depth Interviews, Ethiopia
Methods
Table 4. Timeline for HEW observations by PHCU
Region Woreda Data collection period April May June
Start Date End Date 7 14 21 28 5 12 19 26 2 9 16 23 30
Oromia Urban Mettu 29-Apr-14 19-May-14 X X X X
Rural GawoKebe 30-Apr-14 20-May-14 X X X X X
Gaba Asana 8-Apr-14 4-May-14 X X X X
Keresa 8-Apr-14 4-May-14 X X X X
Amigna 8-Apr-14 4-May-14 X X X X
Tigray Urban Shire Endasselassiye 10-Jun-14 30-Jun-14 X X X X
Rural Asgedetsimbila 11-Jun-14 1-Jul-14 X X X X
Alaje 11-Jun-14 1-Jul-14 X X X X
Seasuetsaedamba 9-Jun-14 29-Jun-14 X X X
LailayMichew 9-Jun-14 29-Jun-14 X X X
SNNP Urban Hawassa 8-Apr-14 4-May-14 X X X X
Rural MihurAklil 8-Apr-14 4-May-14 X X X X
Misha 28-Apr-14 18-May-14 X X X
Yeki 10-Jun-14 30-Jun-14 X X X X
Gimbo 27-May-14 16-Jun-14 X X X X
Amhara Urban Debere Tabor 2-Jun-14 22-Jun-14 X X X
Rural Gozamen 13-May-14 2-Jun-14 X X X X
JabiTehinan 13-May-14 2-Jun-14 X X X X
Mehal Sainet 21-May-14 10-Jun-14 X X X X
Lay Gaint 30-May-14 19-Jun-14 X X X X
Addis
Ababa
Urban Nefas Silk Lafeto 26-May-14 15-Jun-14 X X X
Kirkos 26-May-14 15-Jun-14 X X X
After the completion of data collection, all data sets were combined into one, and completeness and accuracy of all variables were ensured before analysis.
Observation data were organized by region, by higher versus lower performing woredas, and by urban versus rural woredas. Self-reported estimates of previous training and time spent during the past 12 months on various seasonal activities were summarized using standard descriptive statistics.
Breaks and meals were removed from the analysis. HEW time was categorized into the following activities: Providing health education or services (i.e., delivering the health extension service packages, usually in the health post or at the household level); participating in meetings and giving trainings (i.e., attending health and non-health development meetings, delivering HDA trainings); conducting community mapping and mobilization for upcoming activities; recordkeeping, reporting, managing family folders; managing commodities and supplies; receiving supervision; receiving training; travel between work activities; waiting in the health post (or health center in urban settings); building relationships in the community; and other activities that could not be meaningfully categorized.
The categories that are listed as “waiting in the health post” and “building relationships in the community” represent times when the HEW was at work in her role as an HEW, but was not completing a formal or structured activity that could be categorized by the observer. Based on debriefs with data collectors, these categories represent a wide range of experiences such as HEWs keeping the HP open for the expected time despite lack of service users, HEWs informally engaging opinion leaders in the community, or HEWs stopping to chat with friends on her way to other activities in the community.

16
Health Extension Workers’ Time Motion Study Complemented by In-depth Interviews, Ethiopia
Methods
Statistical comparisons were made using t-tests and chi-square analysis as appropriate. Quantitative data were analyzed using Excel and SAS v 9.3; qualitative data were analyzed using Atlas.ti v 7.1.7 to facilitate data organization and retrieval.
In-depth, Open-Ended Interviews with Key Informants
Key informant interviews were conducted in the local languages (Amharic, Oromiffa, or Tigrigna, as appropriate) by trained interviewers using a pretested, open-ended discussion guide. Audio recordings of each interview were transcribed and translated from the local language into English. Each resulting English-language transcript was reviewed by the interviewer and compared with the audio file for completeness and accuracy of translation and transcription.
Qualitative data were analyzed using the constant comparative methods of qualitative data analysis.15 The coding process followed an inductive approach building the codes from the data. Three independent researchers reviewed the first several interview transcripts identifying concepts to begin the code sheet. The code sheet was augmented with analysis of successive transcripts, and early transcripts were re-coded to ensure comprehensiveness. The three coders reconciled discrepancies through a series of meetings and communications toward consensus. Coded data were then analyzed and integrated into recurrent themes.
Several techniques were used to ensure that data analysis was systematic and verifiable, as recommended by experts in qualitative research.16,17,18,19,20 These included 1) consistent use of open ended questions, 2) interviewing multiple respondents at each site for triangulation, 3) audiotaping and independent preparation of the transcripts, 4) coding and analysis of the data using an explicit coding structure developed in the study, 5) multiple coders with varying relevant backgrounds and perspectives, 6) explicit consideration and discussion of discrepant interpretations resolved by negotiated consensus, and 7) the creation of an analysis audit trail to document analytical decisions.
15 Glaser BG Strauss AL. The Discovery of Grounded Theory: Strategies for Qualitative Research. New York: Aldine De Gruyter, 1967.16 Miles MB, Huberman AM. Qualitative data analysis: an expanded sourcebook, 2nd ed. Thousand Oaks, CA: Sage Publications, 1994.17 Mays N, Pope C. Rigour in qualitative research. BMJ 1995;311:109–12.18 Gilchrist VJ, Williams RL. Key informant interviews. In: Crabtree BF, Miller WL, eds. Doing Qualitative Research. 2nd ed. Thousand Oaks, CA: Sage Publications; 1999:71-89.19 Patton M. Qualitative Research and Evaluation Methods. 3rd ed. Thousand Oaks: Sage Publications; 2002.20 Bradley EH, Curry LA, Devers KJ. Qualitative data analysis for health services research: developing taxonomy, themes, and theory. Health Services Research, 2007; 42(4): 1758-72.

17
Health Extension Workers’ Time Motion Study Complemented by In-depth Interviews, Ethiopia
Time Motion Study Results
III. Time Motion Study Results
III.A. Sample description
The average age of the 44 HEWs was nearly 27 years (Table 5). Participants had, on average, 5.3 years of experience as HEW, including 3.8 years in their current health post. The average monthly salary was about 1400 birr. The average distance to the health center from their health post was about 8 kilometers, with a range of 0-40 kilometers, and the average distance to the woreda health office was about 21 kilometers. Rural HEWs comprised 73% of the sample.
Table 5. Descriptive characteristics of study participants (N=44)
Variable N (%)1
Age [M (SD) & Range] 26.7 (5.2) & 21 – 49
Education level Level 3 Level 4
34 (77.3%) 10 (22.7%)
Number of years as HEW [M (SD) & Range] 5.3(2.7) &0-10
Number of years at current health post [M (SD) & Range] 3.8 (2.7) & 0 – 9
Monthly salary in birr [M, (SD) & Range] 1399 (274) & 908 – 2151
HEW comes from Current kebele Other kebele in the same woreda Other kebele in another woreda
15 (34.1%) 21 (47.7%) 8 (18.2%)
Distance to health center in km [M (SD) & Range] 8.4 (10.6) & 0 – 40
Distance to woreda health office in km [M (SD) & Range] 20.6 (31.4) & 0 – 135
Location type Urban Rural
12 (27.3%) 32 (72.7%)
Public transportation available to kebele Yes No
28 (63.6%)16 (36.4%
1 Continuous variables are reported as mean (standard deviation) and range, and categorical variables are reported as N (Column %).
III.B. Training of HEWs
In the past 12 months, about 68% of HEWs reported they had refresher training on immunization, and nearly 64% on tuberculosis. About 43% reported having refresher trainings on maternal, newborn, and child health, 50% on integrated community case management of newborn and childhood illness, and 25% on malaria prevention and control (Table 6). There was not a significant difference in the training history of HEWs from high performing versus lower performing PHCUs. Consistent with national refresher training plans, rural HEWs were more likely to have participated in refresher training than those from urban settings. Importantly, these results are based on self-reported participation in various trainings; any discrepancies between these findings and national training timelines may be due to recall error, gaps in training coverage, or both.

18
Health Extension Workers’ Time Motion Study Complemented by In-depth Interviews, Ethiopia
Time Motion Study Results
Table 6. Number of HEWs who report participating in trainings in the past 12 months (N=44)
HEW (N=44)
Urban HEW (N=12)
Rural HEW (N=32)
P-value2
Training in the last 12 months:1 N (%) N (%) N (%)
Integrated refresher training on Maternal Newborn and Child Health
19 (43.2%) 3 (25.0%) 16 (50.0%) 0.136
Integrated refresher training on Immunization
30 (68.2%) 7 (58.3%) 23 (71.9%) 0.390
Integrated refresher training on Integrated Community Case Management of Newborn and Childhood Illness
22 (50.0%) 2 (16.7%) 20 (62.5%) 0.007
Integrated refresher training on HIV/AIDS & STIs
20 (45.5%) 6 (50.0%) 14 (43.8%) 0.711
Integrated refresher training on Tuberculosis
28 (63.6%) 6 (50.0%) 22 (68.8%) 0.303
Community based health information system
18 (40.9%) 2 (16.7%) 16 (50.0%) 0.088
Malaria prevention & control 9 (20.5%) 2 (16.7%) 7 (21.9%) 0.703
Community based newborn care 11 (25.0%) 1 (8.3%) 10 (31.3%) 0.240
Other 6 (13.6%) 2 (16.7%) 4 (12.5%) 0.052
1 Those who report “Don’t Know” were considered as not having completed the training. 2 P-values derived from chi-square tests. 3 This training was reported only in select sites; it was not part of the national refresher training curriculum.

19
Health Extension Workers’ Time Motion Study Complemented by In-depth Interviews, Ethiopia
Time Motion Study Results
III.C. Seasonal activities
As presented in Table 7, all HEWs were involved in enhanced outreach strategy and the majority were involved in environmental protection (82%), providing training for model household/1:5 network leader (93%), and community led total sanitation (84%). Nineteen HEWs (43%) reported involvement in tax collection work. There was not a significant difference in participation in seasonal activities between HEWs from lower and higher performing PHCUs. Rural HEWs were more likely to have participated in seasonal activities, including immunization campaigns and tax collection, than those from urban settings.
Table 7. Number of HEWs who self-reported participating in seasonal activities in the past 12 months, overall and by urban/rural (N=44)
All HEWs Urban HEWs Rural HEWs P-value2
Type of seasonal activity HEWs
participating
N (%)
Mean Days
Participating
(SD) 1
HEWs
participating
N (%)
Mean Days
Participating
(SD) 1
HEWs
participating
N (%)
Mean Days
Participating
(SD) 1
Enhanced Outreach
Strategy
44 (100%) 9.5 (14.43) 12 (100%) 16.8 (26.57) 32 (100%) 6.8 (3.13) 1.000
Environmental Protection
(water shed management:
Terracing)
36 (81.8%) 21.8 (20.08) 9 (75.0%) 8.4 (8.35) 27 (84.4%) 26.3 (20.94)
0.663
Model household or
1:5 network leader training
41 (93.2%) 24.3 (22.39) 10 (83.3%) 22.7 (27.66) 31 (96.9%) 22.7 (20.70)
0.176
Community Led Total
Sanitation
37 (84.1%) 26.9 (30.89) 11 (91.7%) 17.3 (14.35) 26 (81.3%) 24.6 (34.02)
0.653
Family Folder or DTL
Listings
36 (81.8%) 37.1 (81.37) 8 (66.7%) 16.4 (24.70) 28 (87.5%) 35.6 (86.30)
0.185
Collection of Supplies from
the Health Center/Woreda
34 (77.3%) 14.7 (13.77) 6 (50.0%) 6.8 (14.73) 28 (87.5%) 13.1 (12.93) 0.015
Malaria – IRS campaign 17 (38.6%) 6.5 (10.08) 1 (8.3%) 0.4 (1.44) 16 (50.0%) 3.3 (7.98) 0.015
Malaria- Environmental
management
29 (65.9%) 14.1 (14.10) 7 (58.3%) 6.8 (10.12) 22 (68.8%) 10.3 (14.26) 0.722
Measles Campaign 25 (56.8%) 6.2 (4.26) 8 (66.7%) 5.3 (6.85) 17 (53.1%) 2.9 (3.03) 0.022
Polio Campaign 42 (95.5%) 7.5 (3.24) 10 (83.3%) 5.9 (4.01) 32 (100%) 7.6 (3.29) 0.061
Other Immunization
Campaign
28 (63.6%) 13.9 (10.73) 4 (33.3%) 2.9 (4.50) 24 (75.0%) 11.1 (11.74) 0.016
Tax collection 19 (43.2%) 11.5 (14.95) 1 (8.3%) 0.1 (0.29) 18 (56.3%) 6.8 (12.76) 0.006
Maternity leave 5 (11.4%) 90.0 (0) 0 (0.0%) 0 (0) 5 (15.6%) 14.1 (33.20) 0.301
Other leave 20 (45.5%) 18.0 (19.22) 10 (83.3%) 17.7 (25.11) 10 (31.3%) 4.6 (8.29) 0.005
Other periodic or seasonal
activity3
22 (50.0%) --- 6 (50.0%) --- 16 (50.0%) --- 1.000
1 Mean number of days devoted to specific seasonal activity in the past 12 months among those who report “yes” they spent time on the activity. 2 P-values derived from chi-square tests to test differences in % participating 3 Other activities reported included community mobilization for income generation/microfinance, agriculture, political issues, and charitable foundations.

20
Health Extension Workers’ Time Motion Study Complemented by In-depth Interviews, Ethiopia
Time Motion Study Results
III.D. Number of work days and observed time spent on various activities by HEWs
Table 8 shows the average number of working days observed, the average hours per working day and 7-day week, and the total time of observation in each region. Civil servants (including HEWs) in Ethiopia are expected to work 39 hours per week (8:30-12:30 and 1:30-5:30 Monday-Thursday and 8:30-11:30 and 1:30-5:30 on Fridays). Two twenty-minute breaks per day are generally accepted, resulting in an expected 35.5 hours per week of active work. The present as well as prior studies of HEWs in Ethiopia have shown that HEWs do not limit their work to traditional working hours or weekdays, all working hours have been included in the analysis. It is notable that HEWs from urban areas, including Addis Ababa, engage in far fewer weekend activities than their rural counterparts.
Table 8. Number of days and amount of HEW time observed by region (N=44)
All HEWs N=44
Amhara N=10
Tigray N=10
SNNPR N=10
Oromia N=10
Addis Ababa N=4
P-value1
Mean total working days per HEW, out of 21
15.5 16.2 17.5 15.0 14.4 13.3 0.023
Mean nonworking days (weekend, holidays, and sick) per HEW, out of 21
5.5 4.8 3.5 6.0 6.6 7.7 0.023
Mean hours per workday per HEW (start of workday to end of workday, NOT including break/meals) [Hrs:Mins]
6:01 6:15 6:49 4:552 5:50 6:43 0.018
Mean total hours worked per 7-day period (NOT including break/meals) [Hrs:Mins]
31:57 34:26 40:27 25:13 28:34 29:42 0.019
Mean weekday hours worked per 7-day period (NOT including break/meals) [Hrs:Mins]
27:45 29:28 32:07 22:47 25:55 29:29 0.093
Mean weekend hours worked per 7-day period (NOT including break/meals) [Hrs:Mins]
4:12 4:58 8:21 2:26 2:38 0:13 0.002
Total observed time (NOT including breaks/meals) [Hrs:Mins]
95:50 103:17 121:22 75:39 85:41 89:07 0.019
1 P-values are derived from analyses of variance (ANOVAs), using the null hypothesis of no significant differences across regions. 2 HEWs in SNNPR took longer breaks than HEWs in other regions. Within SNNPR, HEWs from higher performing sites spend less time at work as compared to HEWs from lower performing sites (4:25 vs 5:39), and the 2 HEWs with the shortest working time (around 3 hours per day) represented both higher and lower performing PHCUs.

21
Health Extension Workers’ Time Motion Study Complemented by In-depth Interviews, Ethiopia
Time Motion Study Results
Table 9 shows the average number of working days observed, the average hours per working day and 7-day week, and the total time of observation for HEWs in urban and rural settings.
Table 9. Average number of days and amount of HEW time observed by urban and rural setting (N=44)
All HEWs N=44 Urban N=12 Rural N=32 P-value1
Mean total working days per HEW, out of 21
15.5 13.8 16.2 0.01
Mean nonworking days (weekend, holidays, and sick) per HEW, out of 21
5.5 7.2 4.8 0.01
Mean hours per workday per HEW (start of workday to end of workday, NOT including break/meals) [Hrs:Mins]
6:01 5:32 6:13 0.149
Mean total hours worked per 7-day period (NOT including break/meals) [Hrs:Mins]
31:57 25:41 34:18 0.021
Mean weekday hours worked per 7-day period (NOT including break/meals) [Hrs:Mins]
27:45 24:49 28:51 0.145
Mean weekend hours worked per 7-day period (NOT including break/meals) [Hrs:Mins]
4:12 0:52 5:27 <0.001
Average total observed time per HEW (NOT including breaks/meals) [Hrs:Mins]
95:50 77:01 102:53 0.021
1 P-values are derived from t-tests using the null hypothesis of no significant differences between urban and rural settings.

22
Health Extension Workers’ Time Motion Study Complemented by In-depth Interviews, Ethiopia
Time Motion Study Results
Table 10 shows the average number of working days observed, the average hours per working day and 7-day week, and the total time of observation for HEWs from high and low performing PHCUs. There was no difference in the days worked or the hours per day for HEWs from higher and lower performing PHCUs. Additionally, neither the percent of HEWs who spent at least 20% of their time providing health education and services nor the percent of HEWs who worked greater than 8 hours per day was significantly associated with being a higher versus lower performing PHCU
Table 10. Average number of days and amount of HEW time observed in lower and higher performing woredas (N=44)
All HEWs N=44 Lower N=22 Higher N=22 P-value1
Mean total working days per HEW, out of 21
15.5 15.6 15.5 0.829
Mean nonworking days (weekend, holidays, and sick) per HEW, out of 21
5.5 5.4 5.5 0.829
Mean hours per workday per HEW (start of workday to end of workday, NOT including break/meals) [Hrs:Mins]
6:01 6:15 5:48 0.300
Mean total hours worked per 7-day period (NOT including break/meals) [Hrs:Mins]
31:57 33:00 30:53 0.538
Mean weekday hours worked per 7-day period (NOT including break/meals) [Hrs:Mins]
27:45 28:57 26:32 0.330
Mean weekend hours worked per 7-day period (NOT including break/meals) [Hrs:Mins]
4:12 4:03 4:21 0.821
Average total observed time per HEW (NOT including breaks/meals)
95:50 98:59 92:40 0.538
1 P-values derived from t-tests using the null hypothesis of no significant differences between HEWs from lower and higher performing sites.
Because the urban and rural primary care models are so different, the activities of HEWs from lower and higher performing rural PHCUs were compared. This sub analysis did not reveal different results from the comparison of all (N=44) lower and higher performing PHCUs.

23
Health Extension Workers’ Time Motion Study Complemented by In-depth Interviews, Ethiopia
Time Motion Study Results
Table 11 shows the average number of working days, the hours per working day and 7-day week, and the total time of observation for HEWs from high and low performing PHCUs. There was no difference in the days worked or the hours per day for HEWs from high and low performing PHCUs.
Table 11. Average number of days and amount of HEW time observed in lower and higher performing woredas (RURAL ONLY) (N=32)
All Rural N=32 Lower N=16 Higher N=16 P-value1
Mean total working days per HEW, out of 21
16.2 16.6 15.8 0.441
Mean nonworking days (weekend, holidays, and sick) per HEW, out of 21
4.8 4.4 5.2 0.441
Mean hours per workday per HEW (start of workday to end of workday, NOT including break/meals) [Hrs:Mins]
6:13 6:25 6:00 0.523
Mean total hours worked per 7-day period (NOT including break/meals) [Hrs:Mins]
34:18 35:38 35:38 0.523
Mean weekday hours worked per 7-day period (NOT including break/meals) [Hrs:Mins]
28:51 30:15 27:26 0.351
Mean weekend hours worked per 7-day period (NOT including break/meals) [Hrs:Mins]
5:27 5:23 5:31 0.934
Average total observed time per HEW (NOT including breaks/meals)
102:53 106:55 98:50 0.523
1 P-values derived from t-tests using the null hypothesis of no significant differences between HEWs from lower and higher performing sites.

24
Health Extension Workers’ Time Motion Study Complemented by In-depth Interviews, Ethiopia
Time Motion Study Results
III.E. Proportion of HEW observed time spent on different activities
Table 12 shows the average percentage of time HEWs spend on different activities (overall and by region) from the start to the end of each workday, excluding breaks and meals.
Table 12. Percentage of HEWs observed time spent on different activities by region (N=44)
All HEWs N=44 % (SD)
Amhara N=10 % (SD)
Tigray N=10 % (SD)
SNNPR N=10 % (SD)
Oromia N=10 % (SD)
Addis Ababa N=4 % (SD)
P-value1
Providing health education or services2
12.8 (6.5) 11.2 (8.7) 17.3 (4.0) 12.9 (4.8) 13.6 (5.1) 3.6 (1.7) 0.005
Participating in meetings and giving trainings
9.3 (7.6) 7.4 (4.9) 18.3 (6.0) 9.7 (7.4) 3.6 (3.8) 5.2 (4.0) <0.001
Community mapping and mobilization
0.8 (1.7) 0.5 (1.0) 1.4 (2.1) 1.3 (2.8) 0.3 (0.5) 0.3 (0.4) 0.484
Recordkeeping, reporting, managing family folders
13.2 (8.4) 10.3 (9.8) 11.7 (8.8) 17.2 (6.2) 14.0 (7.1) 11.9 (11.1) 0.41
Managing commodities and supplies
1.3 (1.9) 0.6 (0.6) 1.4 (2.5) 1.7 (1.8) 2.0 (2.3) 0.2 (0.3) 0.32
Receiving supervision 3.2 (4.3) 1.1 (1.6) 3.0 (2.4) 2.2 (2.3) 6.7 (7.3) 2.3 (1.6) 0.032
Receiving training 1.6 (3.6) 0.3 (0.9) 0.4 (0.9) 1.4 (3.2) 2.7 (5.8) 5.4 (4.5) 0.091
Travel between work activities
15.5 (8.5) 10.9 (6.8) 16.9 (7.5) 15.8 (6.5) 20.6 (11.0) 10.3 (5.8) 0.068
Other activity 4.0 (4.6) 2.3 (3.6) 3.2 (4.7) 4.1 (1.8) 7.1 (6.8) 2.1 (1.6) 0.137
Waiting for clients in the health post (health center in urban settings)
24.9 (21.4) 50.2 (23.7)3
9.5 (8.7) 24.8 (15.0) 22.7 (13.0) 6.0 (7.1) <0.001
Building relationships in the community
13.3 (15.5) 5.2 (4.4) 17.0 (10.5)4
8.9 (9.6) 6.5 (4.9) 52.7 (13.4)5
<0.001
Total percent observed 100 100 100 100 100 100 ---
1 P-values are derived using the null hypothesis of no significant differences across regions.2 The category of “providing health education and services” is narrowly defined as the direct education and care provided in delivering the health extension service packages, usually in the health post or at the household level or at health center level in the urban context.3 This high proportion of time spent waiting in the health post in Amhara was driven by two HEWs, both from lower performing woredas, who spent over 80% of their time waiting in the health post. 4 This high proportion of time spent building relationships in the community in Tigray was driven by two HEWs who each spent more than 30% of their time in this category. They represented both higher- or lower-performing PHCUs. 5 This high proportion of time spent building relationships in the community in Addis Ababa was not driven by a few HEWs. Instead, it appears to be a relatively consistent trend across HEWs in Addis Ababa.

25
Health Extension Workers’ Time Motion Study Complemented by In-depth Interviews, Ethiopia
Time Motion Study Results
Table 13 shows the percentage of time HEWs in urban and rural settings spend on each activity from the start to the end of each workday, excluding breaks/meals. Rural HEWs spent a significantly higher proportion time than their urban counterparts providing health educations and services (delivering the 16 packages) and waiting for clients in the health post; Urban HEWs spent a greater proportion of their time in unstructured relationships building in the community, and less time operating out of a health facility.
Table 13. Percentage of HEWs observed time spent on different activities by urban and rural setting (N=44)
All HEWs N=44 % (SD)
Urban N=12 % (SD)
Rural N=32 % (SD)
P-value1
Providing health education or services2
12.8 (6.5) 8.6 (5.5) 14.4 (6.2) 0.007
Participating in meetings and giving trainings
9.3 (7.6) 10.1 (8.3) 9.0 (7.4) 0.681
Community mapping and mobilization 0.8 (1.7) 1.1 (1.9) 0.7 (1.7) 0.565
Recordkeeping, reporting, managing family folders
13.2 (8.4) 13.6 (9.7) 13.0 (8.0) 0.831
Managing commodities and supplies 1.3 (1.9) 0.4 (0.7) 1.6 (2.1) 0.004
Receiving supervision 3.2 (4.3) 3.7 (4.6) 3.0 (4.2) 0.630
Receiving training 1.6 (3.6) 2.6 (4.2) 1.2 (3.4) 0.305
Travel between work activities 15.5 (8.5) 14.4 (6.5) 16.0 (9.2) 0.594
Other activity 4.0 (4.6) 5.2 (5.2) 3.6 (4.4)
Waiting for clients in the health post (health center in urban settings)
24.9 (21.4) 13.2 (12.6) 29.3 (22.5) 0.024
Building relationships in the community
13.3 (15.5) 27.2 (21.3) 8.2 (8.5) 0.011
Total percent observed 100 100 100 ---
1 P-values are derived from t-tests using the null hypothesis of no significant differences between urban and rural settings.2 The category of “providing health education and services” is narrowly defined as the direct education and care provided in delivering the 16 HEW service packages, usually in the health post or at the household level.

26
Health Extension Workers’ Time Motion Study Complemented by In-depth Interviews, Ethiopia
Time Motion Study Results
Table 14 shows the percentage of time HEWs in high and low performing PHCUs spend on each activity from the start to the end of each workday, excluding breaks/meals.
Table 14. Percentage of HEWs observed time spent on different activities in lower and higher performing woredas (N=44)
All HEWs N=44 % (SD)
Lower N=22 % (SD)
Higher N=22 % (SD)
P-value1
Providing health education or services2
12.8 (6.5) 11.8 (7.1) 13.9 (5.9) 0.289
Participating in meetings and giving trainings
9.3 (7.6) 8.4 (7.6) 10.3 (7.6) 0.417
Community mapping and mobilization
0.8 (1.7) 0.2 (0.4) 1.5 (2.3) 0.010
Recordkeeping, reporting, managing family folders
13.2 (8.4) 13.2 (9.0) 13.2 (7.8) 0.993
Managing commodities and supplies
1.3 (1.9) 1.3 (1.9) 1.3 (1.9) 0.921
Receiving supervision 3.2 (4.3) 4.3 (5.6) 2.1 (1.9) 0.098
Receiving training 1.6 (3.6) 0.9 (2.3) 2.2 (4.6) 0.243
Travel between work activities 15.5 (8.5) 16.2 (10.7) 14.8 (5.6) 0.600
Other activity 4.0 (4.6) 4.1 (5.1) 3.9 (4.2) 0.852
Waiting for clients in the health post (health center in urban settings)
24.9 (21.4) 28.6 (26.3) 21.2 (14.7) 0.263
Building relationships in the community
13.3 (15.5) 11.1 (15.8) 15.6 (15.3) 0.343
Total percent observed 100 100 100 ---
1 P-values are derived from independent sample t-tests using the null hypothesis of no significant differences between HEWs from lower and higher performing sites.2 The category of “providing health education and services” is narrowly defined as the direct education and care provided in delivering the 16 health extension service packages, usually in the health post or at the household level or at health center level in the urban context.
HEWs from higher performing PHCUs spent less time waiting for clients in the health post, and more time in relationship building with the community, although this difference was not statistically significant given the small sample size. It is possible that these data may reflect a more proactive approach on the part of the HEW leading to higher performance, or it may reflect HEW withdrawal in settings where there is lack of community respect or engagement.
Of note, HEWs in lower performing PHCUs spent a significantly greater proportion of their time receiving supervision. We hypothesize that this is an artifact of the cross-sectional nature of the study and that lower performing sites are more likely to be in remediation and receiving more intensive supervision, not that supervision causes lower performance. To understand whether lower performing HEWs were receiving more supervision time, more frequent supervision, or both, we also compared frequency of supervision for HEWs from higher versus lower performing PHCUs and found no significant difference.
Three covariates that might have impacted the association between HEW time allocation and PHCU performance have been investigated. First, it was hypothesized that the presence and number of development partners or targeted programming (i.e., ICCM sites) may be masking some of the differences in HEW allocation of time in higher versus lower performing sites, but there was no association between ICCM implementation and PHCU performance. There was also

27
Health Extension Workers’ Time Motion Study Complemented by In-depth Interviews, Ethiopia
Time Motion Study Results
no association between presence of development partners at the site or higher versus lower performance with HEW time allocation.
Second, the allocation of time by HEWs with 5 years or greater experience was compared with those that had less experience as an HEW. HEWs with less experience spent more time building relationships in the community (19% compared with 8.5%; p-value 0.012). Allocation of time to other activities did not differ significantly between more and less experienced HEWs.
Third, allocation of time between HEWs from PHCUs that have access to public transportation were compared with those that do not. HEWs from sites with access to public transportation spent significantly more time receiving supervision (4% compared with 1%; p-value 0.011). Allocation of time to other activities did not differ significantly between HEWs from PHCUs with and without public transportation.
Table 15 shows the average percentage of time HEWs in high and low performing rural PHCUs spend on each activity from the start to the end of each workday, excluding breaks/meals.
Table 15. Percentage of HEWs observed time spent on different activities in lower and higher performing woredas (RURAL ONLY) (N=32)
All Rural N=32
Lower N=16
Higher N=16
P-value1
Providing health education or services2 14.4 (6.2) 13.4 (6.8) 15.4 (5.6) 0.366
Participating in meetings and giving trainings
9.0 (7.4) 9.4 (8.4) 8.6 (6.5) 0.777
Community mapping and mobilization 0.7 (1.7) 0.1 (0.1) 1.4 (2.3) 0.030
Recordkeeping, reporting, managing family folders
13.0 (8.0) 12.1 (8.4) 14.0 (7.6) 0.506
Managing commodities and supplies 1.6 (2.1) 1.6 (2.1) 1.7 (2.1) 0.885
Receiving supervision 3.0 (4.2) 3.7 (5.7) 2.2 (1.9) 0.332
Receiving training 1.2 (3.4) 0.4 (0.9) 2.0 (4.7) 0.207
Travel between work activities 16.0 (9.2) 16.2 (11.8) 15.7 (5.9) 0.871
Other activity 3.6 (4.4) 3.6 (5.0) 3.5 (3.8) 0.978
Waiting for clients in the health post (health center in urban settings)
29.3 (22.5) 33.1 (28.6) 25.5 (14.0) 0.349
Building relationships in the community 8.2 (8.5) 6.4 (7.8) 9.9 (9.0) 0.253
Total percent observed 100 100 100 ---
1 P-values are derived from t-tests using the null hypothesis of no significant differences between HEWs from lower and higher performing sites.2 The category of “providing health education and services” is narrowly defined as the direct education and care provided in delivering the 16 HEW service packages, usually in the health post or at the household level.
HEWs from higher performing rural woredas spent less time waiting for clients in the health post, and more time in unstructured relationship building with the community, but these differences were not statistically significant due to the limited sample size.

28
Health Extension Workers’ Time Motion Study Complemented by In-depth Interviews, Ethiopia
Time Motion Study Results
III.F. Proportion of HEWs observed time spent on providing health education or services by location, type of service, and type of care (preventive/curative)
Table 16 provides a closer look at the time HEWs spend providing health education and services (13.1% of their time overall), breaking these services down by location, service package, and whether the service was preventive or curative.
Table 16. Time spent providing health education or services by location, service package, and preventive/curative split; overall and by region (N=44)
All HEWs N=44 %(SD)
Amhara N=10 %(SD)
Tigray N=10 %(SD)
SNNPR N=10 %(SD)
Oromia N=10 %(SD)
Addis Ababa N=4 %(SD)
P-value1
By Location Health Post Household Other (i.e. schools) Location not recorded
42.8 (23.2)
36.5 (24.4)
7.8 (23.8)
12.9 (242.5)
36.6 (27.3)
28.0 (26.9)
4.0 (15.7)
31.4 (515.3)
40.6 (25.2)
41.5 (26.7)
12.5 (31.3)
5.4 (6.5)
55.6 (19.7)
33.4 (22.1)
5.4 (3.3)
5.6 (5.6)
46.7 (22.1)
40.8 (27.3)
3.5 (10.9)
9.0 (15.8)
0
31.1 (22.9)
28.9 (35.6)
40.0 (38.7)
0.117
0.039
0.084
0.436
By Service Package Hygiene & Environmental Sanitation Family Health Service Disease Prevention & Control Non-Communicable Diseases Mental Health Other
30.3 (28.1)
44.7 (25.9)
12.4 (11.0)
0.6 (2.1)
0
11.9 (22.4)
38.6 (23.5)
35.2 (19.0)
16.9 (8.9)
1.4 (2.5)
0
8.0 (23.6)
35.9 (28.2)
44.2 (27.1)
13.2 (13.9)
0.1 (0)
0
6.5 (6.6)
15.4 (19.2)
62.4 (20.9)
14.9 (12.5)
1.2 (1.4)
0
6.1 (4.9)
22.3 (36.1)
41.1 (29.3)
3.6 (6.6)
0.1 (0.2)
0
32.9 (39.2)
59.6 (20.6)
17.9 (31.8)
17.4 (6.6)
0
0
5.1 (7.6)
0.034
0.005
0.301
0.493
--
0.137
Preventive vs Curative2 Preventive Curative Unspecified3
75.3 (22.2)
12.8 (12.0)
11.9 (22.4)
73.6 (23.8)
18.4 (14.9)
8.0 (23.6)
79.5 (13.5)
14.0 (12.2)
6.5 (6.6)
80.6 (10.6)
13.3 (7.0)
6.1 (4.9)
61.8 (33.6)
5.2 (6.6)
32.9 (39.2)
88.3 (15.3)
6.6 (0)
5.1 (7.6)
<0.001
0.505
0.137
1 P-values are derived from analyses of variance (ANOVAs), using the null hypothesis of no significant differences across regions.2 Specific services defined as curative or preventive in Appendix 13 This category represents health education or services for which not enough detail was provided to classify as preventive or curative
Table 17 provides a closer look at the time HEWs in urban and rural settings spend providing health education services (12.8% of their time overall), breaking these services down by service package and whether the service was preventive or curative. Urban HEWs places much more emphasis on hygiene and environmental sanitation, while rural HEWs focused on family health and disease prevention and control. While both groups focused on preventive services, HEWs in rural settings spent a greater proportion of time on curative services than did HEWs in urban settings.

29
Health Extension Workers’ Time Motion Study Complemented by In-depth Interviews, Ethiopia
Time Motion Study Results
Table 17. Time spent providing health education or services by service package and preventive/curative split in urban and rural settings (N=44)
All HEWs N=44 % (SD)
Urban N=12 % (SD)
Rural N=32 % (SD)
P-value1
By Service Package Hygiene & Environmental Sanitation Family Health Service Disease Prevention & Control Non-Communicable Diseases Mental Health Other
30.3 (28.1) 44.7 (25.9) 12.4 (11.0) 0.6 (2.1) 0 11.9 (22.4)
46.8 (30.6) 38.8 (31.2) 4.9 (13.4) 1.2 (2.3) 0 8.3 (22.2)
28.0 (23.6) 45.6 (23.9) 13.5 (10.7) 0.5 (2.1) 0 12.5 (22.9)
0.064 0.015 0.007 0.216 -- 0.071
Preventive vs Curative2 Preventive Curative Unspecified3
75.3 (22.2) 12.8 (12.0) 11.9 (22.4)
88.7 (20.6) 3.0 (12.3) 8.3 (22.2)
73.3 (22.4) 14.2 (12.1) 12.5 (22.9)
<0.0010.003 0.071
1 P-values are derived from t-tests using the null hypothesis of no significant differences between urban and rural settings.2 Specific services defined as curative or preventive in Appendix 1.3 This category represents health education or services for which not enough detail was provided to classify as preventive or curative.
Table 18 provides a closer look at the time HEWs in lower and higher performing woredas spend providing health education services (12.8% of their time overall), breaking these services down by location, service package, and whether the service was preventive or curative.
Table 18. Time spent providing health education or services by location, service package, and preventive/curative split in lower and higher performing woredas (N=44)
v All HEWs N=44 % (SD)
Lower N=22 % (SD)
Higher N=22 % (SD)
P-value1
By Location Health Post Household Other (i.e. schools) Location not recorded
42.8 (23.2) 36.5 (24.4) 7.8 (23.8) 12.9 (21.7)
36.3 (28.0) 38.3 (27.1) 6.1 (10.8) 19.3 (26.4)
48.9 (17.5) 34.9 (20.6) 9.4 (29.5) 6.8 (13.6)
0.1980.642 0.061 0.462
By Service Package Hygiene/Environmental Sanitation Family Health Service Disease Prevention & Control Non-Communicable Diseases Mental Health Other
30.3 (28.1) 44.7 (25.9) 12.4 (11.0) 0.6 (2.1) 0 11.9 (22.4)
31.6 (36.0) 38.1 (28.5) 9.9 (11.1) 0.4 (0.7) 0 20.0 (28.5)
29.3 (16.5) 50.2 (21.6) 14.5 (11.3) 0.7 (0.8) 0 5.3 (5.7)
0.859 0.1690.326 0.138 -- 0.196
Preventive vs Curative2 Preventive Curative Unspecified3
75.3 (22.2) 12.8 (12.0) 11.9 (22.4)
70.3 (28.5) 9.7 (14.6) 20.0 (28.5)
79.4 (11.6) 15.3 (10.1) 5.3 (5.7)
0.1690.456 0.196
1 P-values are derived from t-tests using the null hypothesis of no significant differences between HEWs from lower and higher performing sites.2 Specific services defined as curative or preventive in Appendix 1.3 This category represents health education or services for which not enough detail was provided to classify as preventive or curative.

30
Health Extension Workers’ Time Motion Study Complemented by In-depth Interviews, Ethiopia
Time Motion Study Results
Health extension workers from higher performing PHCUs trended toward spending more time on family health services and disease prevention and control, while HEWs from lower performing PHCUs emphasized hygiene and environmental sanitation and activities that could not be clearly specified by service package. HEWs from higher performing PHCUs also spent more time on curative activities than their counterparts from lower performing PHCUs. These differences were not statistically significant due to small sample sizes.
Of note, HEWs from higher performing PHCUs delivered most of their health education and services from the health post, while HEWs from lower performing PHCUs delivered most of their health education and services through household visits. At the same time, HEWs from higher performing PHCUs spent more time building relationships in the community and less time waiting in the health post, although these differences were not statistically significant (Table 18).
Table 19 provides a closer look at the time rural HEW’s spend providing health education or services (14.6% of their time overall), breaking these services down by location, service package, and whether the service was preventive or curative. There was no significant difference in location of services, on time spent in the different service package areas, or time spent on preventive versus curative services between HEWs from lower and higher performing rural PHCUs.
Table 19. Time spent providing health education or services by location, service package, and preventive/curative split in lower and higher performing woredas (RURAL ONLY) (N=32)
All Rural N=32 % (SD)
Lower N=16 % (SD)
Higher N=16 % (SD)
P-value1
By Location Health Post Household Other (i.e. schools) Location not recorded
51.0 (20.1) 36.9 (19.5) 5.8 (10.4) 6.3 (10.8)
46.0 (25.3) 40.6 (22.2) 7.4 (11.3) 6.0 (7.1)
55.2 (13.3) 33.7 (16.7) 4.4 (6.5) 6.6 (14.3)
0.1820.626 0.082 0.326
By Service Package Hygiene/Environmental Sanitation Family Health Service Disease Prevention & Control Non-Communicable Diseases Mental Health Other
28.0 (23.6) 45.6 (23.9) 13.5 (10.7) 0.5 (2.1) 0 12.5 (22.9)
26.5 (30.0) 41.9 (27.2) 10.8 (10.9) 0.4 (0.8) 0 20.4 (29.4)
29.3 (16.8) 48.7 (19.8) 15.8 (11.0) 0.5 (1.0) 0 5.7 (6.1)
0.6680.168 0.301 0.296 -- 0.242
Preventive vs Curative2 Preventive Curative Unspecified3
73.3 (22.4) 14.2 (12.1) 12.5 (22.9)
68.7 (29.0) 11.0 (14.6) 20.4 (29.4)
77.3 (10.5) 17.0 (9.9) 5.7 (6.1)
0.2490.277 0.242
1 P-values are derived from t-tests using the null hypothesis of no significant differences between HEWs from lower and higher performing sites.2 Specific services defined as curative or preventive in Appendix 1.3 This category represents health education or services for which not enough detail was provided to classify as preventive or curative.
Health extension workers from higher performing rural PHCUs delivered more of their health education and services from the health post, as compared to HEWs from lower performing rural PHCUs. HEWs from lower performing rural PHCUs delivered more of their health education and services through household visits as compared to their counterparts from higher performing rural PHCUs. HEWs from higher performing rural PHCUs also spent more time on curative activities than their counterparts from lower performing PHCUs, though both higher and lower performing rural PHCU spend the large majority of their time on preventive services. These differences were not statistically significant due to small sample sizes.

31
Health Extension Workers’ Time Motion Study Complemented by In-depth Interviews, Ethiopia
In-Depth Interview Results
IV. In-Depth Interview Results
IV.A. Description of the sample: key informants and woredas
A total of 94 key informant interviews were conducted with individuals from various levels of the PHCU and community (including 2 HEWs, the HEW supervisor, 1 community member from the kebele council, 1 member of the HDA, the woreda health office head, the highest available woreda administrator, the medical director and chief executive officer (CEO) of the hospital most closely associated with the PHCU, the health center director, the HMIS/referral focal person, and the regional and zonal health bureau heads or their designee). A total of 59% of the interviews were of people from rural PHCUs, and about 57% were from higher performing woredas (Table 20).
Table 20. Key Informant Interview Sample (N=94 key informants)
N (%)1
Woreda location
Rural 55 (59%)
Urban 39 (41%)
Woreda performance
Higher Performing 54 (57%)
Lower Performing 40 (43%)
Informant position
Community member 14 (15%)
HEW 14 (15%)
HEW/HEP supervisor 7 (7%)
HMIS/referral focal person 14 (15%)
HC director/coordinator 7 (7%)
Woreda health officer 6 (6%)
Zonal administration 6 (6%)
Regional administration 5 (5%)
Woreda administrator 7 (7%)
Hospital CEO 7 (7%)
Hospital medical director 7 (7%)
Informant gender
Male 65 (69%)
Female 29 (31%)
TOTAL 94 (100%)

32
Health Extension Workers’ Time Motion Study Complemented by In-depth Interviews, Ethiopia
In-Depth Interview Results
IV.B. Recurrent themes from all woredas
Six recurrent themes emerged among all woredas regardless of performance (Figure 2) for a summary of themes. This section includes a description of each theme supported by illustrative quotations. Quotations are tagged with a participant number (i.e., P1) and woreda number (i.e., W1) to ensure that a diverse set of responses is represented.
Figure 2. Themes present in both high and low performing woredas
1. Motivating factors with regards to position, role, or career:
· Pride of serving the community and seeing positive change
2. Demotivating factors with regards to position, role, or career:
· Professional career growth moving slowly
· Inadequate in-service refresher training
· Financial limitations, both personal and institutional
3. Persistence required to overcome challenges, especially with community resistance
4. Community engagement and leadership are critical to HEW success; community meant:
· The HDA, also referred as the Women’s Development Army (WDA) by key informants
· Influential community members, including traditional community leaders, religious leaders, and kebele council members
5. Health centers and hospitals were described as poorly connected; quality of connections among health center, woreda health office, and HEWs varied
· Limited linkages in the referral system between health center and hospital
· Inadequate communication and patient information exchange
· Linkages and coordination among woreda health office, health center, and HEWs was stronger in some woredas and weaker in other woredas, although these patterns were not consistent based on overall woreda performance
6. The urban health extension program was described as not meeting the needs of many urban communities
· Most people in the urban setting often not at home during the day and some including during evenings
· Limited perceived value of the health extension packages by urban community
· Inadequate acceptance of HEW based on differing educational and social background
Theme #1. The motivating factors were similar across woredas.
The motivating factors for HEWs were similar across informants and across woredas. In general, the primary motivating factor was the pride and pleasure of helping patients and community members. Several staff referred to their happiest moments in seeing people experience recovery from illness; additionally, serving the country and individual communities was rewarding for staff of all kinds. For instance, as health extension workers reflected:
What makes me very happy is giving vaccines to infants and see them grow up healthy. In the past, the community was burying up to two babies a week, but these days, infants grow up and go to school because they are healthy. This makes me happy. Their trust in the vaccines and their taking it make me happy. These days, women travel long distances to give birth at the health facilities in order to save theirs and the newborn’s lives. Porridge is also prepared for them at the health facilities. These make me very happy. – HEW, P27, W5

33
Health Extension Workers’ Time Motion Study Complemented by In-depth Interviews, Ethiopia
In-Depth Interview Results
I am happy for contributing toward reducing mothers and children death; we haven’t had mothers dying here with us but we used to lose children. After 2005 we have seen special changes and home delivery rate is getting to zero. Delivering a child at home is considered almost a taboo these days. This kind of attitude change makes me happy. We used to go on house hold basis to call for vaccination but today there is no need to call for vaccination as they [the community] come themselves on the 27th day. This is what makes me happy, a change of attitude. -HEW, P83, W6
Theme #2. The demotivating factors were consistent across woredas.
The prominent demotivating factors for HEWs were also similar across informants and across woredas. Despite the government investment in Level IV training for HEWs, slow progress in upgrading Level III HEWs to Level IV was demotivating for HEWs. These demotivating factors were described as follows by HEWs:
I stayed eight years in a health post without getting education. The salary also has no changes; what kind of life would you lead on a thousand birr these days? We get one thousand and two hundred and I am angry to know that our salary and the cost of living do not match. We also did not get education. We were first round and we haven’t had any education so far. -HEW, P83, W6
Even if I get education opportunity, those who get education opportunity after they return they do not have salary increment and they just sit doing what they used to do. So you feel that whether I work or not I will not get salary increment and it doesn’t have meaning. – HEW, P60, W2
Other staff in the PHCU also reflected on similar demotivating factors in their positions and included the importance of being recognized for one’s work:
Employees need to be inspired through capacity building opportunities. The staff not only needs financial motivation they also need further educational opportunities. Every human needs change; they want to change their status. – Woreda health office head, P9, W2
Despite government’s effort to train HEWs on in-service integrated refresher training, HEWs and non-HEWs discussed not having adequate in-service refresher training and wanted more training and more supportive supervision. A HEW elaborates on this point here:
We cannot be successful without follow-up and encouragement. You begin with courage and determination, but due to the lack of moral support you become discouraged. – HEW, P28, W4
Limitations in both personal compensation and lack of financial resources to purchase needed equipment and infrastructure (e.g., medical equipment, motorbikes, medications) was also demotivating. These shortages were described as limiting staff’s ability to execute their positions well, as expressed below.
In order to save the life of the mother we call by our expense. There is no support to cover this we are doing this by ourselves.- HEW, P2, W2
I am providing service and supporting the community but I am suffering on my personal life as I incur a lot of costs. But the support [should] have been made to me in terms of money, training or any other way. We have raised this issue earlier during the budget session at the regional level; the question of ambulance and mobile call fee was raised. We still have the same question. I am suffering because I cover the fee for mobile phone call; how am I supposed to live? Therefore some support must be made for us; we must be given some support for telephone calls. - HEW, P83, W6
The government’s payment scale is obviously very small…The workers pay the transportation fee from their pockets and spend the day there without lunch. Whenever these workers think of their huge workload and their very small payment, it is common for them to become desperate and complain, telling themselves that they can live a better life if they quit this job and get employed in private clinics or take other jobs. -Health center head, P3, W5

34
Health Extension Workers’ Time Motion Study Complemented by In-depth Interviews, Ethiopia
In-Depth Interview Results
Theme #3: Persistence is required to overcome challenges.
The mention of persistence was similar in interviews across woredas as well. Informants related the importance of being optimistic and patient despite not achieving all their goals immediately. One woreda health officer and urban health extension professional expressed this idea as follows, noting that being optimistic and remaining committed despite challenges is critical for success:
It is your optimism that really matters and you should get deeply involved in the work... Even though you can’t attain your goals 100%. …The work depends on optimism and commitment although some unwanted challenges might appear. – Woreda health officer, P80, W6
There is really nothing I can say must be done in specific; we can’t fix any timetable but only provide services whenever they are available. There are some places on which I work on Sundays. There are also places where we make the visit every fifteen days and even overnight. – HEP, P69, W1
Even in woredas that had already overcome challenges, HEWs discussed the need for persistence, especially when struggling daily with lack of respect and difficult working conditions:
You have to be really patient. There are…some people who would not understand [and] say “why don’t you go and work at the hospital instead of roaming here.” – HEW, P45, W7
For instance, when we get to their homes and tell them to maintain sanitation there are some people accusing you for trespass and entering a private property without court order; they may also attempt to beat you up. What you must do here is that you must be polite enough to talk to them and convince them as this challenge may come again tomorrow. There are also some people who never open their doors for you, some stop you when you try to put a chalk mark on their door and some even alter the marks that you placed. – HEW, P36, W4
They have problems in accepting our information. They agree to our ideas whenever we tell them, but they have problems putting them into action. For example, if we tell them to build latrines for themselves, they explain its uses before we tell them the details. We could not get the chance to convince them because they seem to have already been convinced. They know the information well, but they do not implement it. When we ask them why they do not build latrines, they tell us that they prefer to plant kale, garlic and so on in the space the latrine would occupy. They oppose us while they full well know its advantages. – HEP, P27, W5
Informants also noted that changing cultural norms and individual attitudes take time, indicating again that patience and determination were needed to achieve desired health behaviors and health improvements. One rural HEW described such challenges, and the need for persistence:
[The people in the community] need to be told again and again to be convinced. They cannot easily accept what we tell them. They have difficulty detaching themselves from the old ways of life. For example, to convince them to dig latrines for themselves we have had to tell them several times. They do not accept it at once. The problem is their old practices cannot be taken out of their minds easily. ¬– HEW, P16, W5
Theme #4: Community engagement and leadership are critical to HEW success.
Across both higher and lower performing PHCUs, informants noted the importance of community leadership and ownership of health and healthcare as essential to being successful in improving use of the health center and adoption of recommended health behaviors. The 1:5 networks at the village level and HDA, referred to typically as the WDA by PHCU staff and community members, play a critical role in community mobilization and awareness. HEWs described community support this way:
For example, members from one-to-five structure and from development groups, after getting the lesson from us, they go and teach the community. At the same time, they assess the problems from the community and they report to us. We also make discussion with the heads of the woreda health office and HC staff about the one-to-five structure, heads of development groups. We have been doing good with development groups and one-to-five relationships structure. – HEW, P64, W3

35
Health Extension Workers’ Time Motion Study Complemented by In-depth Interviews, Ethiopia
In-Depth Interview Results
The WDAs…help us in identifying, registering, and reporting pregnant women. In addition, WDAs would report [to us] who in the community failed to maintain health extension packages, who actually got benefits, and what the [received] packages look like as main sources of information on the households…By using a chain, we empower HEWs and the HEWs empower the WDAs, then the WDAs are expected to enable the community. – HEW supervisor, P6, W2
Although the community commitment varied across PHCUs, with some engaging religious and kebele leadership and others less so, staff interviewed in all woredas highlighted that such engagement was necessary. Additionally, it was evident across interviews that the kebele council had a critical role in health promotion and mobilizing the community. One urban health extension professional and then a Woreda health officer reported as follows:
We always approach them [the community] through their leaders. We go with the leader. Why? Because it is the community who elected the leaders and it is to the leaders that the people tell their problems. Since they live in the same area, we go to them through the leader. If the community has problems, we deal with it through the garee [sub-kebele] leader. - HEP, P28, W4
We tell the spiritual fathers of these people about the problems…after we fail in approaching them on our own, [spiritual leaders] immediately approach the matter; it is often successful. We also use the kebele to get some people who always fail to show up on meetings; these people leave to work early in the morning and the health extension worker could never get them when she goes to their home in the morning. Therefore the kebele calls these people for meeting. – Woreda health office head, P63, W4
Theme #5: Health centers and hospitals were described as poorly connected; quality of connections among woreda health office, health center, and HEWs varied
Informants noted “gaps” or “loose linkages” among the parts of the PHCU: health post, health center, and the hospital. Key informants described limited linkages in the referral system between health centers and hospitals. Health center staff, HEWs, and community members described that little information was shared back to the health center or community after patients were discharged from the hospital; hospital-based staff indicated that patients were referred without prior notification and at times when no bed was available; some suggested that patients sometimes unnecessarily bypassed the health center to access the hospital directly. The concerns of health center staff and HEWs was illustrated with this quotation by health center director:
There is no feedback from [the] hospital that says you have sent such patients and [we] have reached this result…We don’t know whether the patients are dead or alive. For example, there are poisoned patients which were beyond our capacity and we referred them. We hear from others that some of them died. Otherwise they don’t inform us through feedback. – Health center director, P32, W2
The concerns of the hospital-based staff are illustrated with this quotation by hospital referral focal person:
Referral linkages are mostly very poor…In relation to delivery, they send cases to which solution can be sought at the health centers, [and there are] shortcomings in the information about the patient that they are supposed to record and send to us. – Hospital referral focal person, P15, W5
One example of strong linkage between health centers and hospitals was apparent as described by a hospital medical director as follows:
Our hospital is a “lead” hospital [in EHAQ, the Ethiopia Hospital Alliance for Quality], and we have monthly meeting with health center heads and delivery room workers. During such meetings, we discuss major challenges and how to tackle the challenges. They present what they have been doing in the past one month like how many they referred, how delivery service [was] conducted. We have a liaison officer who would compile all referrals from the health centers, and summary of reports are given to the health centers. Like 40 mothers referred from you and of these 30 gave birth normally and 10 delivered through cesarean section and the major causes of operation. We create such teaching and experience sharing sessions. There is also tele-consultation i.e., we maintain close phone contact and we provide professional consultations. The midwives at health centers would come here and get facilitated training and practice on several issues like BEmOC (basic emergency obstetric care) and newborn care and we have strong relationship. We give

36
Health Extension Workers’ Time Motion Study Complemented by In-depth Interviews, Ethiopia
In-Depth Interview Results
them supplies, delivery kits, dustbins, delivery coaches, wheelchairs and others. We also had done need assessment on all health centers and based on that finding we developed a proposal and submitted it to FMoH and health bureau. We know what support they require to deliver better service and we will do all possible to make that a reality. – Hospital medical director, P47, W7
Theme #6: The urban health extension program was described as not meeting the needs of many urban communities.
Informants reported differences in the rural and urban health extension program. The health extension program was originally designed with the aim of serving rural areas, while services demanded by the community are different in urban settings as compared to rural settings.
Specifically, informants indicated that the health extension package needs to be reformulated to fit the needs of higher-income people living in urban areas.
It is easy to penetrate the low-income community and provide health education while the other group [high-income] will create a challenge. They may claim to have their own doctor, and they don’t want to spend their time with the HEP workers; they may even do not respond whenever their door is knocked. – Woreda administrator, P50, W7
Informants also suggested that the hygiene and environmental sanitation educational efforts by HEWs were not perceived as valuable by urban dwellers.
Most [urban] people think that they know a lot, and when you tell them about the washing facility after [using the] toilet, most of them think that it is a rural thing to do…there are cases when people disappear, hide or abandon their place whenever you attempt to approach them. – HEP, P69, W1
Informants described urban communities as having less respect for HEWs compared with rural communities. Informants noted that urban community members, especially those regarded as educated, looked down upon HEWs and did not value their work, as described here:
Because of the fact that they are urban people they consider themselves educated and they speak to you rudely when you attempt to advise them. They say to you, why don’t you clean it up then? And they also say, I won’t do it and even if I did it’s for my own sake and not for you. They consider us unwanted and nagging; they therefore avoid us when we try to approach them and they say there are no children in the house when there are children. – HEP, P39, W4
Last, HEWs reported that urban dwellers are often not home when they try to visit, as illustrated by this quotation.
The complex socio-cultural and diverse economy of the Addis Ababa habitants [is a challenge]. If you go to rural areas homogeneity is more observed in the form of culture and language and it is relatively easier there. For example, there could be a religious holiday and you could get all villagers assembled. But here, [urban areas] asking health extension workers to find them [the community even] during weekends is very difficult. – HC director, P49, W7

37
Health Extension Workers’ Time Motion Study Complemented by In-depth Interviews, Ethiopia
In-Depth Interview Results
IV.C. Themes from higher performing woredas
Six themes emerged among higher performing woredas, summarized in Figure 3.
Figure 3. Recurrent themes among higher performing woredas
1. Staff reported examples of success within their woreda
· Latrine construction
· Skilled birth attendance rates
· Community engagement
2. Strong collaboration among HDAs, kebele councils, HEWs, and health centers
3. Active use of data for problem solving
4. Routine procedures to monitor and improve performance
5. HEWs were well respected among communities
6. Cross-sectoral efforts used to promote health
Informants in higher performing woredas reported meaningful success within their woreda, pertaining to latrines being constructed and used, skilled birth attendance rates, and community engagement generally, which are recounted by two informants here:
The extension health workers in collaboration with one-to-five relational structure and the development heads have made much effort and people have shown changes: mothers give birth in health center, and babies come to health centers for vaccine and others. - HEW, P64, W3
Previously those [latrines] constructed by the package were being destroyed. But now everybody is free from feces and the community is producing its health by itself. Wherever we go everybody has latrine. When I was assigned as a health worker in one kebele there was only one latrine [in the whole kebele]. But now when we go to that kebele every household has latrine. – Zonal health office deputy head, P35, W2
These staff and community members noted a higher degree of collaboration among the HDA, kebele councils, HEWs, and health centers. Team dynamics were described as effective in these areas, helping to motivate employees and performance, as illustrated by urban health extension professionals and woreda health officers.
The support starting from the lower level is that there is an information exchange channel with the one to five and the one to thirty arrangements. With regards the technical things we must take to the kebele and the health center…material inputs that assists you in your daily task shall be considered here; what I am referring to is pen, paper, charts, books, pamphlets and the like. We take these things from the health center and if not from the health department. We ask sometimes from the municipality; the sub city assist us as much as they can and we don’t ask them everything. For instance if we are out of consumables like pen and the like we don’t ask them but the kebele command post. – HEP, P69, W1
Any task related to health is performed better in teams; individualism is not the best way to get the job done well. So we work in teams we get supports starting from the grass root - the society. For example, say we want to accomplish a certain task in a certain village, we work together with people from that community, which provide the manpower and other inputs necessary. – Woreda health office head, P22, W3
Higher performing regions also reported the active use of data for problem solving with root cause analyses as means of continuous improvement efforts. Feedback, planning, and supportive supervision emerged as important during teamwork in these regions.

38
Health Extension Workers’ Time Motion Study Complemented by In-depth Interviews, Ethiopia
In-Depth Interview Results
We would bring the [evaluative] findings to the health center after the supervision. We would sit with the head of the health center and discuss the [ones who have achieved the] best performances and identified gaps. Our main principle is to make the best performances continue. In addition, we discuss why the gaps were created and how we are going to correct it. We develop a feedback on how the work should proceed; then we would try to reach a consensus with the HEWs. – HEW supervisor, P6, W2
In some examples, problem solving included learning from others’ successes.
In the past, mothers used to be sent home if they were diagnosed to have false labor and the real thing happens while they were at home and they deliver there. To tackle such problem we have adopted what the Tigray region is already doing that is we have waiting area for those diagnosed with false labor. In this waiting area there is coffee ceremony, porridge and oatmeal will be prepared there while she is being followed. This has created a sense of home environment and a feeling of being among family. The mothers stay till they give birth here. – Health center director, P24, W7
Informants remarked on routine procedures used to improve workers’ performance. These included routine monitoring and feedback, recognizing good performance, and teaching others about what they viewed as best practices or ideas worth scaling up.
There is a command post evaluation meeting with the zonal leaders once or twice a week. As I told you earlier, there is a feedback session during the planning phase [to see] if the planning is exaggerated or under planned. During mid-term evaluations [zonal leaders] will attend the sessions and will give us their constructive comments. In addition, they will also do the field assessments. During the field assessment visits they will crosscheck our reports with the actual activity on the ground. Basing the comments from the zone, if there are gaps, then we will fill those gaps together. And if there are best practices, we will try to illuminate them more. – Woreda administrator, P8, W2
Supervisors across administrative levels in higher performing woredas reported using checklists to monitor employee trainings and performance. The link for supervision was described by a HEWs and HEW supervisors in an urban area as follows:
We get lots of help from the supervisor; one is filtering data at the health center; they also help us by involving in works in a manner supported by checklists. Also in external works, they help us to resolve problems by discussing with the kebele administration. They provide training with us from the lower level at the villages to the other end up to development team. They also go with us to the villages and work on household level when there is a problem related with toilets. The most vital role is that they work with us to resolve problems by discussing with the concerned kebele leadership and the village. They come and discuss with kebele leadership to assess the problems that exist in the line of work, they take information and seek solution by making the necessary discussion. – HEW, P83, W6
He [the supervisor] sees all registrations. If there is any gap he asks why this gap happens. He calls us and shows us by giving examples. When we do house to house visit, without meeting us he enters into the village and sees some houses. Then he tells us that, I have seen these houses, there are these and these gaps. He discusses with us about how these gaps can be corrected. But there is no health worker who is regularly working with us by going house to house. As he supports three kebeles, when the turn is to our kebele, he comes to stay for up to 7 to 8 hours. – HEW, P2, W2
Supportive supervision is provided by going to the supervisee [HEW] using checklists to observe, for example, the conditions of training provided by the HEP worker, timing of training, number of participants and the like… For those community members who have been trained previously, I need to go down to [their workplace] and monitor how the members have been implementing what they obtained from the training, again based on the checklist. I will interview model householders also. – HEW supervisor, P5, W7
In higher performing woredas, the HEWs were reportedly well respected and listened to by the community. Additionally, although some struggles with human resource vacancies were noted, this problem did not dominate the experience of the informants as it did in lower performing woredas. Here, a HEW recounts her experience working with community members:

39
Health Extension Workers’ Time Motion Study Complemented by In-depth Interviews, Ethiopia
In-Depth Interview Results
The people on my site…usually welcome me into their home and offer me cup of tea or coffee. It is only sometimes that I face people who resist my service and my persistence win them over through continuous visiting, involving other members of the community to convince them and giving them brochures and fliers for them to read…I’m continuously following them up. – HEW, P45, W7
In higher performing woredas, informants noted the importance of cross-sectoral investments and collaborations to promote health. Agriculture and education were viewed not as competing with health, but as contributing to the health goals of the community as well. One woreda health office head described how education and agriculture sectors also work to improve the community’s health.
The education sector also has responsibilities like educating children about pregnancy follow up, immunization and so on and so forth through education awareness will be created in schools. Moreover, in the agriculture sector it will enable the community to eat a balanced diet, this is one package of the health sector… there is [also] what we call ‘protein corn’- this means it is a corn which is rich in protein. Therefore, if the farmer produces and uses this protein corn then it means the farmer has [benefited from high protein diet] got protein. – Woreda health office head, P9, W2
Inter-agency relationships spanning several sectors and multiple administrative levels were harmonized in higher performing woredas. Also apparent in higher performing woredas was coordination among health extension and hygiene, maternal and child health, disease prevention and control case teams in steering the work of HEWs.
IV.D. Themes from lower performing woredas
Two themes emerged about performance of HEWs among lower performing woredas, summarized in Figure 4.
Figure 4. Recurrent themes among lower performing woredas
1. Poor engagement between HEWs and the community
2. Deep-rooted cultural practices perceived as difficult to change
Poor engagement between HEWs and the community was evident in low performing woredas, and in some cases, the HEWs were either not taken seriously by the community or not respected altogether. Health extension workers needed to work hard to convince the community particularly around building latrines and separating animal and human living quarters.
The community challenges us… when we get to their homes and tell them to maintain sanitation there are people accusing you of trespassing and entering a private property without court order; they may also attempt to beat you up. – HEW supervisor, P36, W4
Most of the time people seem to look down on our work. There are times when they could not trust our work. There is some contempt from the community. As a result, sometimes it may take us a lot of time to convince them on certain issues. We have to see them frequently and tell them over and over to convince them… They have difficulty detaching themselves from the old ways of life. For example, to convince them dig latrines for themselves we have to tell them several times. – HEW, P16, W5
The community is so hard to deal with. They do not come to meetings. Whenever we plan to tell the community about health, we will not find anyone to tell the information to. – HEW, P27, W5
Aspects of the local deep-rooted cultural practices were in conflict with recommended health behaviors and difficult to change as described by a woreda administrator as follows:
There is a lack of understanding with the society in terms of prevention as the awareness was dominated by the traditional practices that prevailed for centuries with the society. For instance they don’t take pregnant women to heath

40
Health Extension Workers’ Time Motion Study Complemented by In-depth Interviews, Ethiopia
In-Depth Interview Results
facilities for follow-up and delivery as they insist to give birth at home. Also concerning toilets and sanitation, there is a trend of not quickly getting used to a new approach by quitting the old tradition. – Woreda administrator, P82, W6
IV.E. Summary of interview results
These findings help to characterize the existing connections and collaborations within the PHCU, and to illustrate the importance of the community’s awareness, acceptance, and engagement with the health extension program. Recurrent themes emerged across all woredas that describe the nature of these connections. Analysis of higher performing woredas compared with lower performing woredas helped to further understand the nuances and realities of the program.
Across all woredas, it was evident that HEWs and other staff took pride in their position within the PHCU, enjoyed serving the community; however, demotivating factors with regards to their position and career were notable, including slow progress in professional career growth, inadequate in-service refresher trainings, and financial limitations (both personal and institutional). Persistence was a dominant theme across all woredas, as informants described continuing their work despite challenges they faced. It was clear that community engagement and leadership is critical to HEW success, which includes leadership in health by influential community members such as the HDA, religious leaders, and kebele council members. Informants described problems with poor linkages between health centers and hospitals with regards to communication and feedback regarding patient referrals. Last, while the rural health extension program was viewed as fitting in many communities, the urban health extension program model was viewed as not meeting the needs of urban communities.
Among higher performing woredas, informants reported examples of success with latrine construction and use, skilled birth attendance rates, and community engagement in general. They indicated a higher degree of collaboration between the HDA, kebele councils, HEWs, health centers, and the woreda health office. Informants from higher performing woredas described the use of data and problem solving as means of continuous improvement efforts, and noted having routine procedures in place to monitor and improve performance. Across higher performing woredas, HEWs were reportedly well respected among their communities. Informants from higher performing woredas also described cross-sectoral collaborative efforts to promote health, including use of agricultural and educational sectors.
Among lower performing woredas, limited engagement between the HEWs and the community was evident and deep-rooted cultural practices were perceived as difficult to change.

41
Health Extension Workers’ Time Motion Study Complemented by In-depth Interviews, Ethiopia
Conclusions and implications
V. Conclusions and ImplicationsGiven the critical role of the health extension workers in Ethiopia’s primary care system, understanding how their time is spent is a critical element of evaluating current contributions and identifying opportunities for further improvement to enhance HEW satisfaction, preparation, and productivity. In this study diverse set of HEWs were directly observed and this was complemented by rich qualitative dataset to place the results into context.
The results of this study should be interpreted in light of its limitations. First, the Hawthorne effect may have resulted in an overestimation of HEW productivity if the presence of the observer motivated the HEW to engage in more work-related tasks than usual. Based on the relatively low proportion of time spent on direction provision of health education and services, as well as debriefs with data collectors after each wave of data collection, it is believed that observation bias is minimal. Second, because these results are drawn from urban and rural contexts, no implications can be drawn about the fit of the HEW program in pastoralist settings, in which future in-depth observation is needed. Third, this study was not designed to control for integrated community case management (iCCM) sites, which have been associated with increased productivity and increased proportion of HEW time spent in the health post.21 Associations between presence of development partner and site performance were assessed retrospectively and no association was found, suggesting that this is not a confounding variable in the present analysis. Fourth, many stakeholders have emphasized the importance of seasonality on HEW work. This study was conducted during the late dry/early rainy season. Although HEW work may vary from season to season (as it does from region to region) distribution of time spent on different activities did not vary significantly between lower and higher performers, and the qualitative findings provide information that is applicable across seasons. Last, although most of the data in this study were based on direct observation, recall bias may have limited the accuracy of the reported participation in seasonal and infrequent activities like training over the past 12 months.
With the exception of time spent on community mapping and mobilization, HEW time spent on different activities did not vary significantly between lower and higher performers, even when looking at rural sites only. While not significant, HEWs from higher performing woredas spent more time providing health education and services, more time in the community building relationships, and less time waiting for patients in the HP. This is consistent with the qualitative findings that showed community engagement as a key differentiating factor between higher and lower performing woredas. Differences in time spent on mapping and mobilization in higher versus lower performing PHCUs may reflect a more proactive, planned approach to community engagement that goes well beyond allocation of time. Relationships and engagement with the community, particularly the HDA and kebele councils were far greater in higher performing PHCUs. Additionally, higher performing PHCUs were described as particularly strong in using data for monitoring and problem solving and benefited from cross-sectoral collaboration to promote health.
Implications of the study are several:
1. The HEW model has been successful in many woredas, and lower performing PHCUs may benefit from: (1) greater community leadership and collaboration with HEWs, (2) stronger relationships between the woreda health office and zonal/regional authorities, and (3) more consistent use of data for monitoring, problem solving and accountability for PHCU-wide performance, as measured by a manageable set of PHCU key performance indicators.
2. Persistent work is needed to build the capacity and improve relationships within and around lower-performing PHCUs. Cross-PHCU alliances may be a useful approach to promote collaboration and sharing of best practices between higher and lower performing rural woredas in the same geographic areas.
3. Greater community mobilization and demand generation by the HDA may improve HEW efficiency and impact.
4. Tailoring of health extension platform to urban settings is essential to meet the needs of the growing urban population. Home visits and the content of the health packages both could be rethought to better fit what urban dwellers want and need.
Opportunities for further investigation are several. The time allocations of HEWs did not differ significantly between the higher and lower performing woredas, this could be due to limited sample size and cross-sectional nature of the data.
21 Miller NP, et al., 2014. Integrated Community Case Management of Childhood Illness in Ethiopia: Implementation Strength and Quality of Care. Am. J. Trop. Med. Hyg., 91(2), 2014, pp. 424–434.

42
Health Extension Workers’ Time Motion Study Complemented by In-depth Interviews, Ethiopia
Conclusions and implications
Further study with more than one round of data collection at different time points could provide stronger findings to look at differences by high and low performance and other characteristics. Additionally, this analysis was based on average time allocations; examination of a threshold effect in which some extreme level of HEW productive time associated with woreda performance is also possible. Furthermore, this analysis treated each HEW as an individual observation, rather than in pairs, which may lend additional insights. Last, the themes derived from the in-depth interviews presented in this report were drawn from analysis across a diverse group of key informants. An HEW-only sub-analysis may yield a more nuanced understanding of the constraints and opportunities in primary care as articulated by the HEWs themselves.

43
Health Extension Workers’ Time Motion Study Complemented by In-depth Interviews, Ethiopia
Appendix 1: HEW Activities Categorized within “Providing Health Education and Services”
Appendix 1. HEW activities categorized within “Providing Health Education and Services”
Package Area Service Packages Specific Activities Preventive/Curative
Hygiene and Environmental Sanitation
Building and Maintaining Healthful House Preventive
Construction, Usage and Maintenance of Sanitary Latrine Preventive
Control of Insects, Rodents and other Biting Species Preventive
Food Hygiene and Safety Measures Preventive
Personal Hygiene Preventive
Solid and Liquid Waste Management Preventive
Water Supply Safety Measures Preventive
Family Health Service Family Planning Preventive Preventive
Preventive Preventive
Maternal Health Preventive Preventive
Delivery Curative
Facilitate referral for maternal health complications
Curative
Postnatal care Preventive
Maternal Nutrition Preventive
TT Vaccination Preventive
PMTCT Preventive
Health Education on Maternal Health
Preventive
Newborn Care Care for healthy newborn Preventive
Care for sick newborn Curative
Health education on newborn care
Preventive
Child Care Care for sick child: Fever Curative
Care for sick child: Vomiting Curative
Care for sick child: Diarrhea
Curative
Care for sick child: Malnutrition
Curative
Care for sick child: Cough Curative
Care for sick child: Referral for seriously sick child
Curative
Child Vaccination Preventive
Health education on Child Care
Preventive
Nutrition Mother, Infant and Young Child Nutrition Services
Preventive
Growth Monitoring and Promotion
Preventive

44
Health Extension Workers’ Time Motion Study Complemented by In-depth Interviews, Ethiopia
Appendix 1: HEW Activities Categorized within “Providing Health Education and Services”
Package Area Service Packages Specific Activities Preventive/Curative
Disease Prevention and Control
HIV/AIDS and Tuberculosis Prevention and Control
HIV/AIDS - Distribute Condoms
Preventive
Health Education on HIV/AIDS or other STIs
Preventive
Voluntary Counseling and Testing
Preventive
PMTCT Preventive
Assess for STIs Preventive
TB DOTs giving medicines Curative
TB DOTs defaulter tracing Curative
TB case detection Preventive
Malaria Prevention and Control
Distribute ITNs Preventive
IRS Campaign/Prophylaxis for high risk groups
Preventive
Identify vector breeding sites/environmental management
Preventive
Test and/or treat malaria (>5 years)
Curative
Health Education on Malaria
Preventive
First Aid First aid - provide Curative
First aid - refer Curative
First aid - health education Preventive
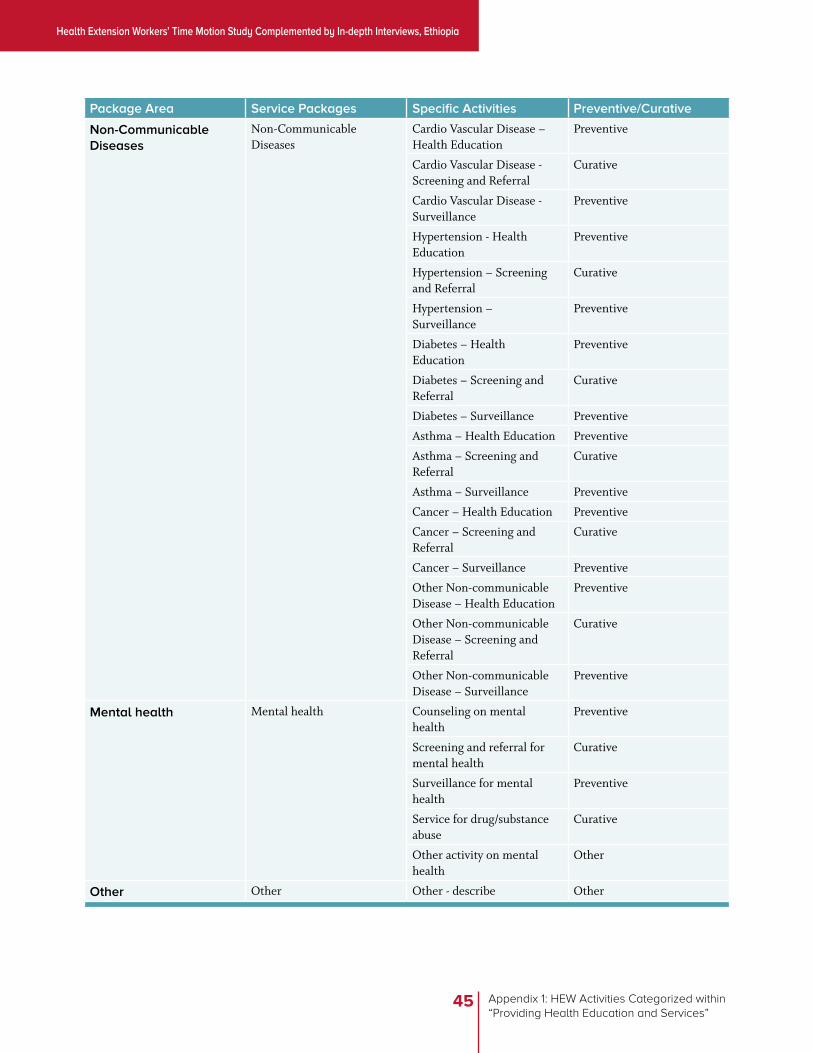
45
Health Extension Workers’ Time Motion Study Complemented by In-depth Interviews, Ethiopia
Appendix 1: HEW Activities Categorized within “Providing Health Education and Services”
Package Area Service Packages Specific Activities Preventive/Curative
Non-Communicable Diseases
Non-Communicable Diseases
Cardio Vascular Disease – Health Education
Preventive
Cardio Vascular Disease - Screening and Referral
Curative
Cardio Vascular Disease - Surveillance
Preventive
Hypertension - Health Education
Preventive
Hypertension – Screening and Referral
Curative
Hypertension – Surveillance
Preventive
Diabetes – Health Education
Preventive
Diabetes – Screening and Referral
Curative
Diabetes – Surveillance Preventive
Asthma – Health Education Preventive
Asthma – Screening and Referral
Curative
Asthma – Surveillance Preventive
Cancer – Health Education Preventive
Cancer – Screening and Referral
Curative
Cancer – Surveillance Preventive
Other Non-communicable Disease – Health Education
Preventive
Other Non-communicable Disease – Screening and Referral
Curative
Other Non-communicable Disease – Surveillance
Preventive
Mental health Mental health Counseling on mental health
Preventive
Screening and referral for mental health
Curative
Surveillance for mental health
Preventive
Service for drug/substance abuse
Curative
Other activity on mental health
Other
Other Other Other - describe Other

46
Health Extension Workers’ Time Motion Study Complemented by In-depth Interviews, Ethiopia
Appendix 2. Discussion Guide for Key Informants Interview
Appendix 2. Discussion Guide for Key Informants Interview
Discussion guide for all key informants except community members / service users
1. We are interested in your work with the primary health care system would you please tell us how long you have worked in this facility or area?
· How long have you been in your current position? What other roles have you ever had before the current position?
· What is your educational background? Did you ever had any special in-service training related to your current position
2. Would you please tell us about the tasks you do regularly and your responsibilities?
3. Who do you work with in accomplishing your tasks? Please include peers, partners, and supervisors– people you work with regularly.
4. Can you tell us the kinds of support you get from people who work with you?
· Probes: information, training, financial support, technical help, comraderie friendship/companionship, etc.
5. Can you tell us the types of support you provide to people who work with you (peers, partners, supervisors)
· Probes: information, training, financial support, technical help, comraderie/friendship/companionship, etc.
6. Can you tell us about some situations where you had a challenge at work? What was the nature of the challenge, what happened? How did it go? What did you have to work through to be successful?
7. What generally are problems other people in your role face? What do you suggest to address these problems?
8. What do you enjoy most about your job? What do you enjoy the least? Can you explain why?
9. Is there anything that you want to tell us that will help us understand your experience and the health system better?
10. Is there anyone else you think we should talk to better understand the health care system (use this question depending the context)?
Discussion guide for community members or service users
1. We would like to talk to you about the interaction with the service providers and the health services you get from HDAs, HEWs, Health Centers and Hospitals.
2. Have you ever heard of HEP/ HEW/HDA?
3. If you want to get basic health services where do you mostly go? (Contact HDAs, health post, health center, hospital)?
· Probes: Have you ever been visited at home by anyone to provide health education or other services in the last 6 months? Can you tell us who visited you and what happened during the home visit and your overall experience?
4. What kinds of services do you get from the [HEW/health center/hospital]?
· Probes: health education, treatment for sick children, treatment for sick adults, Immunization; Follow-up: Are you generally satisfied/ de-satisfied with the services that you get from HP/HC/Hospital? Would you please explain how and why?
5. Can you tell us about some situations where you or other community members had a problem in getting health services? (What was the nature of the problem, what happened? How did it go? How do you think similar problems be avoided or addressed)?
6. Is there more information that you provide us about the health problems of the community and health care service delivery?
7. Is there anyone else you think we should talk to in order to better understand this primary health care system?


![Curriculum for Training AGRIC EXTENSION WORKERS[1]](https://img.pdfslide.us/doc/110x75/5528681849795928048b4832/curriculum-for-training-agric-extension-workers1.jpg)