Embed Size (px)
Citation preview
IOSR Journal of Mechanical and Civil Engineering (IOSR-JMCE)
e-ISSN: 2278-1684,p-ISSN: 2320-334X, Volume 9, Issue 4 (Nov. - Dec. 2013), PP 59-64 www.iosrjournals.org
www.iosrjournals.org 59 | Page
Modeling and Analysis for Cutting Temperature in Turning of
Aluminium 6063 Using Response Surface Methodology
A.Kannan1, K.Esakkiraja
2, Dr.M.Nataraj
3
1. Assistant Professor, SVS college of Engineering, Coimbatore,
2. Assistant Professor, Adithya Institute of technology, Coimbatore, 3. Associate Professor, Government college of technology, Coimbatore,
Abstract: Deviation in machining process due to the temperature influence, cutting force, tool wear leads to
highly inferior quality of finished product, especially in high speed machining operations where product quality
and physical dimensions seems to be meticulous. Moreover, temperature is a significant noise parameter which
directly affects the cutting tool and work piece. Hence the aim of this project work is to study the machining
effect on 6063 Aluminium alloy at varies combinations of process parameters such as speed, feed rate and depth
of cut; and also to determine the effect of those parameters over the quality of finished product. A L27
Orthogonal Array (OA) based Design of Experiments (DOE) approach and Response Surface Methodology
(RSM) was used to analyse the machining effect on work material in this study. Using the practical data
obtained, a mathematical model was developed to predict the temperature influence and surface quality of
finished product. The ultimate goal of the study is to optimize the machining parameters for temperature minimization in machining zone and improvement in surface finish.
Key words: Aluminium 6063, Turning, Cutting Temperature, Cutting Force, Surface Roughness, Response
Surface Methodology (RSM).
I. Introduction Increasing the productivity and the quality of the machined parts are the main challenges of metal-
based industry; there has been increased interest in monitoring all aspects of the machining process. Surface
finish is an important parameter in manufacturing engineering. It is a characteristic that could influence the
performance of mechanical parts and the production costs. The ratio between costs and quality of products in
each production stage has to be monitored and immediate corrective actions have to be taken in case of deviation from desired trend. The cutting temperature is a key factor which directly affects cutting tool wear,
workpiece surface integrity and machining precision according to the relative motion between tool and work
piece. The use of light weight materials are very much essential in the present day automotive world, hence the
need for study and design of machines and its parts using light weight materials such as aluminium, titanium,
magnesium and their alloys have increased extensively. Aluminium alloys are widely used for demanding
structural applications due to good combination of formability, corrosion resistance, weldability and mechanical
properties. Hence the present work is about machining of 6063 aluminium alloy at various combinations of
process parameters such as speed, feed rate and depth of cut and to determine the effect these parameters on
surface quality. Thus the aluminium alloy needs to undergo several machining operations. Variation during the
machining process due to tool wear, temperature, changes and other disturbances make it highly inefficient for
perfection, especially in high quality machining operations where product quality specifications are very restrictive. Therefore, to assure the quality of machining products, reduce costs and increase machining
efficiency, cutting parameters must be optimized in real-time according to the actual state of the process.
Parameters such as cutting speed, depth of cut and feed have influence on overall success of machining
operation. In this work, experimental results were used for modeling using response surface methodology. The
RSM is practical, economical and relatively easy for use and it was used by lot of researchers for modeling
machining processes. Response surface methodology (RSM) is a combination of experimental and regression
analysis and statistical inferences. The concept of a response surface involves a dependent variable y called the
response variable and several independent variables x1, x2,. .., xk. If all of these variables are assumed to be
measurable, the response surface can be expressed as y = f (x1; x2; . . . ; xk) (1) Optimizing the response
variable y, it is assumed that the independent variables are continuous and controllable by the experimenter with
negligible error. The response or the dependent variable is assumed to be a random variable. In our experiments
turning operation was selected due to, it is necessary to find a suitable combination of cutting speed (x1=ln V), feed rate (x2 = ln f), depth of cut (x3 = ln doc) and approach angle (x4 = ln Κ) that optimize cutting force (y = ln
F).
Modeling And Analysis For Cutting Temperature In Turning Of Aluminium 6063 Using Response
www.iosrjournals.org 60 | Page
II. Experimental Work 2.1. Experimental set-up
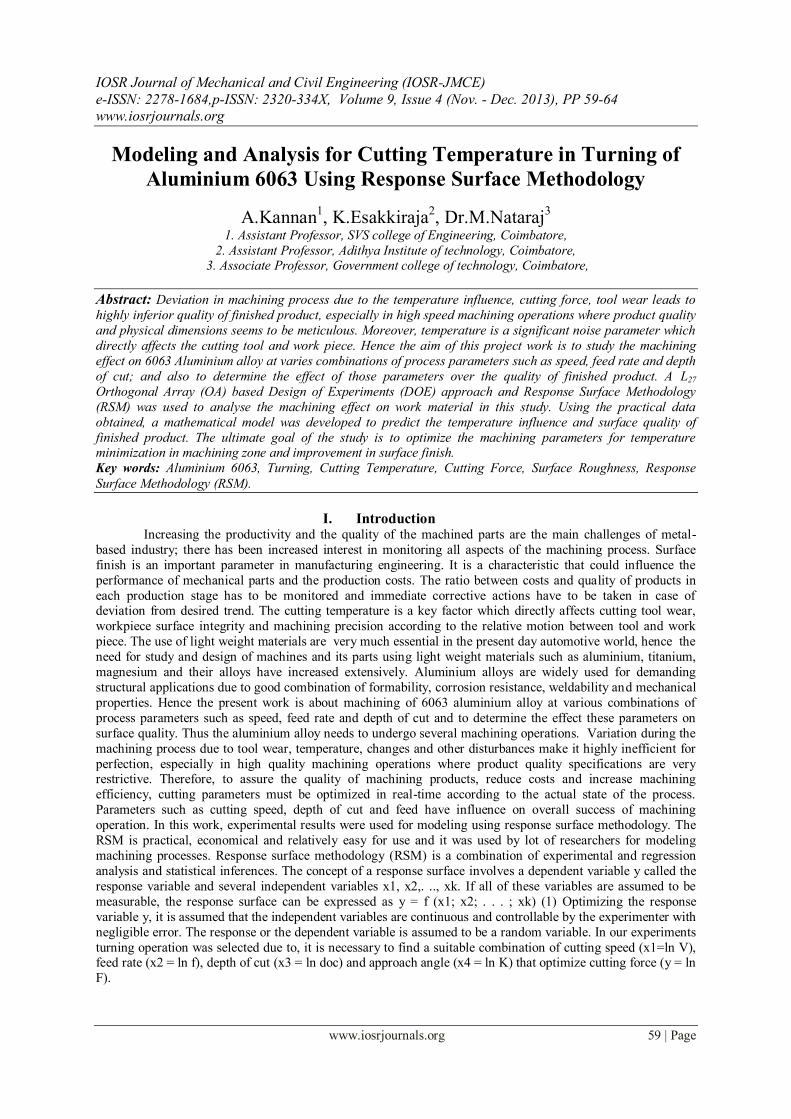
A Kistler force three component dynamometer (Type 9215A1, calibrated range: Fx.0±5000
N,Fy.0±5000 N, and Fz.0±3000 N) in conjunction with three Kistler charge amplifiers (Type 5070), used to
convert the dynamometer output signal into a voltage signal appropriate for the data acquisition system, and a
computer were used to measure and record the cutting forces. The instrument shown in figure 1 is a Kistler three
component dynamometer and the figure 2 is a multi channel charge amplifier.
Figure 1: Kistler Three component Dynamometer Figure 2: Charge Amplifier
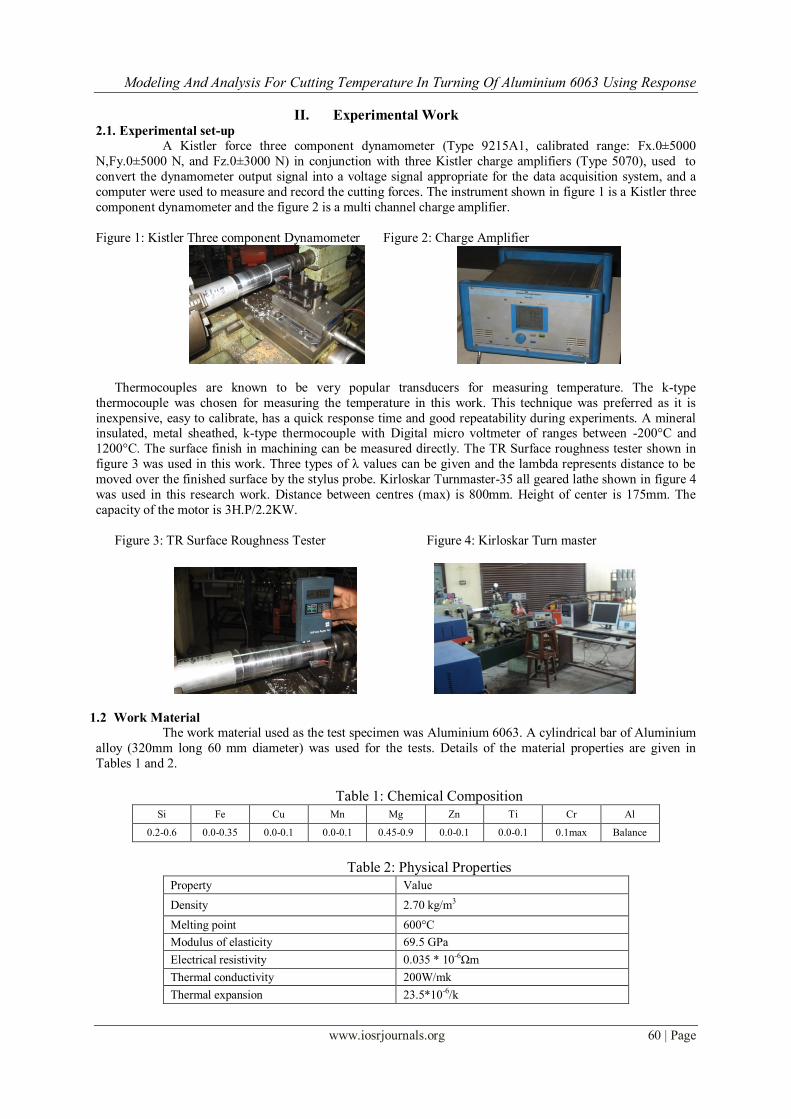
Thermocouples are known to be very popular transducers for measuring temperature. The k-type
thermocouple was chosen for measuring the temperature in this work. This technique was preferred as it is
inexpensive, easy to calibrate, has a quick response time and good repeatability during experiments. A mineral insulated, metal sheathed, k-type thermocouple with Digital micro voltmeter of ranges between -200°C and
1200°C. The surface finish in machining can be measured directly. The TR Surface roughness tester shown in
figure 3 was used in this work. Three types of λ values can be given and the lambda represents distance to be
moved over the finished surface by the stylus probe. Kirloskar Turnmaster-35 all geared lathe shown in figure 4
was used in this research work. Distance between centres (max) is 800mm. Height of center is 175mm. The
capacity of the motor is 3H.P/2.2KW.
Figure 3: TR Surface Roughness Tester Figure 4: Kirloskar Turn master
1.2 Work Material
The work material used as the test specimen was Aluminium 6063. A cylindrical bar of Aluminium
alloy (320mm long 60 mm diameter) was used for the tests. Details of the material properties are given in
Tables 1 and 2.
Table 1: Chemical Composition
Si Fe Cu Mn Mg Zn Ti Cr Al
0.2-0.6 0.0-0.35 0.0-0.1 0.0-0.1 0.45-0.9 0.0-0.1 0.0-0.1 0.1max Balance
Table 2: Physical Properties
Property Value
Density 2.70 kg/m3
Melting point 600°C
Modulus of elasticity 69.5 GPa
Electrical resistivity 0.035 * 10-6Ωm
Thermal conductivity 200W/mk
Thermal expansion 23.5*10-6/k
Modeling And Analysis For Cutting Temperature In Turning Of Aluminium 6063 Using Response
www.iosrjournals.org 61 | Page
1.3 Tool Material
Tungsten carbide inserts were used for the turning tests. These inserts are manufactured by Sandvik.
Uncoated carbide inserts as per ISO specification THN SNMG 08 were clamped onto a tool holder with a designation of DBSNR 2020K 12 for turning operation. The parameter levels were chosen within the intervals
based on the recommendations by the cutting tool manufacturer.
1.4 Design of Experiment
A commercial statistical analysis software “Design Expert” was employed for design of experiment. In
Design Expert, RSM is used to find a combination of factors which gives the optimal response. RSM is actually
a collection of mathematical and statistical technique that is useful for the modeling and analysis of problems in
which a response of interest is influenced by several variables and the objectives is to optimize the response.
Three process parameters at three levels led to a total of 27 tests for turning operation. Three levels were
specified for each of the factors as indicated in Table 3. The standard orthogonal array chosen was L27, which
has 27 rows and 26 degrees of freedom. Two tests were performed for each combination for turning operation resulting that 54 tests were conducted. Table 4 presents the experimental details and their results.
Table 3: Factors and Levels
Factor Assignment Levels
Level 1 Level 2 Level 3
Speed(N) m/min A 100 150 200
Depth of cut(d)mm B 0.25 0.5 1
Feed rate(f)mm/rev C 0.05 0.075 0.1
Table 4: Orthogonal array and their results
Runs
Cutting
Speed
(m/min)
Feed Rate
(mm/rev
Depth of
cut
Temperature
(Degree Celsius)
Surface Finish
(Micrometer)
Cutting force
(Newton)
1 100 0.05 0.25 90.8 1.024 51.59
2 100 0.05 0.5 98 1.064 134.74
3 100 0.05 1 121.4 1.035 184.69
4 100 0.075 0.25 97.4 1.194 88.27
5 100 0.075 0.5 104.6 1.234 163.99
6 100 0.075 1 128 1.205 217.86
7 100 0.1 0.25 107 1.314 161.87
8 100 0.1 0.5 114.2 1.354 243.06
9 100 0.1 1 137.6 1.325 291.45
10 150 0.05 0.25 103.65 1.137 56.15
11 150 0.05 0.5 110.85 1.77 146.74
12 150 0.05 1 134.25 1.147 186.74
13 150 0.075 0.25 110.25 1.307 98.72
14 150 0.075 0.5 117.45 1.347 179.91
15 150 0.075 1 140.85 1.317 220.87
16 150 0.1 0.25 119.85 1.427 172.32
17 150 0.1 0.5 127.5 1.467 253.51
18 150 0.1 1 150.45 1.437 295.47
19 200 0.05 0.25 96.5 0.9546 21
20 200 0.05 0.5 103.7 0.994 102.19
21 200 0.05 1 127.1 0.965 150.59
22 200 0.075 0.25 103.1 1.124 41.56
23 200 0.075 0.5 110.3 1.164 135.36
24 200 0.075 1 133.7 1.135 183.76
25 200 0.1 0.25 112.7 1.244 127.77
26 200 0.1 0.5 119.9 1.284 208.96
27 200 0.1 1 143.3 1.355 241.78
Modeling And Analysis For Cutting Temperature In Turning Of Aluminium 6063 Using Response
www.iosrjournals.org 62 | Page
III. Mathematical Modeling The second order response surface equations have been fitted using Design Experts Software for all the
three response variables Cutting Temperature (T), Cutting Force (Fz) and Surface Roughness (Ra). The
equations can be given in terms of the coded values of the independent variables as the following:
T=122.2479167+2.85*A+8.124107143*B+15.3*C+0*A*B+0*A*C-0.008035714*B*C-
10.05*A^2+1.525*B^2+3.31875*C^2...... (1)
The R-Squared value of the above developed model was found to be 0.999977 which enable good prediction
accuracy.
Fz=204.4285943-18.12900357*A+53.18909179*B+64.11073167*C-1.7234675*A*B
-0.86332143*A*C-2.163118929*B*C-26.13381111*A^2+20.55340389*B^2-45.57261*C^2...... (2). The R-
Squared value of the above developed model was found to be 0.997634 which enable good prediction accuracy.
Ra=1.353075463-0.034971429*A+0.145004167*B+0.005327778*C-5E-05*A*B-4.2857*E-05*A*C+8.75E-
05*B*C-0.147688889*A^2-0.024938889*B^2-0.040929167*C^2...... (3)
The R-Squared value of the above developed model was found to be 0.999998 which enable good prediction
accuracy.
IV. Results and Discussions The purpose of the analysis of variance (ANOVA) is to investigate which turning parameters
significantly affect the performance characteristics. Usually, the change of the turning parameter has a significant effect on the performance characteristics when the F value is large. The percentage contribution
indicates the relative power of a factor to reduce the variation. For a factor with a high percentage contribution,
there is a great influence on the performance. The percentage contributions of the cutting parameters on the
cutting temperature are shown in Table 5.
Table 5: ANOVA Results for cutting temperature
The depth of cut was found to be the major factor affecting the cutting temperature (64.26%), whereas the feed
rate (17.8%) and the squared cutting speed (9.24%) were found to be the second and third ranking factors
respectively. The model F-value of 83012.96689implies the model is significant. Values of “Prob>F” less than 0.0500 indicate model terms are significant
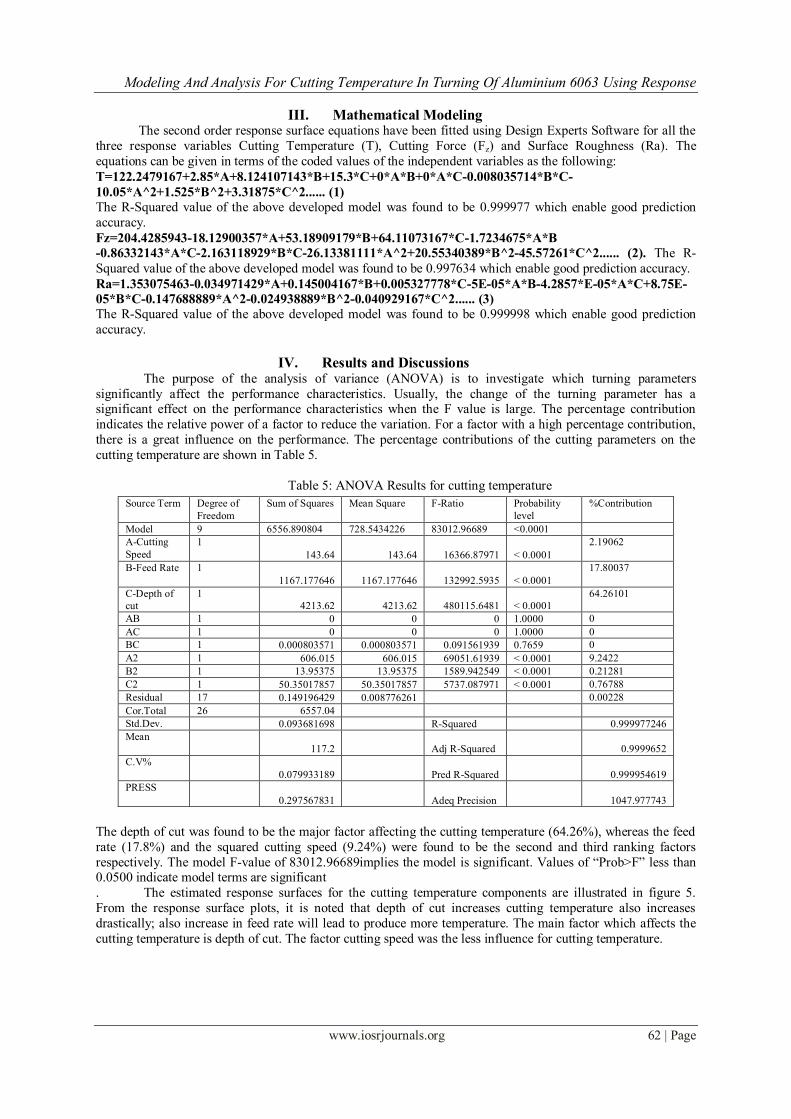
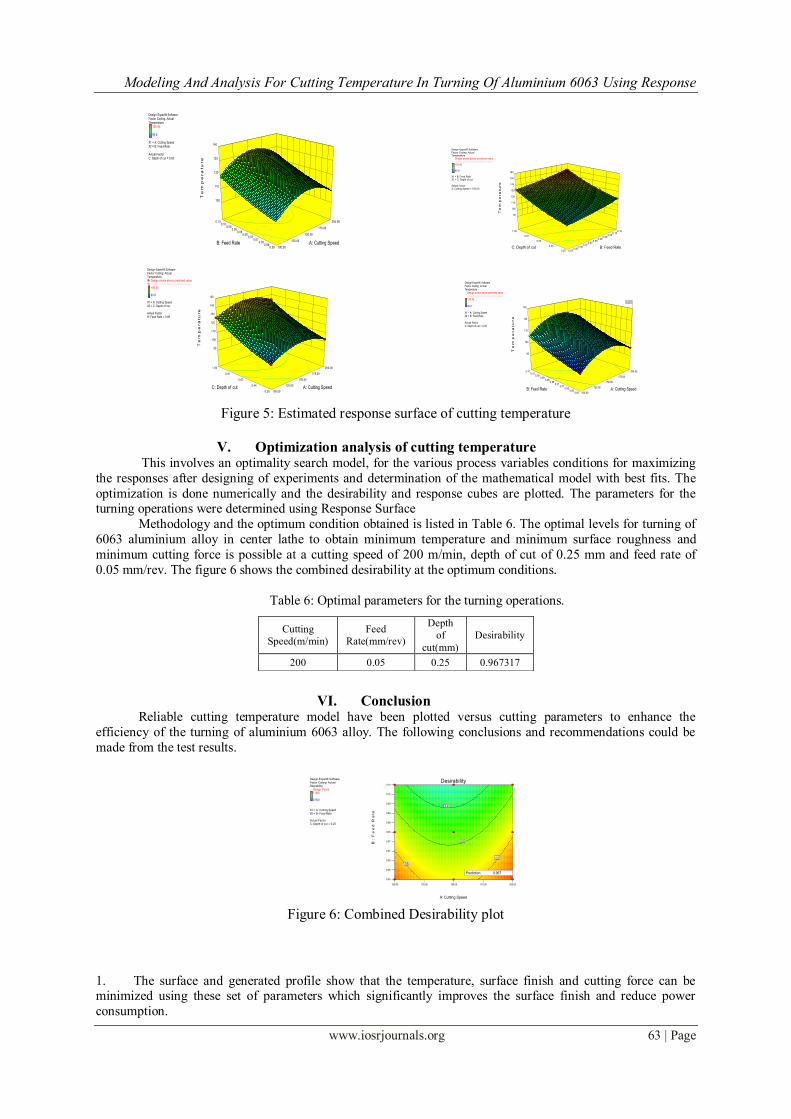
. The estimated response surfaces for the cutting temperature components are illustrated in figure 5.
From the response surface plots, it is noted that depth of cut increases cutting temperature also increases
drastically; also increase in feed rate will lead to produce more temperature. The main factor which affects the
cutting temperature is depth of cut. The factor cutting speed was the less influence for cutting temperature.
Source Term Degree of
Freedom
Sum of Squares Mean Square F-Ratio Probability
level
%Contribution
Model 9 6556.890804 728.5434226 83012.96689 <0.0001
A-Cutting
Speed
1
143.64 143.64 16366.87971 < 0.0001
2.19062
B-Feed Rate 1
1167.177646 1167.177646 132992.5935 < 0.0001
17.80037
C-Depth of
cut
1
4213.62 4213.62 480115.6481 < 0.0001
64.26101
AB 1 0 0 0 1.0000 0
AC 1 0 0 0 1.0000 0
BC 1 0.000803571 0.000803571 0.091561939 0.7659 0
A2 1 606.015 606.015 69051.61939 < 0.0001 9.2422
B2 1 13.95375 13.95375 1589.942549 < 0.0001 0.21281
C2 1 50.35017857 50.35017857 5737.087971 < 0.0001 0.76788
Residual 17 0.149196429 0.008776261 0.00228
Cor.Total 26 6557.04
Std.Dev. 0.093681698 R-Squared 0.999977246
Mean
117.2
Adj R-Squared
0.9999652
C.V%
0.079933189
Pred R-Squared
0.999954619
PRESS
0.297567831
Adeq Precision
1047.977743
Modeling And Analysis For Cutting Temperature In Turning Of Aluminium 6063 Using Response
www.iosrjournals.org 63 | Page
Design-Expert® SoftwareFactor Coding: ActualTemperature
150.45
90.8
X1 = A: Cutting SpeedX2 = B: Feed Rate
Actual FactorC: Depth of cut = 0.63
0.05 0.06
0.06 0.07
0.07 0.08
0.08 0.09
0.09 0.10
0.10
100.00
125.00
150.00
175.00
200.00
100
110
120
130
140
T
em
pe
ra
tu
re
A: Cutting Speed B: Feed Rate
Design-Expert® SoftwareFactor Coding: ActualTemperature
Design points above predicted valueDesign points below predicted value150.45
90.8
X1 = B: Feed RateX2 = C: Depth of cut
Actual FactorA: Cutting Speed = 150.00
0.25
0.44
0.63
0.81
1.00
0.05 0.06
0.06 0.07
0.07 0.08
0.08 0.09
0.09 0.10
0.10
90
100
110
120
130
140
150
160
T
em
pe
ra
ture
B: Feed Rate C: Depth of cut
Design-Expert® SoftwareFactor Coding: ActualTemperature
Design points above predicted valueDesign points below predicted value150.45
90.8
X1 = A: Cutting SpeedX2 = C: Depth of cut
Actual FactorB: Feed Rate = 0.08
0.25
0.44
0.63
0.81
1.00
100.00
125.00
150.00
175.00
200.00
90
100
110
120
130
140
150
T
em
pe
ra
tu
re
A: Cutting Speed C: Depth of cut
Design-Expert® SoftwareFactor Coding: ActualTemperature
Design points above predicted valueDesign points below predicted value150.45
90.8
X1 = A: Cutting SpeedX2 = B: Feed Rate
Actual FactorC: Depth of cut = 0.25
0.05 0.06
0.06 0.07
0.07 0.08
0.08 0.09
0.09 0.10
0.10
100.00
125.00
150.00
175.00
200.00
90
100
110
120
130
T
em
pe
ra
tu
re
A: Cutting Speed B: Feed Rate
96.4595
Figure 5: Estimated response surface of cutting temperature
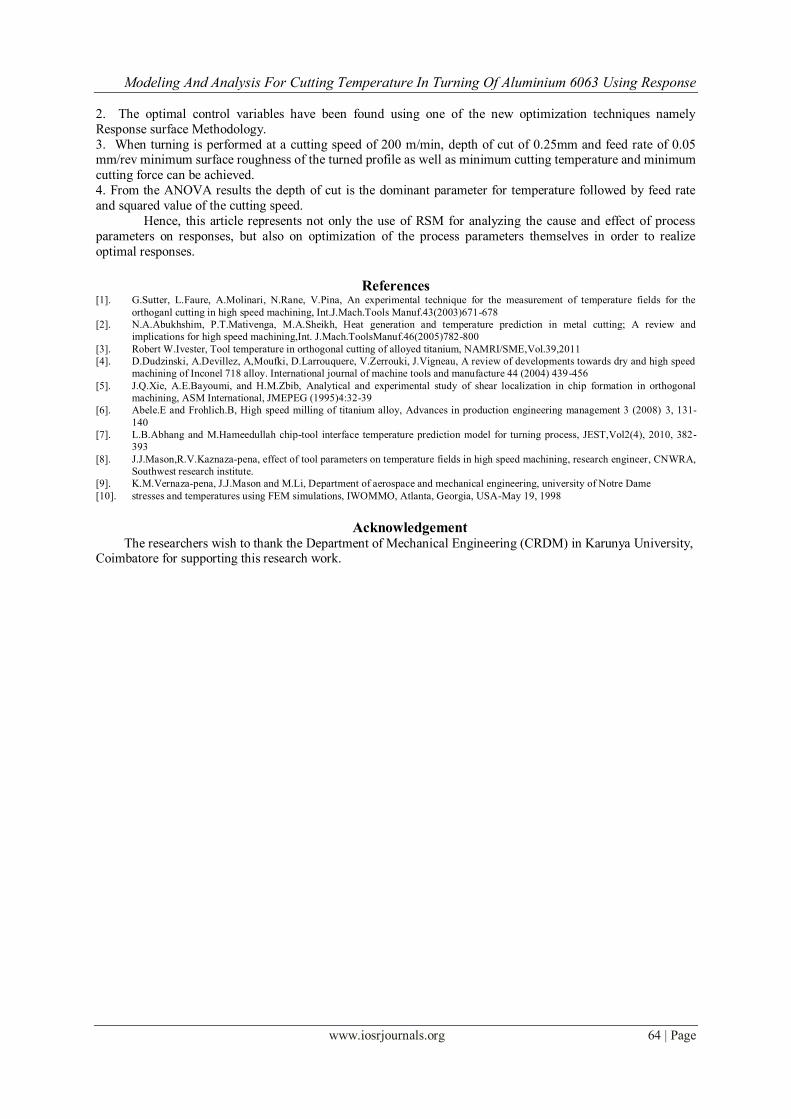
V. Optimization analysis of cutting temperature This involves an optimality search model, for the various process variables conditions for maximizing
the responses after designing of experiments and determination of the mathematical model with best fits. The
optimization is done numerically and the desirability and response cubes are plotted. The parameters for the turning operations were determined using Response Surface
Methodology and the optimum condition obtained is listed in Table 6. The optimal levels for turning of
6063 aluminium alloy in center lathe to obtain minimum temperature and minimum surface roughness and
minimum cutting force is possible at a cutting speed of 200 m/min, depth of cut of 0.25 mm and feed rate of
0.05 mm/rev. The figure 6 shows the combined desirability at the optimum conditions.
Table 6: Optimal parameters for the turning operations.
VI. Conclusion Reliable cutting temperature model have been plotted versus cutting parameters to enhance the
efficiency of the turning of aluminium 6063 alloy. The following conclusions and recommendations could be
made from the test results.
Design-Expert® SoftwareFactor Coding: ActualDesirability
Design Points1.000
0.000
X1 = A: Cutting SpeedX2 = B: Feed Rate
Actual FactorC: Depth of cut = 0.25
100.00 125.00 150.00 175.00 200.00
0.05
0.06
0.06
0.07
0.07
0.08
0.08
0.09
0.09
0.10
0.10Desirability
A: Cutting Speed
B:
Fe
ed
Ra
te
0.4
0.6
0.8
0.8
Prediction 0.967
Figure 6: Combined Desirability plot
1. The surface and generated profile show that the temperature, surface finish and cutting force can be minimized using these set of parameters which significantly improves the surface finish and reduce power
consumption.
Cutting
Speed(m/min)
Feed
Rate(mm/rev)
Depth
of
cut(mm)
Desirability
200 0.05 0.25 0.967317
Modeling And Analysis For Cutting Temperature In Turning Of Aluminium 6063 Using Response
www.iosrjournals.org 64 | Page
2. The optimal control variables have been found using one of the new optimization techniques namely
Response surface Methodology.
3. When turning is performed at a cutting speed of 200 m/min, depth of cut of 0.25mm and feed rate of 0.05 mm/rev minimum surface roughness of the turned profile as well as minimum cutting temperature and minimum
cutting force can be achieved.
4. From the ANOVA results the depth of cut is the dominant parameter for temperature followed by feed rate
and squared value of the cutting speed.
Hence, this article represents not only the use of RSM for analyzing the cause and effect of process
parameters on responses, but also on optimization of the process parameters themselves in order to realize
optimal responses.
References
[1]. G.Sutter, L.Faure, A.Molinari, N.Rane, V.Pina, An experimental technique for the measurement of temperature fields for the
orthoganl cutting in high speed machining, Int.J.Mach.Tools Manuf.43(2003)671-678
[2]. N.A.Abukhshim, P.T.Mativenga, M.A.Sheikh, Heat generation and temperature prediction in metal cutting; A review and
implications for high speed machining,Int. J.Mach.ToolsManuf.46(2005)782-800
[3]. Robert W.Ivester, Tool temperature in orthogonal cutting of alloyed titanium, NAMRI/SME,Vol.39,2011
[4]. D.Dudzinski, A.Devillez, A,Moufki, D.Larrouquere, V.Zerrouki, J.Vigneau, A review of developments towards dry and high speed
machining of Inconel 718 alloy. International journal of machine tools and manufacture 44 (2004) 439-456
[5]. J.Q.Xie, A.E.Bayoumi, and H.M.Zbib, Analytical and experimental study of shear localization in chip formation in orthogonal
machining, ASM International, JMEPEG (1995)4:32-39
[6]. Abele.E and Frohlich.B, High speed milling of titanium alloy, Advances in production engineering management 3 (2008) 3, 131-
140
[7]. L.B.Abhang and M.Hameedullah chip-tool interface temperature prediction model for turning process, JEST,Vol2(4), 2010, 382-
393
[8]. J.J.Mason,R.V.Kaznaza-pena, effect of tool parameters on temperature fields in high speed machining, research engineer, CNWRA,
Southwest research institute.
[9]. K.M.Vernaza-pena, J.J.Mason and M.Li, Department of aerospace and mechanical engineering, university of Notre Dame
[10]. stresses and temperatures using FEM simulations, IWOMMO, Atlanta, Georgia, USA-May 19, 1998
Acknowledgement The researchers wish to thank the Department of Mechanical Engineering (CRDM) in Karunya University,
Coimbatore for supporting this research work.