Embed Size (px)
Citation preview
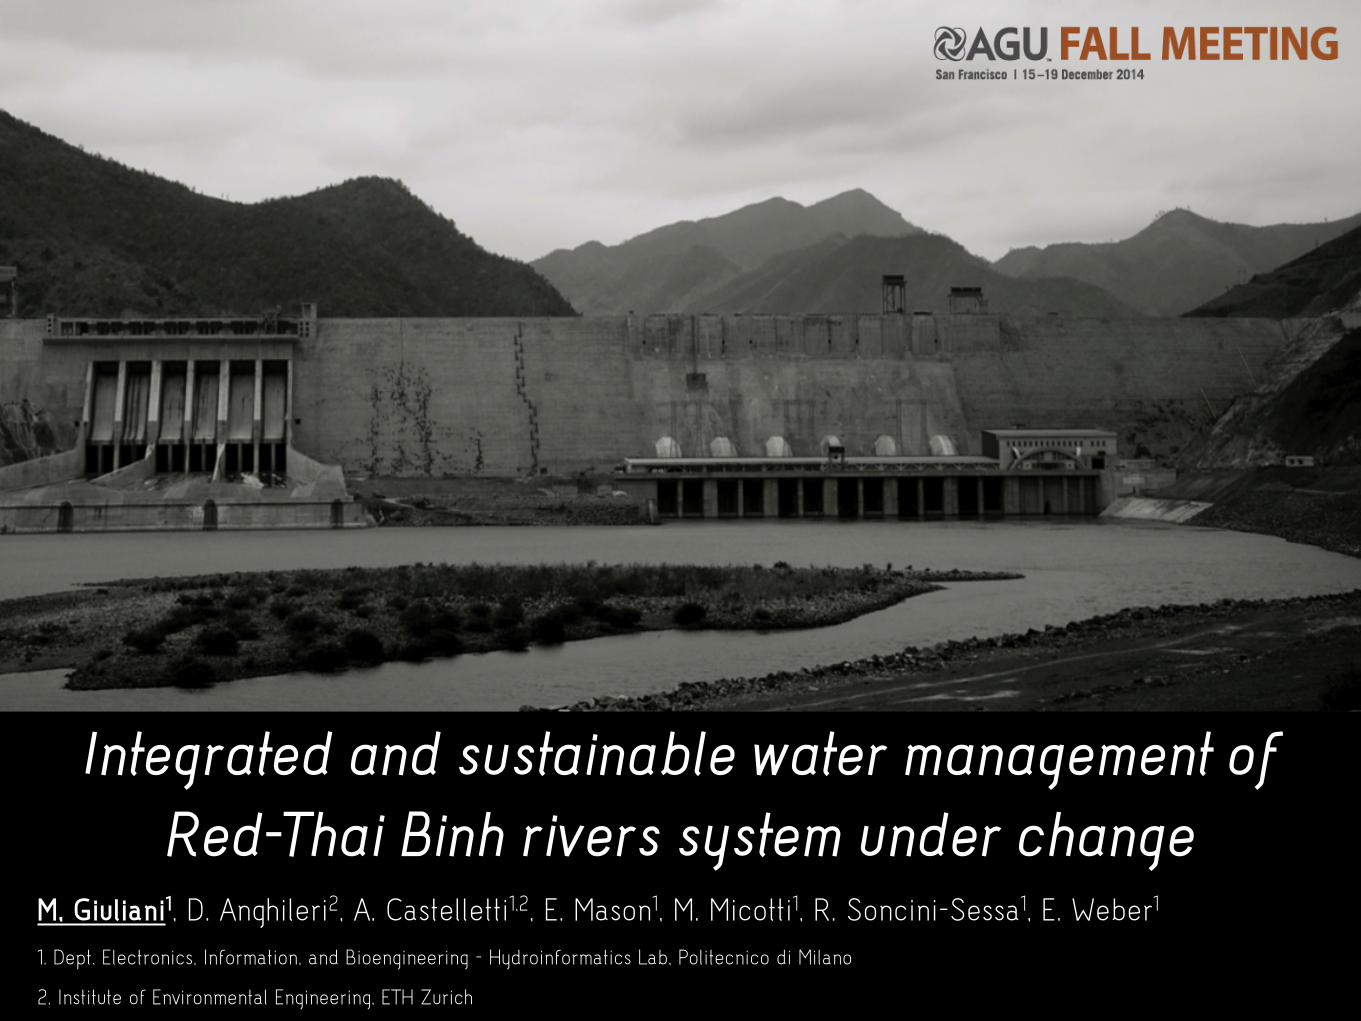
Integrated and sustainable water management of Red-Thai Binh rivers system under change
M, Giuliani1, D. Anghileri2, A. Castelletti1,2, E. Mason1, M. Micotti1, R. Soncini-Sessa1, E. Weber1
1. Dept. Electronics, Information, and Bioengineering - Hydroinformatics Lab, Politecnico di Milano
2. Institute of Environmental Engineering, ETH Zurich
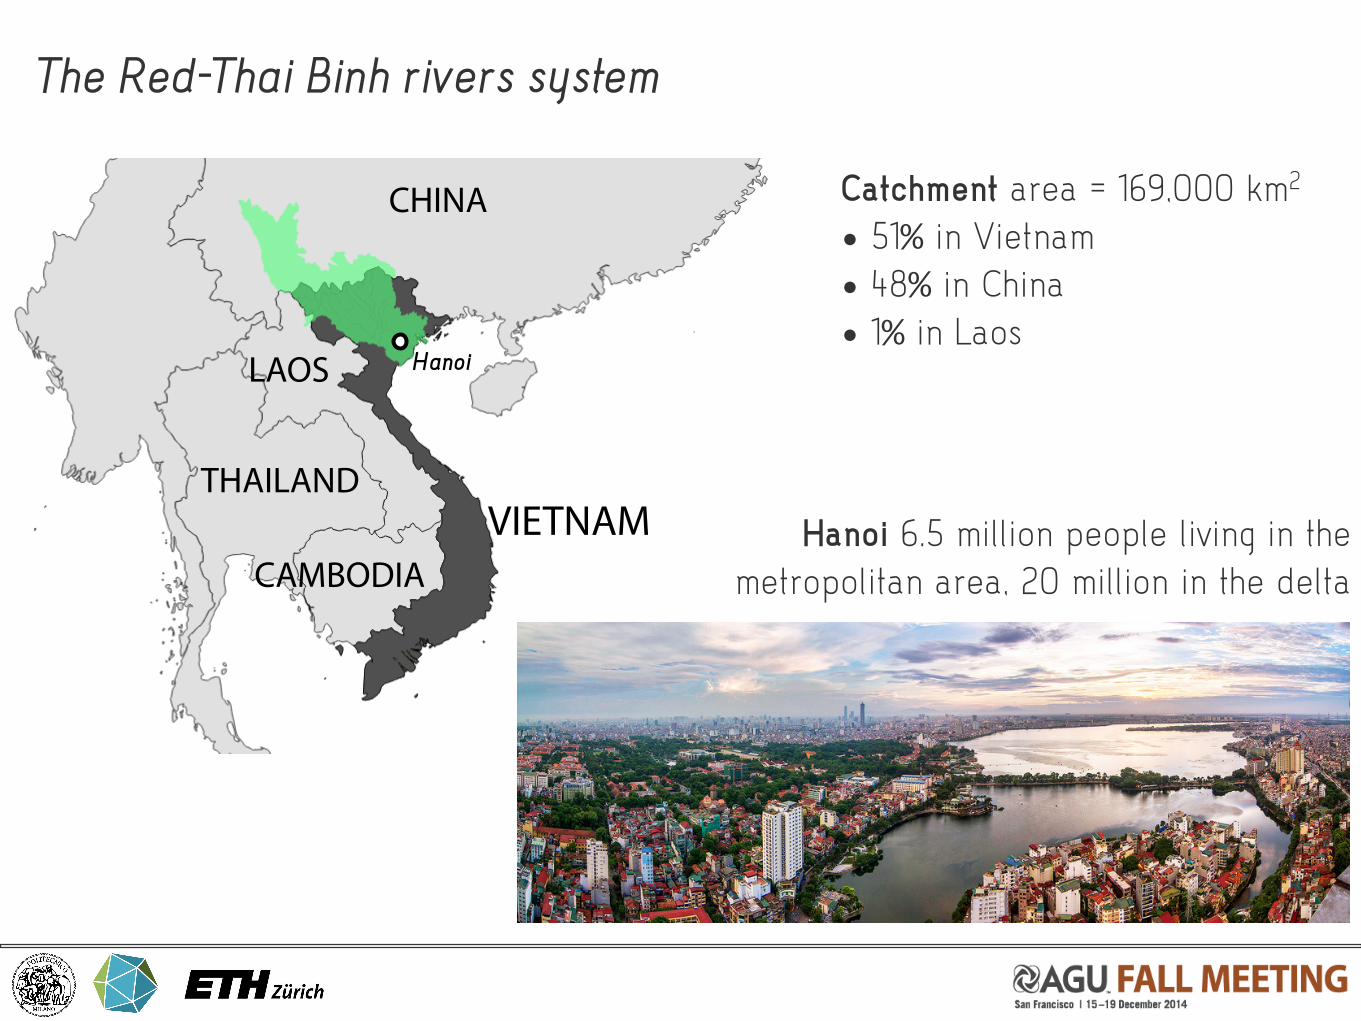
The Red-Thai Binh rivers system
VIETNAM
CHINA
LAOS
CAMBODIA
THAILAND
Catchment area = 169,000 km2
• 51% in Vietnam• 48% in China• 1% in Laos
Hanoi 6.5 million people living in the metropolitan area, 20 million in the delta
Hanoi
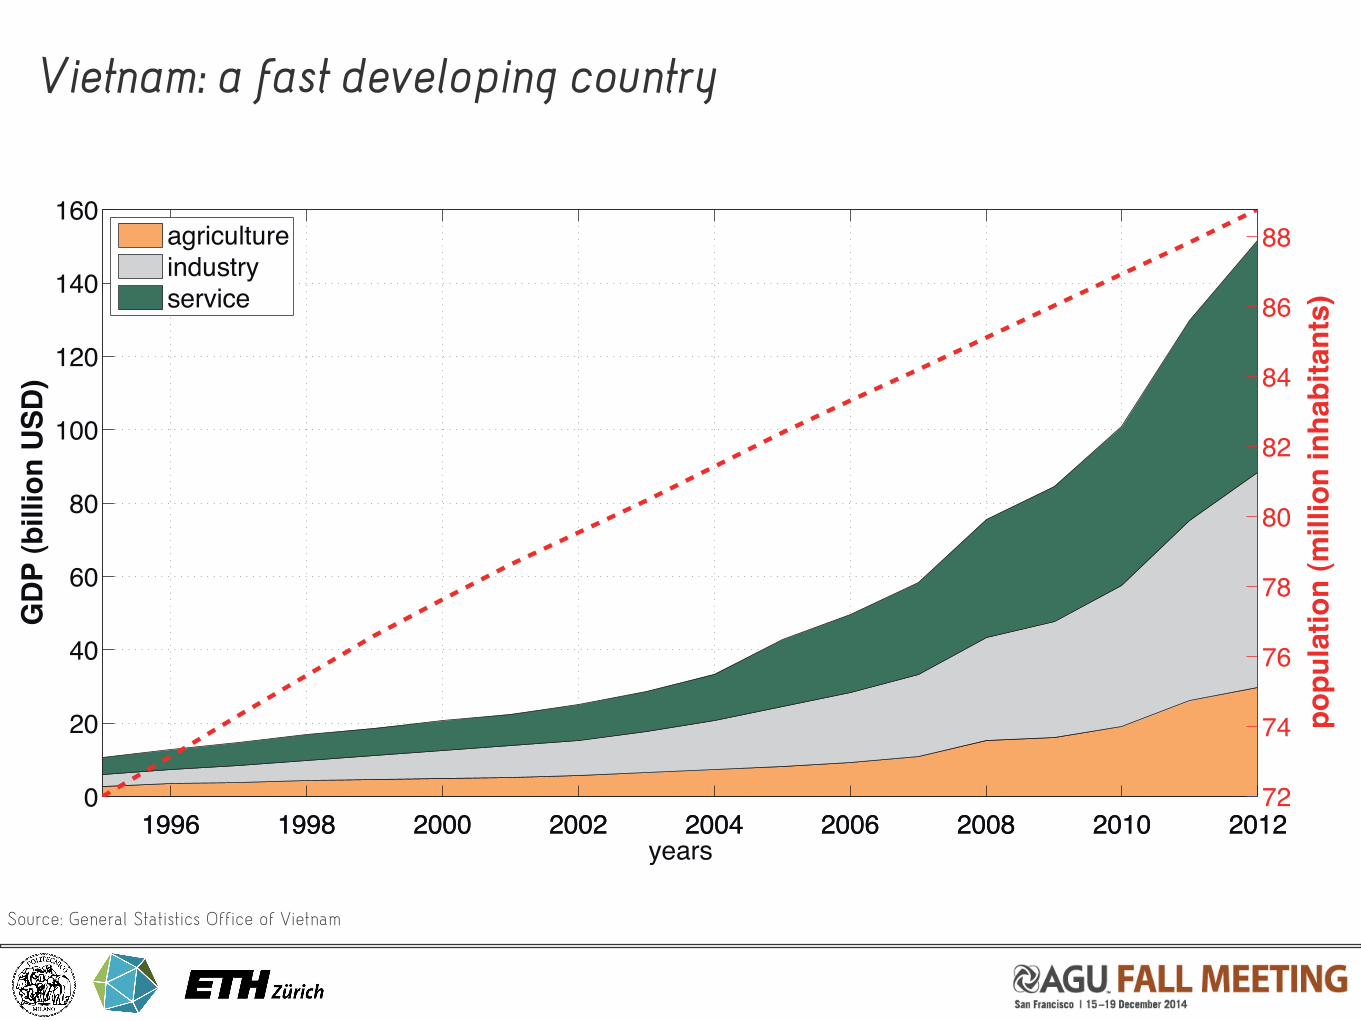
Vietnam: a fast developing country
Source: General Statistics Office of Vietnam
1996 1998 2000 2002 2004 2006 2008 2010 20120
20
40
60
80
100
120
140
160
years
GDP
(billi
on U
SD)
agricultureindustryservice
1996 1998 2000 2002 2004 2006 2008 2010 201272
74
76
78
80
82
84
86
88
popu
latio
n (m
illion
inha
bita
nts)
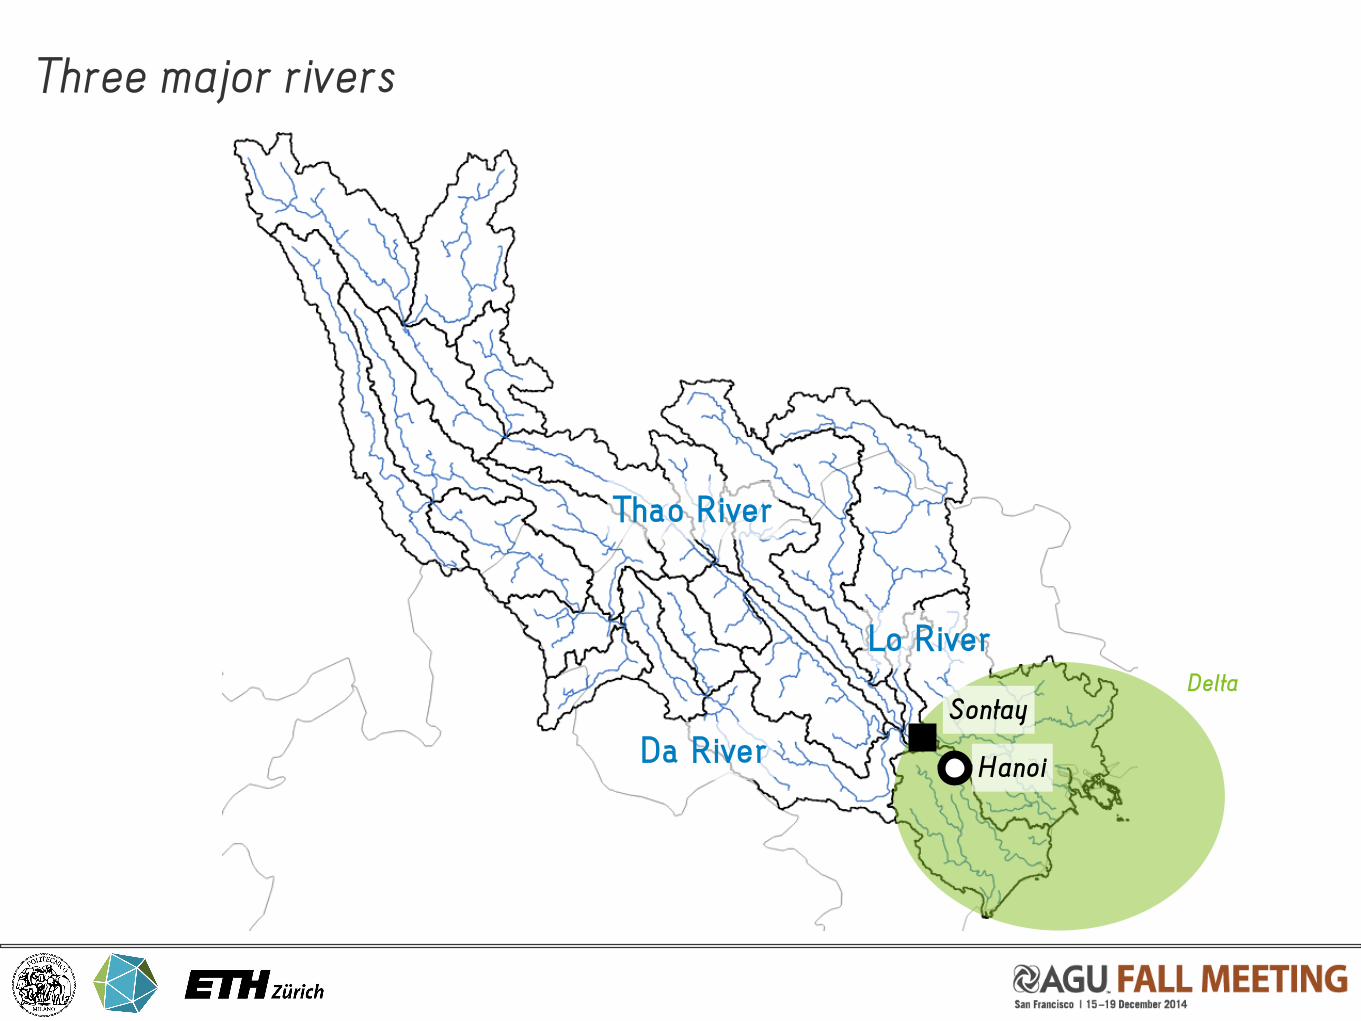
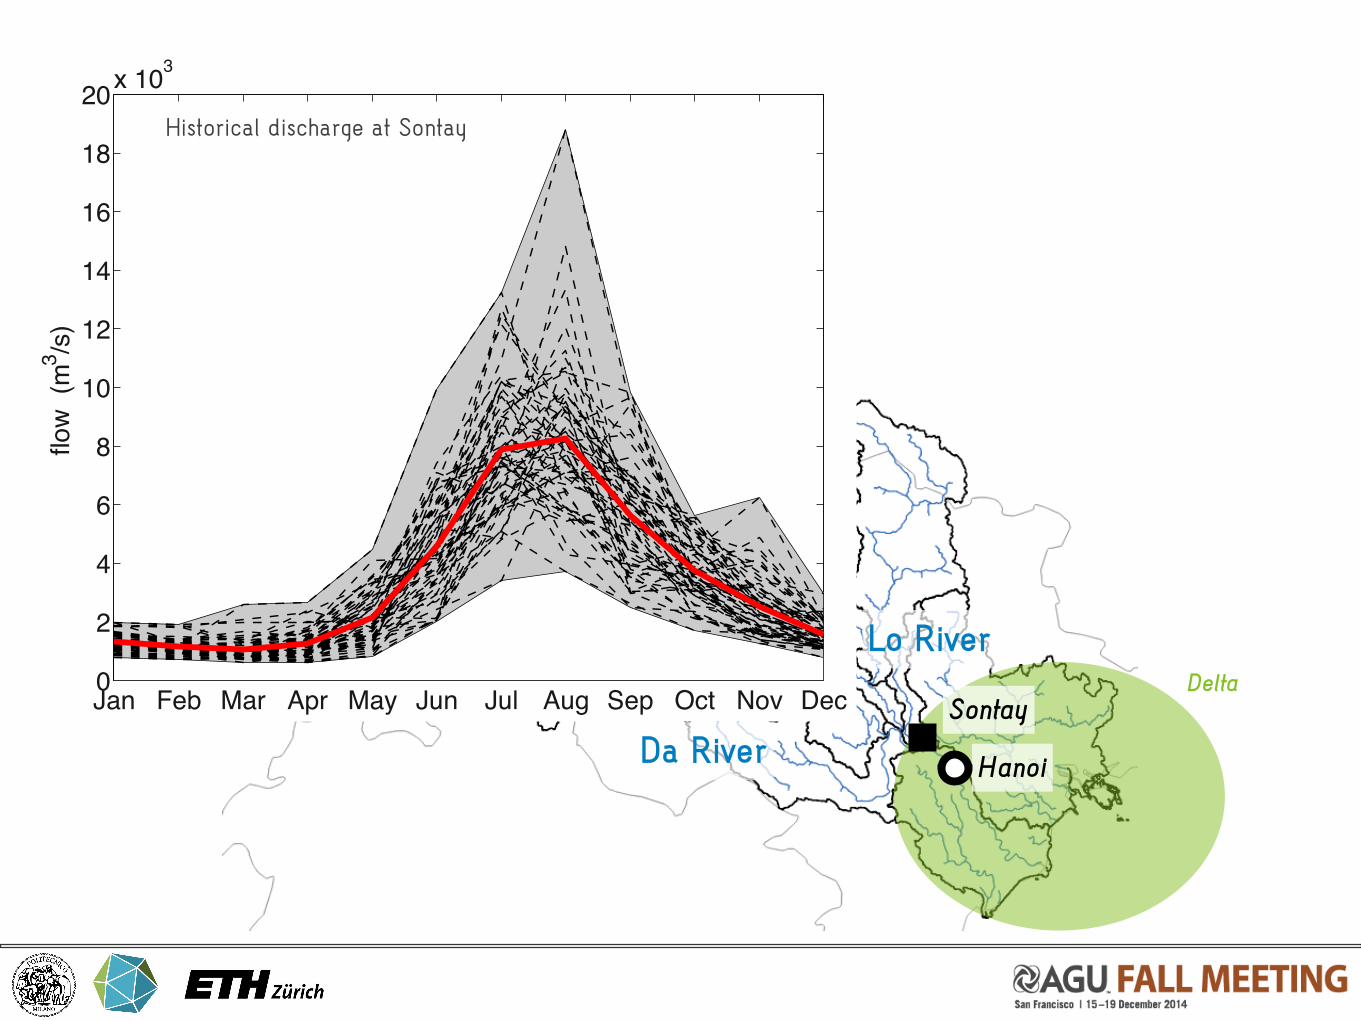
Three major rivers
HanoiDa River
Thao River
Lo RiverDelta
Sontay
The Red River basin
HanoiDa River
Thao River
Lo RiverDelta
SontayJan Feb Mar Apr May Jun Jul Aug Sep Oct Nov Dec0
2
4
6
8
10
12
14
16
18
20x 10
3flow
(m
3/s
)
Historical discharge at Sontay
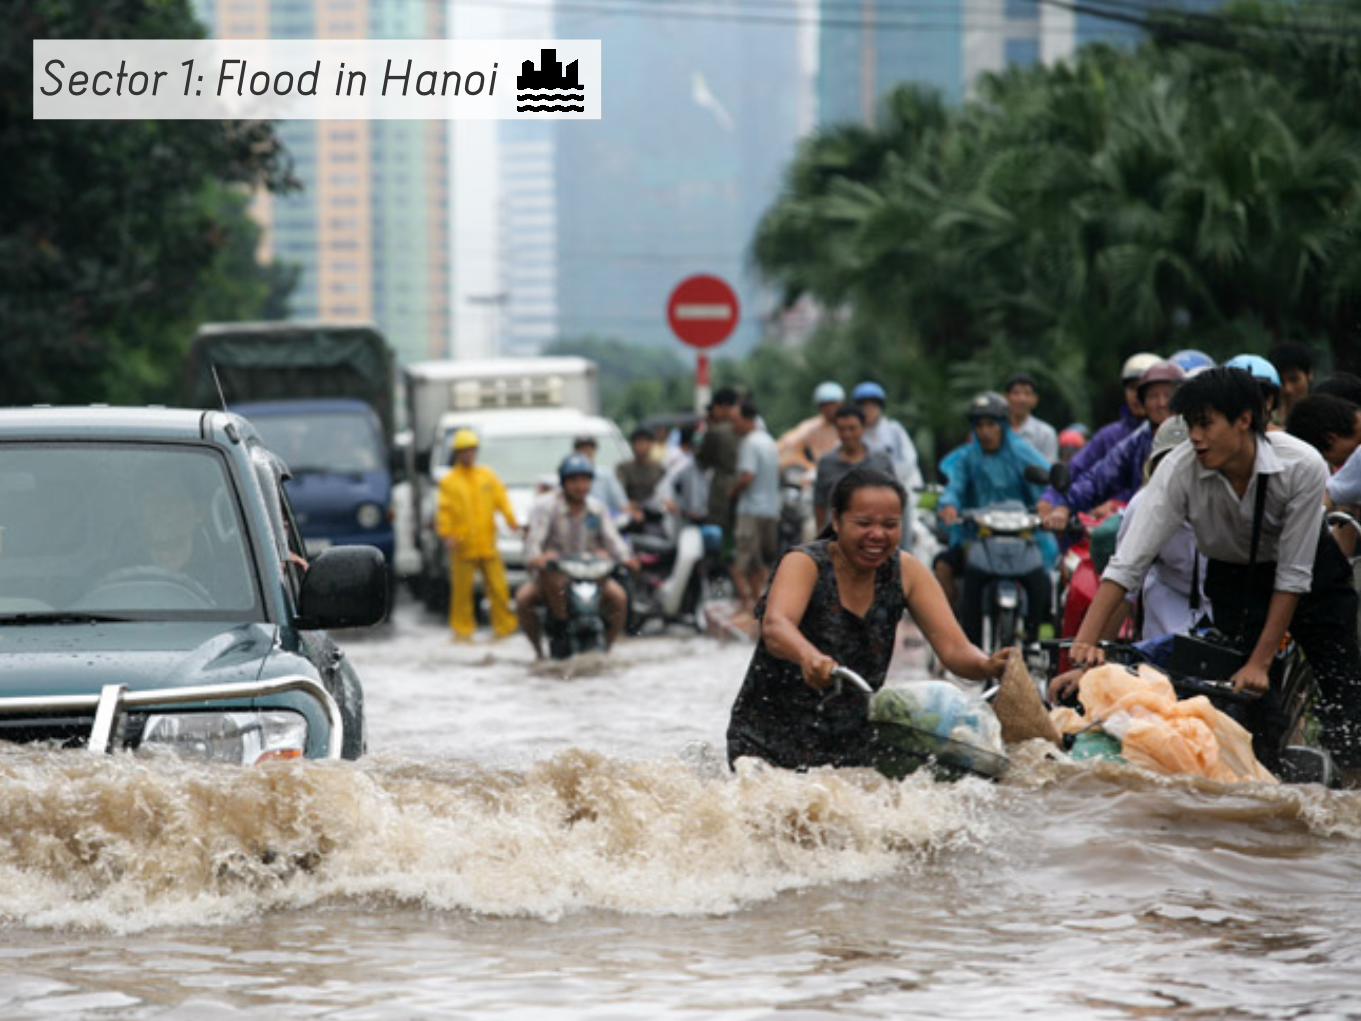
Hanoi citySector 1: Flood in Hanoi
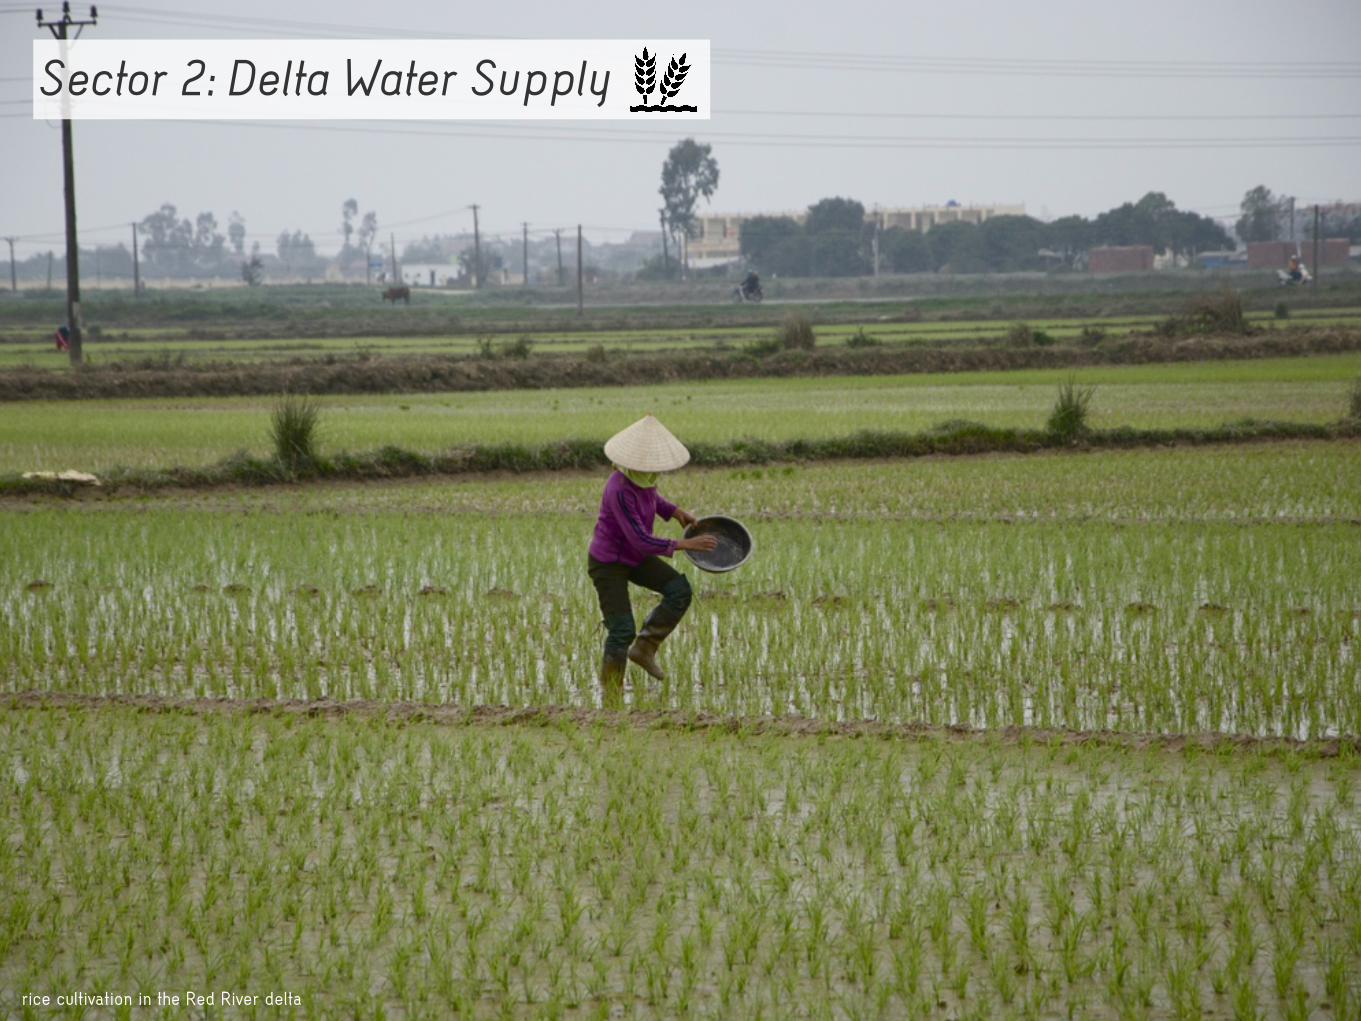
Sector 2: Delta Water Supply
rice cultivation in the Red River delta
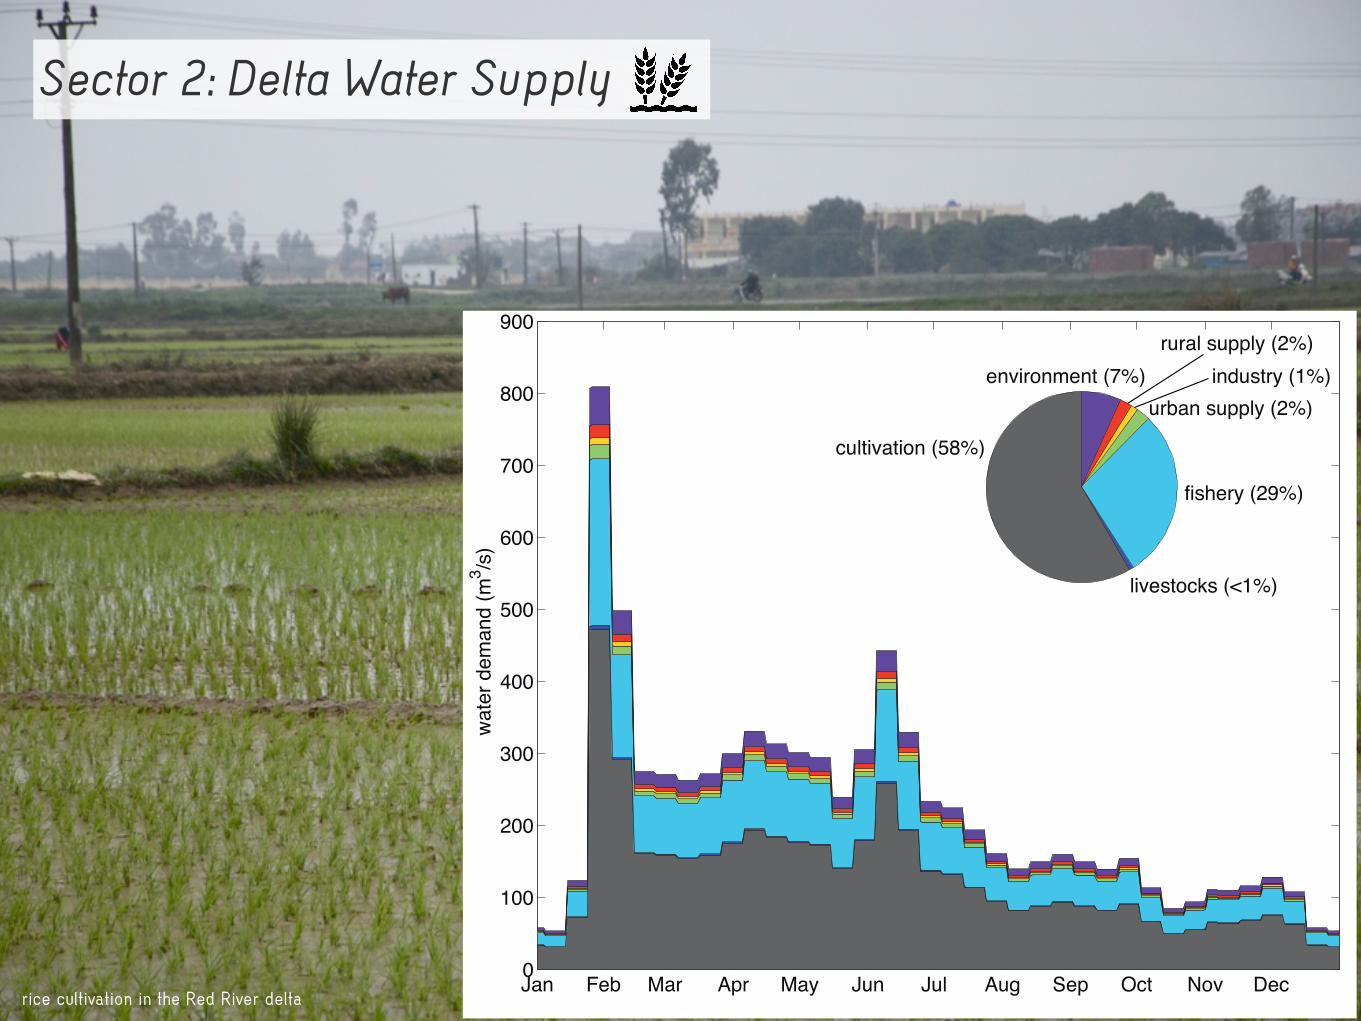
Sector 2: Delta Water Supply
rice cultivation in the Red River deltaJan Feb Mar Apr May Jun Jul Aug Sep Oct Nov Dec0
100
200
300
400
500
600
700
800
900
wate
r dem
and
(m3 /s)
cultivation (58%)
livestocks (<1%)
fishery (29%)
urban supply (2%)industry (1%)
rural supply (2%)environment (7%)
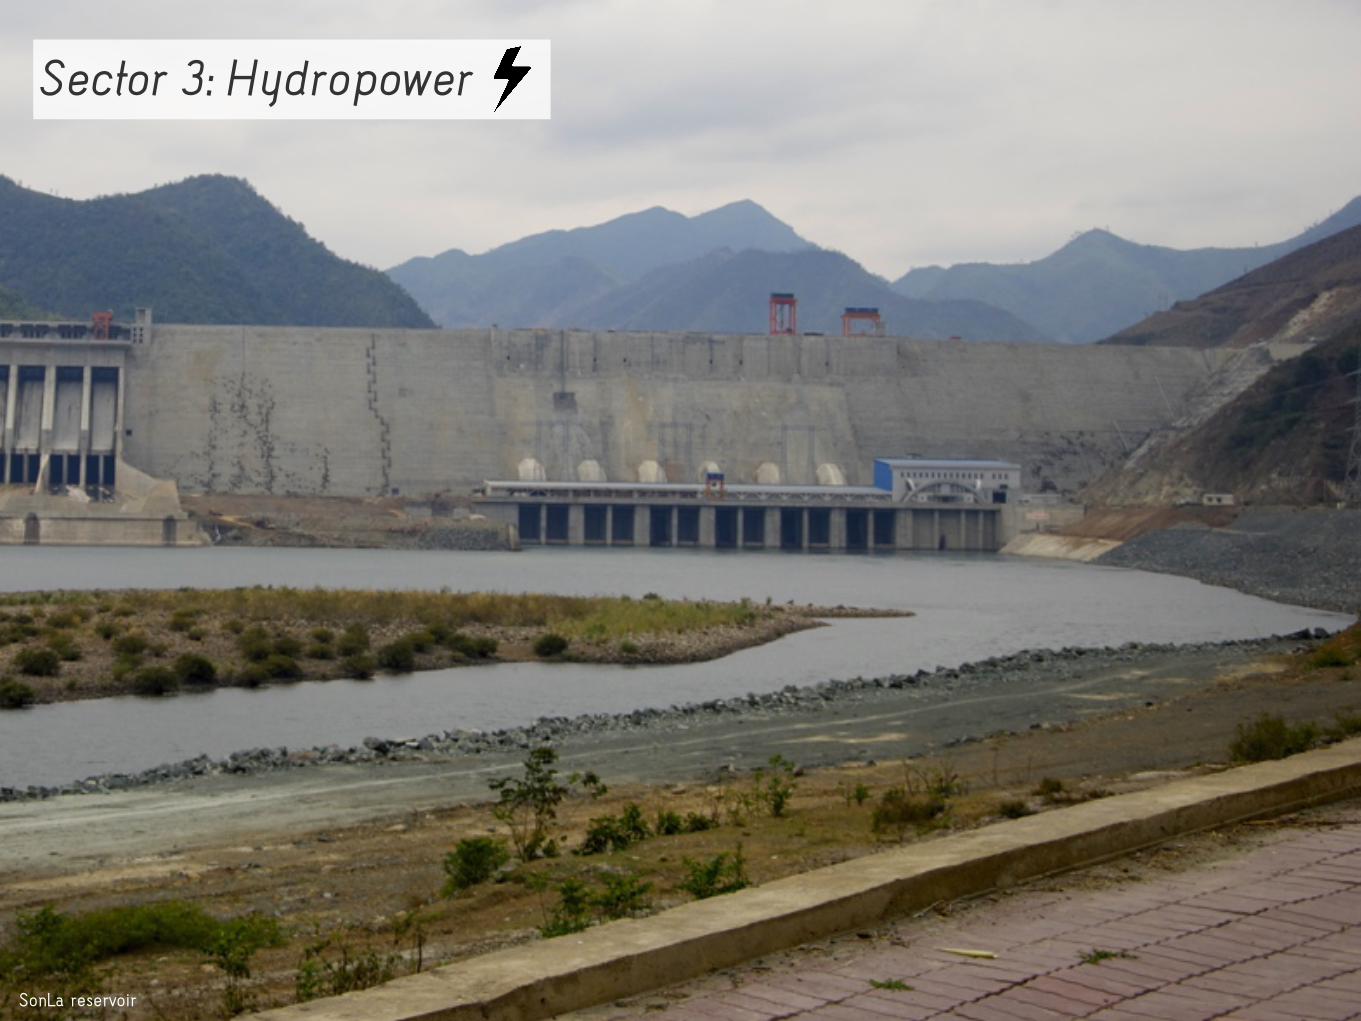
Sector 3: Hydropower
SonLa reservoir
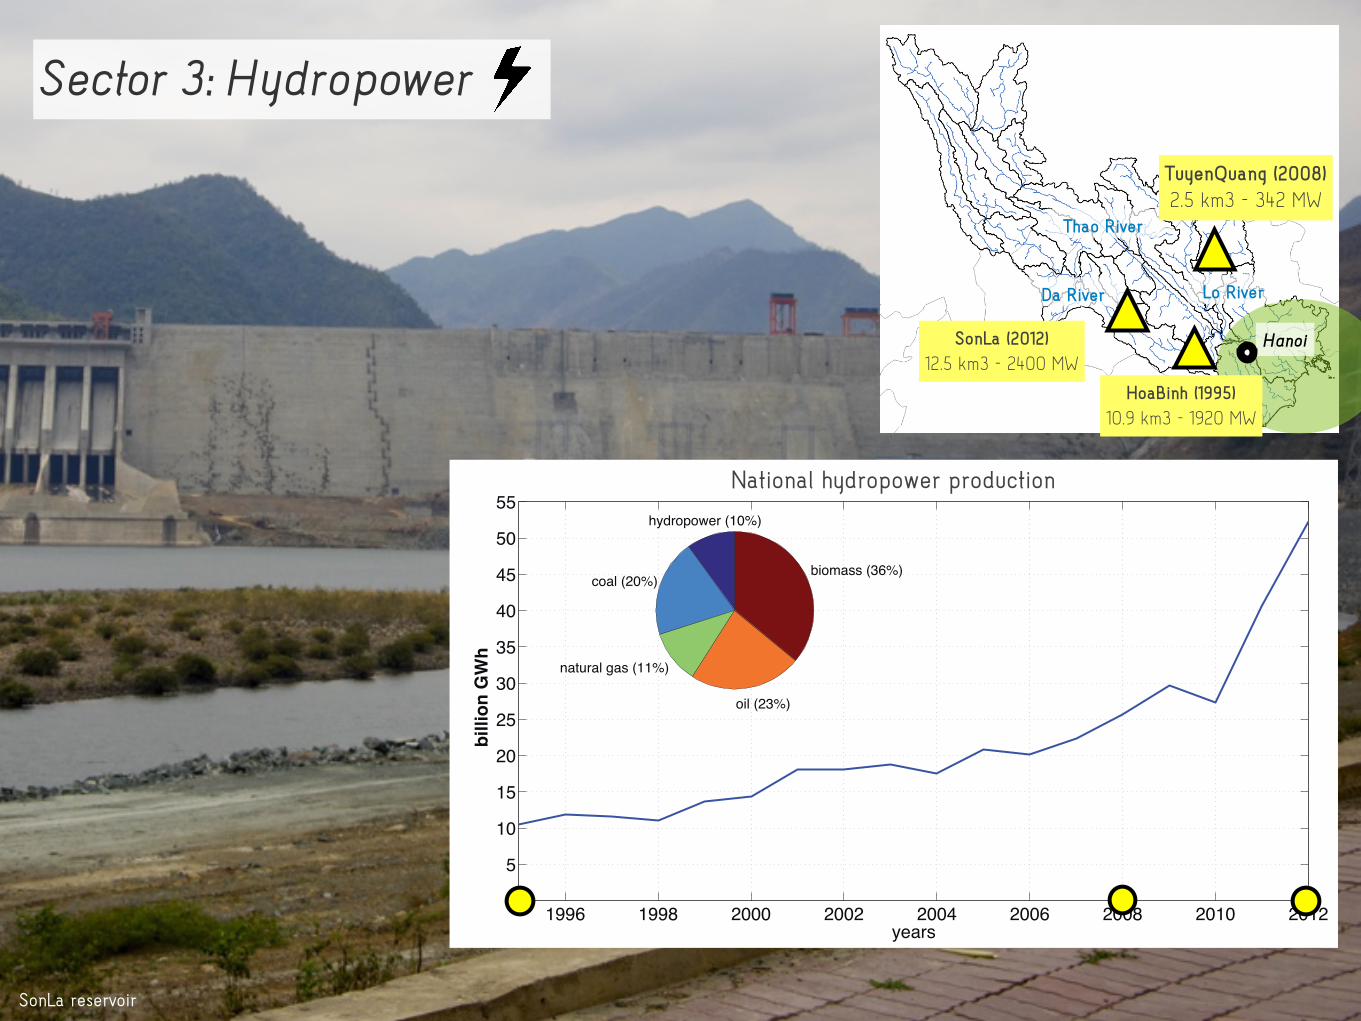
Sector 3: Hydropower
SonLa reservoir
Hanoi
Da River
Thao River
Lo River
1996 1998 2000 2002 2004 2006 2008 2010 20120510152025303540455055
years
billio
n GW
h
hydropower (10%)
coal (20%)
natural gas (11%)
oil (23%)
biomass (36%)
National hydropower production
HoaBinh (1995)10.9 km3 - 1920 MW
TuyenQuang (2008)2.5 km3 - 342 MW
SonLa (2012)12.5 km3 - 2400 MW
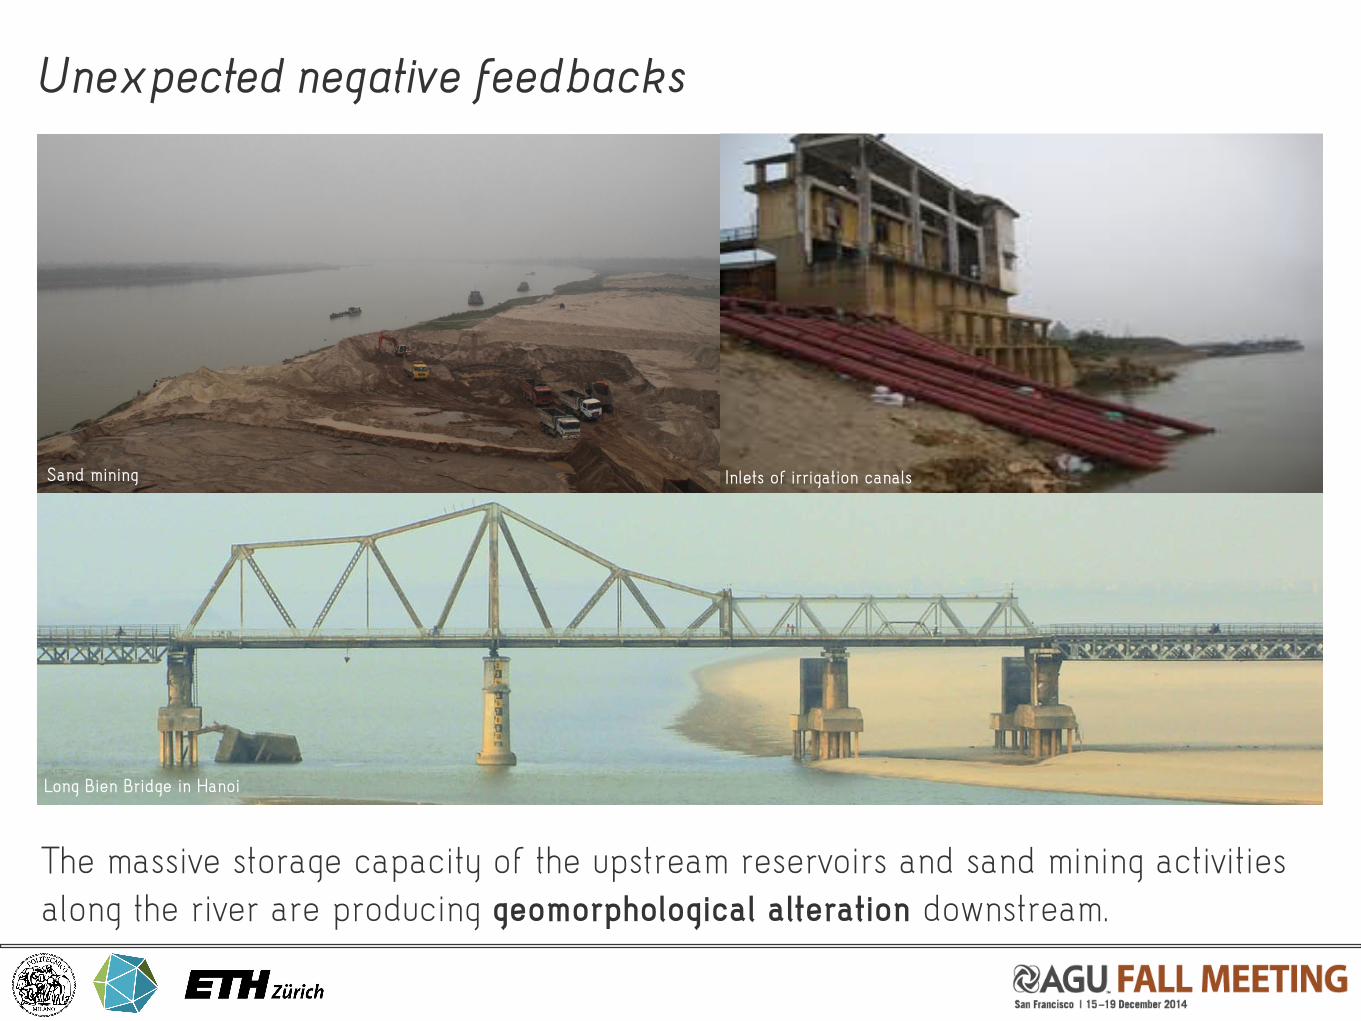
Unexpected negative feedbacks
The massive storage capacity of the upstream reservoirs and sand mining activities along the river are producing geomorphological alteration downstream.
Inlets of irrigation canalsSand mining
Long Bien Bridge in Hanoi
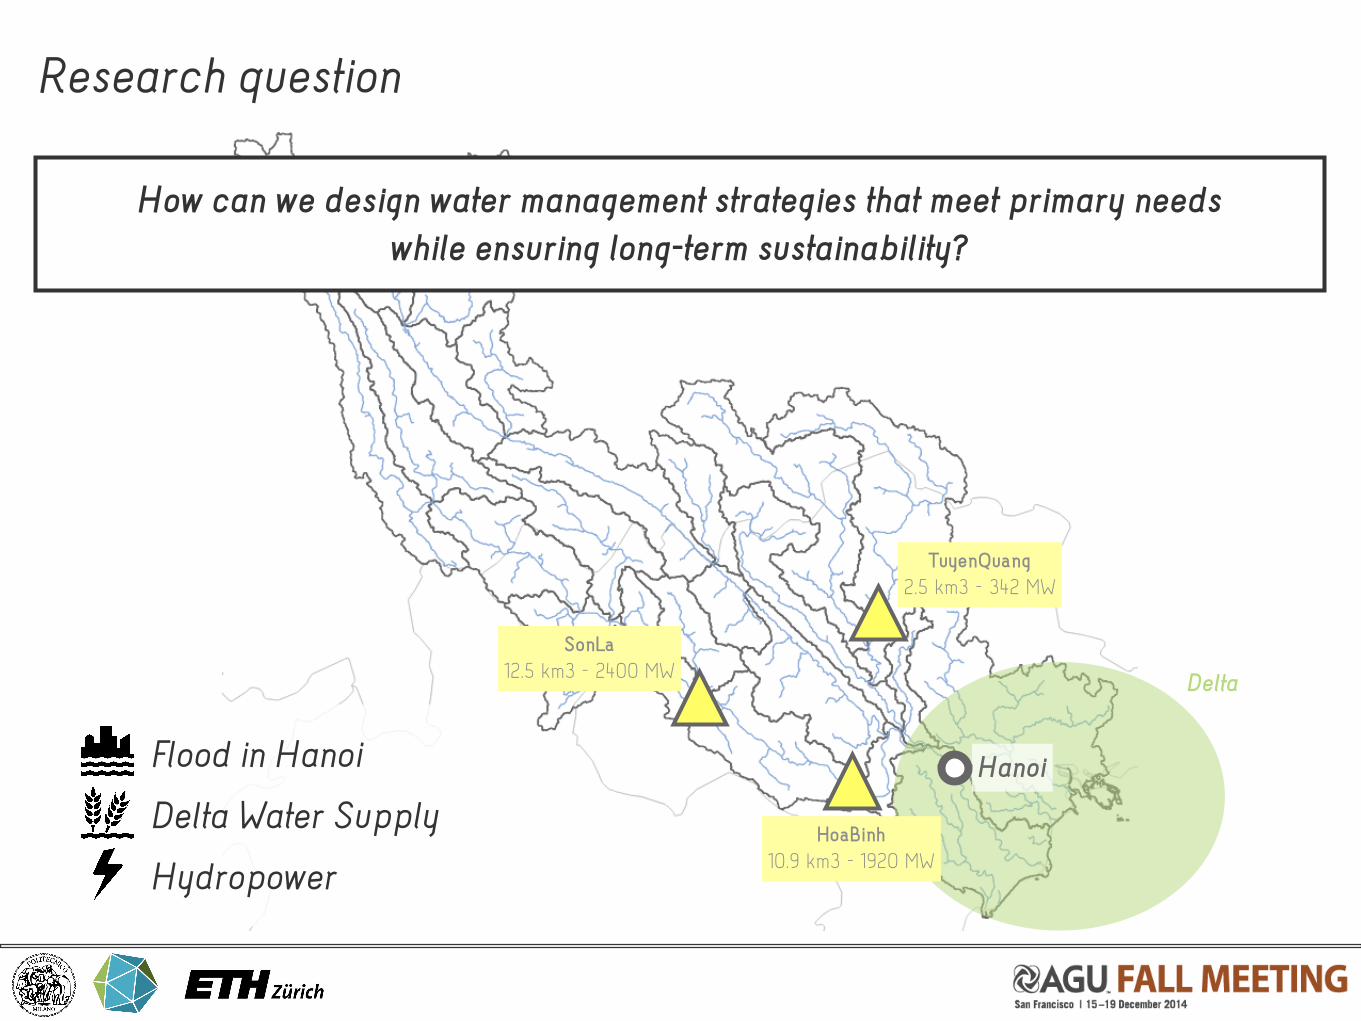
Research question
Hanoi
Delta
SonLa12.5 km3 - 2400 MW
HoaBinh10.9 km3 - 1920 MW
TuyenQuang2.5 km3 - 342 MW
How can we design water management strategies that meet primary needs while ensuring long-term sustainability?
Flood in Hanoi
Delta Water Supply
Hydropower
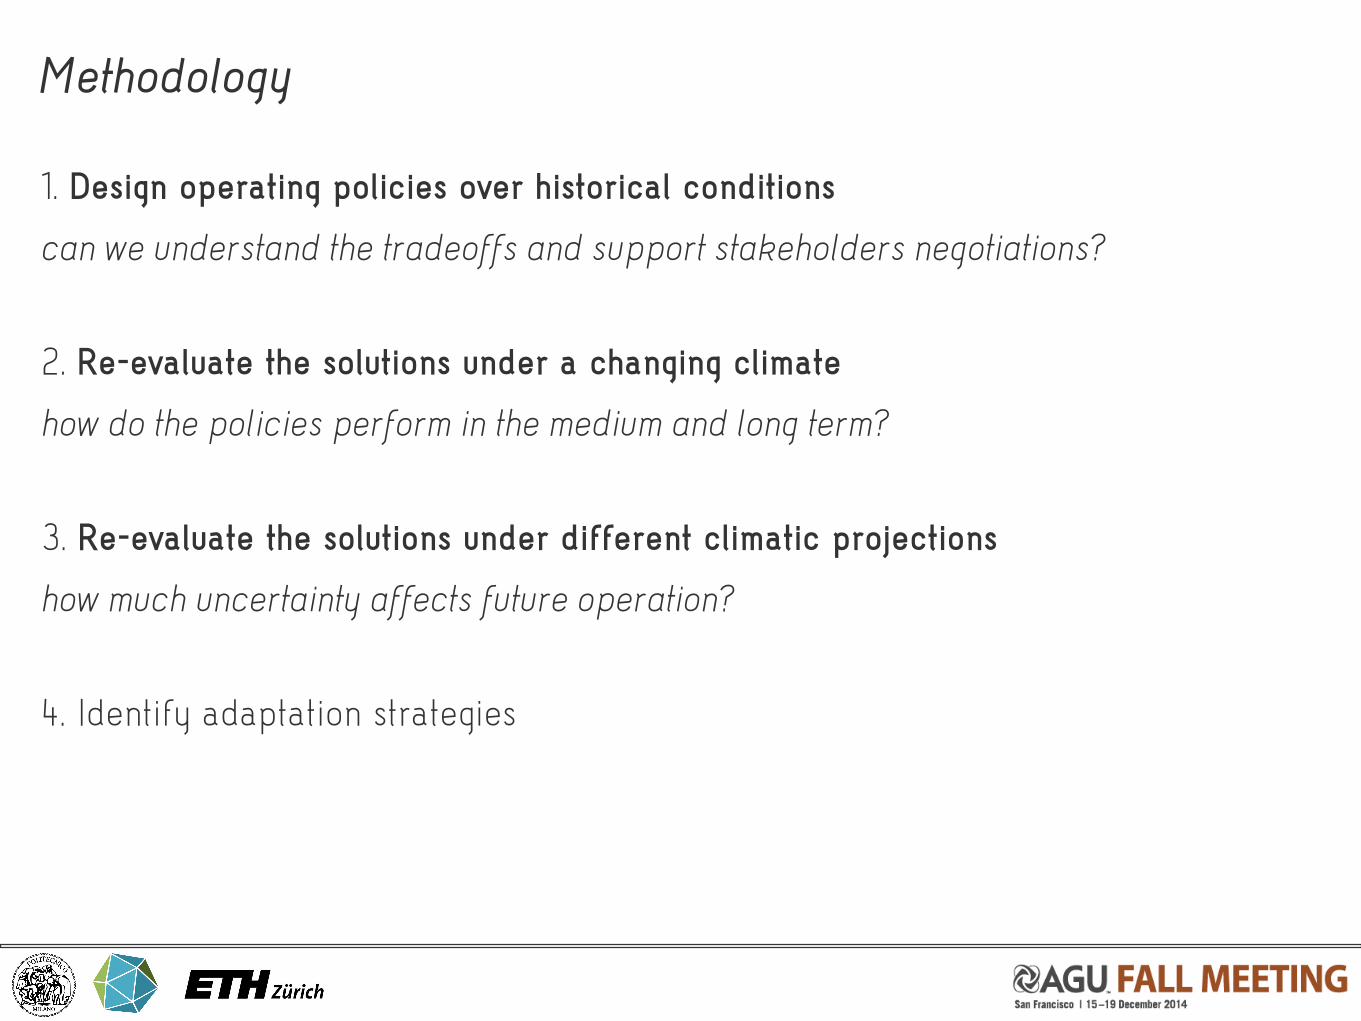
Methodology
1. Design operating policies over historical conditions
can we understand the tradeoffs and support stakeholders negotiations?
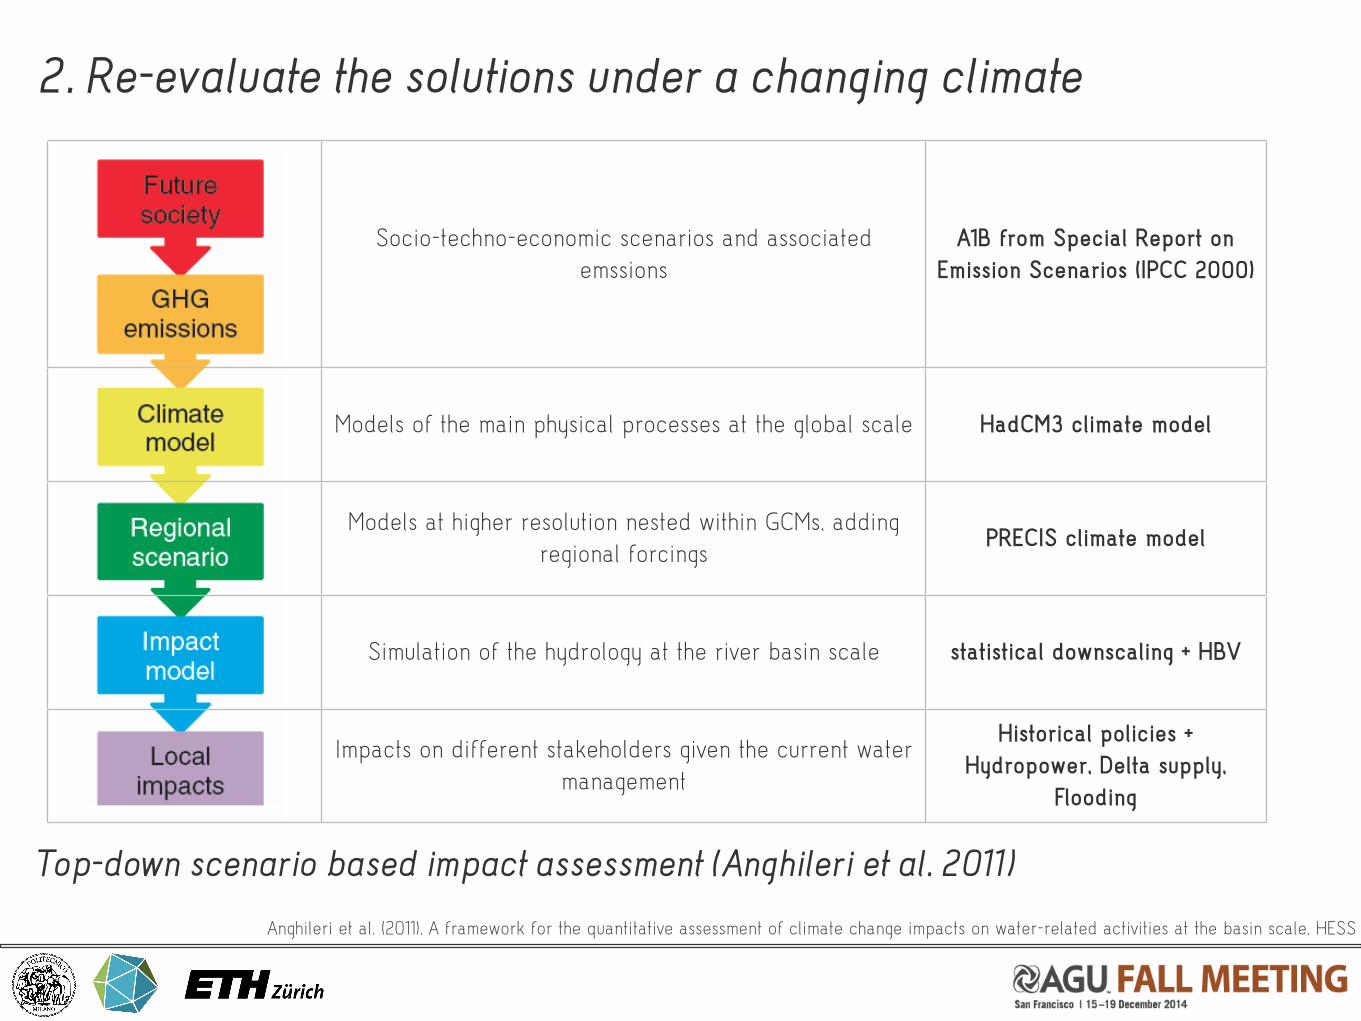
2. Re-evaluate the solutions under a changing climate
how do the policies perform in the medium and long term?
3. Re-evaluate the solutions under different climatic projections
how much uncertainty affects future operation?
4. Identify adaptation strategies
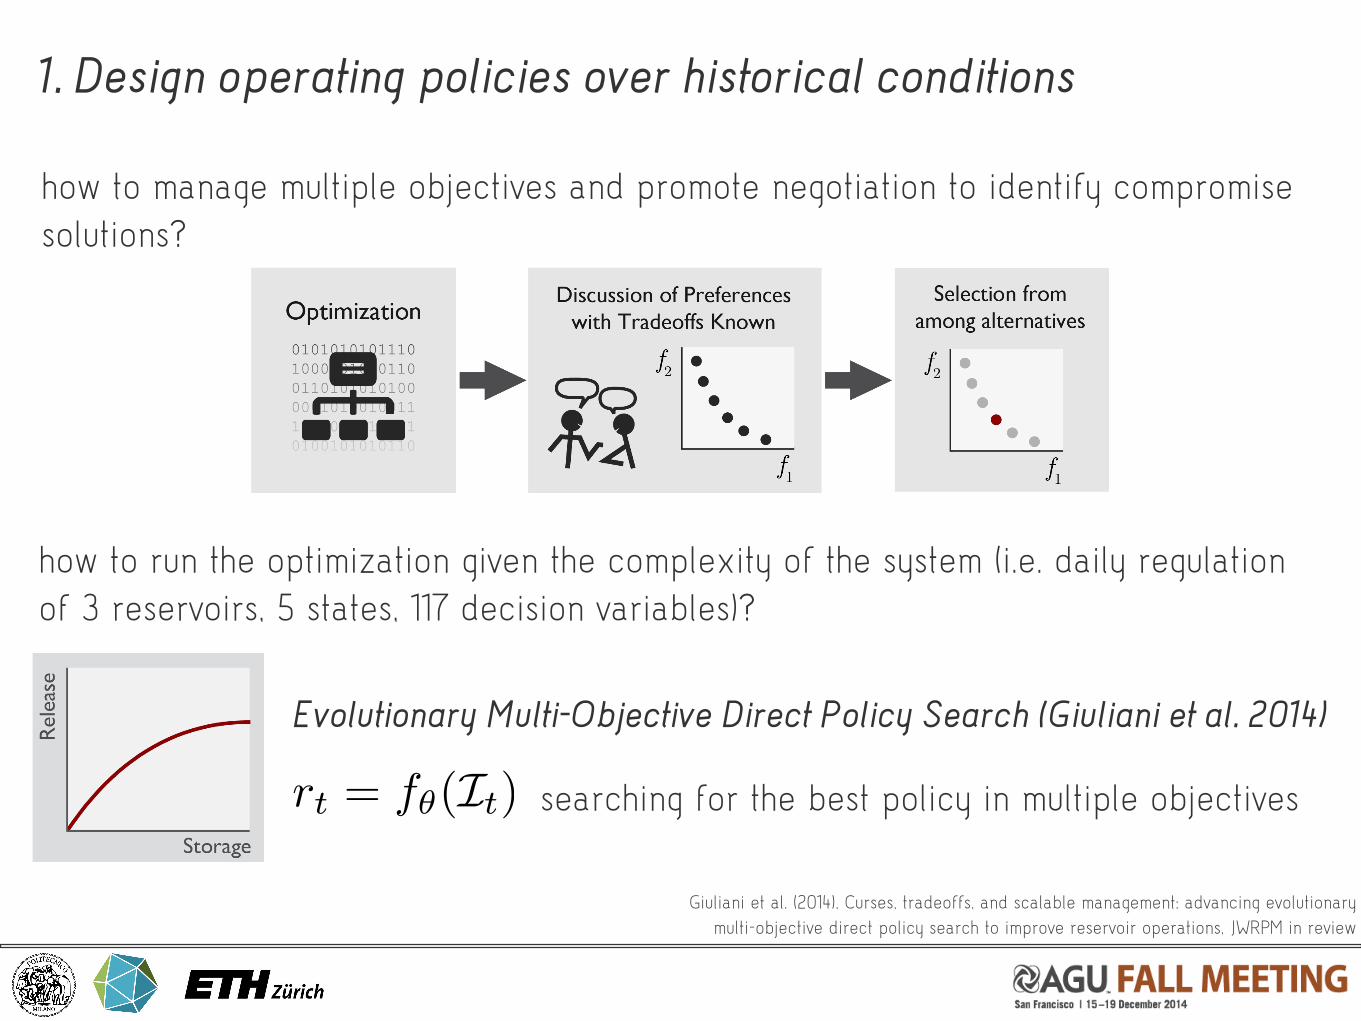
1. Design operating policies over historical conditions
how to manage multiple objectives and promote negotiation to identify compromise solutions?
how to run the optimization given the complexity of the system (i.e. daily regulation of 3 reservoirs, 5 states, 117 decision variables)?
Evolutionary Multi-Objective Direct Policy Search (Giuliani et al. 2014)
rt = fθ(It) searching for the best policy in multiple objectives
Giuliani et al. (2014), Curses, tradeoffs, and scalable management: advancing evolutionary multi-objective direct policy search to improve reservoir operations, JWRPM in review
2. Re-evaluate the solutions under a changing climate
Top-down scenario based impact assessment (Anghileri et al. 2011)
Socio-techno-economic scenarios and associated emssions
A1B from Special Report on Emission Scenarios (IPCC 2000)
Models of the main physical processes at the global scale HadCM3 climate model
Models at higher resolution nested within GCMs, adding regional forcings
PRECIS climate model
Simulation of the hydrology at the river basin scale statistical downscaling + HBV
Impacts on different stakeholders given the current water management
Historical policies + Hydropower, Delta supply,
Flooding
Anghileri et al. (2011), A framework for the quantitative assessment of climate change impacts on water-related activities at the basin scale, HESS
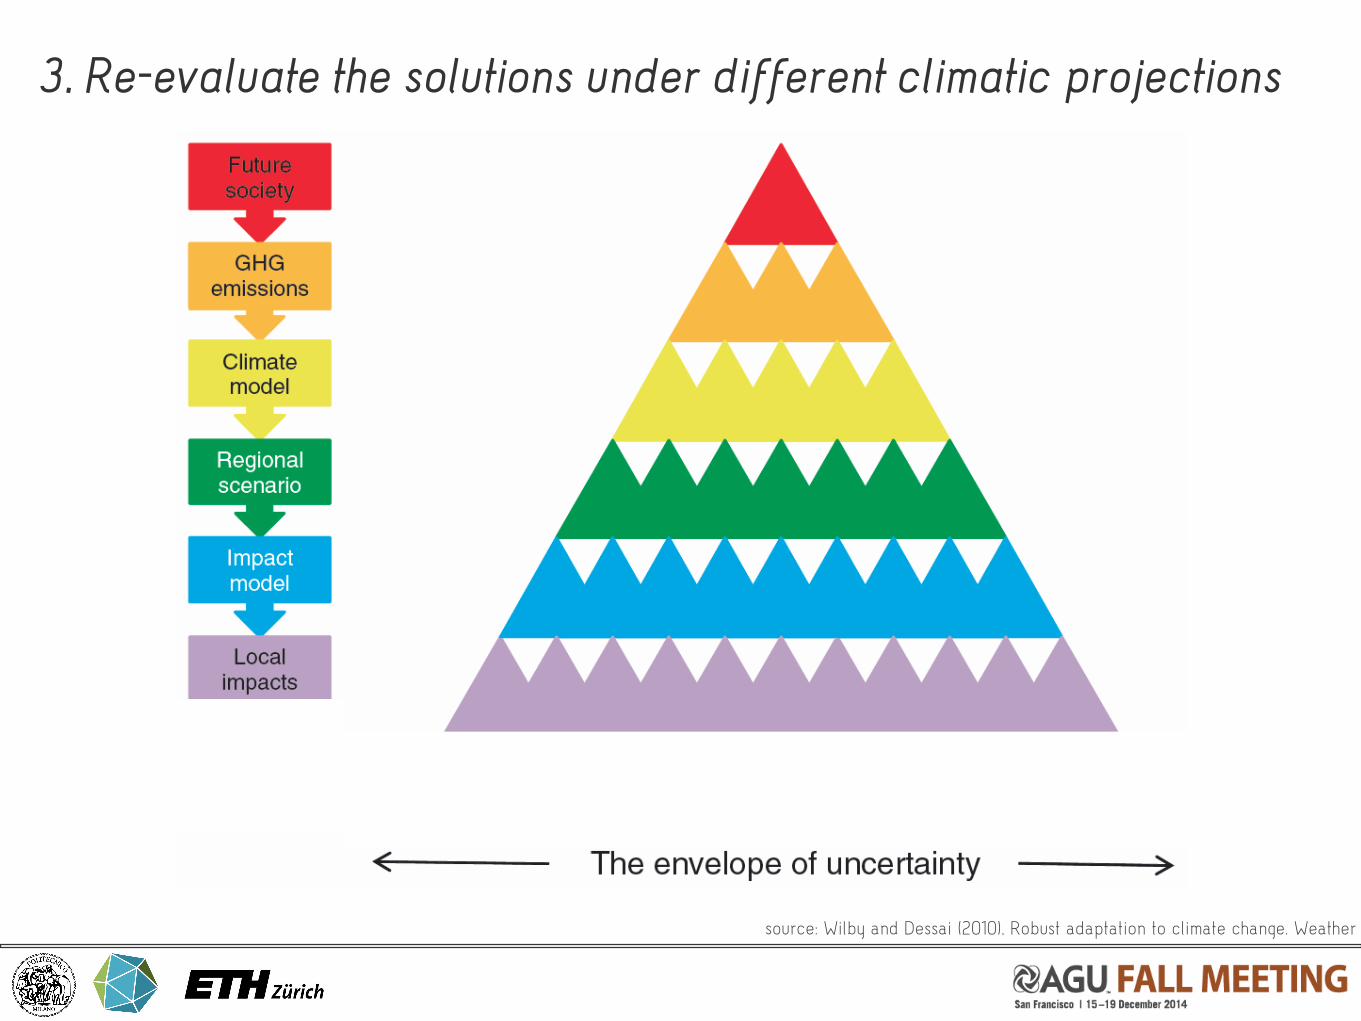
source: Wilby and Dessai (2010), Robust adaptation to climate change. Weather
3. Re-evaluate the solutions under different climatic projections
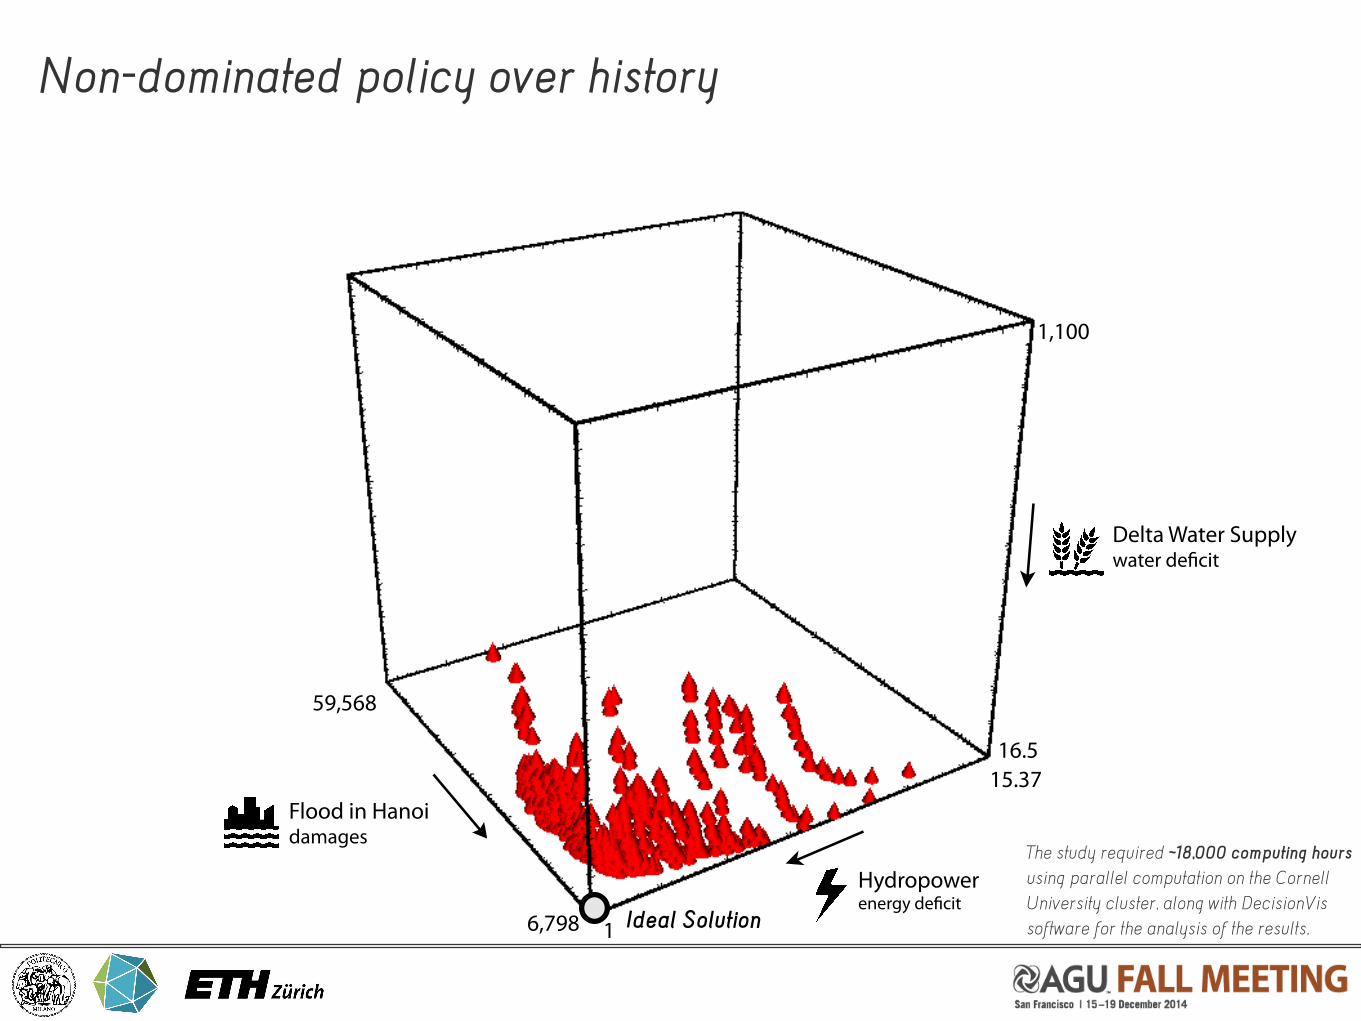
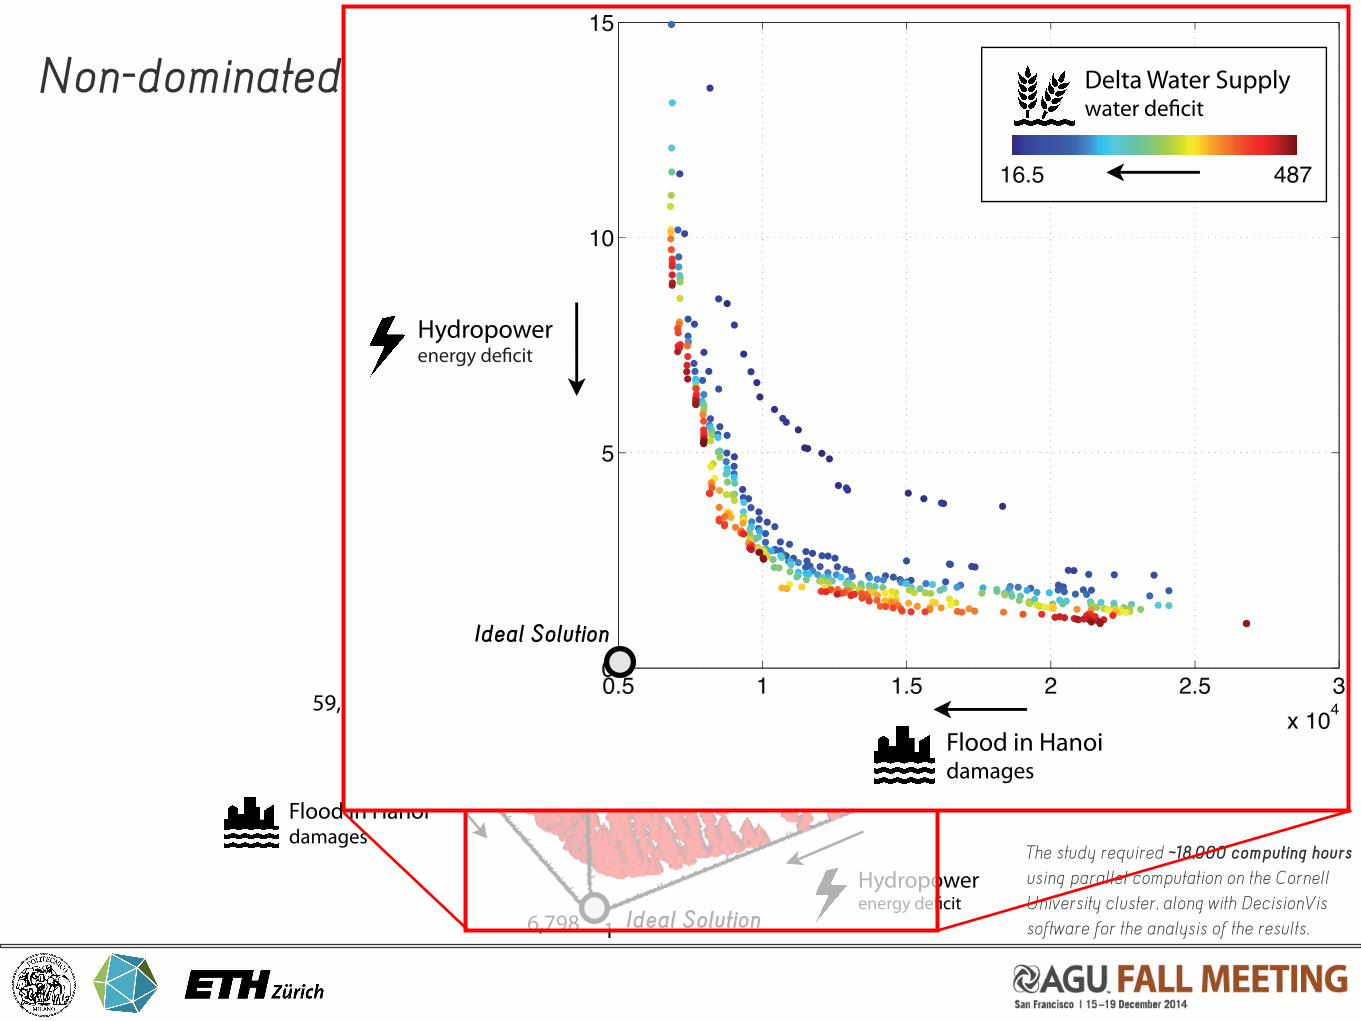
Non-dominated policy over history
Hydropowerenergy de!cit
Flood in Hanoidamages
Delta Water Supplywater de!cit
15.37
16,798
59,568
1,100
16.5
The study required ~18,000 computing hours using parallel computation on the Cornell University cluster, along with DecisionVis software for the analysis of the results.Ideal Solution
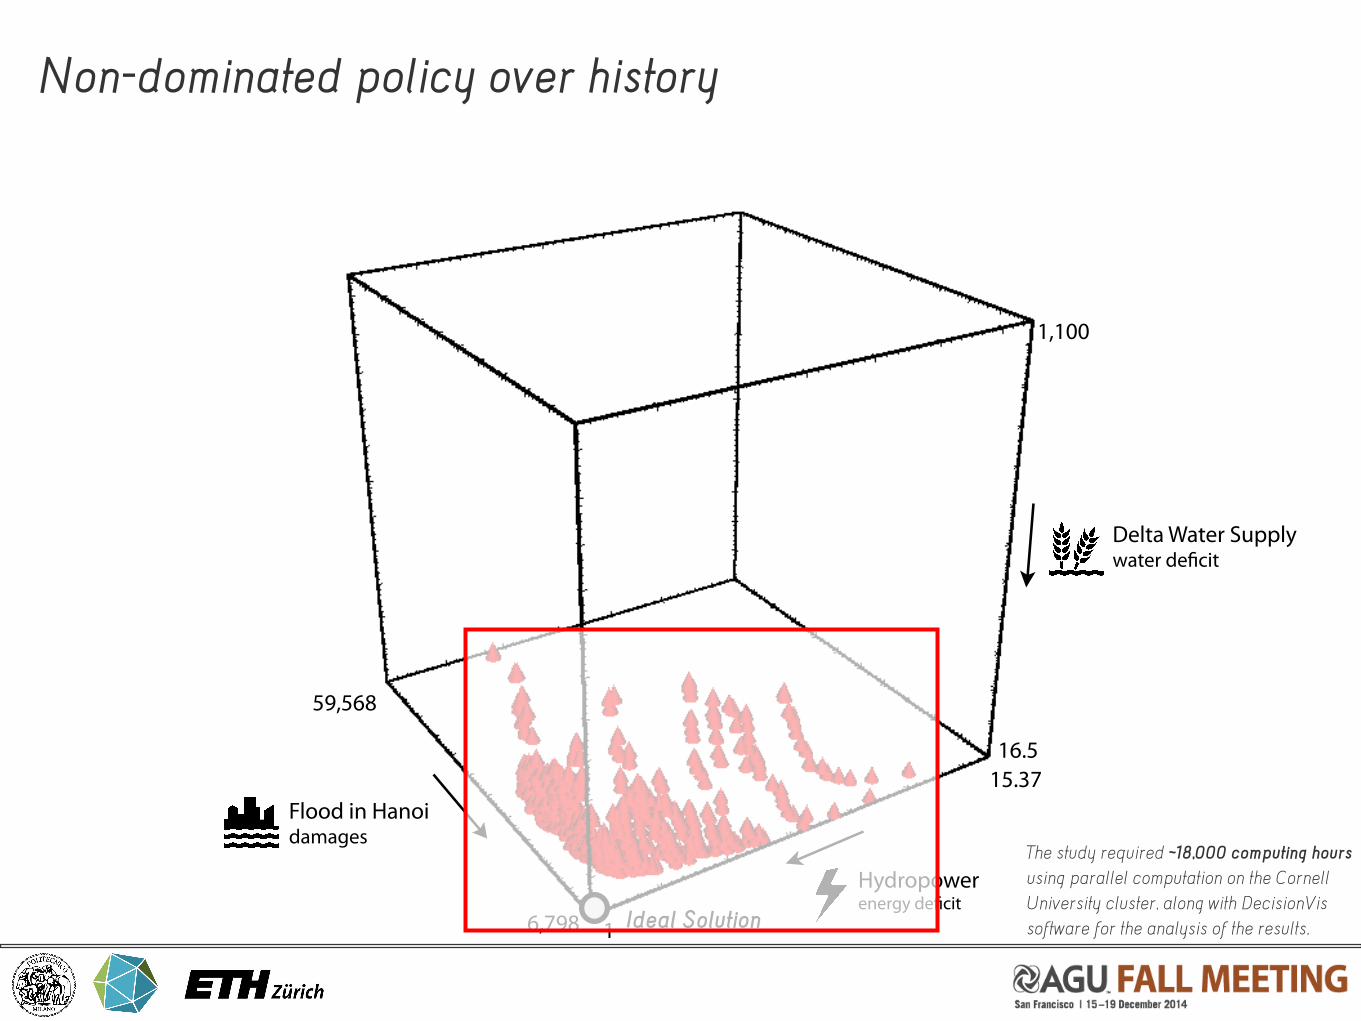
The study required ~18,000 computing hours using parallel computation on the Cornell University cluster, along with DecisionVis software for the analysis of the results.
Non-dominated policy over history
Hydropowerenergy de!cit
Flood in Hanoidamages
Delta Water Supplywater de!cit
15.37
16,798
59,568
1,100
16.5
Ideal Solution
0.5 1 1.5 2 2.5 3x 10⁴
0
5
10
15
Hydropowerenergy de!cit
Flood in Hanoidamages
Delta Water Supplywater de!cit
16.5 487
Ideal Solution
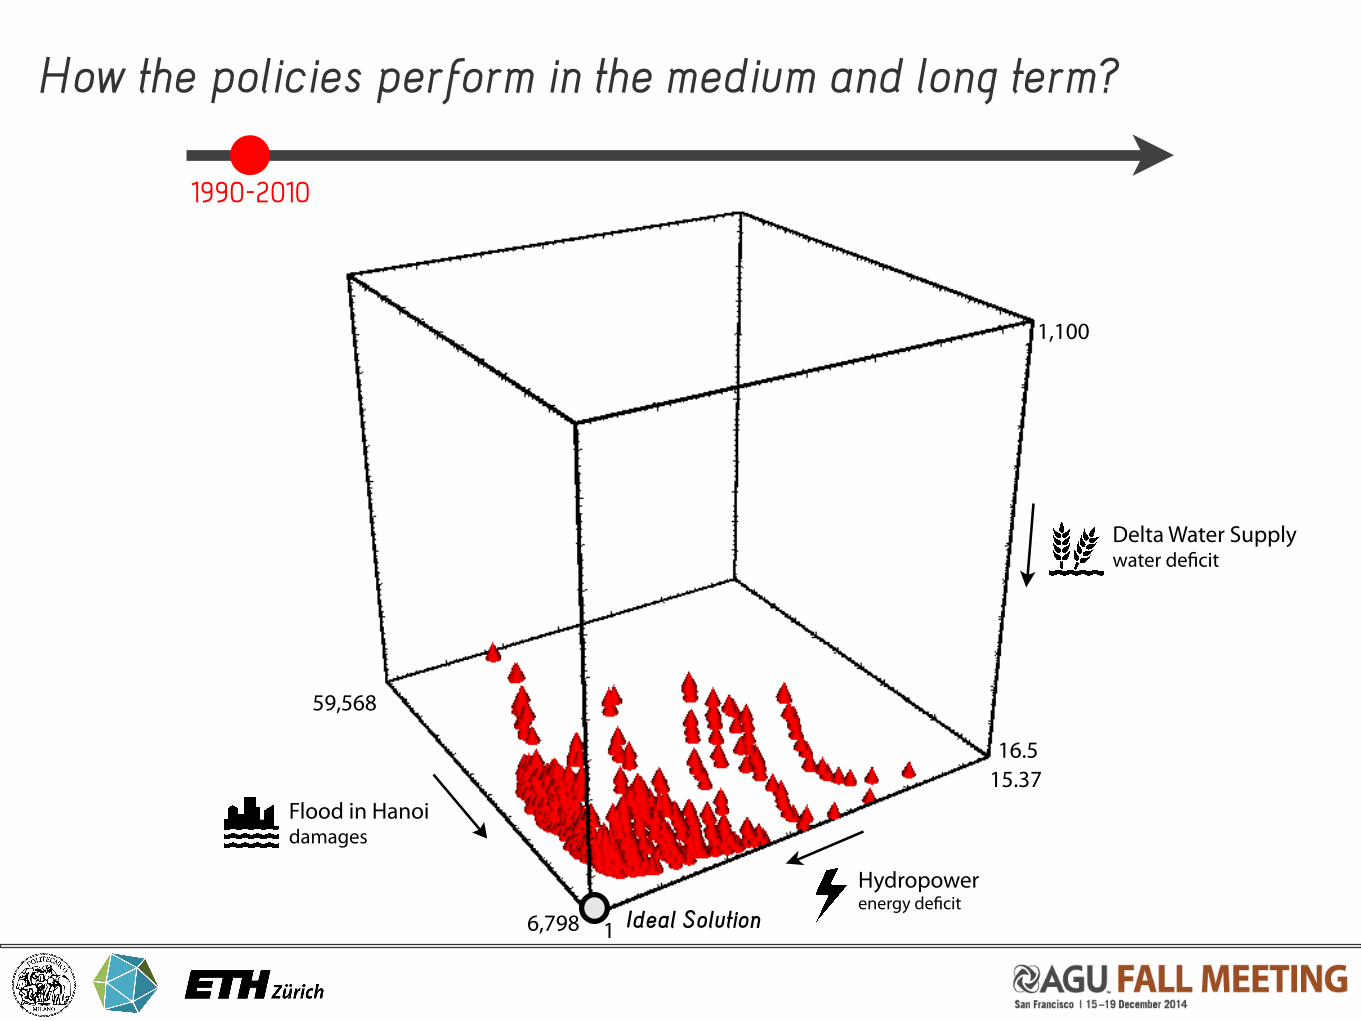
How the policies perform in the medium and long term?
Hydropowerenergy de!cit
Flood in Hanoidamages
Delta Water Supplywater de!cit
15.37
16,798
59,568
1,100
16.5
1990-2010
Ideal Solution
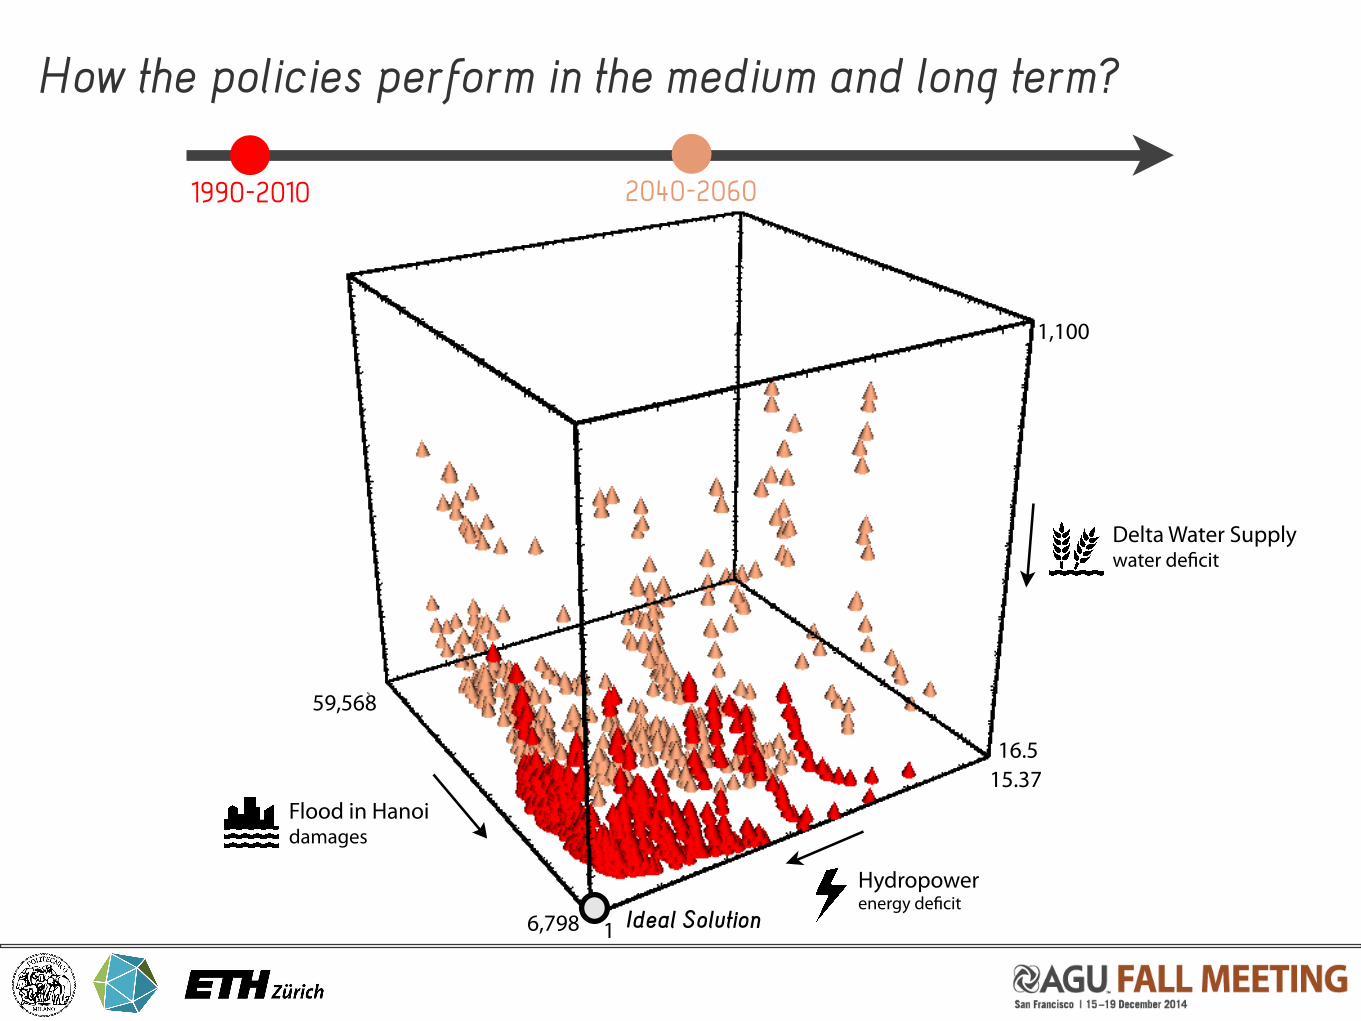
How the policies perform in the medium and long term?
1990-2010
Hydropowerenergy de!cit
Flood in Hanoidamages
Delta Water Supplywater de!cit
15.37
16,798
59,568
1,100
16.5
2040-2060
Ideal Solution
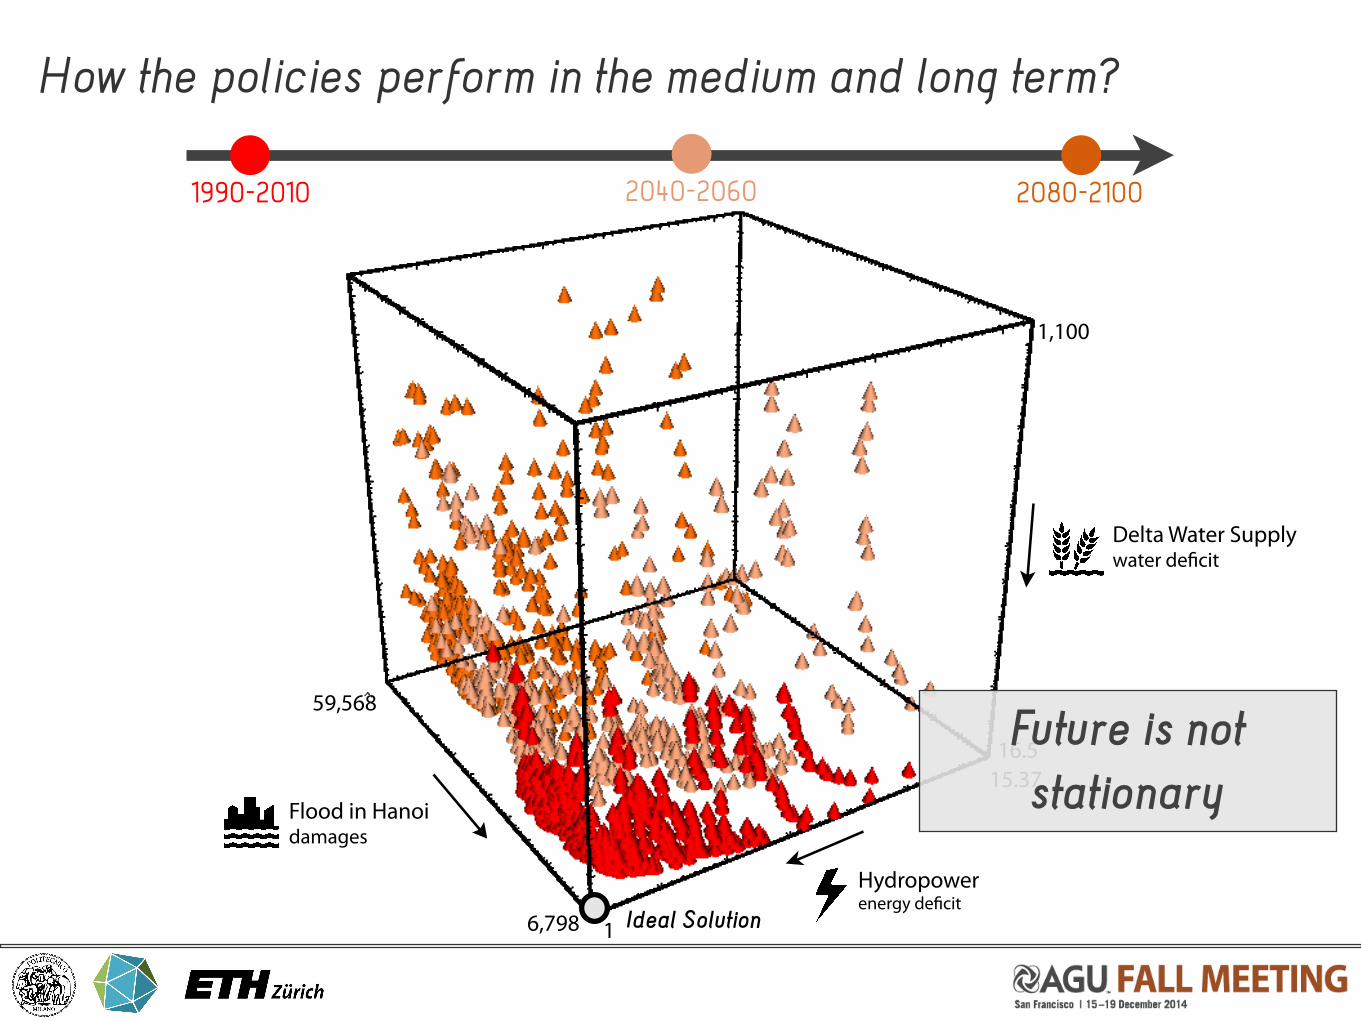
How the policies perform in the medium and long term?
1990-2010 2040-2060
Hydropowerenergy de!cit
Flood in Hanoidamages
Delta Water Supplywater de!cit
15.37
16,798
59,568
1,100
16.5
2080-2100
Future is not stationary
Ideal Solution
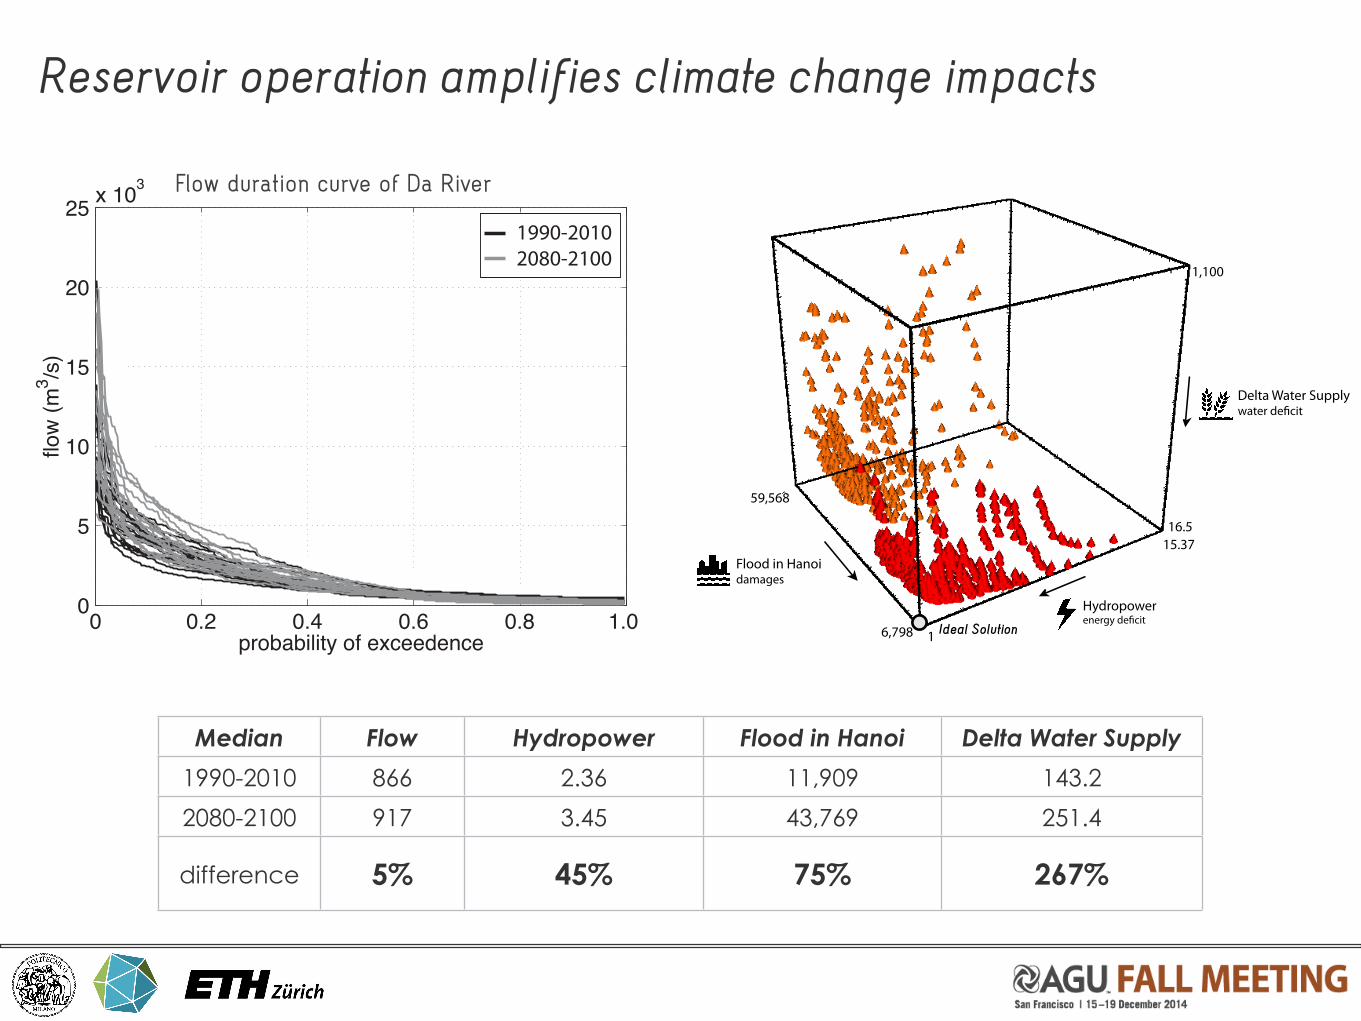
Reservoir operation amplifies climate change impacts
Hydropowerenergy de!cit
Flood in Hanoidamages
Delta Water Supplywater de!cit
15.37
16,798
59,568
1,100
16.5
Median
1990-2010
2080-2100
difference
Flow Hydropower Flood in Hanoi Delta Water Supply
866 2.36 11,909 143.2
917 3.45 43,769 251.4
5% 45% 75% 267%
0 0.2 0.4 0.6 0.8 1.00
5
10
15
20
25 x 103
probability of exceedence
flow
(m3 /s
)
1990-20102080-2100
Flow duration curve of Da River
Ideal Solution
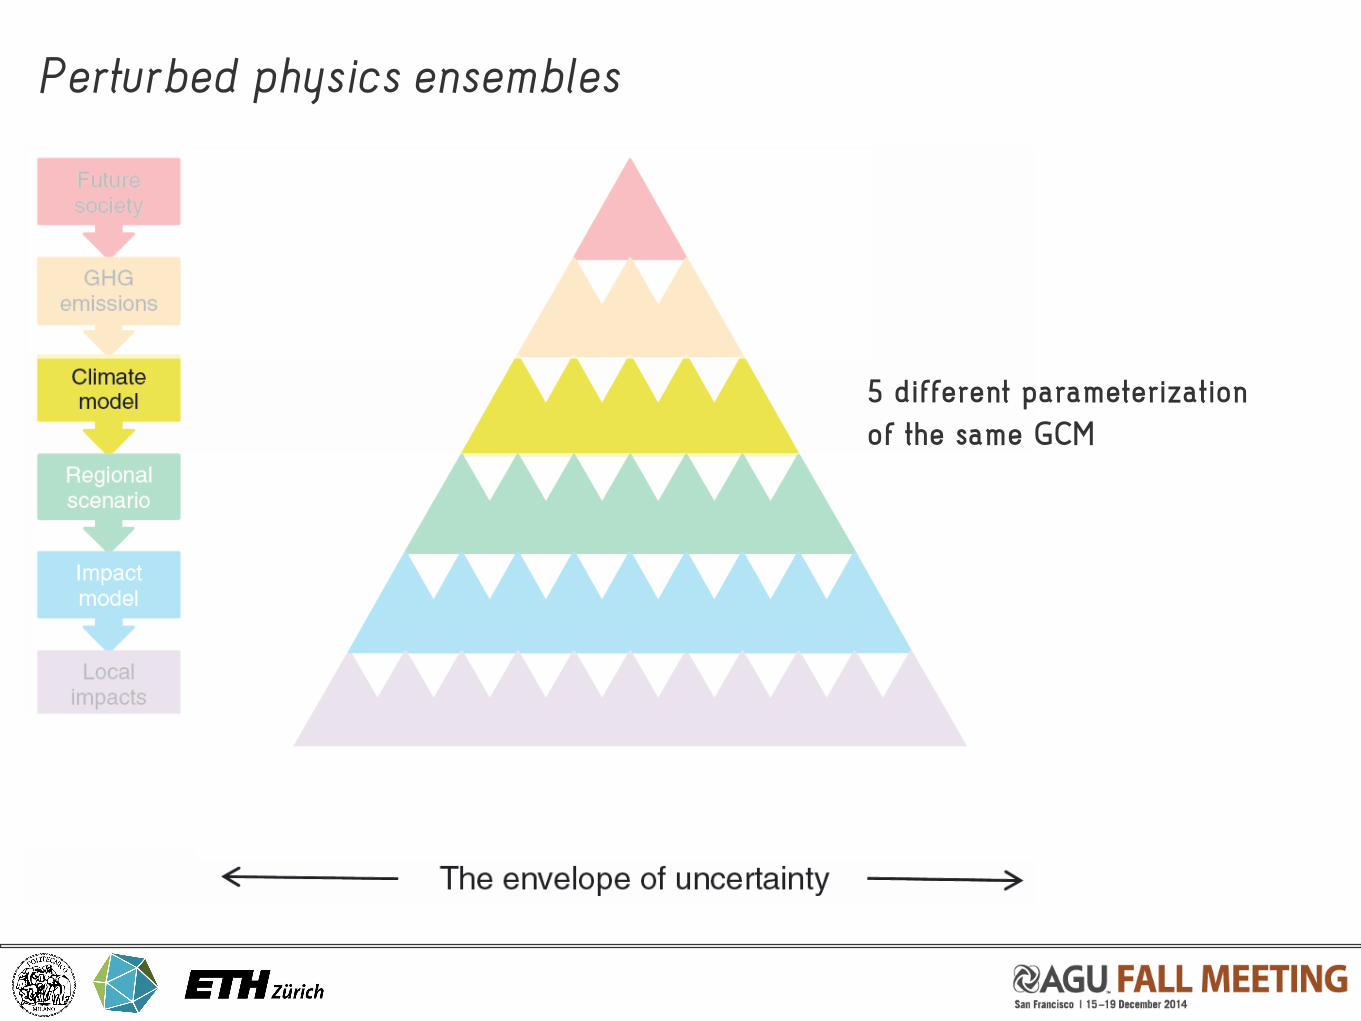
Perturbed physics ensembles
5 different parameterization of the same GCM
32
16,798
245,531
1,742
16.5
Hydropowerenergy de!cit
Flooddamages
Delta Water Supplywater de!cit
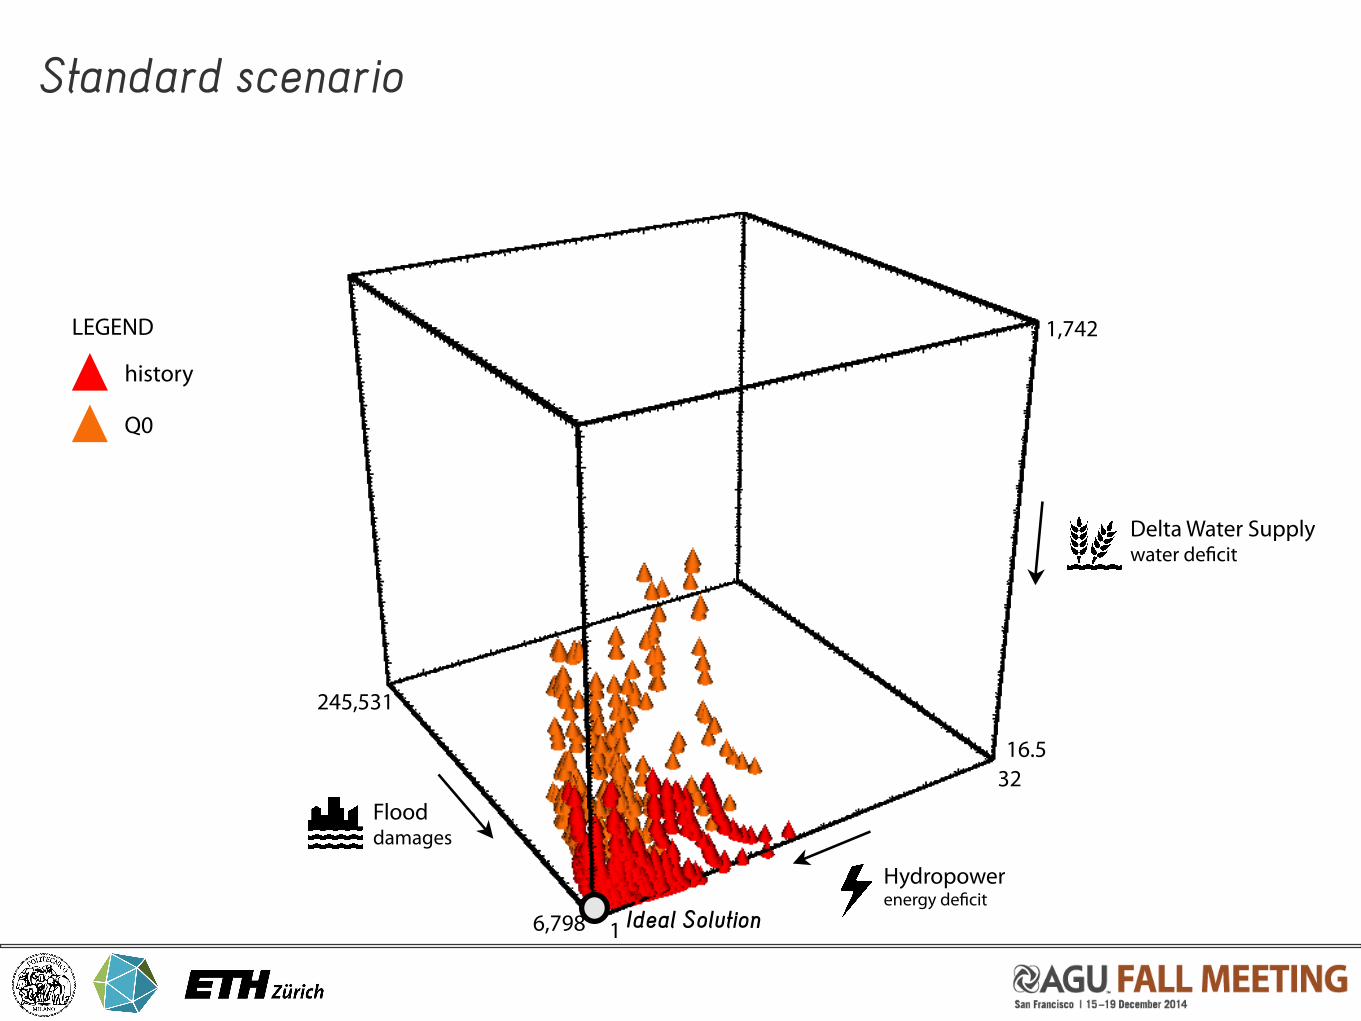
Standard scenario
LEGEND
history
Q0
Q10 (dry)
Q11 (wet)
Q3 (small T)
Q13 (large T)
Qens (avg)
Ideal Solution
32
16,798
245,531
1,742
16.5
Hydropowerenergy de!cit
Flooddamages
Delta Water Supplywater de!cit
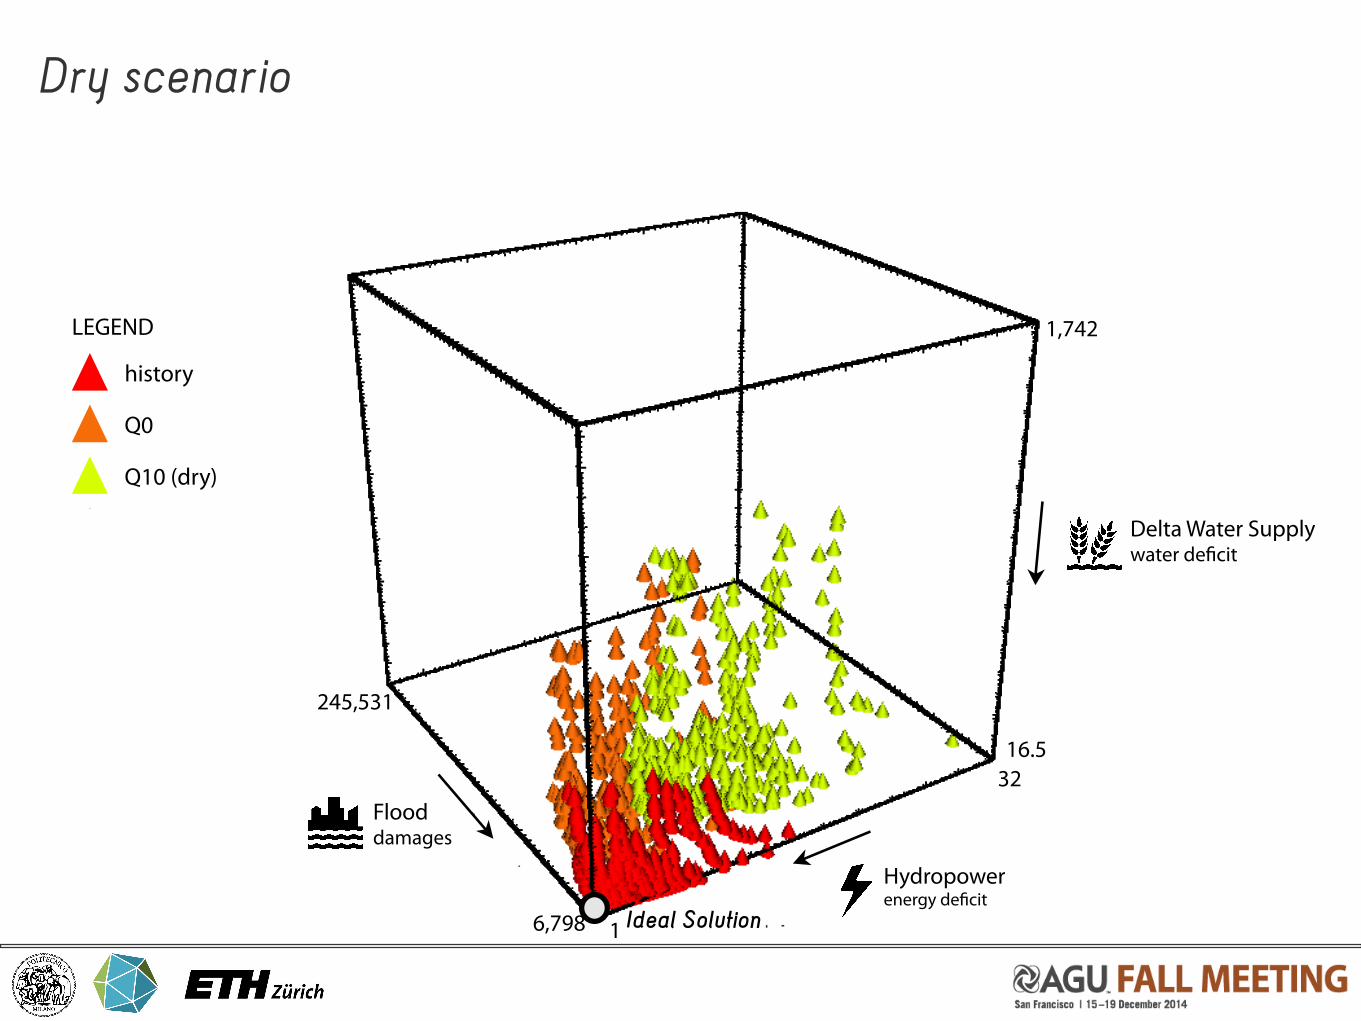
Dry scenario
LEGEND
history
Q0
Q10 (dry)
Q11 (wet)
Q3 (small T)
Q13 (large T)
Qens (avg)
Ideal Solution
32
16,798
245,531
1,742
16.5
Hydropowerenergy de!cit
Flooddamages
Delta Water Supplywater de!cit
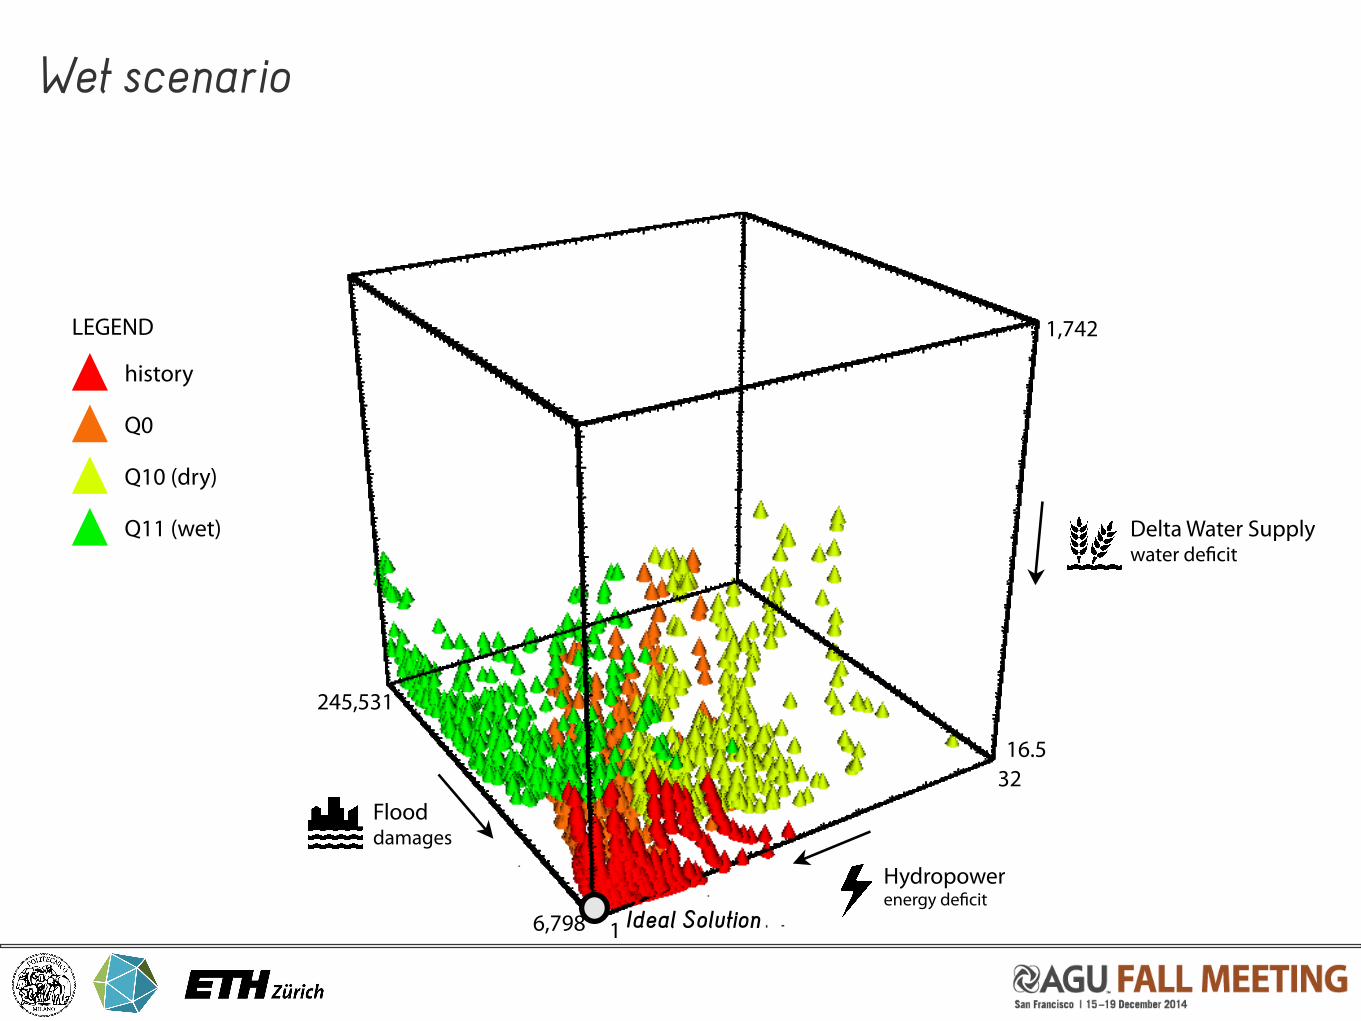
Wet scenario
LEGEND
history
Q0
Q10 (dry)
Q11 (wet)
Q3 (small T)
Q13 (large T)
Qens (avg)
Ideal Solution
32
16,798
245,531
1,742
16.5
Hydropowerenergy de!cit
Flooddamages
Delta Water Supplywater de!cit
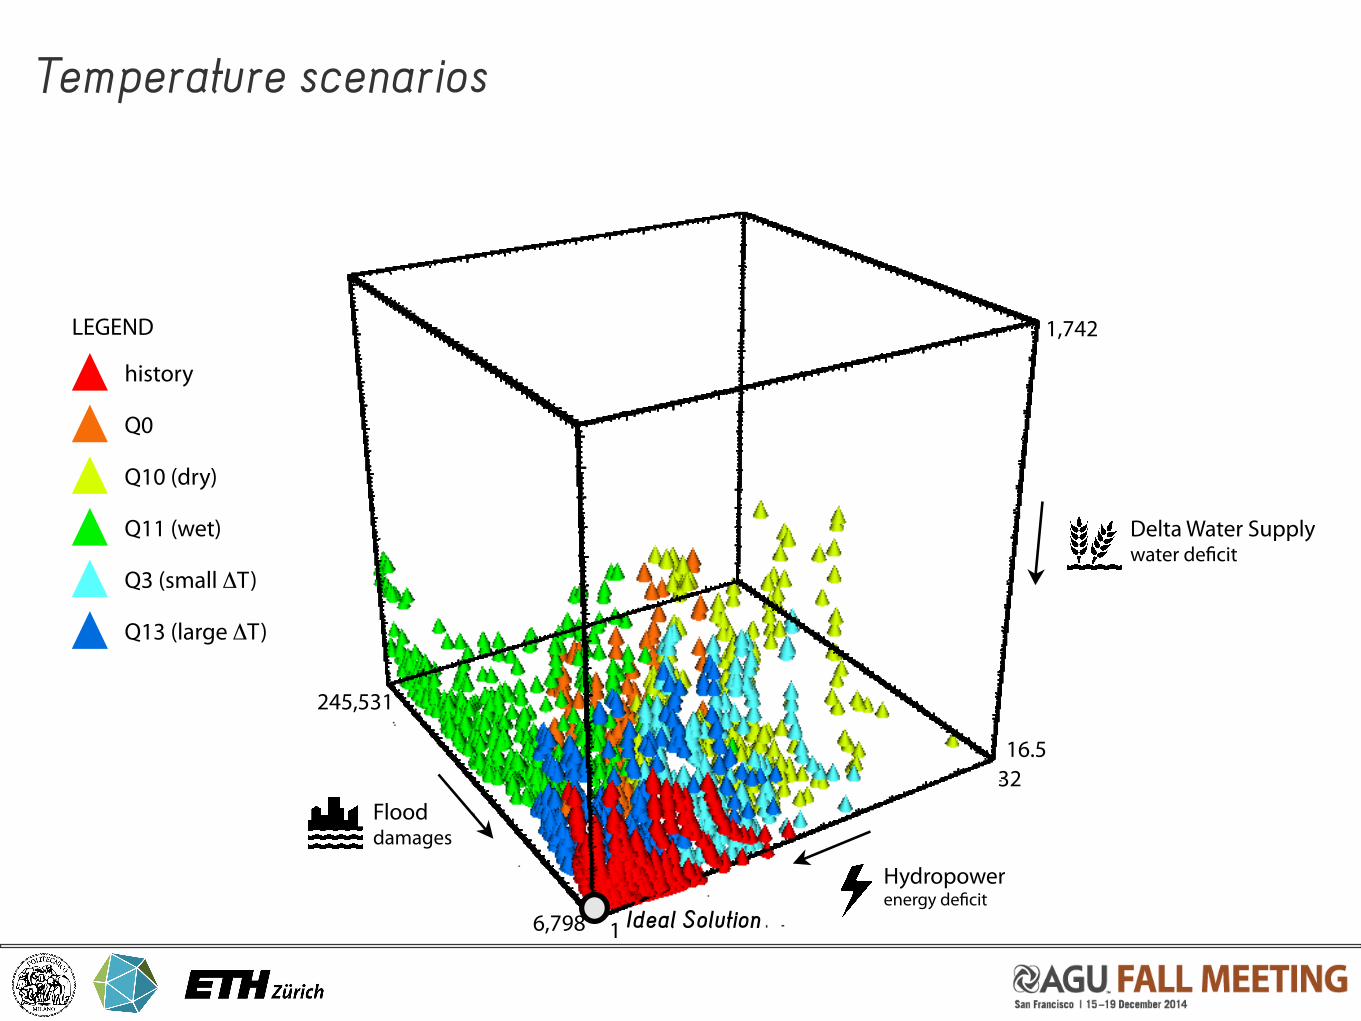
Temperature scenarios
LEGEND
history
Q0
Q10 (dry)
Q11 (wet)
Q3 (small T)
Q13 (large T)
Qens (avg)
Ideal Solution
32
16,798
245,531
1,742
16.5
Hydropowerenergy de!cit
Flooddamages
Delta Water Supplywater de!cit
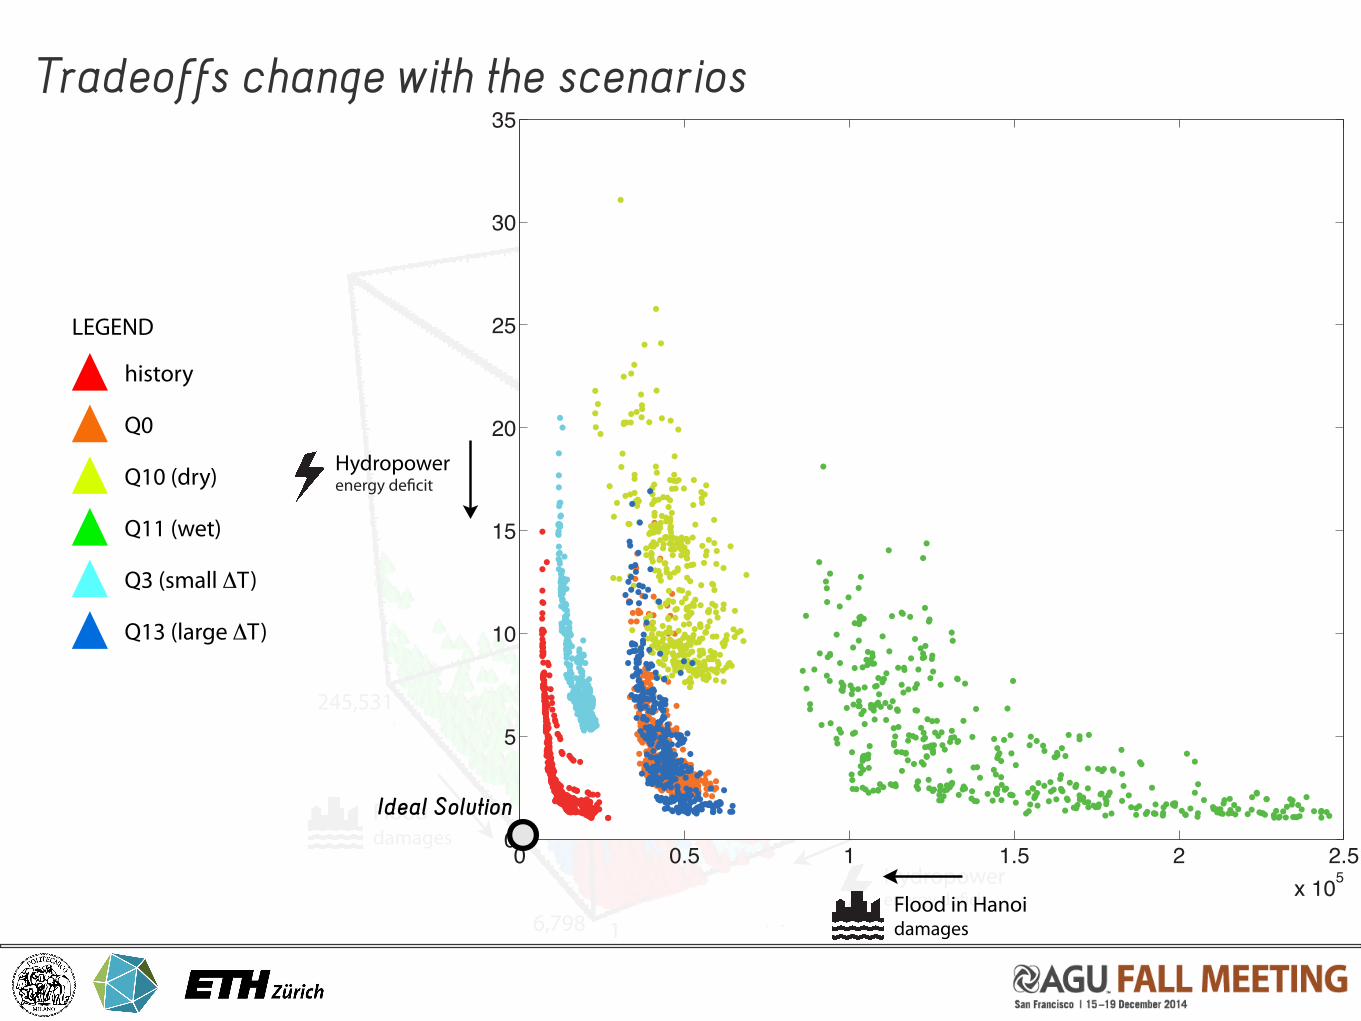
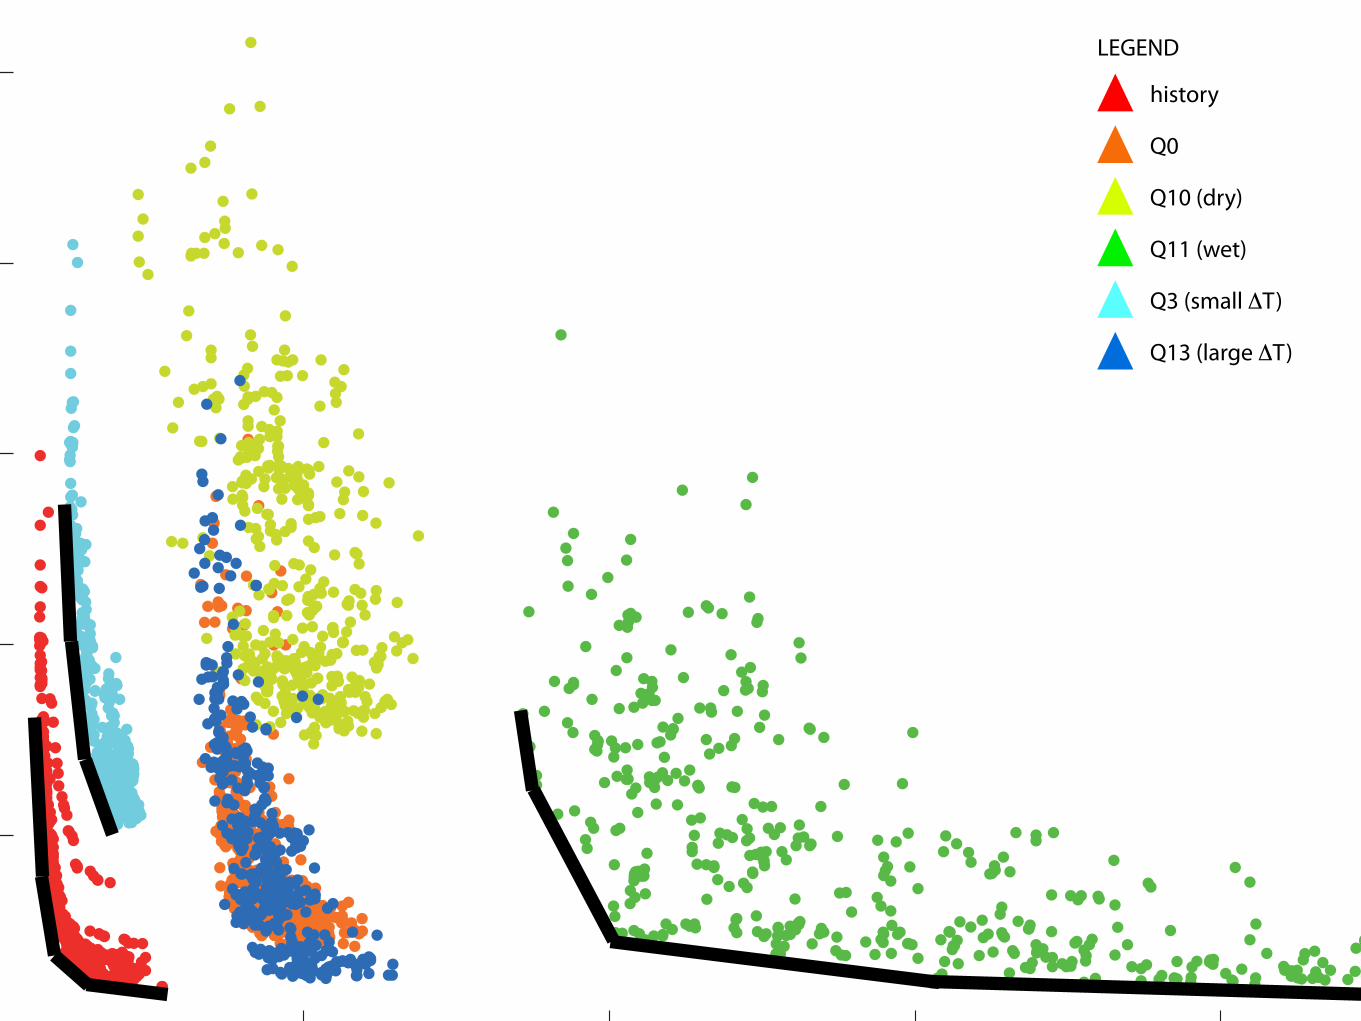
Tradeoffs change with the scenarios
LEGEND
history
Q0
Q10 (dry)
Q11 (wet)
Q3 (small T)
Q13 (large T)
Qens (avg)
0 0.5 1 1.5 2 2.5x 10⁵
0
5
10
15
20
25
30
35
Hydropowerenergy de!cit
Flood in Hanoidamages
Ideal Solution
Tradeoffs change with the scenarios
LEGEND
history
Q0
Q10 (dry)
Q11 (wet)
Q3 (small T)
Q13 (large T)
Qens (avg)
0
5
10
15
20
25LEGEND
history
Q0
Q10 (dry)
Q11 (wet)
Q3 (small T)
Q13 (large T)
Qens (avg)
32
16,798
245,531
1,742
16.5
Hydropowerenergy de!cit
Flooddamages
Delta Water Supplywater de!cit
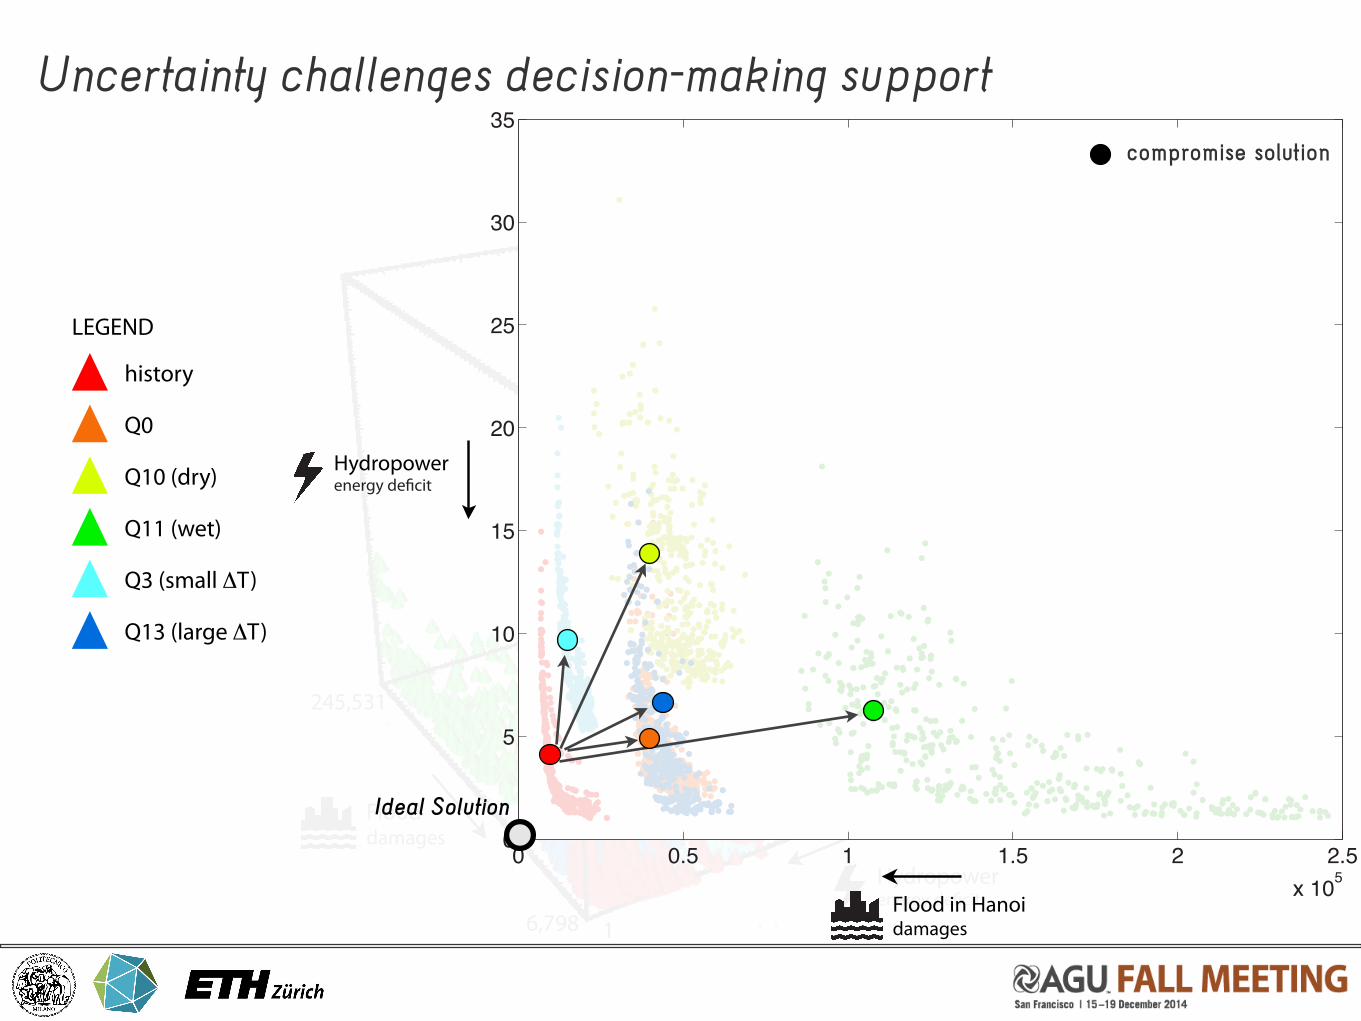
Uncertainty challenges decision-making support
LEGEND
history
Q0
Q10 (dry)
Q11 (wet)
Q3 (small T)
Q13 (large T)
Qens (avg)
0 0.5 1 1.5 2 2.5x 10⁵
0
5
10
15
20
25
30
35
Hydropowerenergy de!cit
Flood in Hanoidamages
compromise solution
Ideal Solution
Conclusions and further research
• EMODPS successfully designed water management policies addressing tradeoffs and promoting stakeholders negotiation.
• Top-down climate change assessment improved our understanding of the vulnerabilities of the system, which are amplified by reservoir operations and depend on the considered future, nonstationary, uncertain scenarios.
Further research will focus on introducing socio-economic scenarios, running robust optimization, and switching to a bottom-up approach for supporting the design of adaptation strategies,
The Project is funded by the Italian Ministry of Foreign Affair as part of its development cooperation program.