Embed Size (px)
Citation preview

Statistical analysis
for
Determining purchase intent of a customer while buying a vehicle.
Design and Analysis of ExperimentsNovember 20th, 2016
By,
Ashish Menkudale UIN: 656130575
Akash Tayal UIN: 661488456
Kshitij Nayak UIN: 657718376
Suhaas Nallacheru UIN: 673011149
Total slides: 29
Time: 8 minutes

Outline
• Defining problem statement and scope of project.
• Selecting response variable.
• Selecting factors and levels.
• Collecting data.
• Data cleaning and visualization.
• Selecting statistical analysis technique.
• Procedure of statistical analysis.
• Result analysis for factorial design without blocking.
• Result analysis for factorial design with blocking.
• Interpretation from effects plot.
• Conclusion.
Pre Experimental
planning
Experiment and
Model revision
2

Problem statement
“The selection of factors which are primarily responsible for determining the purchase intent of
a customer while buying a vehicle and study of interaction effect between those factors.”
Why we chose this problem statement?
• To understand how a generic problem like selection and purchase of a vehicle can be broken down
into a statistical analysis technique.
Scope of experiment
• Includes daily basis regular usage cars
• Excluded high end performance vehicles
3

Selection of response variable
• Initial response variable : Vehicle model preferred by the customer
• Disadvantages : Qualitative and difficult to measure
• Final selection : Price of the vehicle
4

• Initial selection
• Final selection
Selection of factors and levels
Factor Level 1 Level 2 level 3
1 Engine type IC Electric Hybrid
2 Segment Hatchback Sedan SUV/MUV
3 Features Aesthetic After sales service Luxury
5
Factor Level 1 Level 2 level 3
1 Engine power outputlow power
(below 150 hp)
Medium power
(150 hp-250 hp)
High power
(above 250 hp)
2 Segment Hatchback Sedan SUV/MUV
3 Features Aesthetic After sales service Luxury

Collecting data: Format of surveyQ1. Which range of engine power output would you prefer? (select one).
• Low Power (up to 150 hp).
• Medium power (150 hp to 250 hp).
• High Power (250 hp and above).
Q2. Which Vehicle segment would you prefer? (select one).
• Hatchback.
• Sedan.
• SUV / MUV.
Q3. Select preferred features you are looking for in your vehicle. (select one).
• Aesthetics.
• luxury.
• after sales service.
Q4. Please enter your preferred price estimate for above selected parameters.
• Price.
Q5. Please enter which brand of the vehicle you would prefer on the basis of the factors you chose above.
• Brand.6

Data cleaning: Initial screening
• Over 212 data points were obtained through survey.
• Visual screening.
• Removing illogical and incomplete inputs.
• Data frame of 189 data points.
Low Medium High Hatchback sedan SUV/MUV AestheticsAfterSales
serivceLuxury
1 ✔ ✔ ✔ 45000 Mercedes
2 ✔ ✔ ✔ 28000 Ford
3 ✔ ✔ ✔ 24500 Chevrolet
4 ✔ ✔ ✔ 20800 Toyota
5 ✔ ✔ ✔ 26500 Ford
6
7
Observati
on #
continued upto 189 data points
Engine power output Segment Features
Price $ Brand
Data frame
7

Probability distribution plot for price was plotted according to Anderson – Darling method.
Takeaway: Obtained data is normally distributed.
Data cleaning: Normality checks
P value should be greater than
0.05 so that we will fail to reject
our null hypothesis which
assumes our data is normally
distributed.
Probability plot of Response
Normal – 95 % CI
8

Data cleaning: Data visualizationDistribution in data according to brands
Takeaway: Honda, Toyota and Ford were most preferred brands. 9

10
Experimental procedure
1. Collect inputs from customers and get the desired combination and response variables via survey.
2. Check the Normality for the values of response variables using MINITAB.
3. Outline of experiment:
• A Full Factorial Design with 3 Factors and 3 Levels.
• 3 replicates and a total of 81 data points.
• Without blocking and with Blocking method (discussed later).
• Regression analysis
• Residual analysis for prices obtained from inputs and prices calculated from regression equation.
4. Check the significance of main effects and interaction effects with the help of P-value obtained from full
factorial design.
5. Residual analysis.
6. Conclude.

11
Formulation of theoretical model
H01: μHigh power = μmedium power = μlow power.
H a1: μHigh power ≠ μmedium power ≠ μlow power.
H 02: μhatchback = μsedan = μsuv/muv.
H a2: μhatchback ≠ μsedan ≠ μsuv/muv.
H 03: μaesthetics = μafter sales = μluxury.
H a3: μaesthetics ≠ μafter sales ≠ μluxury.
Main effect of factor Power output
Main effect of factor Segment
Main effect of factor feature

Interaction effect
between factor
power, segment
and feature
H 04: Power has no influence on how segment affects vehicle price.
H a4: There is an interaction between power and segment of the vehicle.
H 05: Power has no influence on how features affects vehicle price.
H a5: There is an interaction between power and features of the vehicle.
H 06: Segments has no influence on how features affects vehicle price.
H a6: There is an interaction between segment and features of the vehicle.
H 07: The three factors have no influence on vehicle price.
H a7: There is a three-factor interaction between Power, segment and features.
12
Formulation of theoretical modelInteraction effect
between factor
Power output
and segment
Interaction effect
between factor
Power output
and feature
Interaction effect
between factor
Segment and
feature

13
Results: Full factorial design analysisResults of analysis of variance (without blocking). Conclusion:
All main effects are significant as P value
is less than 0.05.
All two way interactions are not
significant.
Three way interaction is not significant.
Conclusion:
R square is 60%. It is slightly less than
moderate. Model does not have a good
fit over data.
Main effects
2-way interaction effects
3-way interaction effects

Results: Full factorial design analysis
All the main effects (A, B and C) and a two
way interaction AB are significant as they do
not lie on normality spectrum.
14
Results of analysis of variance (without blocking).

15
Results: Full factorial design analysis
Residuals are not
normally
distributed.
Residuals have
diverging trend as
fitted value
increases.
Mostly, residuals
lie on negative
side with respect
to observation
order which
concludes a
correlated error.
Residual analysis (without blocking).

16
Revised formulation of experiment
• Response Variable: Price
• A Full Factorial Design with 3 Factors and 3 Levels.
• 3 replicates and a total of 81 data points.
• Blocks on replicates.
• Regression analysis
• Residual analysis for prices obtained from inputs and prices calculated from regression equation.
Blocks Block 1 Block 2 Block 3
Brand Honda Toyota Ford
17
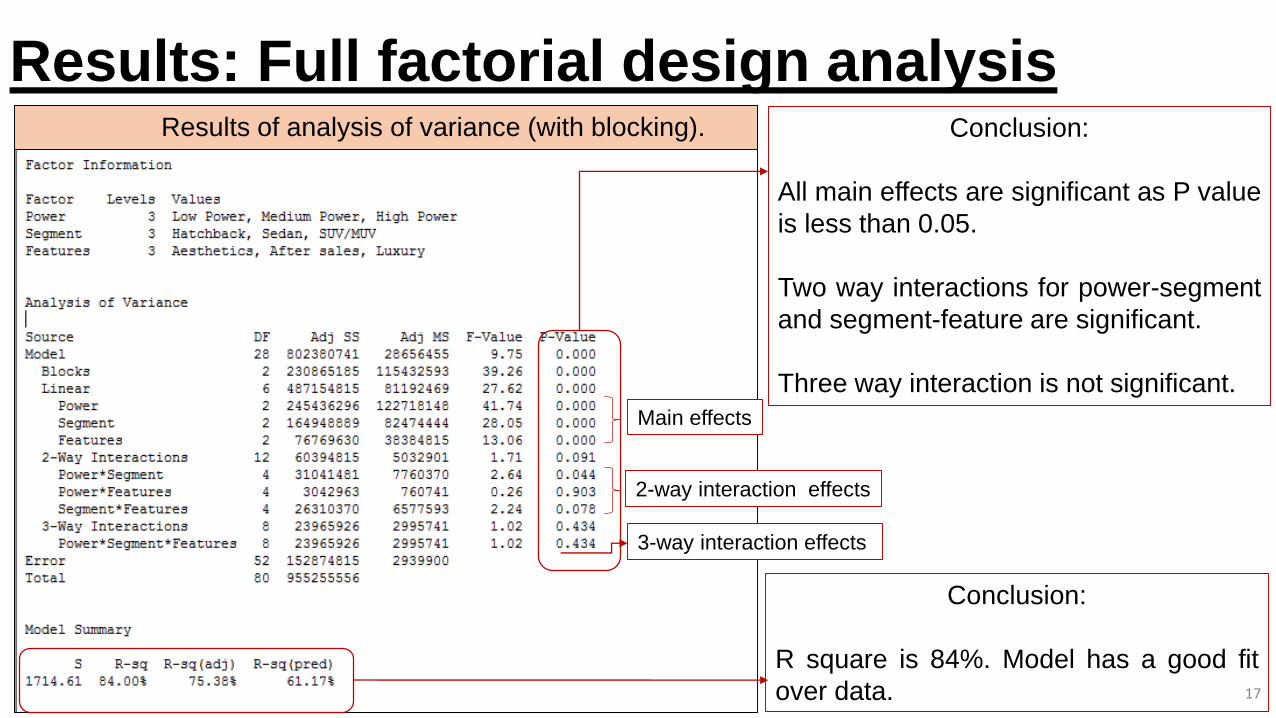
Results: Full factorial design analysisResults of analysis of variance (with blocking). Conclusion:
All main effects are significant as P value
is less than 0.05.
Two way interactions for power-segment
and segment-feature are significant.
Three way interaction is not significant.
Conclusion:
R square is 84%. Model has a good fit
over data.
Main effects
2-way interaction effects
3-way interaction effects

Results: Full factorial design analysis
All the main effects (A-power, B-segment and
C-feature) are significant as they do not lie on
normality spectrum.
Also, two way interactions AB – power &
segment and BC – segment & feature are
significant as they lie slightly off from normality
spectrum.
Results of analysis of variance (with blocking).
18

19
Results: Full factorial design analysis
Residuals are
normally
distributed.
Residuals do not
have any trend
with respect to
fitted values.
Residuals do not
have any trend
with respect to
observation order
which concludes a
non correlated
error.
Residual analysis (with blocking).

As data spread is large over regression line, it is
evident that model performance for experiment
without blocking is very poor. (R square = 60%). 20
Regression analysis: Actual vs. predicted
Compared to model performance for experiment
without blocking, this model performs way better
as R-square is significantly increased (84%).
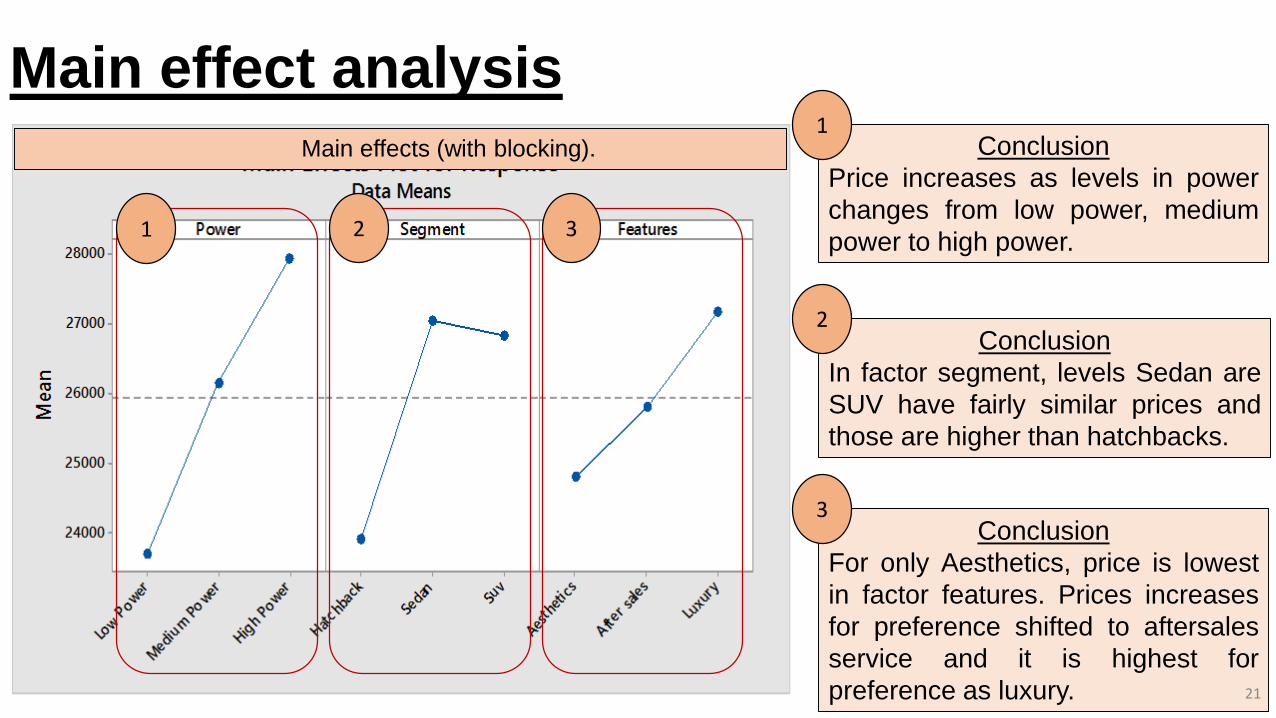
Conclusion
For only Aesthetics, price is lowest
in factor features. Prices increases
for preference shifted to aftersales
service and it is highest for
preference as luxury. 21
Main effect analysisConclusion
Price increases as levels in power
changes from low power, medium
power to high power.
Conclusion
In factor segment, levels Sedan are
SUV have fairly similar prices and
those are higher than hatchbacks.
1 2 3
1
2
3
Main effects (with blocking).
22
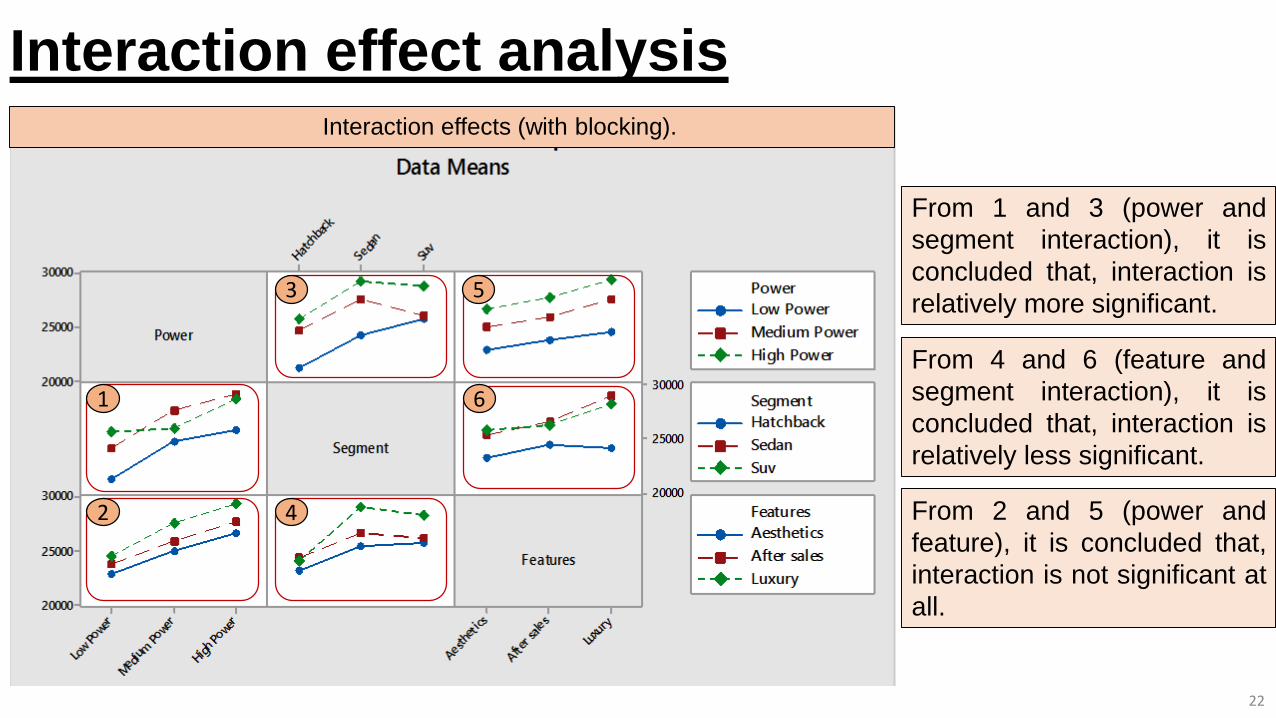
Interaction effect analysis
From 1 and 3 (power and
segment interaction), it is
concluded that, interaction is
relatively more significant.
1
2
3
4
5
6
Interaction effects (with blocking).
From 4 and 6 (feature and
segment interaction), it is
concluded that, interaction is
relatively less significant.
From 2 and 5 (power and
feature), it is concluded that,
interaction is not significant at
all.

23
Conclusion
Conclusion# Term Experiment without blocking Experiment with blocking
1 Main effects Significant. Significant.
2 Two way interaction effectsNo two way interaction is
significant.
Two way interaction for Power
and segment is significant.
3 Three way interaction Not significacnt. Not significant.
4 R square 59.80% 84%
5 Adj. R square 40.50% 75.40%
6 Trend for residual distribution Not normal. Normally distributed.
7 Trend for fitted values Diverging trend. No trend.
8Performance (Actual vs.
Predicted)
Large spread (Poor
performance).
Less spread (good
performance).

24
Conclusion
H01: μHigh power = μmedium power = μlow power.
H a1: μHigh power ≠ μmedium power ≠ μlow power.
H 02: μhatchback = μsedan = μsuv/muv.
H a2: μhatchback ≠ μsedan ≠ μsuv/muv.
H 03: μaesthetics = μafter sales = μluxury.
H a3: μaesthetics ≠ μafter sales ≠ μluxury.
Main effect
of factor
Power
output
Main effect
of factor
Segment
Main effect
of factor
feature
We reject the null hypothesis.
i.e. there’s significant effect of
main effect power output.
We reject the null hypothesis.
i.e. there’s significant effect of
main effect segment.
We reject the null hypothesis.
i.e. there’s significant effect of
main effect feature.

H 04: Power has no influence on how segment affects vehicle price.
H a4: There is an interaction between power and segment of the vehicle.
H 05: Power has no influence on how features affects vehicle price.
H a5: There is an interaction between power and features of the vehicle.
H 06: Segments has no influence on how features affects vehicle price.
H a6: There is an interaction between segment and features of the vehicle.
H 07: The three factors have no influence on vehicle price.
H a7: There is a three-factor interaction between Power, segment and features.
25
Conclusion
We reject the
null hypothesis.
We fail to reject
the null
hypothesis.
We fail to reject
the null
hypothesis.
We fail to reject
the null
hypothesis.

Future scope
26
• Problem statement like this, usually involve a complex matrix of many factors with many different
levels.
• A more comprehensive model can be build for more factors and levels.
• Data transformation can be done to figure out better model fit.

Excel : Data collection from ‘formstack’ and Data sorting.
Rapid Miner : Data visualization.
Spotfire : Data visualization.
Minitab : factorial analysis, regression analysis, effects interpretation.
Design Expert : Half normality plots, Model performance analysis- predicted vs. actual
27
Software used
28
References
• Design and analysis Of experiments, Eighth edition, Douglas c. Montgomery, john wiley & sons, inc.
• Videos tutorials for Design Expert.
• Video tutorials for Rapid Miner.

29
Questions