Embed Size (px)
Citation preview
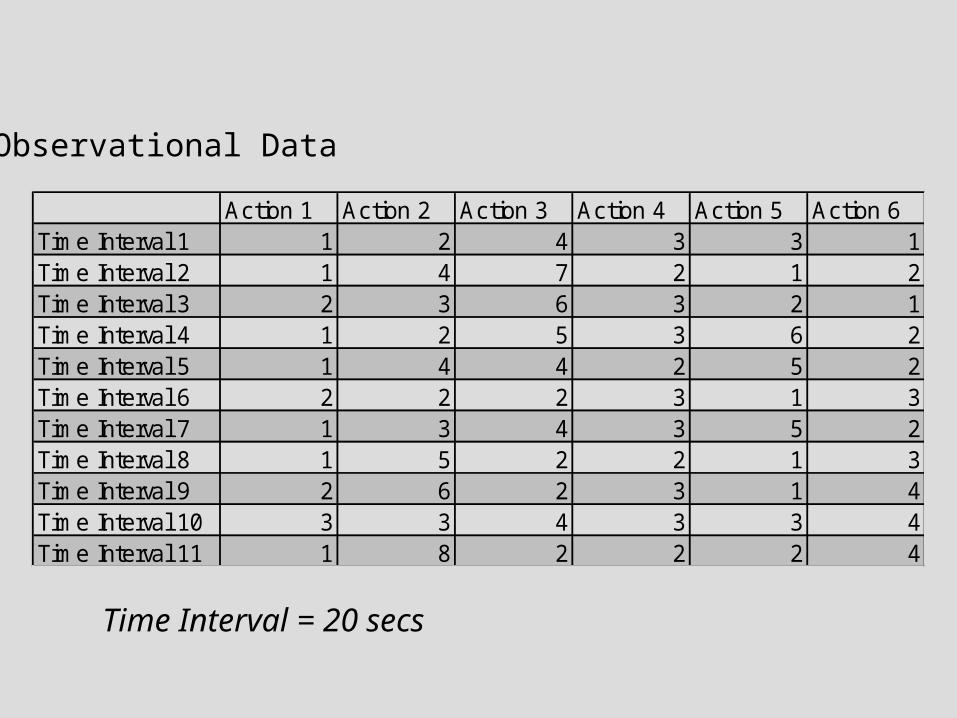
Action 1 Action 2 Action 3 Action 4 Action 5 Action 6Time Interval 1 1 2 4 3 3 1Time Interval 2 1 4 7 2 1 2Time Interval 3 2 3 6 3 2 1Time Interval 4 1 2 5 3 6 2Time Interval 5 1 4 4 2 5 2Time Interval 6 2 2 2 3 1 3Time Interval 7 1 3 4 3 5 2Time Interval 8 1 5 2 2 1 3Time Interval 9 2 6 2 3 1 4Time Interval 10 3 3 4 3 3 4Time Interval 11 1 8 2 2 2 4
Observational Data
Time Interval = 20 secs
0
1
2
3
4
5
6
7
8
9
Action 1
Action 2
Action 3
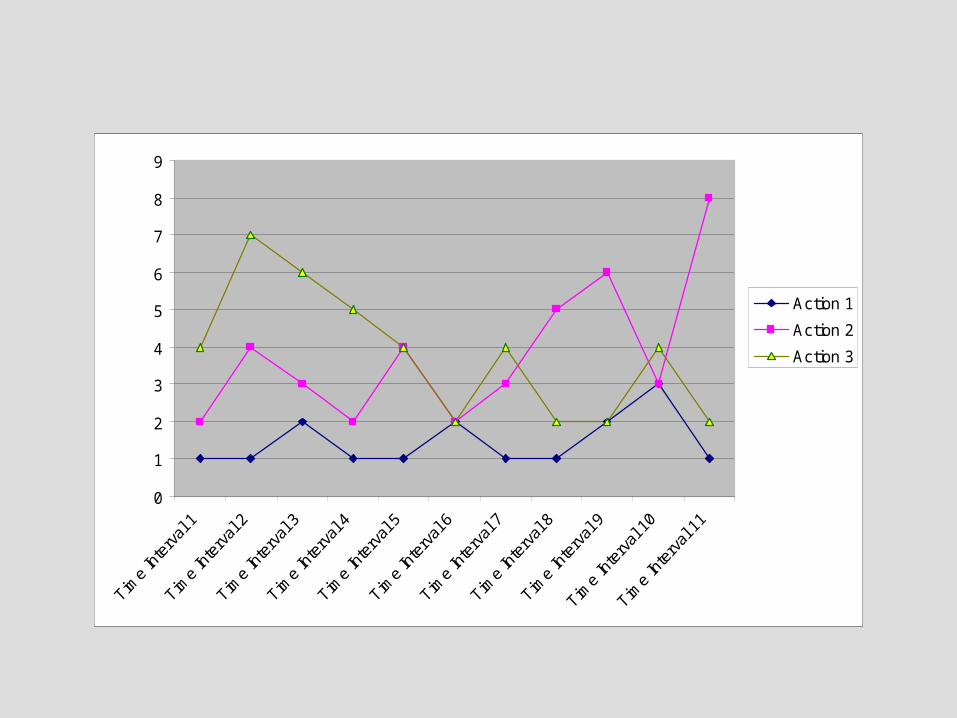
Factorial Analysis of Variance
• What is a factorial design?What is a factorial design?
• Main effectsMain effects
• InteractionsInteractions
• Simple effectsSimple effects
• Magnitude of effectMagnitude of effect
Cont.
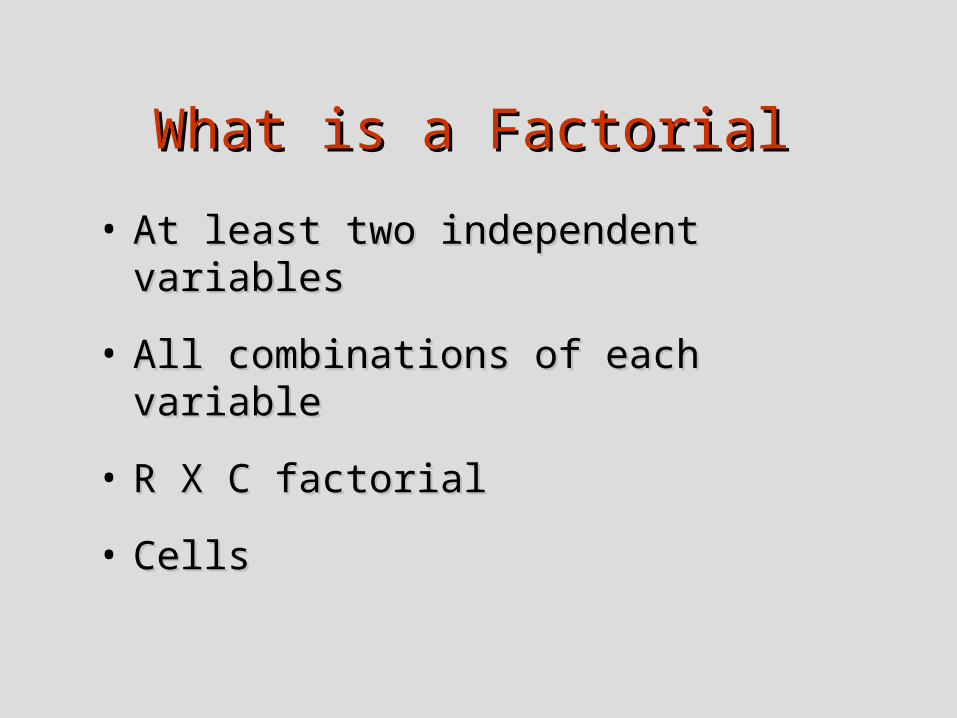
What is a FactorialWhat is a Factorial
• At least two independent variablesAt least two independent variables
• All combinations of each variableAll combinations of each variable
• R X C factorialR X C factorial
• CellsCells

2 X 2 Factorial2 X 2 Factorial
No Instructions
With Instructions
Male
Female

If you have two factors in the experiment: Age and Instruction Condition.
If you look at the effect of age, ignoring Instruction for the time being, you are looking at the main effect of age. If we look at the effect of instruction, ignoring age, then you are looking at the main effect of instruction.
Main effects

If you look at the effect of age at one level of instruction, then that is a simple effect.
If you could restrict yourself to one level of one IV for the time being, and looking at the effect of the other IV within that level.
Simple effects

0
0.5
1
1.5
2
2.5
A1 A2 A3
0
0.5
1
1.5
2
2.5
3
3.5
A1 A2 A30
0.5
1
1.5
2
2.5
3
3.5
4
4.5
A1 A2 A3
0
0 . 5
1
1. 5
2
2 . 5
3
3 . 5
4
4 . 5
A1 A2 A3
0
0 . 5
1
1. 5
2
2 . 5
3
3 . 5
4
4 . 5
A1 A2 A3
0
0 . 5
1
1. 5
2
2 . 5
3
3 . 5
4
4 . 5
A1 A2 A3
Interactions
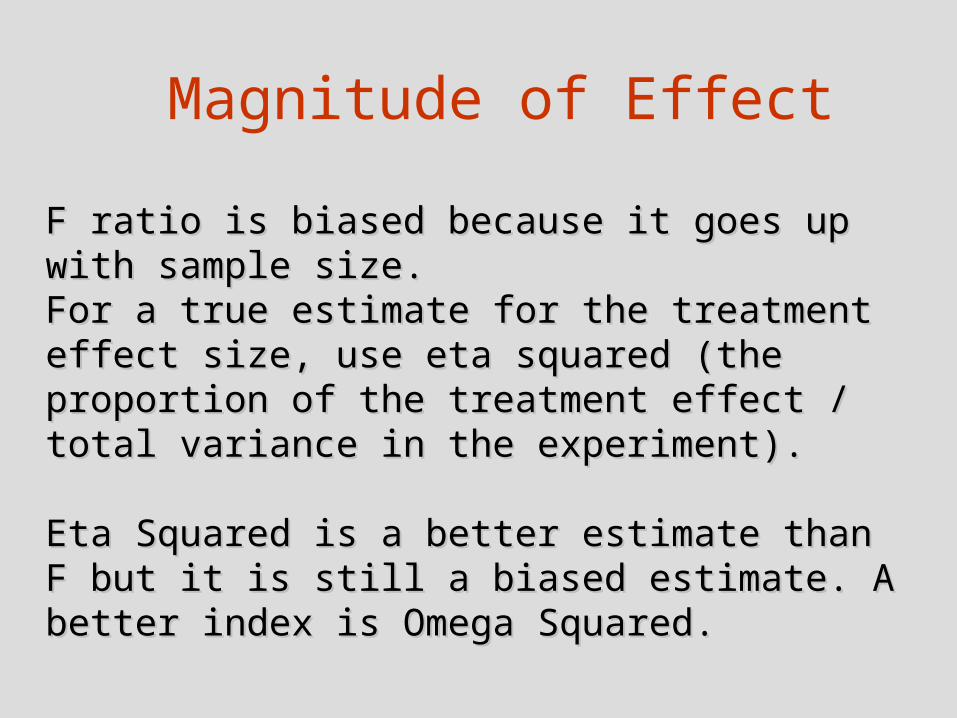
F ratio is biased because it goes up with F ratio is biased because it goes up with sample size. sample size. For a true estimate for the treatment effect For a true estimate for the treatment effect size, use eta squared (the proportion of the size, use eta squared (the proportion of the treatment effect / total variance in the treatment effect / total variance in the experiment). experiment).
Eta Squared is a better estimate than F but it Eta Squared is a better estimate than F but it is still a biased estimate. A better index is is still a biased estimate. A better index is Omega Squared. Omega Squared.
Magnitude of Effect

Magnitude of EffectMagnitude of Effect
• Eta SquaredEta Squared
InterpretationInterpretation
• Omega squaredOmega squared Less biased estimateLess biased estimate
total
effect
SS
SS2
errortotal
erroreffect
MSSS
MSkSS
)1(2
k = number of levels for the effectin question

TreatmentEffectErrorVariance
Omega Squared

R2 is also often used. It is based on the sum of squares. For experiments use Omega Squared. For correlations use R squared.
Value of R square is greater than omega squared.
Cohen classified effects as Small Effect: .01Medium Effect: .06Large Effect: .15
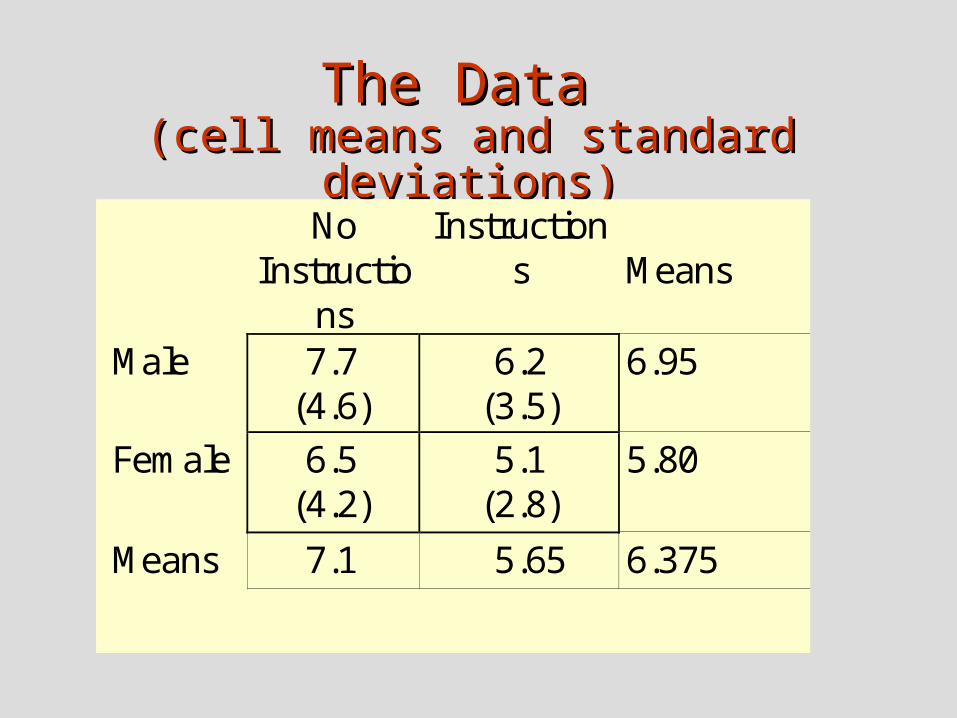
The Data The Data (cell means and standard (cell means and standard
deviations)deviations) No
Instructions
Instructions
Means
Male 7.7 (4.6)
6.2 (3.5)
6.95
Female 6.5 (4.2)
5.1 (2.8)
5.80
Means 7.1 5.65 6.375

Plotting ResultsPlotting Results
0
2
4
6
8
10
No Instructions Instructions
Male Female

Effects to be estimatedEffects to be estimated• Differences due to instructionsDifferences due to instructions
Errors more in condition without instructionsErrors more in condition without instructions
• Differences due to genderDifferences due to gender Males appear higher than femalesMales appear higher than females
• Interaction of video and genderInteraction of video and gender What is an interaction?What is an interaction?
Do instructions effect males and females equally?Do instructions effect males and females equally?
Cont.

Estimated Effects--cont.Estimated Effects--cont.
• ErrorError average within-cell varianceaverage within-cell variance
• Sum of squares and mean squaresSum of squares and mean squares Extension of the same concepts in the Extension of the same concepts in the
one-wayone-way

CalculationsCalculations
• Total sum of squaresTotal sum of squares
• Main effect sum of squaresMain effect sum of squares
2..XXSStotal
2..XXngSS Vvideo
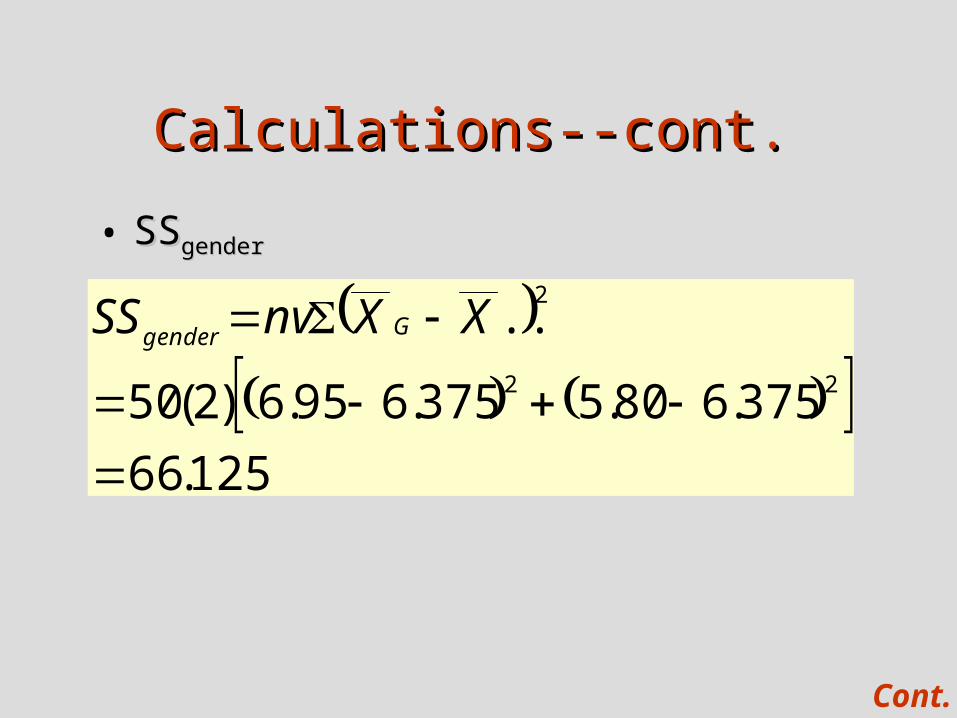
2..XXnvSS Ggender
Cont.

Calculations--cont.Calculations--cont.
• Interaction sum of squaresInteraction sum of squares Calculate SSCalculate SScellscells and subtract SS and subtract SSVV and SS and SSGG
• SSSSerrorerror = SS = SStotaltotal - SS - SScellscells
or, or, MSMSerrorerror can be found as average of cell variances can be found as average of cell variances
2..)( XXnSS ijcells

Degrees of FreedomDegrees of Freedom
• dfdf for main effects = number of for main effects = number of levels - 1levels - 1
• dfdf for interaction = product of for interaction = product of dfdfmain main
effectseffects
• dfdf errorerror = = NN - - abab = = NN - # cells - # cells
• dfdftotaltotal = = NN - 1 - 1
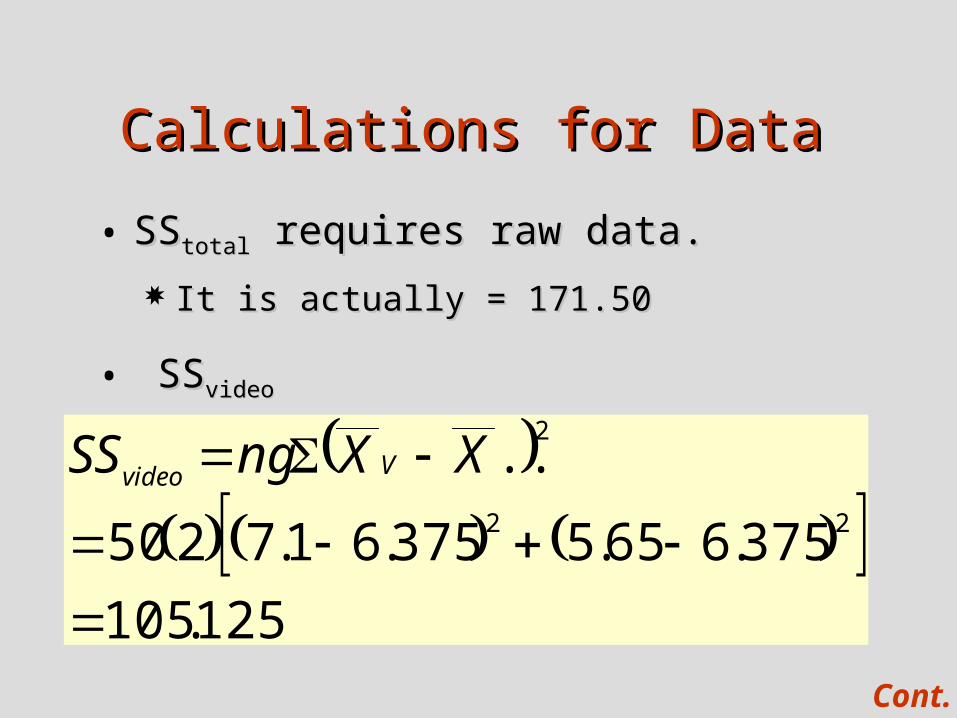
Calculations for DataCalculations for Data
• SSSStotaltotal requires raw data. requires raw data.
It is actually = 171.50It is actually = 171.50
• SSSSvideovideo
125.105
375.665.5375.61.7250
..22
2
XXngSS Vvideo
Cont.
Calculations--cont.Calculations--cont.
• SSSSgendergender
125.66
375.680.5375.695.6)2(50
..22
2
XXnvSS Ggender
Cont.

Calculations--cont.Calculations--cont.
• SSSScellscells
• SSSSVXGVXG = SS = SScellscells - SS - SSinstructioninstruction- SS- SSgendergender
== 171.375 - 105.125 - 66.125 = 0.125 171.375 - 105.125 - 66.125 = 0.125
375.171)4275.3(50
)375.61.5()375.65.6(
)375.62.6()375.67.7(50
..)(
22
22
2
XXnSS cellcells
Cont.
Calculations--cont.Calculations--cont.
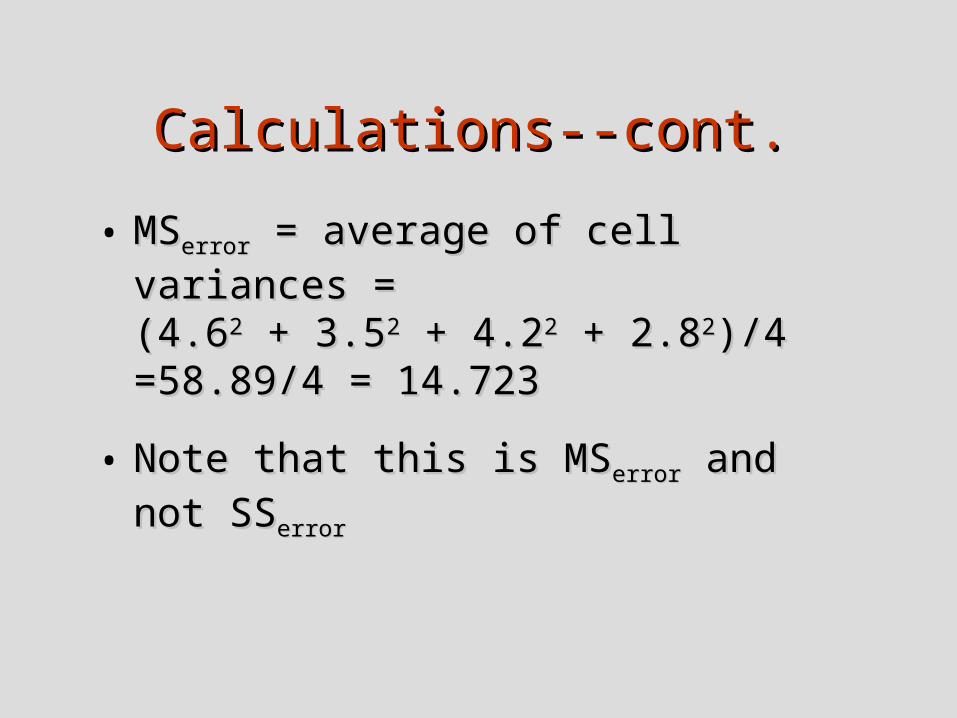
• MSMSerrorerror = average of cell variances = = average of cell variances =(4.6(4.622 + 3.5 + 3.522 + 4.2 + 4.222 + 2.8 + 2.822)/4 )/4 =58.89/4 = 14.723 =58.89/4 = 14.723
• Note that this is MSNote that this is MSerrorerror and not SS and not SSerrorerror

Summary TableSummary Table
Source df SS MS F Instructions
1 105.125 105.125 7.14
Gender 1 66.125 66.125 4.49 VXG 1 0.125 0.125 .01 Error 19
6 2885.610 14.723
Total 199
3056.980

Elaborate on InteractionsElaborate on Interactions
• Diagrammed on next slide as line Diagrammed on next slide as line graphgraph
• Note parallelism of linesNote parallelism of lines Instruction differences did not depend Instruction differences did not depend
on genderon gender

Line Graph of InteractionLine Graph of Interaction
0123456789
No Instructions Instructions
MaleFemale


![[Secs 16.1 Dunlap]](https://img.pdfslide.us/doc/110x75/56812bd4550346895d9036ea/secs-161-dunlap.jpg)