1
Deploy DER controllers which embed a sub- meter and frequency-controlled relays, with remotelly controllable threshold Gather the effective power consumption of each load Build a stairs droop curve that approach the conventional droop curve of bulk generation unit by assigning a specific threshold to each load Send down the frequency threshold to each DER controller 49.85 49.9 49.95 50 50.05 50.1 50.15 Number of events 0 100 200 300 400 500 600 700 800 900 Daily number of load modulation events expected depending on the frequency threshold Frequency Threshold (in Hz) 49.85 49.9 49.95 50 50.05 50.1 50.15 Duration (in hr) 0 1 2 3 4 5 6 7 8 9 10 11 No Modulation Daily duration of load modulation expected depending on the frequency threshold Opportunities of DER …but it is as well: compliant with wide range of DERs characterized by short and limited events simply addressable by DER: Process Challenges of FCR The FCR is… a costly service for the European TSOs: impacted by the conventional assets phasing-out: Tackled by a diminution of the system frequency’s quality : DISTRIBUTED AND COORDINATED DEMAND RESPONSE FOR THE SUPPLY OF FREQUENCY CONTAINMENT RESERVE (FCR) a VPP that coordinates distributed loads modulation for Ancillary Services supply to the Utilities The Magritte Group called in 2014 for immediate measures to safeguard the European Power System infrastructures that could be weakened by the closure of Gigawatts of bulk generation units across Europe. One challenge is to replace these historic suppliers of Frequency Containment Reserves (FCR). The VPP we are developing could so provide a first answer to such power system stability issue by transferring the supply of FCR to distributed loads. VIRTUAL POWER PLANT (VPP), DEMAND RESPONSE (DR), SMART GRID, POWER SYSTEM STABILITY, FREQUENCY CONTAINMENT RESERVE (FCR) KEY WORDS CIRED 2015 poster session – paper n°1037 – session n°4 Gaspard LEBEL Raphaël CAIRE Nouredine HADJSAID Univ. Grenoble Alpes, G2Elab – France Karel KUYPERS TUE Eindhoven – The Netherland Stéphane BEDIOU Alain GLATIGNY Schneider Electric – France Evolution of frequency deviation in the Northern Europe Synchronous Area over the 15 last years (source: ENTSO-E) Project Chronology Milano Airport GreEn-ER Building Sept 2015 Sept 2016 Sept 2014 Jan 2014 June 2015 On-site demonstration Algorithm developments Kick-off Pre-industrial coord. platform development In-lab tests [email protected] gaspard-lebel @gaspardlebel Evolution of the French conventional thermal plant capacity (excluding nuclear) (source: RTE 2014) Estimated FCR Gross Product CE 400M€/year GB 88M€/year IRE 2.4M€/year NE 200M€/year Tot Europe 700M€/year FCR in Europe: 5.36GW+ / 5.1GW- 300MW 600MW+/ 350MW- 1600MW 3000MW 49.85 49.9 49.95 50 50.05 50.1 50.15 Max duration (in min) 0 1 2 3 4 5 * statistical maximum lengh for 95% of the events Maximum* duration of load modulation events depending on the frequency threshold (in min) Frequency Threshold (in Hz) 49.85 49.9 49.95 50 50.05 50.1 50.15 Mean duration (in s) 0 10 20 30 40 50 Mean duration of load modulation events depending on the frequency threshold (in s) 1 3 2 4

Cired 2015 poster1037: DISTRIBUTED AND COORDINATED DEMAND RESPONSE FOR THE SUPPLY OF FREQUENCY CONTAINMENT RESERVE (FCR)

Embed Size (px)

Citation preview

• Deploy DER controllers which embed a sub-meter and frequency-controlled relays, withremotelly controllable threshold

• Gather the effective power consumption of eachload

• Build a stairs droop curve that approach theconventional droop curve of bulk generation unitby assigning a specific threshold to each load

• Send down the frequency threshold to each DERcontroller

49.85 49.9 49.95 50 50.05 50.1 50.15

Num

ber

of

even

ts

0

100

200

300

400

500

600

700

800

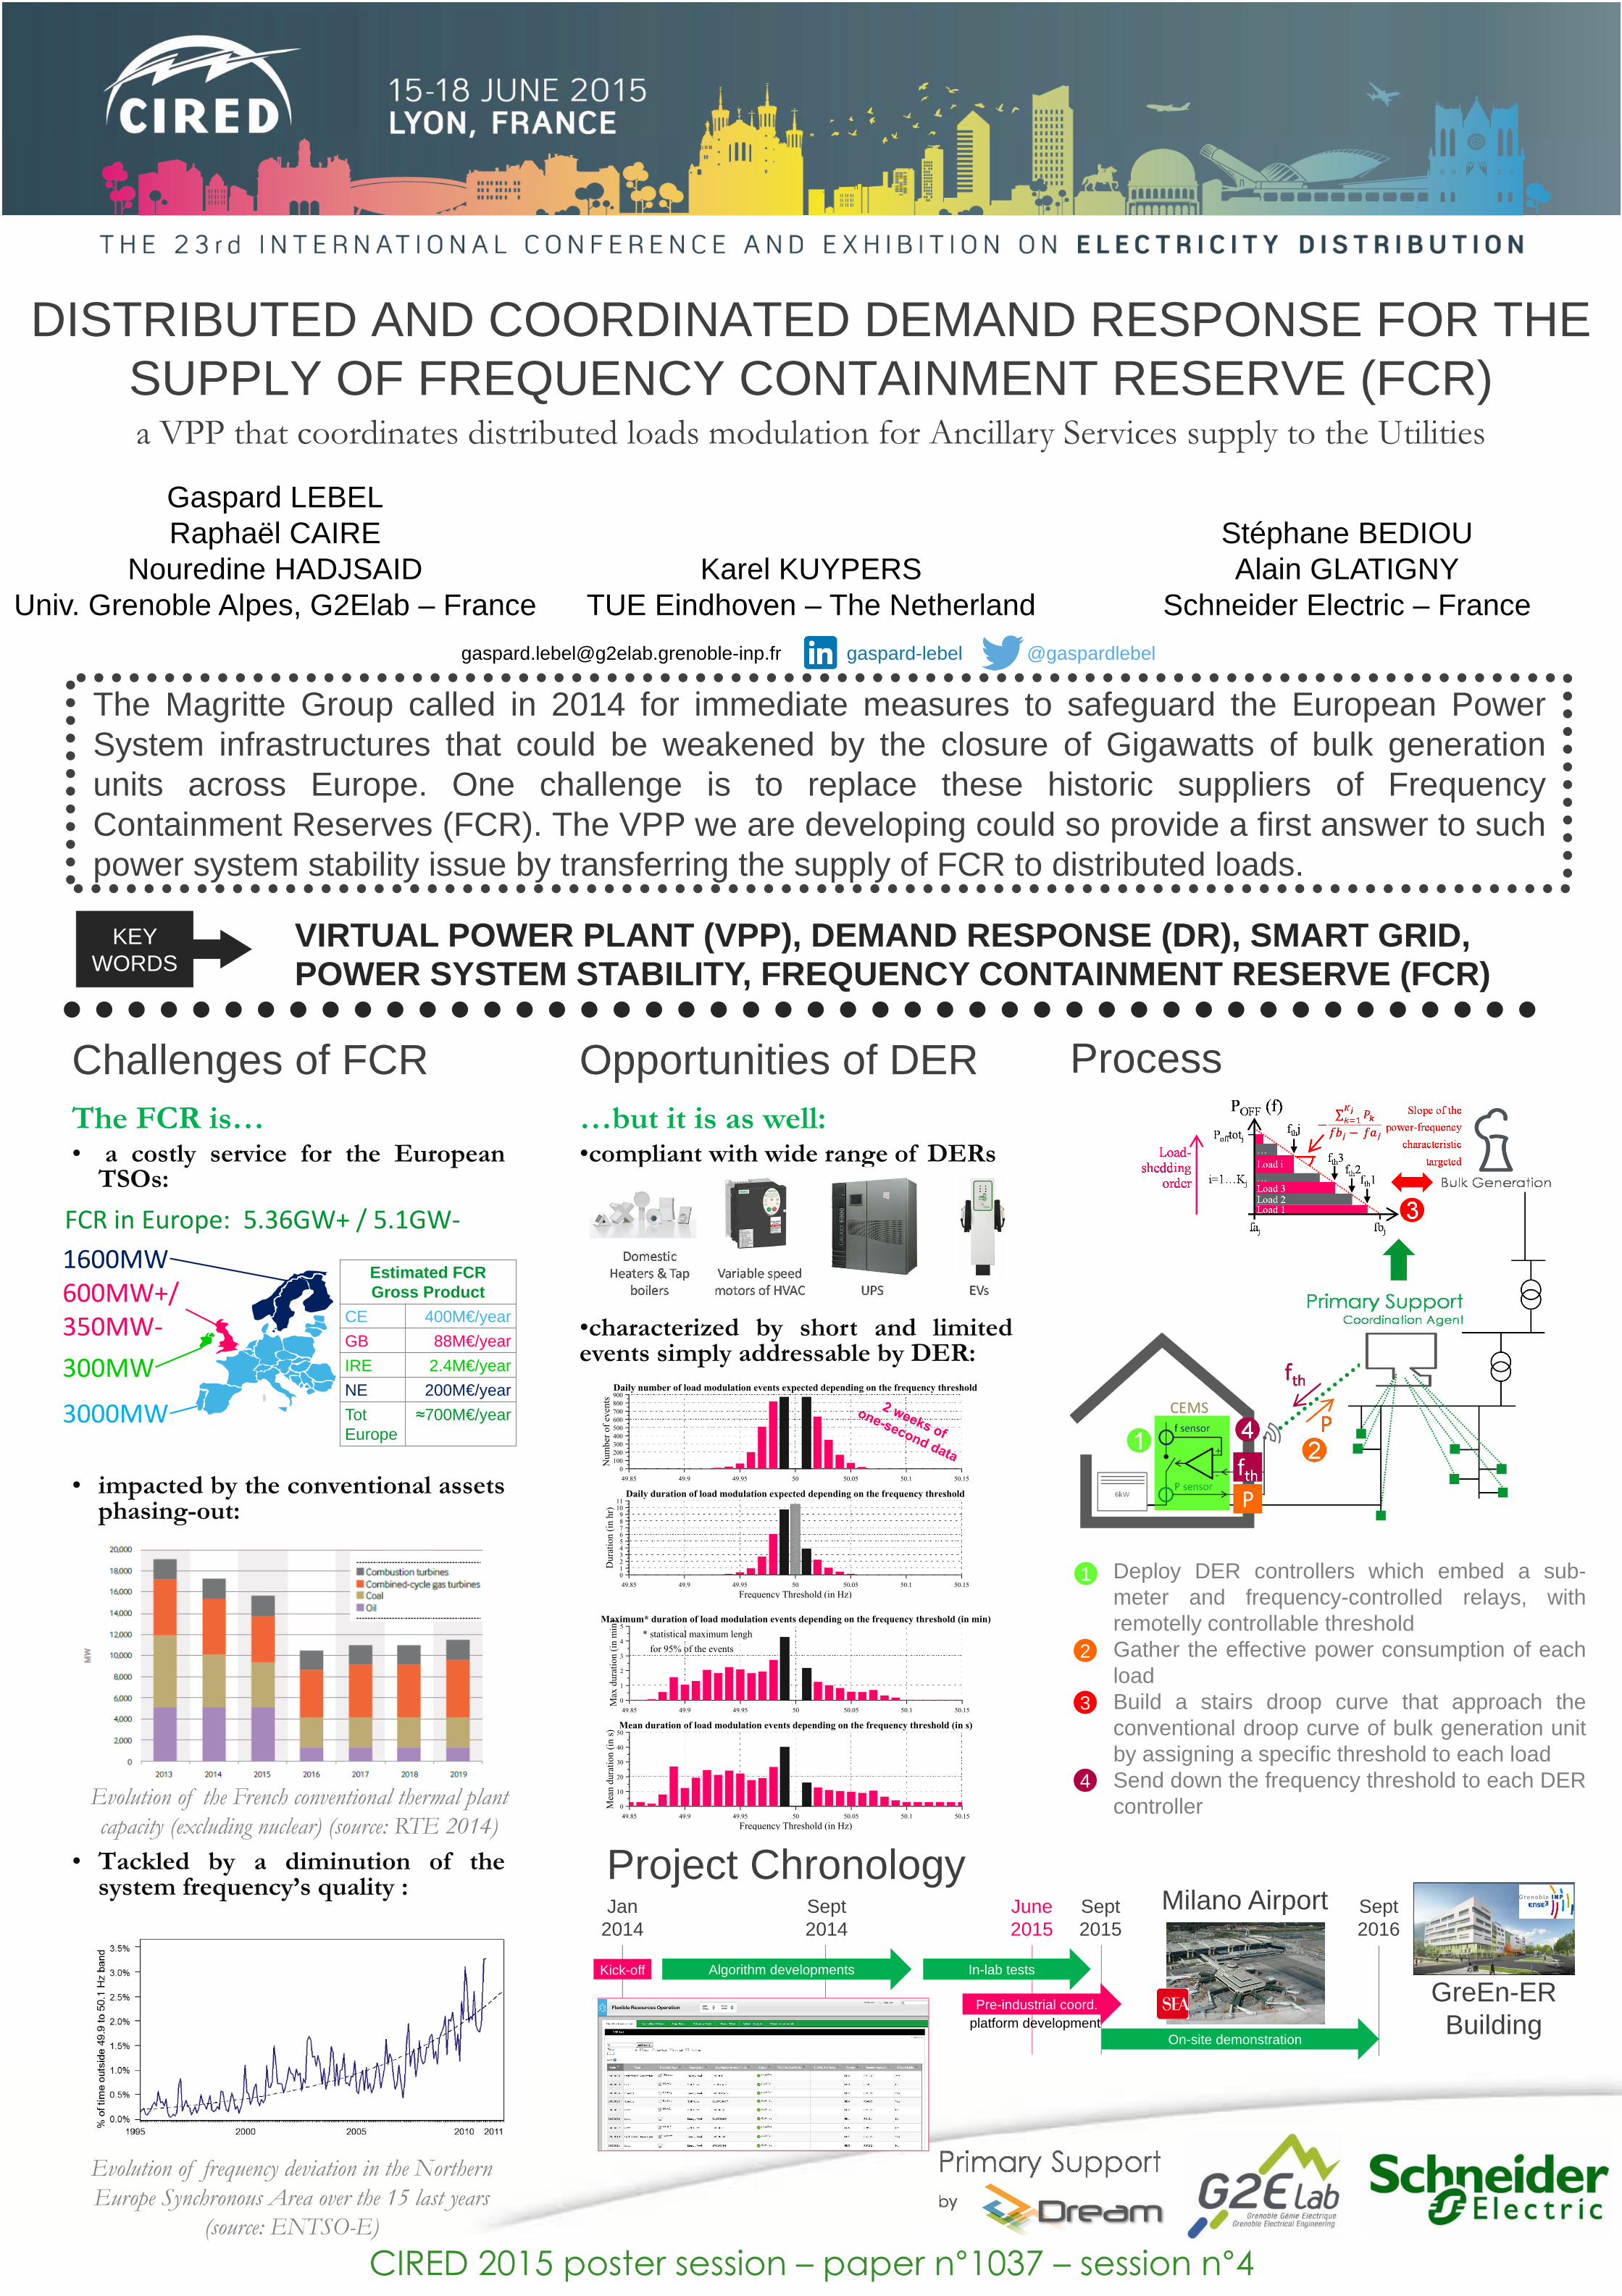
900Daily number of load modulation events expected depending on the frequency threshold

Frequency Threshold (in Hz)49.85 49.9 49.95 50 50.05 50.1 50.15

Dura

tion (

in h

r)

0123456789

1011

No

Mo

du

lati

on

Daily duration of load modulation expected depending on the frequency threshold

Opportunities of DER…but it is as well:•compliant with wide range of DERs

•characterized by short and limitedevents simply addressable by DER:

Process Challenges of FCRThe FCR is…• a costly service for the EuropeanTSOs:

• impacted by the conventional assetsphasing-out:

• Tackled by a diminution of thesystem frequency’s quality :

DISTRIBUTED AND COORDINATED DEMAND RESPONSE FOR THE SUPPLY OF FREQUENCY CONTAINMENT RESERVE (FCR)a VPP that coordinates distributed loads modulation for Ancillary Services supply to the Utilities

The Magritte Group called in 2014 for immediate measures to safeguard the European PowerSystem infrastructures that could be weakened by the closure of Gigawatts of bulk generationunits across Europe. One challenge is to replace these historic suppliers of FrequencyContainment Reserves (FCR). The VPP we are developing could so provide a first answer to suchpower system stability issue by transferring the supply of FCR to distributed loads.

VIRTUAL POWER PLANT (VPP), DEMAND RESPONSE (DR), SMART GRID, POWER SYSTEM STABILITY, FREQUENCY CONTAINMENT RESERVE (FCR)

KEY WORDS

CIRED 2015 poster session – paper n°1037 – session n°4

Gaspard LEBELRaphaël CAIRE

Nouredine HADJSAIDUniv. Grenoble Alpes, G2Elab – France

Karel KUYPERSTUE Eindhoven – The Netherland

Stéphane BEDIOUAlain GLATIGNY

Schneider Electric – France

Evolution of frequency deviation in the Northern

Europe Synchronous Area over the 15 last years

(source: ENTSO-E)

Project ChronologyMilano Airport

GreEn-ER Building

Sept 2015

Sept 2016

Sept 2014

Jan 2014

June 2015

On-site demonstration

Algorithm developmentsKick-off

Pre-industrial coord.platform development

In-lab tests

[email protected] gaspard-lebel @gaspardlebel

Evolution of the French conventional thermal plant

capacity (excluding nuclear) (source: RTE 2014)

Estimated FCR Gross Product

CE 400M€/year

GB 88M€/year

IRE 2.4M€/year

NE 200M€/year

TotEurope

≈700M€/year

FCR in Europe: 5.36GW+ / 5.1GW-

300MW

600MW+/

350MW-

1600MW

3000MW

49.85 49.9 49.95 50 50.05 50.1 50.15

Max

dura

tion (

in m

in)

0

1

2

3

4

5

* statistical maximum lengh

for 95% of the events

Maximum* duration of load modulation events depending on the frequency threshold (in min)

Frequency Threshold (in Hz)49.85 49.9 49.95 50 50.05 50.1 50.15

Mea

n d

ura

tion (

in s

)

0

10

20

30

40

50Mean duration of load modulation events depending on the frequency threshold (in s)

1

3

2

4