Embed Size (px)
Citation preview
IJRET: International Journal of Research in Engineering and Technology eISSN: 2319-1163 | pISSN: 2321-7308
_______________________________________________________________________________________
Volume: 04 Issue: 06 | June-2015, Available @ http://www.ijret.org 210
CHEBYSHEV FILTER APPLIED TO AN INVERSION TECHNIQUE
FOR BREAST TUMOUR DETECTION
Marta A P Elizabeth1, Kismet Anak Hong Ping
2, Nordiana Binti Rajaee
3, Toshifumi Moriyama
4
1PG Student, Department of Electrical and Electronic Engineering, Faculty of Engineering, Universiti Malaysia
Sarawak,Jalan Datuk Mohd Musa, 94300 Kota Samarahan, Sarawak,MALAYSIA 2-3
Senior Lecturer, Department of Electrical and Electronic Engineering, Faculty of Engineering, Universiti Malaysia Sarawak, Jalan Datuk Mohd Musa, 94300 Kota Samarahan, Sarawak, MALAYSIA
4Associate Professor, Department of Electrical and Electronic Engineering, Faculty of Engineering, Nagasaki
University,1-14 Bunkyo-machi, Nagasaki 852-8521, JAPAN
Abstract Microwave imaging has been extensively studied in the past several years as a new technique for early stage breast cancer
detection. The rationale of microwave imaging for breast tumour detection is significant contrast in the dielectric properties of
normal tissue and malignant tumours. However, in practice noise present from the environments during screening/examination degrades the quality of the image. Inaccurate reconstructed image caused false/misleading interpretation of the image which
leads to inappropriate diagnose or treatment to the patient. In the simulation works, noise is added to imitate the actual
environment scenario. The two-dimensional (2D) object that identical to breast model is developed using numerical simulation to
imitate the breast model. A filter is integrated with an iterative inversion technique for breast tumour detection to eliminate the
noise. To assess the effectiveness of this approach, we consider the reconstruction of the electrical parameter profiles of 2D
objects from measurements of the transient total electromagnetic field data contaminated with noise. Additive white Gaussian
noise is utilized to mimic the effect of random processes that occur in the nature. This paper presents the filter settings and
characteristics that affect the reconstruction of the image in order to obtain the most reliable and closer to the actual image.
Selection of filter settings or design is important in order to achieve desired signal, most accurate image and provide reliable
information of the object. Chebyshev low pass filter is applied in the Forward-Backward Time-Stepping (FBTS) algorithm to filter
the noisy data and to improve the quality of reconstructed image.
Keywords: Chebyshev low pass filter, microwave imaging and breast tumour detection
--------------------------------------------------------------------***----------------------------------------------------------------------
1. INTRODUCTION
Breast cancer is the most cause of death among women. In
2014, an estimated 40,430 breast cancer deaths (40,000
women, 430 men), an estimated 232,670 new cases of
invasive breast cancer were expected to be diagnosed, along
with 62,570 new cases of non-invasive breast cancer (also known as carcinoma in situ) [1]. X-ray mammography [2],
ultrasounds [3], combined [4] and in uncertain cases, with
percutaneous (access the tissue by using needle-puncture)
biopsy are the existing methods in detecting and screening
breast cancer. As reported in [5], the limitations have inspire
the researchers to develop another alternative detection
method which is relatively safe, inexpensive imaging
modality, and has ability to provide reliable and informative
results. The main preventative strategy is focusing on the
early detection and to improve the survival rates.
The last decade had shown significant increase involving microwave based system as reported in [6-10]. Microwave
imaging is a technology which has potential application in
diagnostic medical field. Microwave screening for breast
cancer detection methods have been found to be more
comfortable to the patient, low cost of scanning system and
safe [11]. The ability to provide high contrast in dielectric
properties of normal breast tissues and tumours have
resulted in exploration of technique such as electrical
microwave imaging via space-time (MIST) beamforming
[12, 13], microwave tomography [10, 14] and radar based
breast imaging [15-17].
At present, researchers are intriguing in designing and
testing the efficiency of imaging system. The inversion
method utilizing in time domain for reconstructing the
electrical properties has been tremendously developed and
improved [18-22]. The inverse scattering technique in
electromagnetic has been investigated in various fields such
as medical imaging [11], non-destructive evaluation [23-25],
target identification [24-26] and geographical exploration
[27].
Parallel computing [28] and random boundaries [29] have
been applied to increase the efficiency of forward-backward
time-stepping (FBTS) reconstruction method as the solution
methods to overcome space limitation problem and to
reduce the computation time.
In previous work in [30] had shown the capability of filtered
FBTS applied for cancer breast detection with high contrast
between fat and fibroglandular tissue, and low contrast
between fibroglandular and tumour tissues. Noise degrades
IJRET: International Journal of Research in Engineering and Technology eISSN: 2319-1163 | pISSN: 2321-7308
_______________________________________________________________________________________
Volume: 04 Issue: 06 | June-2015, Available @ http://www.ijret.org 211
the reconstructed image. In order to reduce the effect of
noise, measured field data are filtered using low pass filter.
In [8, 31], a new filtered FBTS algorithm has been
developed to improve the quality of the image. Research
works in [8, 30, 31] utilizing low pass filter in measured
data have been done, which focusing on Chebyshev 4th order and frequency hopping technique to improve the quality of
the reconstructed image.
In this research work, more aspects on Chebyshev filter in
terms of characteristics, abilities and stability with the
present of noise is observed. A number of numerical
simulations with filtered FBTS algorithm at different order
of Chebyshev at certain range of cut-off frequencies to be
assessed in order to find reconstructed image closer to the
actual image with minimum loss of higher frequency
component of noise free data. The quality of image to be improved by utilizing filtered FBTS algorithm with parallel
computing method to reduce computational time. The two-
dimensional object that identical to breast model is
developed using numerical simulation to imitate the breast
model in which dielectric properties of the breast tissue is
adopted.
2. METHODS
2.1 FBTS Algorithm
We consider inverse scattering problem where the electrical
property distributions within a target object are estimated
from scattering time domain data. This approach has
potential to reconstruct the dielectric parameters more
accurately and contains more quantitative information
compared to single-frequency data. The finite-difference time-domain (FDTD) is conveniently utilized to reconstruct
the two-dimensional image. The object is surrounded by
sixteen antennas as illustrated in Figure 1. Each antenna
takes turn to transmit a microwave pulse while the rest of
antennas collect scattered signals until a set of
transmitter/receiver data for multiple antenna combination is
obtained. Then, this measured dataset is compared to an
equivalent simulation in which the same set of scattering
data is computed for an assumed set of dielectric parameters
s representing the electrical properties profile of the breast
tissue.
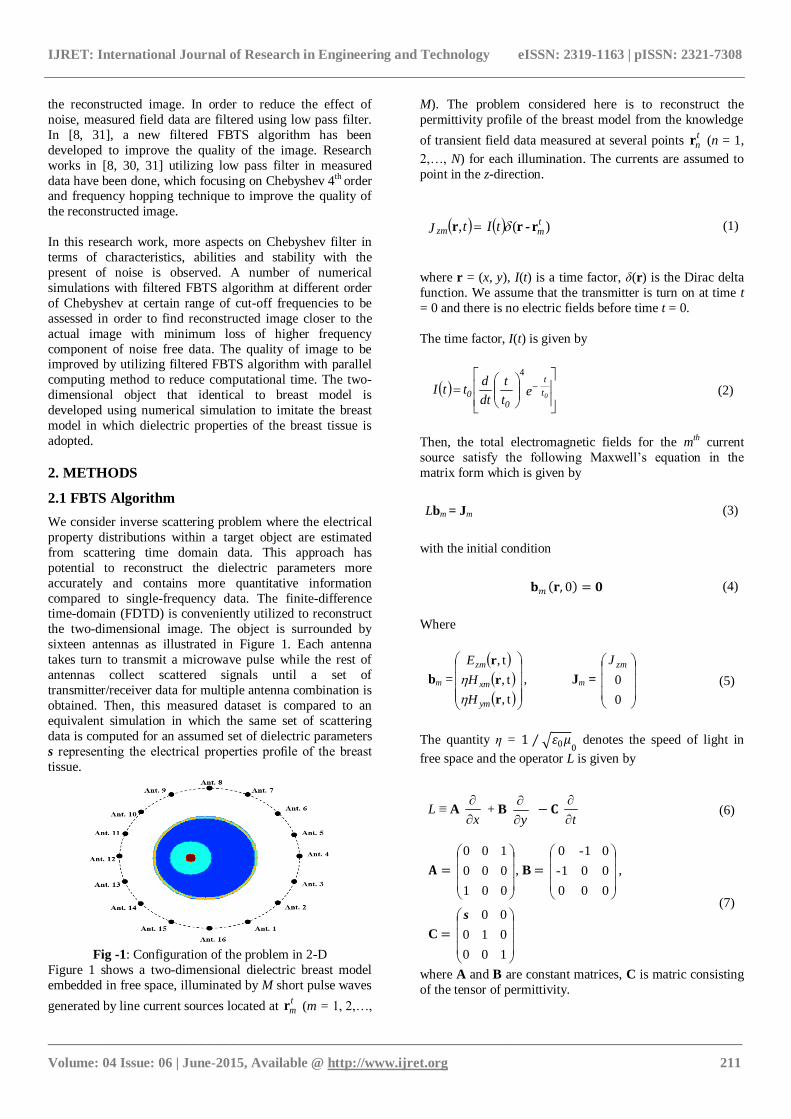
Fig -1: Configuration of the problem in 2-D
Figure 1 shows a two-dimensional dielectric breast model
embedded in free space, illuminated by M short pulse waves
generated by line current sources located at tmr (m = 1, 2,…,
M). The problem considered here is to reconstruct the
permittivity profile of the breast model from the knowledge
of transient field data measured at several points tnr (n = 1,
2,…, N) for each illumination. The currents are assumed to
point in the z-direction.
tJ zm ,r - )( tmtI rr (1)
where r = (x, y), I(t) is a time factor, δ(r) is the Dirac delta
function. We assume that the transmitter is turn on at time t
= 0 and there is no electric fields before time t = 0.
The time factor, I(t) is given by
e
t
t
dt
dttI
0t
t
00
4
(2)
Then, the total electromagnetic fields for the mth current
source satisfy the following Maxwell’s equation in the
matrix form which is given by
Lbm = Jm (3)
with the initial condition
𝐛𝑚 𝐫, 0 = 𝟎 (4)
Where
bm =
t,
t,
t,
r
r
r
ym
xm
zm
H
H
E
, Jm =
0
0
zmJ
(5)
The quantity η = 1 ⁄ 𝜀0𝜇0 denotes the speed of light in
free space and the operator L is given by
L ≡ A x
+ B
y
− 𝐂
t
(6)
𝐀 =
001
000
100
, B =
000
001-
01-0
,
C =
100
010
00s
(7)
where A and B are constant matrices, C is matric consisting
of the tensor of permittivity.
IJRET: International Journal of Research in Engineering and Technology eISSN: 2319-1163 | pISSN: 2321-7308
_______________________________________________________________________________________
Volume: 04 Issue: 06 | June-2015, Available @ http://www.ijret.org 212
In this approach, the computed scattered signal dataset is
calculated in time domain by utilizing FDTD technique to
reconstruct the image. The cost functional Q(s) for the
assumed set of dielectric parameters s is expressed as
T M
m
N
n
nmnmmn dttttWQ0
1 1
2,
~,; s s rbrb (8)
where tnm ,~
rb and tnm ,;rb s are the measured
electromagnetic fields in the time domain at the receiver
point rn due to transmitter m and the corresponding
calculated electromagnetic fields for an assumed set of
dielectric parameters s, respectively. The set of parameters s
consists of the relative permittivity εr and the conductivity ζ.
Wmn(t) is a non-negative weighting function which takes a
value of zero at time t = T, where T is a time duration of the
measurement.
When a gradient-based optimization method is applied to minimization of the cost functional in Eq. (8), the gradient
of the functional is necessary. By taking the Fréchet
derivative of Eq. (8), the gradients with respect to εr and ζ
are derived as
T M
m
mmrdtt
dt
dt g
01
s su ,;,; rbrr (9)
T M
m
mm dttt g0
1
s su ,;,; rbrr (10)
where the electromagnetic fields tm ,;rb s and the adjoint
fields um (s;r,t) calculated in the reconstruction region. The adjoint fields um (s;r,t) are time reversed fields with
equivalent current sources which are identical to a
difference between the measured and calculated scattered
field data. In this paper, we used Polak-Ribiète-Polyak
conjugate gradient method for optimization technique to
solve the inverse scattering problem.
2.2 Filtered FBTS Algorithm
In practice, measured data is usually contaminated with
noise and each time of assessment the noise could be
different. Additive white Gaussian noise is added in the
measured field data. The noise normally has higher
frequency spectrum compared to spectrum of the field data due to decorrelatedness of noise. The signal-to-noise ratio
(SNR) is defined as follows:
SNR = 10 log10
M
m
N
n
Ttnm
M
m
N
n
Ttnm'
dtt
dtt,
1 1
2
'
1 1
2
),(
)(~
0
0
r
rb
(11)
where ),('
ttnm
r is noise added to the measured
electromagnetic fields at )(~
t,tnm' rb .
To eliminate the noise effects, noisy data is filtered with a
Chebyshev low pass filter which the amplitude response is
expressed by
22 )]([1
1
fTf H
k (12)
where is the ripple factor, f =0c
0
f
f, 𝑓𝑐𝑜 is cut-off
frequency, fc is the center frequency. fTk is the kth order
Chebyshev polynomial which is given by
1coshcosh
1cos cos
1
1
0c
0
0c
0
0c
0
0c
0
k
f
f
f
f k
f
f
f
f k
fT
(13)
The general expression for the transfer function of kth order
of Chebyshev low pass filter is given by
ki k21
H
ki i
H
xxxxxx
xxxH
1
1
...
)(
0
0
(14)
Where
ki i
r
ki i
0
k x
k xH
120
1
even 10
odd (15)
To compute the pole values (x1, x2, x3,…) of kth order
Chebyshev low pass filter
iii jx (16)
k
isin
γγ
i2
12
2
1
(17)
k
icos
γγ
i2
12
2
1
(18)
IJRET: International Journal of Research in Engineering and Technology eISSN: 2319-1163 | pISSN: 2321-7308
_______________________________________________________________________________________
Volume: 04 Issue: 06 | June-2015, Available @ http://www.ijret.org 213
k
γ
1
211
(19)
To determine the ripple factor , Eq. (20) is used.
110102
r
(20)
where r is the ripple size in dB.
Table - 1: Chebyshev Polynomials
kth order of
Chebyshev Factors of the Denominator
1 (x + 1.00238)
2 (x2 + 0.64490x + 0.70795)
3 (x + 0.29862)(x2 + 0.29862x + 0.83917)
4 (x2 + 0.17034x + 0.90309)(x2 + 0.41124x +
0.19598)
5 (x + 0.17753)(x2 + 0.10970x + 0.93603)(x2 +
0.28725x + 0.37701)
Table 1 shows the factors of the denominator polynomials
normalized Chebyshev low pass filter. In order to assess the
functionality of the filter, the calculated fields also to be
passed through the same procedure which has the same low
pass filter characteristic. High frequency noise effects can be
reduced by filtering with low pass filter. The measured field
data are first low pass filtered and the FBTS algorithm is
applied to the filtered data. Then, the filtered version of cost functional in Eq. (8) yields:
T
0
M
m
N
n
rm
rmmn dttttWs Q
nn
1 1
s 2
,~
,; rBrB (21)
2.3 Parallel Computing
The FBTS algorithm is implemented in C++ language
executed in parallel computing. Parallel computing can be
divided into two types, shared memory and distributed
memory. Shared memory is performed by a computer with a
number of processor and shared the memory while
distributed memory is performed by a number of computers
which each computer has its own processor with own memory. The transmission and reception of the data
between the computers are made via interconnection
network. In this simulation works, distributed memory
parallel computing is used by utilizing a cluster of 8
computers to minimize the calculation time.
The cost functional, QP for parallel filtered FBTS is
expressed by
dttttW rnm
rnm
C
c
T
0
M
m
N
nnmP
2
''1
'
1 1' ,;
~,; s s sQ rBrB
(22)
where C is the number of computers, M’ is the number of
transmitter points assigned to a computer. Therefore, the
number of M in Eq. (8) is related to the number of M’ and C in Eq. (22). M is the total number of transmitter points
which is expressed M = C × M’.
The gradient vector, GP (r) can be rewritten as
C
c
T
0
M'
m'
3
n
rnm'm'εP td t
t t,;uG
r
1 1 1
,;)(
2 sbs rr (23)
C
c
T
0
M'
m'
3
n
rnm'm'σP td t t,;u
1 1 1
,;2G sbs rr (24)
3. RESULTS AND DISCUSSION
In this research work, we used a Chebyshev low pass filter
of k = 2, 3, 4 and 5, with cut-off frequency of 1.5GHz and
ripple size of 3dB. The model was resized to a resolution of
1mm × 1mm. Fixed skin layer of 2mm thickness was added
in the model. The grid size for the FDTD was 1mm × 1mm. The excitation signal sinusoidally modulated Gaussian pulse
with a center frequency, fc = 2GHz and bandwidth of
1.3GHz are used in the FBTS reconstruction algorithm. The
optimization was carried out up to 30 iterations utilizing 16
antennas to reconstruct the image.
The size of the tumour embedded in the fibroglandular
tissue of breast model is 10mm in diameter. The initial guess
for ɛr and ζ values in the entire reconstruction region
(including fat, fibroglandular and skin tissues) are 13.7 and
0.10, respectively. Nominal Debye parameters for the breast tissues used in this paper are summarized in Table 2.
Table -2: Electrical properties of breast tissues
Tissue s s r
(2GHz)
(2GHz)
Fibrograndular 21.57 6.14 0.31 7.0e-12 21.45 0.46
Fat 10.00 7.00 0.15 7.0e-12 9.98 0.18
Skin 37.00 4.00 1.10 7.2e-12 36.73 1.40
Tumour 54.00 4.00 0.70 7.0e-12 53.62 1.19
The foundation of this approach is formulated utilizing
Debye equation. The Debye equation can be expressed as
0
ss j
j
1
* (25)
IJRET: International Journal of Research in Engineering and Technology eISSN: 2319-1163 | pISSN: 2321-7308
_______________________________________________________________________________________
Volume: 04 Issue: 06 | June-2015, Available @ http://www.ijret.org 214
where is the relative permittivity at infinite frequency,
s is the static relative permittivity, is the relaxation time,
and s is the static conductivity.
(a)
(b)
(c)
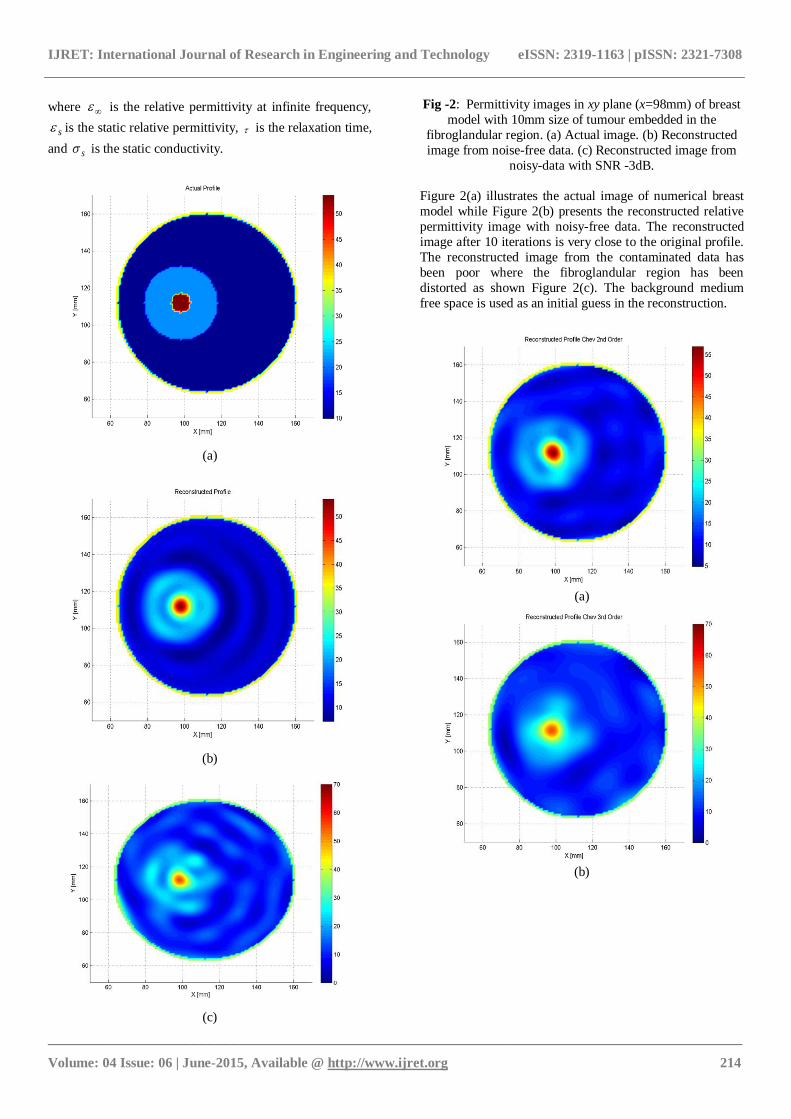
Fig -2: Permittivity images in xy plane (x=98mm) of breast
model with 10mm size of tumour embedded in the
fibroglandular region. (a) Actual image. (b) Reconstructed
image from noise-free data. (c) Reconstructed image from
noisy-data with SNR -3dB.
Figure 2(a) illustrates the actual image of numerical breast
model while Figure 2(b) presents the reconstructed relative
permittivity image with noisy-free data. The reconstructed
image after 10 iterations is very close to the original profile.
The reconstructed image from the contaminated data has
been poor where the fibroglandular region has been
distorted as shown Figure 2(c). The background medium
free space is used as an initial guess in the reconstruction.
(a)
(b)
IJRET: International Journal of Research in Engineering and Technology eISSN: 2319-1163 | pISSN: 2321-7308
_______________________________________________________________________________________
Volume: 04 Issue: 06 | June-2015, Available @ http://www.ijret.org 215
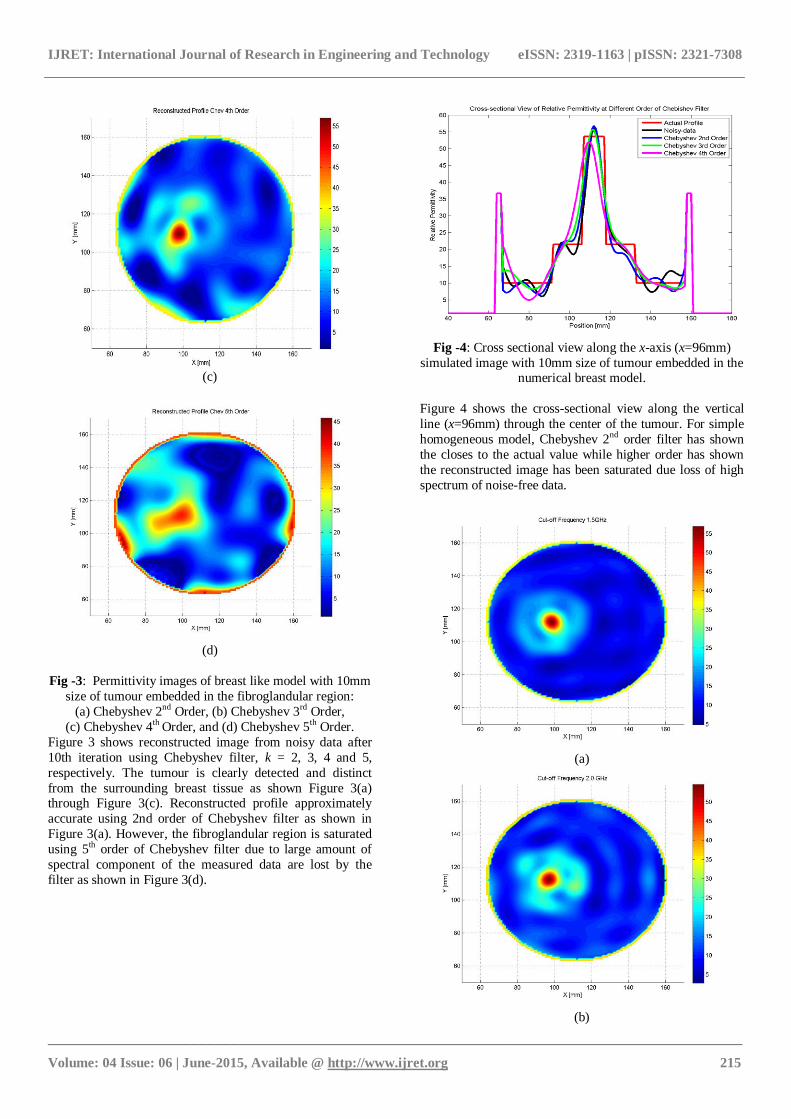
(c)
(d)
Fig -3: Permittivity images of breast like model with 10mm
size of tumour embedded in the fibroglandular region:
(a) Chebyshev 2nd Order, (b) Chebyshev 3rd Order,
(c) Chebyshev 4th Order, and (d) Chebyshev 5th Order.
Figure 3 shows reconstructed image from noisy data after
10th iteration using Chebyshev filter, k = 2, 3, 4 and 5,
respectively. The tumour is clearly detected and distinct
from the surrounding breast tissue as shown Figure 3(a) through Figure 3(c). Reconstructed profile approximately
accurate using 2nd order of Chebyshev filter as shown in
Figure 3(a). However, the fibroglandular region is saturated
using 5th order of Chebyshev filter due to large amount of
spectral component of the measured data are lost by the
filter as shown in Figure 3(d).
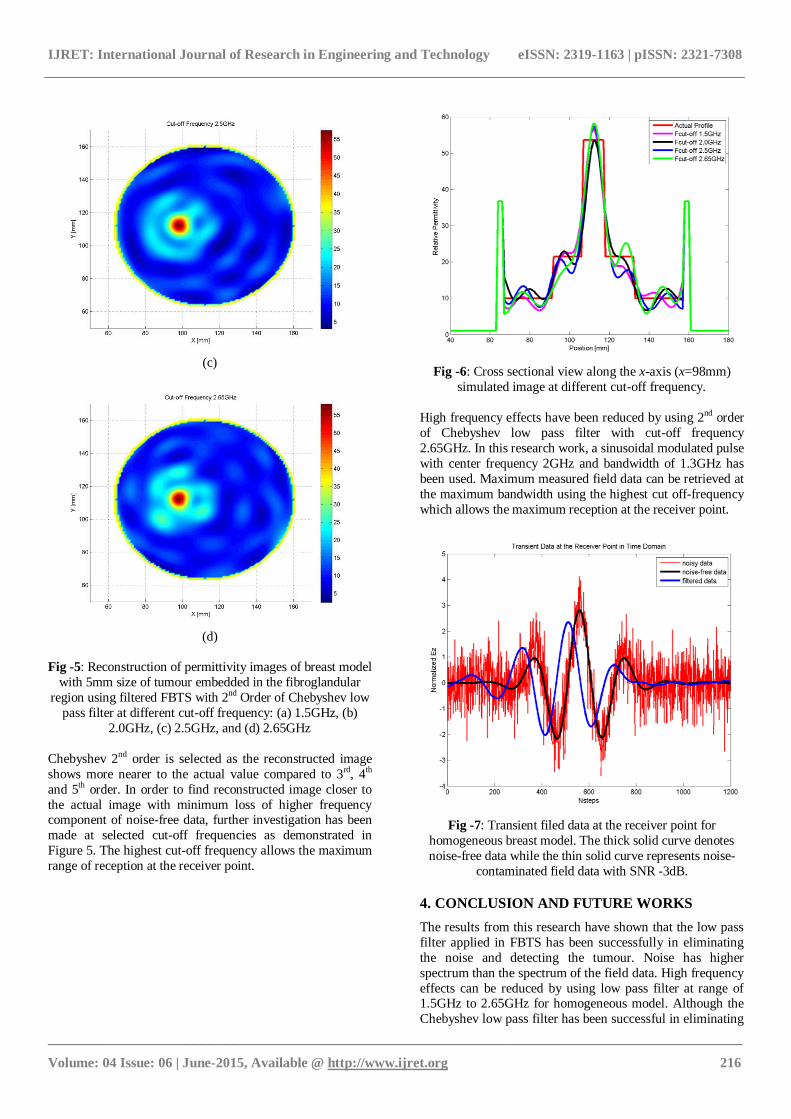
Fig -4: Cross sectional view along the x-axis (x=96mm)
simulated image with 10mm size of tumour embedded in the numerical breast model.
Figure 4 shows the cross-sectional view along the vertical
line (x=96mm) through the center of the tumour. For simple
homogeneous model, Chebyshev 2nd order filter has shown
the closes to the actual value while higher order has shown
the reconstructed image has been saturated due loss of high
spectrum of noise-free data.
(a)
(b)
IJRET: International Journal of Research in Engineering and Technology eISSN: 2319-1163 | pISSN: 2321-7308
_______________________________________________________________________________________
Volume: 04 Issue: 06 | June-2015, Available @ http://www.ijret.org 216
(c)
(d)
Fig -5: Reconstruction of permittivity images of breast model
with 5mm size of tumour embedded in the fibroglandular
region using filtered FBTS with 2nd Order of Chebyshev low
pass filter at different cut-off frequency: (a) 1.5GHz, (b)
2.0GHz, (c) 2.5GHz, and (d) 2.65GHz
Chebyshev 2nd order is selected as the reconstructed image
shows more nearer to the actual value compared to 3rd, 4th
and 5th order. In order to find reconstructed image closer to
the actual image with minimum loss of higher frequency component of noise-free data, further investigation has been
made at selected cut-off frequencies as demonstrated in
Figure 5. The highest cut-off frequency allows the maximum
range of reception at the receiver point.
Fig -6: Cross sectional view along the x-axis (x=98mm)
simulated image at different cut-off frequency.
High frequency effects have been reduced by using 2nd order
of Chebyshev low pass filter with cut-off frequency
2.65GHz. In this research work, a sinusoidal modulated pulse
with center frequency 2GHz and bandwidth of 1.3GHz has
been used. Maximum measured field data can be retrieved at
the maximum bandwidth using the highest cut off-frequency
which allows the maximum reception at the receiver point.
Fig -7: Transient filed data at the receiver point for
homogeneous breast model. The thick solid curve denotes
noise-free data while the thin solid curve represents noise-
contaminated field data with SNR -3dB.
4. CONCLUSION AND FUTURE WORKS
The results from this research have shown that the low pass
filter applied in FBTS has been successfully in eliminating
the noise and detecting the tumour. Noise has higher
spectrum than the spectrum of the field data. High frequency
effects can be reduced by using low pass filter at range of 1.5GHz to 2.65GHz for homogeneous model. Although the
Chebyshev low pass filter has been successful in eliminating
IJRET: International Journal of Research in Engineering and Technology eISSN: 2319-1163 | pISSN: 2321-7308
_______________________________________________________________________________________
Volume: 04 Issue: 06 | June-2015, Available @ http://www.ijret.org 217
the noise, there were large amount of spectral components
of the measured data are lost by using filter. In this simple
homogeneous breast model, the lower order of Chebyshev
polynomial is sufficient enough to filter out the noise. Next
we consider using the band pass filter or combination both
of low pass filter and band pass filter to minimize the loss of higher frequency components of noise-free field data. The
filter settings are adjustable at various order of low pass
filter at selected cut-off frequency in order to obtain the
most reliable and informative results which nearer to the
original profile. Obtaining this relation, we also consider to
investigate the stability and capability of filtered FBTS in
various medium such as corn syrup, saline and sodium meta
silicate (SMS) gel.
ACKNOWLEDGEMENTS
The authors would like to thank to Faculty of Engineering
for assistant in providing facilities used for this project. This
research work was supported by OSAKA GAS FOUNDATION IN CULTURAL EXCHANGE (OGFICE)
Research Grant Scheme. The authors also thank reviewers
for their valuable comments and suggestions.
REFERENCES
[1] "Cancer Fact and Figure". Available:
http://www.cancer.org/acs/groups/content/@research
/documents/webcontent/acspc-042151.pdf,
[Accessed: 2015 March 14].
[2] L. Lihua, W. Zuobao, C. Li, F. George, C. Zhao, A.
Salem, M. Kallergi, and C. Berman, "Breast tissue
density and CAD cancer detection in digital
mammography," presented at the Engineering in Medicine and Biology Society, 2005. IEEE-EMBS
2005. 27th Annual International Conference of the
IEEE Engineering in Medicine and Biology Society,
2005.
[3] M. C. Purdy."Ultrasound Screening Finds More
Breast Cancer, False Positives May Outweigh That
Benefit". [Online]. Available:
http://news.wustl.edu/news/Pages/23668.aspx,
[Accessed: 2014 April 4].
[4] W. A. Berg, J. D. Blume, J. B. Cormack, E. B.
Mendelson, D. Lehrer, M. Böhm-Vélez, E. D. Pisano, R. A. Jong, W. P. Evans, and M. J. Morton,
"Combined screening with ultrasound and
mammography vs mammography alone in women at
elevated risk of breast cancer," Jama, vol. 299, pp.
2151-2163, 2008.
[5] S. V. Sree, E. Y.-K. Ng, R. Acharya U, and W. Tan,
"Breast imaging systems: A review and comparative
study," Journal of Mechanics in Medicine and
Biology, vol. 10, pp. 5-34, 2010.
[6] X. Li and S. C. Hagness, "A confocal microwave
imaging algorithm for breast cancer detection," Microwave and Wireless Components Letters, IEEE,
vol. 11, pp. 130-132, 2001.
[7] V. Zhurbenko, T. Rubæk, V. Krozer, and P.
Meincke, "Design and realisation of a microwave
three-dimensional imaging system with application to
breast-cancer detection," IET Microwaves, Antennas
& Propagation, vol. 4, p. 2200, 2010.
[8] T. Tanaka, N. Kuroki, and T. Takenaka, "Filtered
forward-backward time-stepping method applied to
reconstruction of dielectric cylinders," Journal of Electromagnetic Waves and Applications, vol. 17,
pp. 253-270, 2003/01/01 2003.
[9] M. Lazebnik, D. Popovic, L. McCartney, C. B.
Watkins, M. J. Lindstrom, J. Harter, S. Sewall, T.
Ogilvie, A. Magliocco, T. M. Breslin, W. Temple, D.
Mew, J. H. Booske, M. Okoniewski, and S. C.
Hagness, "A large-scale study of the ultrawideband
microwave dielectric properties of normal, benign
and malignant breast tissues obtained from cancer
surgeries," Physics in Medicine and Biology, vol. 52,
pp. 6093-115, Oct 21 2007. [10] S. Semenov, "Microwave tomography: review of the
progress towards clinical applications,"
Philosophical Transactions of the Royal Society A:
Mathematical, Physical and Engineering Sciences,
vol. 367, pp. 3021-42, Aug 13 2009.
[11] J. E. Johnson, T. Takenaka, K. Hong Ping, S. Honda,
and T. Tanaka, "Advances in the 3-D forward-
backward time-stepping (FBTS) inverse scattering
technique for breast cancer detection," Biomedical
Engineering, IEEE Transactions on, vol. 56, pp.
2232-2243, 2009.
[12] X. Li, S. K. Davis, S. C. Hagness, D. W. Van Der Weide, and B. D. Van Veen, "Microwave Imaging
via Space Time Beamforming : Experimental
Investigation of Tumor Detection in Multilayer
Breast Phantoms," Microwave Theory and
Techniques, IEEE Transactions on Bio-medical
Engineering, vol. 52, pp. 1856-1865, 2004.
[13] E. J. Bond, X. Li, S. C. Hagness, and B. D. Van
Veen, "Microwave Imaging via Space-Time
Beamforming for Early Breast Cancer Detection,"
Antennas and Propagation, IEEE Transactions on
Bio-medical Engineering, vol. 51, pp. 1690-1705, 2003.
[14] A. H. Barrett, P. C. Myers, and N. L. Sadowsky,
"Microwave thermography in the detection of breast
cancer," AJR Am J Roentgenol, vol. 134, pp. 365-8,
Feb 1980.
[15] S. J. A. G. N. Bindu, A. Lonappan, V. Thomas, C. K.
Aanandan, and K. T. Mathew, "Active microwave
imaging for breast cancer detection," Progress In
Electromagnetics Research vol. 58, pp. 149–169,
2006.
[16] S. C. Hagness, A. Taflove, and J. E. Bridges, "Two-
dimensional FDTD analysis of a pulsed microwave confocal system for breast cancer detection: Fixed-
focus and antenna-array sensors," IEEE Transactions
on Biomedical Engineering, vol. 45, pp. 1470-1479,
1998.
[17] E. C. Fear and M. A. Stuchly, "Microwave detection
of breast cancer," IEEE Transactions on Microwave
Theory and Techniques, vol. 48, pp. 1854-1863,
2000.
IJRET: International Journal of Research in Engineering and Technology eISSN: 2319-1163 | pISSN: 2321-7308
_______________________________________________________________________________________
Volume: 04 Issue: 06 | June-2015, Available @ http://www.ijret.org 218
[18] P. Kosmas, "Application of the DORT technique to
FDTD-based time reversal for microwave breast
cancer detection," in Microwave Conference, 2007.
European, 2007, pp. 306-308.
[19] S. Caorsi and G. L. Gragnani, "Inverse-scattering
method for dielectric objects based on the reconstruction of the nonmeasurable equivalent
current density," Radio Science, vol. 34, pp. 1-8,
1999.
[20] T. Takenaka, H. Jia, and T. Tanaka, "Microwave
imaging of electrical property distributions by a
forward-backward time-stepping method," Journal of
Electromagnetic Waves and Applications, vol. 14,
pp. 1609-1626, 2000.
[21] J. Hongting and K. Yasumoto, "Time domain inverse
scattering analysis of stratified lossy media using a
forward-backward time-stepping method," in 2004 3rd International Conference on Computational
Electromagnetics and Its Applications, Proceedings.
ICCEA 2004. , 2004, pp. 415-418.
[22] H. Zhou, T. Takenaka, J. E. Johnson, and T. Tanaka,
"A breast imaging model using microwaves and a
time domain three dimensional reconstruction
method," Progress In Electromagnetics Research,
vol. 93, pp. 57-70, 2009.
[23] S. Caorsi, A. Massa, M. Pastorino, and M. Donelli,
"Improved microwave imaging procedure for
nondestructive evaluations of two-dimensional
structures," IEEE Transactions on Antennas and Propagation, vol. 52, pp. 1386-1397, 2004.
[24] Y. Altuncu, F. Akleman, O. Semerci, and C. Ozlem,
"Imaging of dielectric objects buried under a rough
surface via distorted born iterative method," Journal
of Physics: Conference Series, vol. 135, p. 012006,
2008.
[25] M. Pastorino, A. Salvade, R. Monleone, T.
Bartesaghi, G. Bozza, and A. Randazzo, "Detection
of defects in wood slabs by using a microwave
imaging technique," in Instrumentation and
Measurement Technology Conference Proceedings, 2007. IMTC 2007. IEEE, 2007, pp. 1-6.
[26] C. Wei, H. Chung-Hsin, L. Chun Jen, and C. Chien-
Ching, "Inverse problem of a buried metallic object,"
in Microwave Conference, European, 2005, p. 4 pp.
[27] T. J. Cui, C. Weng Cho, A. A. Aydiner, and C.
Siyuan, "Inverse scattering of two-dimensional
dielectric objects buried in a lossy earth using the
distorted Born iterative method," IEEE Transactions
on Geoscience and Remote Sensing, vol. 39, pp. 339-
346, 2001.
[28] T. Moriyama, Y. Yamaguchi, K. Hong Ping, T.
Tanaka, and T. Takenaka, "Parallel processing of forward-backward time-stepping method," Progress
In Electromagnetics Research, vol. 4, pp. 695-700,
2008.
[29] H. Zhou and H. Zhang, "Increasing the efficiency of
forward–backward time-stepping reconstruction
method," in Proceedings of Progress In
Electromagnetics Research Symposium, China,
Suzhou, 2011, pp. 878-881.
[30] T. Takenaka, T. Moriyama, K. Hong Ping, and T.
Yamasaki, "Microwave breast imaging by the filtered
forward-backward time-stepping method," in URSI
International Symposium on Electromagnetic Theory
(EMTS), 2010, pp. 946-949.
[31] K. Hayashi, T. Tanaka, T. Takenaka, and H. Zhou, "Filtered forward-backward time-stepping method
applied to borehole radar imaging," in Proc. URSI
Int. Symp. on Electromagnetic Theory, 2004, pp.
804-806.
BIOGRAPHIES
Marta a/p Elizabeth currently PG
student, Department of Electrical and
Electronic Engineering. She received her
B. Eng (Hons) degree in Electronics and
Telecommunication Engineering from
Universiti Malaysia Sarawak, Malaysia.
Kismet Anak Hong Ping received his
PhD in System Science from Nagasaki
University, Japan. MSc in Digital
Communication System from
Loughborough University, UK and B. E
(Hons) in Electronics and
Telecommunication Engineering,
Universiti Malaysia Sarawak, Malaysia.
Nordiana binti Rajaee received her PhD
in DNA Computing from Meiji University, Japan. MSc in
Microelectronic from University of
Newcastle Upon Tyne and B. Eng (Hons)
in Electronic and Information
Engineering from Kyushu Institute of
Technology, UK.
Toshifumi Moriyama received his B.E.,
M.E., and D.E. degrees in Information
Engineering all from Niigata University,
Japan. He currently an Associate
Professor at Nagasaki University, Nagasaki, Japan

![Interpolación - unican.es€¦ · Interpolación de Chebyshev Interpolación de Chebyshev Interpolación de Chebyshev Dada una función f(x) definida en un intervalo [a;b], la mejor](https://img.pdfslide.us/doc/110x75/5ea02ee04f178c0f894b75f7/interpolacin-interpolacin-de-chebyshev-interpolacin-de-chebyshev-interpolacin.jpg)