Embed Size (px)
Citation preview

Chapter 15 – Pinch Technology Heat Exchange Networks
Chemical Process Design
West Virginia University
Copyright - R. Turton and J. Shaeiwitz, 2012 1

Outline • Heat Integration
• Design Procedure for MUMNE – Temperature interval diagram
– Cascade diagram
– Temperature-Enthalpy diagram
– Minimum number of exchangers
– Design above and below pinch
Copyright - R. Turton and J. Shaeiwitz, 2012 2
Heat Integration • Heat exchange networks
• It saves money to match streams rather than pay to heat one and pay to cool another
• You have already done this on ad hoc basis in design projects
Copyright - R. Turton and J. Shaeiwitz, 2012 3
Heat Integration • There is a rigorous methodology
• We will learn MUMNE (Minimum Utility, Minimum Number of Exchangers) method
• Not necessarily (and unlikely to be) economic optimum
Copyright - R. Turton and J. Shaeiwitz, 2012 4
Design Procedure 1. Complete energy balance on all streams to
determine all temperatures, values, and heat flows.
2. Choose minimum approach temperature. Typically, this is between 5°C and 20°C, but any positive number is valid.
3. Complete temperature interval diagram, Each stream is drawn and labeled. The heat flow in each interval is calculated.
Copyright - R. Turton and J. Shaeiwitz, 2012
pmC&
5
Design Procedure 4. Complete the cascade diagram. The energy excess
or deficit is calculated for each interval on the temperature interval diagram.
5. Find the minimum hot and cold utility requirements and identify the pinch temperature.
6. Complete the composite temperature enthalpy diagram. This is a T-Q diagram for the entire process.
Copyright - R. Turton and J. Shaeiwitz, 2012
6
Design Procedure 7. Determine the minimum number of heat
exchangers required above and below the pinch.
8. Design the heat exchanger network.
Copyright - R. Turton and J. Shaeiwitz, 2012
7
Example Problem
Copyright - R. Turton and J. Shaeiwitz, 2012
Stream Tin Tout
kW/°C
Q
kW
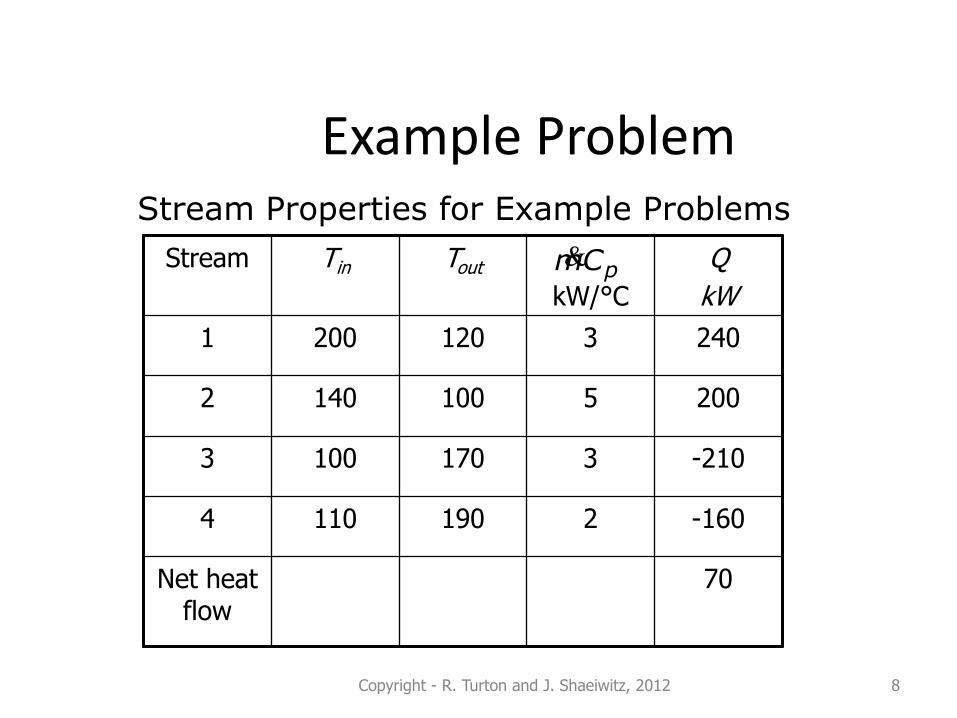
1 200 120 3 240
2 140 100 5 200
3 100 170 3 -210
4 110 190 2 -160
Net heat flow
70
Stream Properties for Example Problems
pCm
8

Example Problem 1. The value of Q might not be given in above table,
or Q is given and is missing. These are calculated from the energy balance. The sign convention is positive for heat available from a stream and negative for heat needed by a stream.
2. Choose the minimum approach temperature. For this problem, it is 10°C.
Copyright - R. Turton and J. Shaeiwitz, 2012
pmC&
9

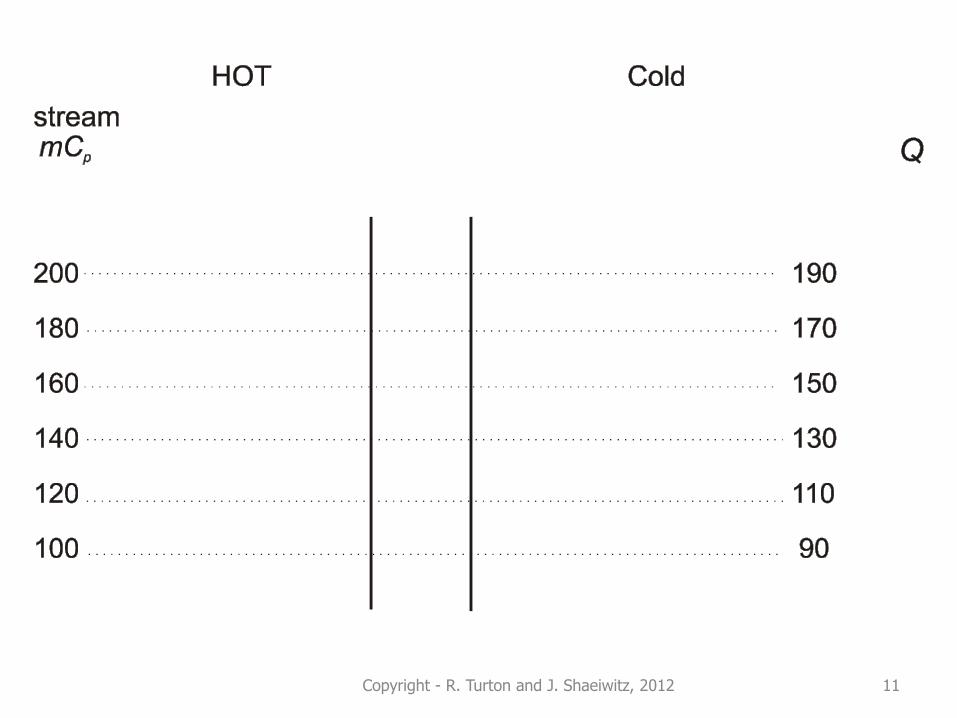
Example Problem 3. Draw and label the temperature interval diagram.
Label the intervals beginning with “A” for the highest temperature interval. The heat flow for each interval is calculated from, , where the sum is over all streams existing in that interval.
Copyright - R. Turton and J. Shaeiwitz, 2012
pQ mC T &
10
Copyright - R. Turton and J. Shaeiwitz, 2012 11

Copyright - R. Turton and J. Shaeiwitz, 2012
12
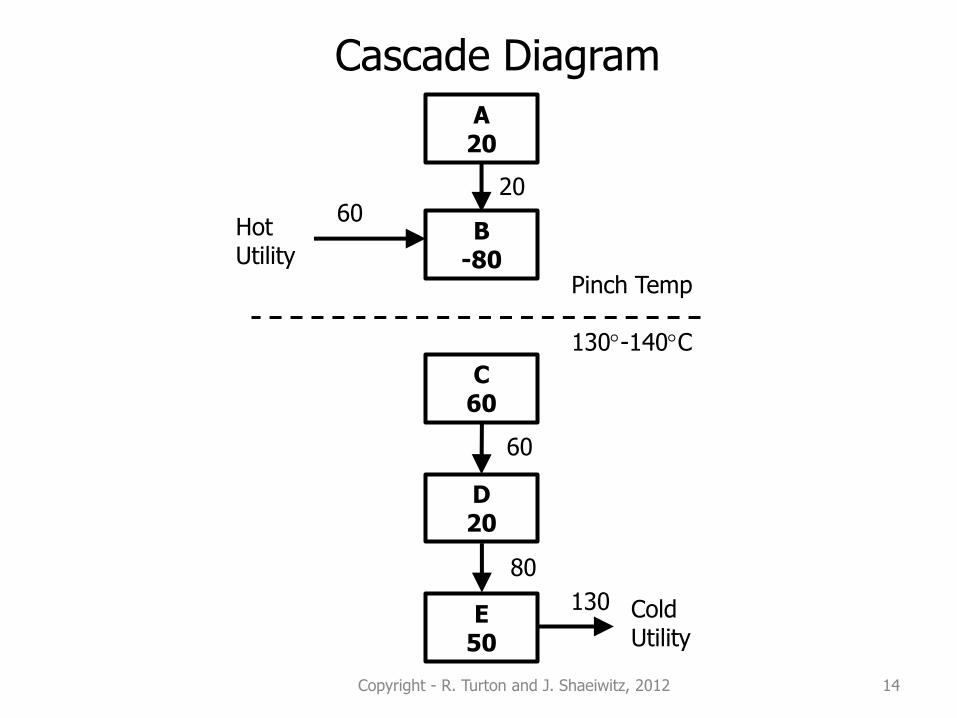
Example Problem 4. Draw the cascade diagram. This represents the
cascade of heat flowing down from high to low temperatures. Add utilities where needed. Label the heat flows. The net utility flow should agree with the net heat flow on the earlier table.
5. On the cascade diagram, there will be a location where the heat-flow cascade is not continuous. This represents the pinch temperature
Copyright - R. Turton and J. Shaeiwitz, 2012 13
Copyright - R. Turton and J. Shaeiwitz, 2012 14
A 20
B -80
C 60
D 20
E 50
Hot Utility
20
60
80
130 Cold Utility
60
Pinch Temp 130-140C
Cascade Diagram

Example Problem 6. Construct the composite temperature enthalpy
diagram. This provides useful information, but it is not required to solve the problem.
Copyright - R. Turton and J. Shaeiwitz, 2012 15

Example Problem
Copyright - R. Turton and J. Shaeiwitz, 2012
interval T (°C)
Q (kW)
T (°C)
Q (kW)
E 100 90
D 110 50 100
C 120 100 110 30
B 140 260 130 130
A 180 380 170 330
200 440 190 370
Hot Cold
16
Example Problem In the table, the temperature shown is at the lower end of the interval. The Q values are obtained by summing all existing on the interval and adding it to the previous interval. The temperature difference is for that interval. The value is the sum of all existing streams on that interval.
Copyright - R. Turton and J. Shaeiwitz, 2012
pmC T&
pmC&
17
Example Problem
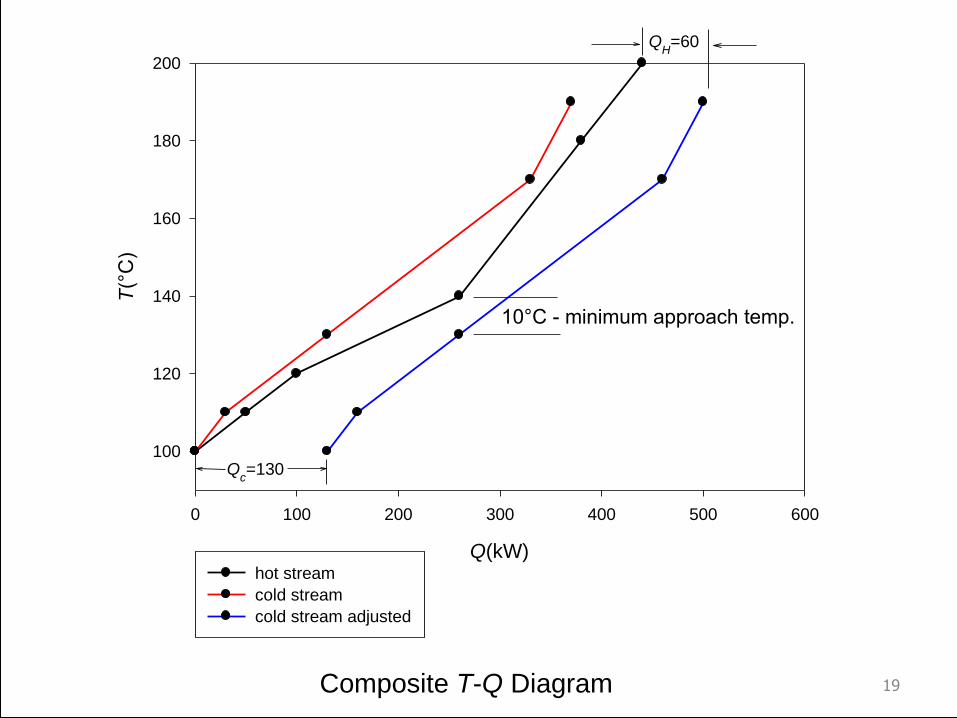
The hot and cold stream lines are plotted, as shown on the following figure. Clearly, there is a temperature cross, so the cold stream line is shifted to the right until the minimum approach temperature of 10°C exists at one point. (It could exist at more than one point by coincidence.) For this problem, all Q values for the cold stream must be increased by 130 kW, as shown in the figure. Note how the hot and cold utility requirements are apparent from the diagram.
Copyright - R. Turton and J. Shaeiwitz, 2012 18
Copyright - R. Turton and J. Shaeiwitz, 2012
Composite T-Q Diagram
Q(kW)
0 100 200 300 400 500 600
T(°
C)
100
120
140
160
180
200
hot stream
cold stream
cold stream adjusted
QH=60
Qc=130
10°C - minimum approach temp.
19
Example Problem
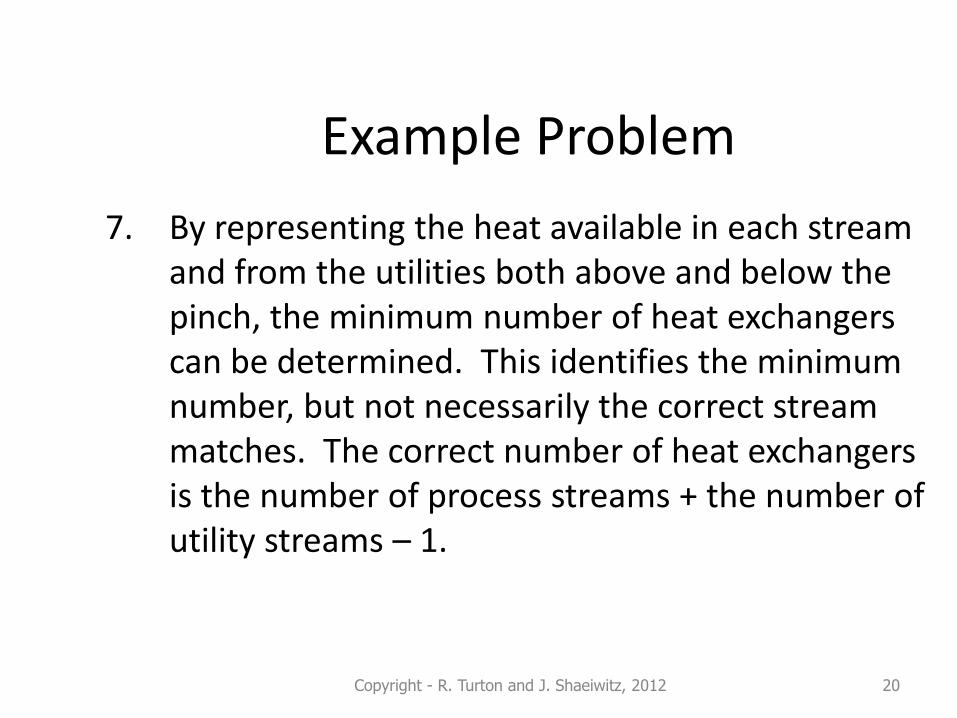
7. By representing the heat available in each stream and from the utilities both above and below the pinch, the minimum number of heat exchangers can be determined. This identifies the minimum number, but not necessarily the correct stream matches. The correct number of heat exchangers is the number of process streams + the number of utility streams – 1.
Copyright - R. Turton and J. Shaeiwitz, 2012 20
Copyright - R. Turton and J. Shaeiwitz, 2012
HU60
CU130
1180
160
2200
3120
390
4120
440
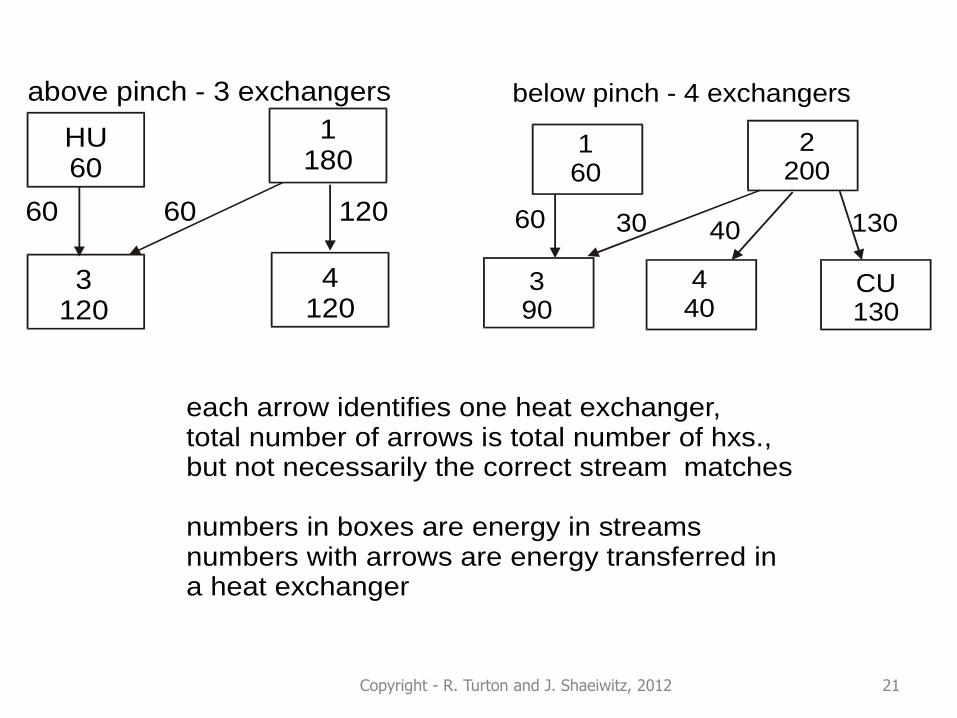
above pinch - 3 exchangers below pinch - 4 exchangers
each arrow identifies one heat exchanger,total number of arrows is total number of hxs.,but not necessarily the correct stream matches
numbers in boxes are energy in streamsnumbers with arrows are energy transferred ina heat exchanger
60 60 120 60 30 40 130
21
Example Problem
7. Note that if a “direct match” is found, i.e., where sets of two streams match heat flows exactly, one fewer exchanger may appear to be possible. However, be careful, the minimum approach temperature may be violated.
Copyright - R. Turton and J. Shaeiwitz, 2012 22
Example Problem
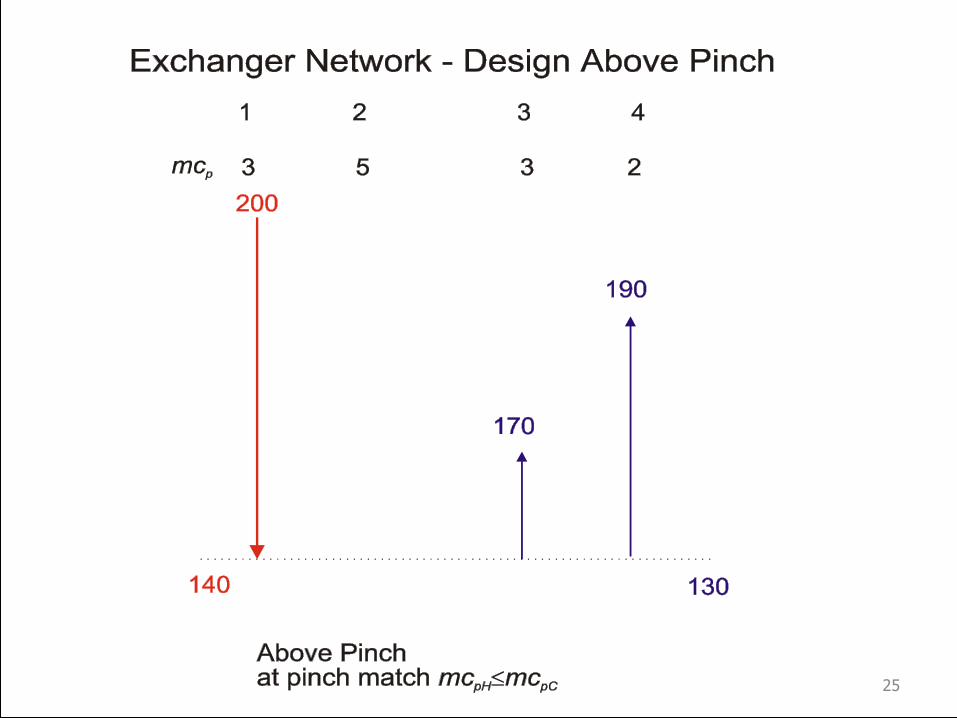
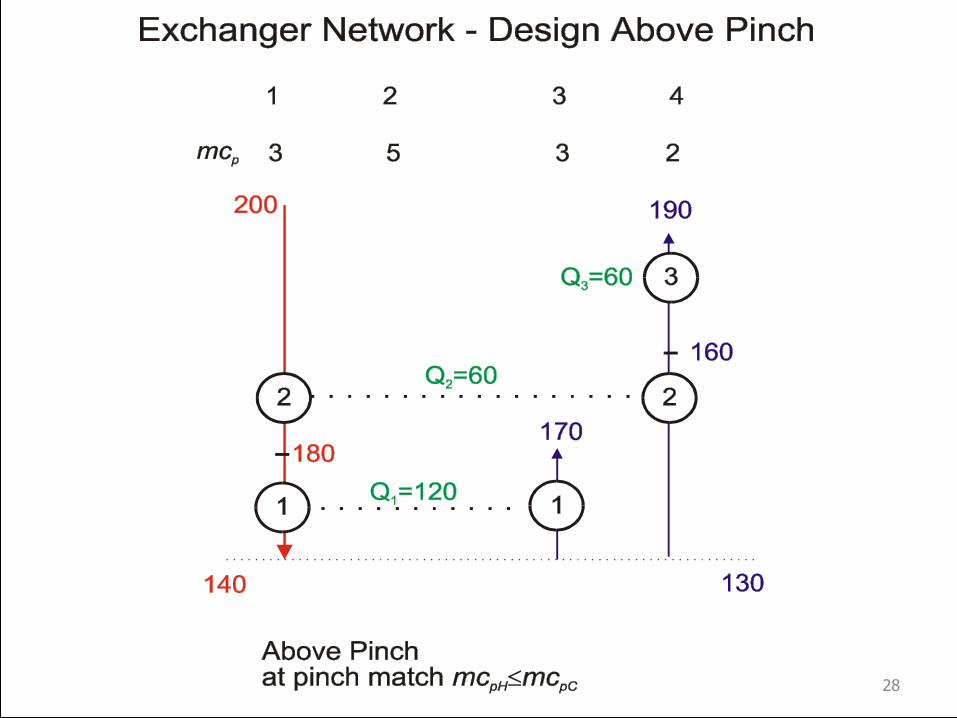
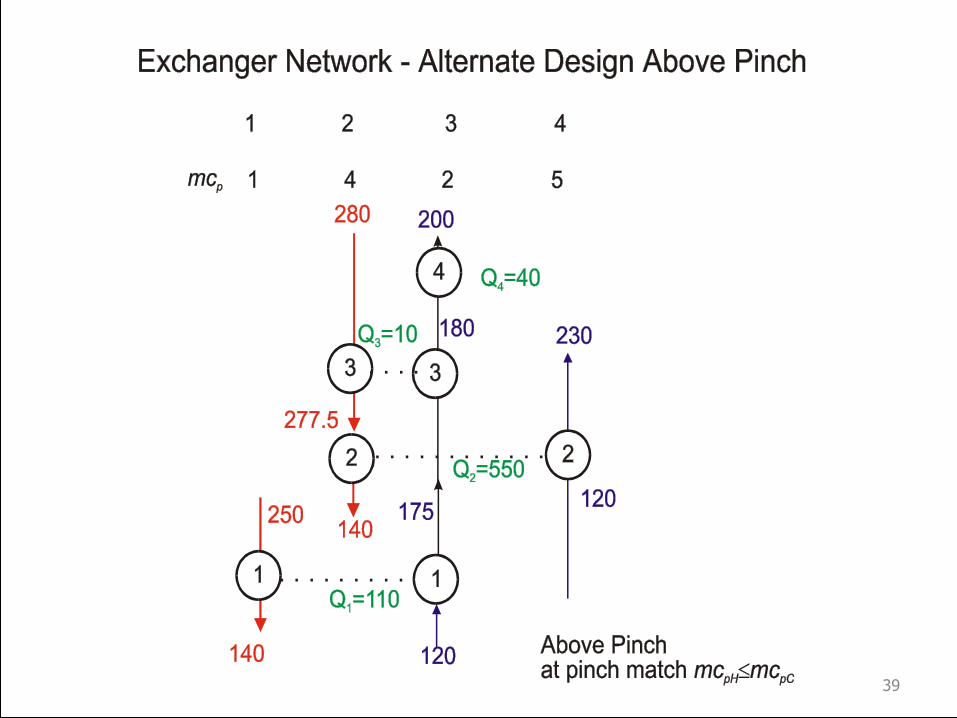
8. Design the heat exchange network. There may not be unique streams here. The design is started at the pinch and you work away from the pinch. Above the pinch, for any streams that exist at the pinch, streams can only be matched such that
Copyright - R. Turton and J. Shaeiwitz, 2012
pCHpCmCm
23
Example Problem
8. When dealing with streams away from the pinch, this criterion is no longer needed. Any streams can be matched as long as the temperatures are valid. If the criterion at the pinch appears impossible to satisfy, streams can be split to satisfy the criterion.
Copyright - R. Turton and J. Shaeiwitz, 2012 24
Copyright - R. Turton and J. Shaeiwitz, 2012
25

Copyright - R. Turton and J. Shaeiwitz, 2012
26

Copyright - R. Turton and J. Shaeiwitz, 2012
27
Copyright - R. Turton and J. Shaeiwitz, 2012
28
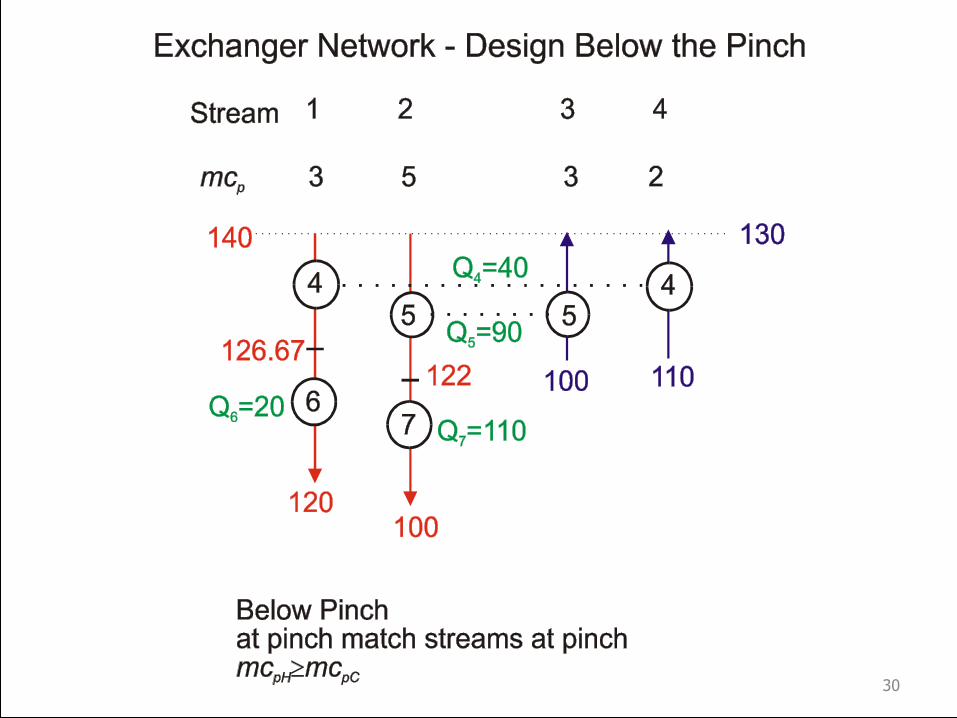
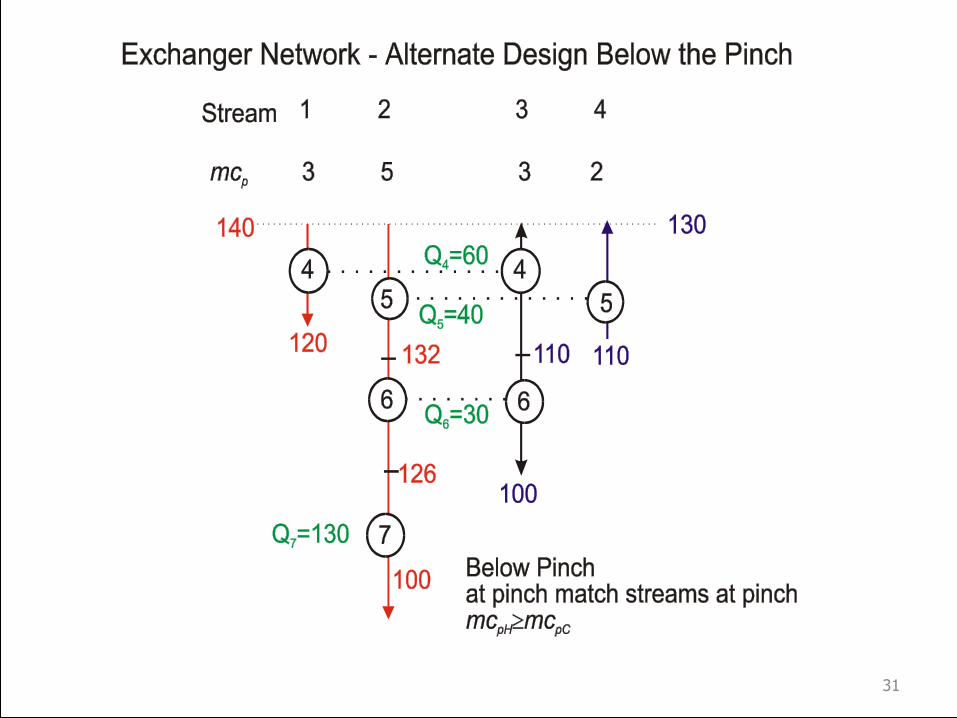
Example Problem
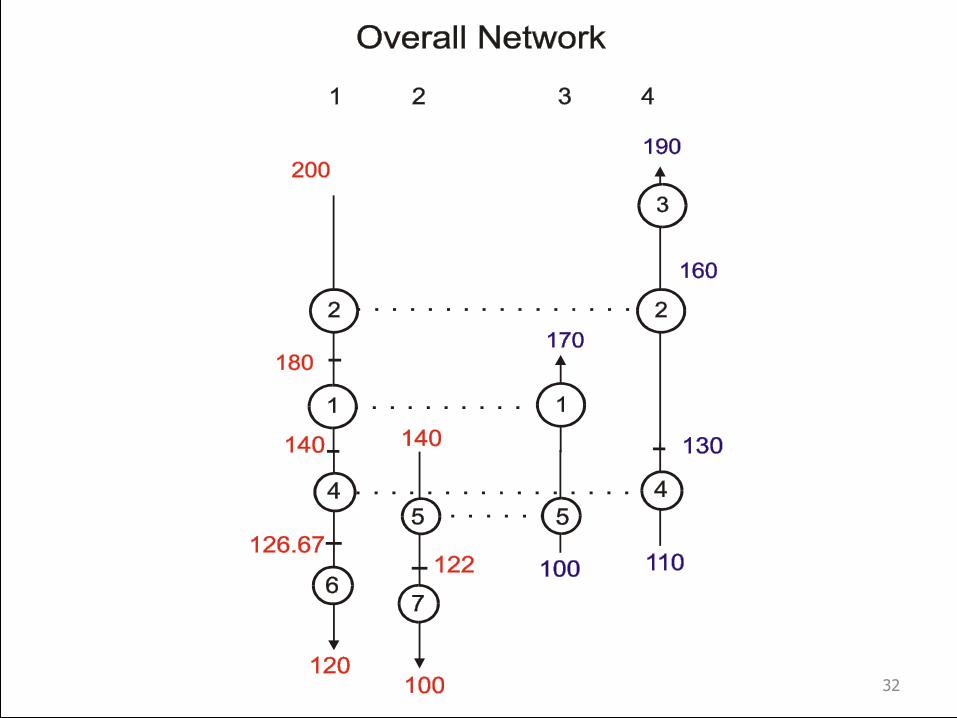
8. The same procedure is done below the pinch, except that the criterion is
9. Streams are matched and heat exchangers are added until all required heat transfer is accomplished. The entire network, both above and below the pinch, can then be represented on one diagram.
Copyright - R. Turton and J. Shaeiwitz, 2012
pH pCmC mC& &
29
Copyright - R. Turton and J. Shaeiwitz, 2012
30
Copyright - R. Turton and J. Shaeiwitz, 2012
31
Copyright - R. Turton and J. Shaeiwitz, 2012
32
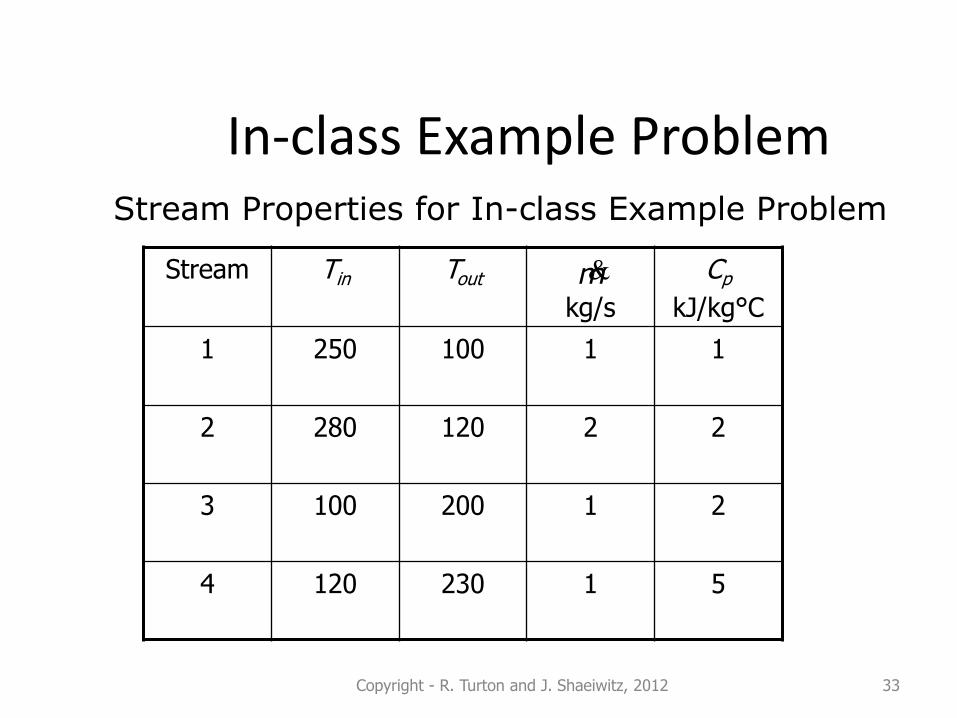
In-class Example Problem
Copyright - R. Turton and J. Shaeiwitz, 2012
Stream Properties for In-class Example Problem
mStream Tin Tout
kg/s
Cp
kJ/kg°C
1 250 100 1 1
2 280 120 2 2
3 100 200 1 2
4 120 230 1 5
33
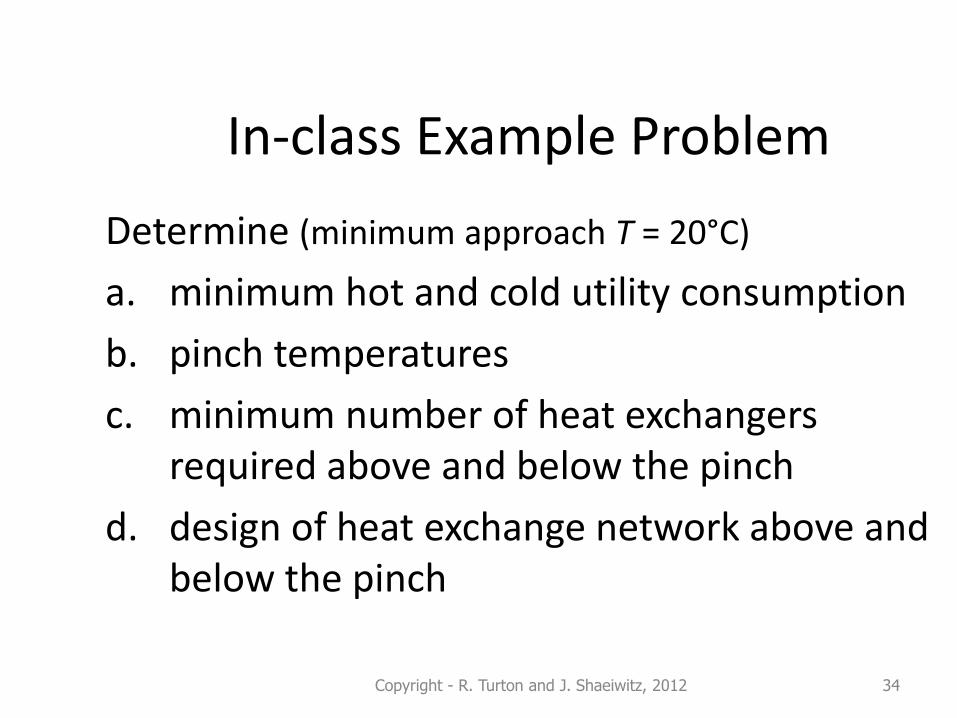
In-class Example Problem
Determine (minimum approach T = 20°C)
a. minimum hot and cold utility consumption
b. pinch temperatures
c. minimum number of heat exchangers required above and below the pinch
d. design of heat exchange network above and below the pinch
Copyright - R. Turton and J. Shaeiwitz, 2012 34

Copyright - R. Turton and J. Shaeiwitz, 2012
35
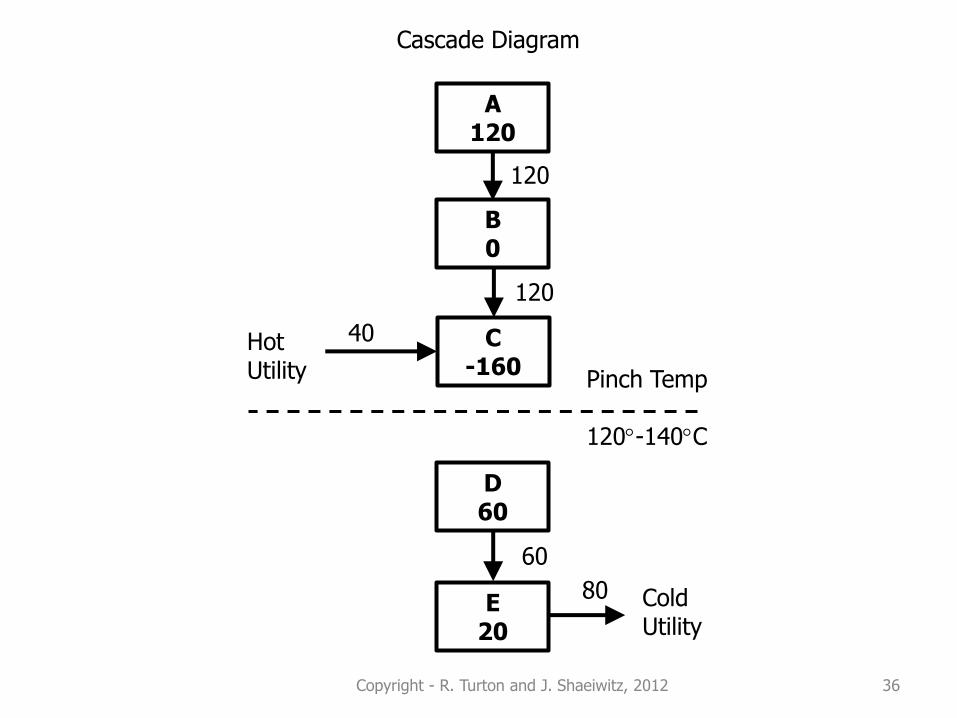
Copyright - R. Turton and J. Shaeiwitz, 2012 36
A 120
B 0
C -160
D 60
E 20
Hot Utility
120
60
80 Cold Utility
40
Pinch Temp 120-140C
120
Cascade Diagram

Copyright - R. Turton and J. Shaeiwitz, 2012
140
HU40
280
1110
2560
340
3160
CU80
4550
above pinch - 4 exchangers
below pinch - 2 exchangers, if possible
40 80
110 10 550 40
37

Copyright - R. Turton and J. Shaeiwitz, 2012
split
1 4
38
Copyright - R. Turton and J. Shaeiwitz, 2012
39

Copyright - R. Turton and J. Shaeiwitz, 2012
40

Copyright - R. Turton and J. Shaeiwitz, 2012
41
Summary
• Heat Exchange Networks
• Well-established procedure
• Not necessarily (and unlikely to be) economic optimum but a very good starting point
• Straight forward, but must be careful when matching streams at pinch
• Different correct answers possible
Copyright - R. Turton and J. Shaeiwitz, 2012 42