Embed Size (px)
Citation preview

Grid-connected Advanced Power Electronic Systems
Real-time Volt/Var Optimization Scheme for Distribution Systems with PV Integration
02-15-2017
Presenter Name: Yan Chen (On behalf of Dr. Benigni)
22Date: 02/15/2017
Outline
Impacts of PV Integration on Distribution Grids
Solution: PV Inverter Control to Sustain High Quality of Service
A Top-level Day-ahead Control that Optimizes Voltage Deviations
and Power Losses
A Fast on-line Control that Compensates for PV Generation and
Load Variability
Communication Network Aware Distributed Voltage Control
Algorithms
Conclusion
33Date: 02/15/2017
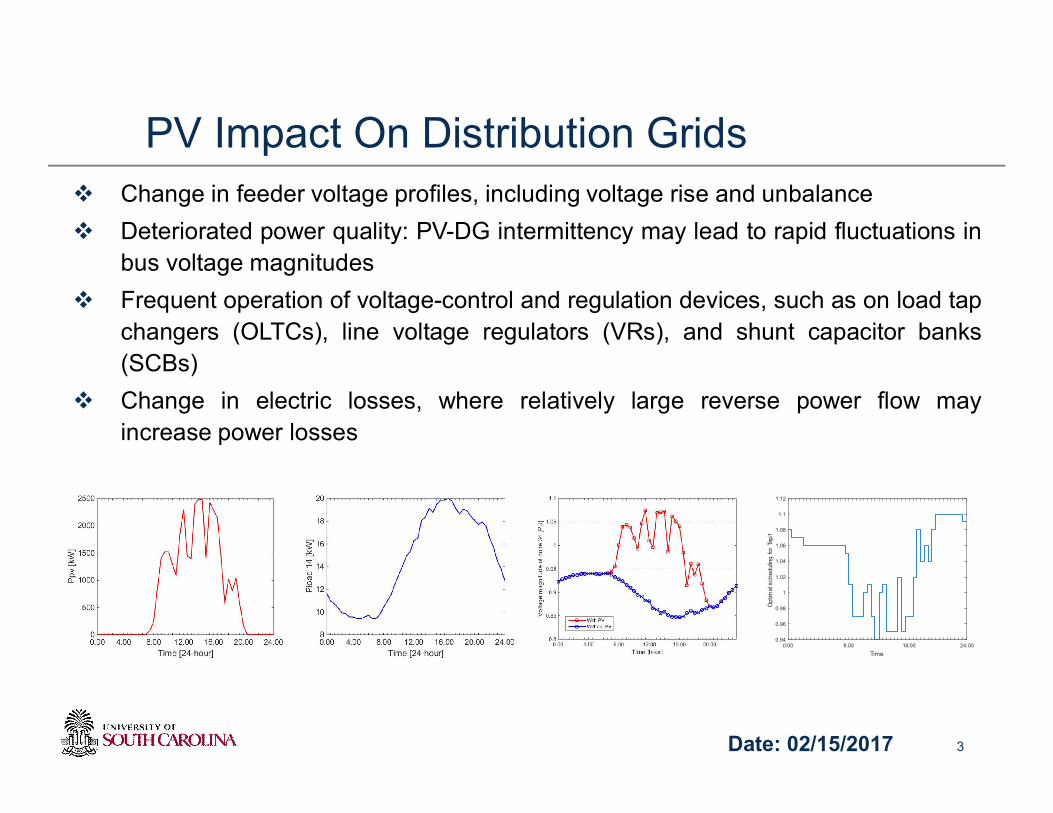
PV Impact On Distribution Grids
Change in feeder voltage profiles, including voltage rise and unbalance
Deteriorated power quality: PV-DG intermittency may lead to rapid fluctuations in
bus voltage magnitudes
Frequent operation of voltage-control and regulation devices, such as on load tap
changers (OLTCs), line voltage regulators (VRs), and shunt capacitor banks
(SCBs)
Change in electric losses, where relatively large reverse power flow may
increase power losses
0:00 8:00 16:00 24:00
Time
0.94
0.96
0.98
1
1.02
1.04
1.06
1.08
1.1
1.12
Optim
al s
chedulin
g for
Tap1
44Date: 02/15/2017
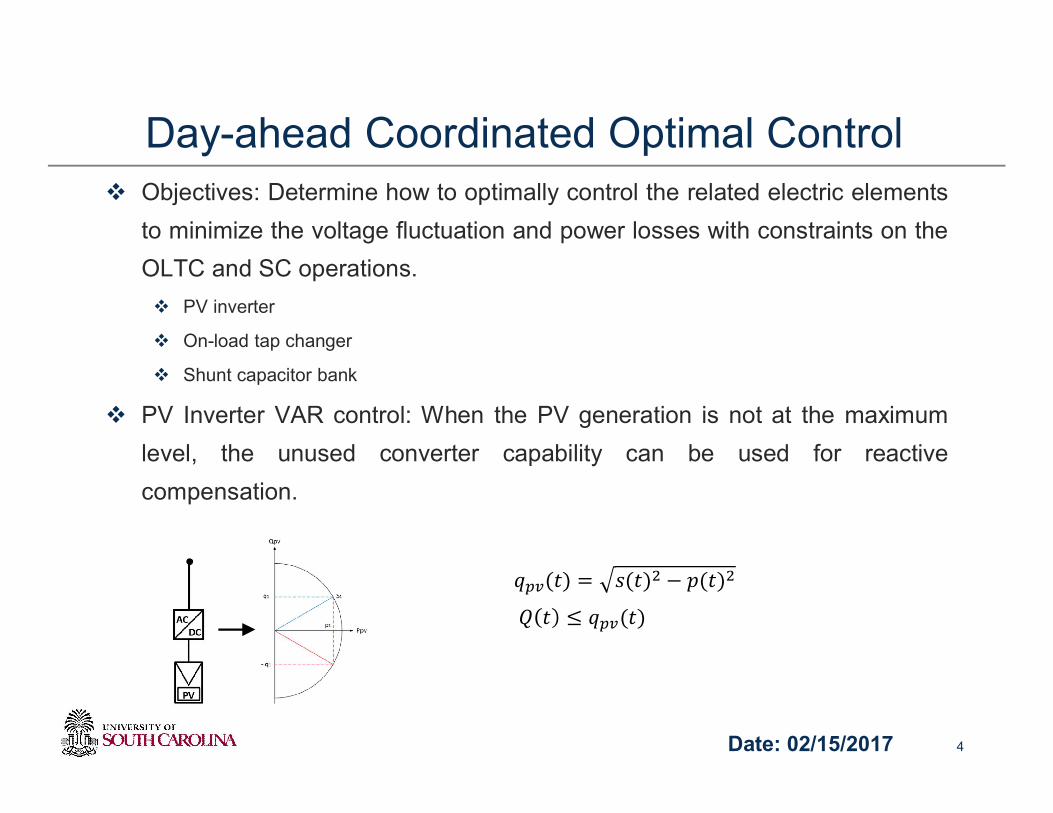
Day-ahead Coordinated Optimal Control Objectives: Determine how to optimally control the related electric elements
to minimize the voltage fluctuation and power losses with constraints on the
OLTC and SC operations.
PV inverter
On-load tap changer
Shunt capacitor bank
PV Inverter VAR control: When the PV generation is not at the maximum
level, the unused converter capability can be used for reactive
compensation.
���(�) = �(�)� − �(�)�
� � ≤ ���(�)
55Date: 02/15/2017
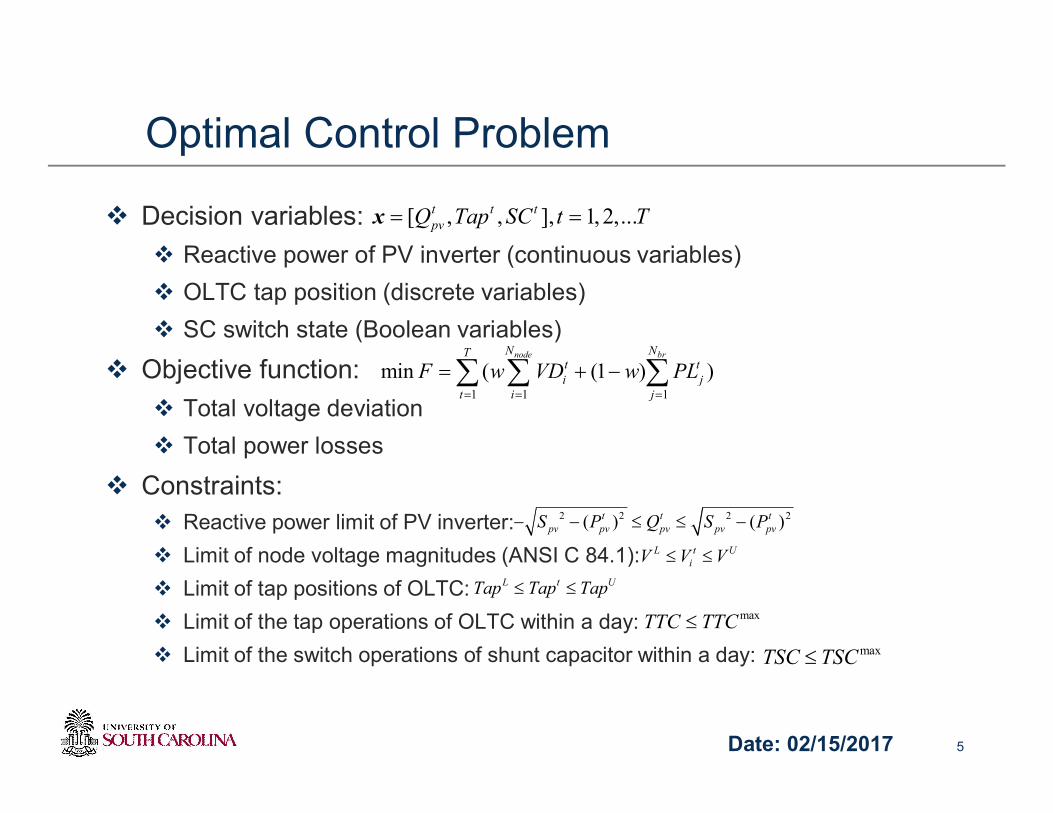
Optimal Control Problem
Decision variables:
Reactive power of PV inverter (continuous variables)
OLTC tap position (discrete variables)
SC switch state (Boolean variables)
Objective function:
Total voltage deviation
Total power losses
Constraints:
Reactive power limit of PV inverter:
Limit of node voltage magnitudes (ANSI C 84.1):
Limit of tap positions of OLTC:
Limit of the tap operations of OLTC within a day:
Limit of the switch operations of shunt capacitor within a day:
[ , , ], 1, 2,...t t tpvQ Tap SC t T x
1 1 1
min ( (1 ) )node brN NT
t ti j
t i j
F w VD w PL
2 2 2 2( ) ( )t t tpv pv pv pv pvS P Q S P
L t UTap Tap Tap
maxTSC TSC
L t UiV V V
maxTTC TTC
66Date: 02/15/2017
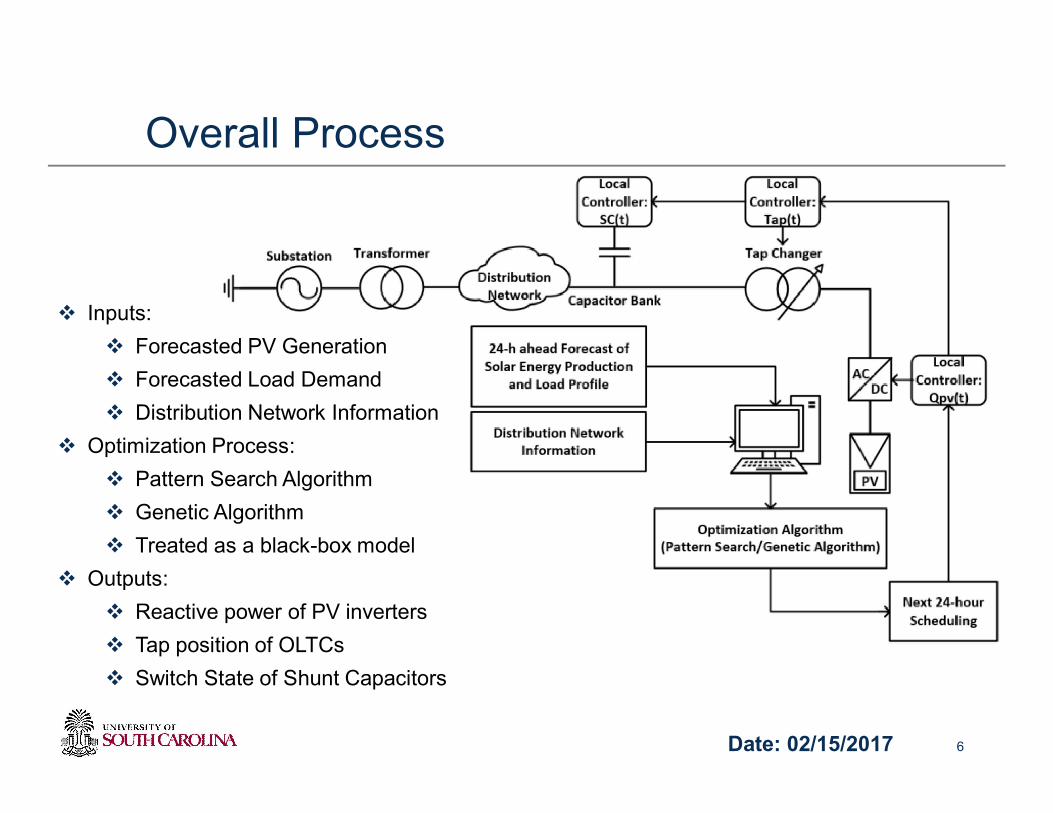
Overall Process
Inputs:
Forecasted PV Generation
Forecasted Load Demand
Distribution Network Information
Optimization Process:
Pattern Search Algorithm
Genetic Algorithm
Treated as a black-box model
Outputs:
Reactive power of PV inverters
Tap position of OLTCs
Switch State of Shunt Capacitors
77Date: 02/15/2017
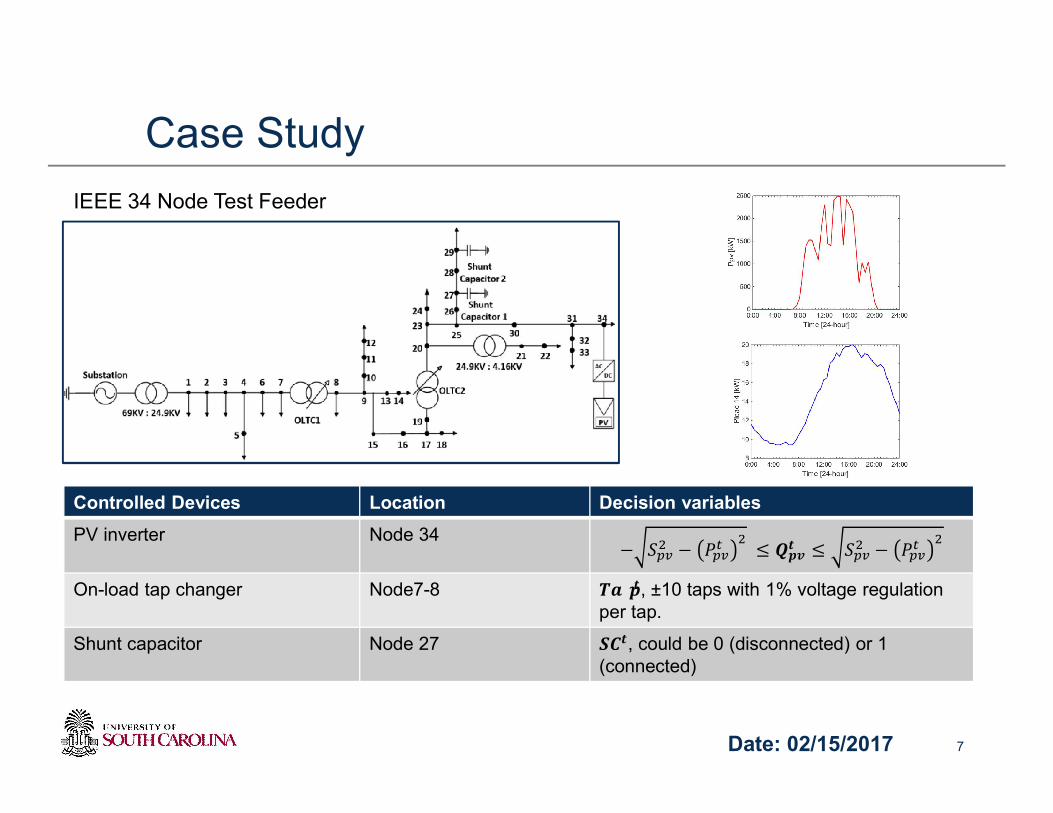
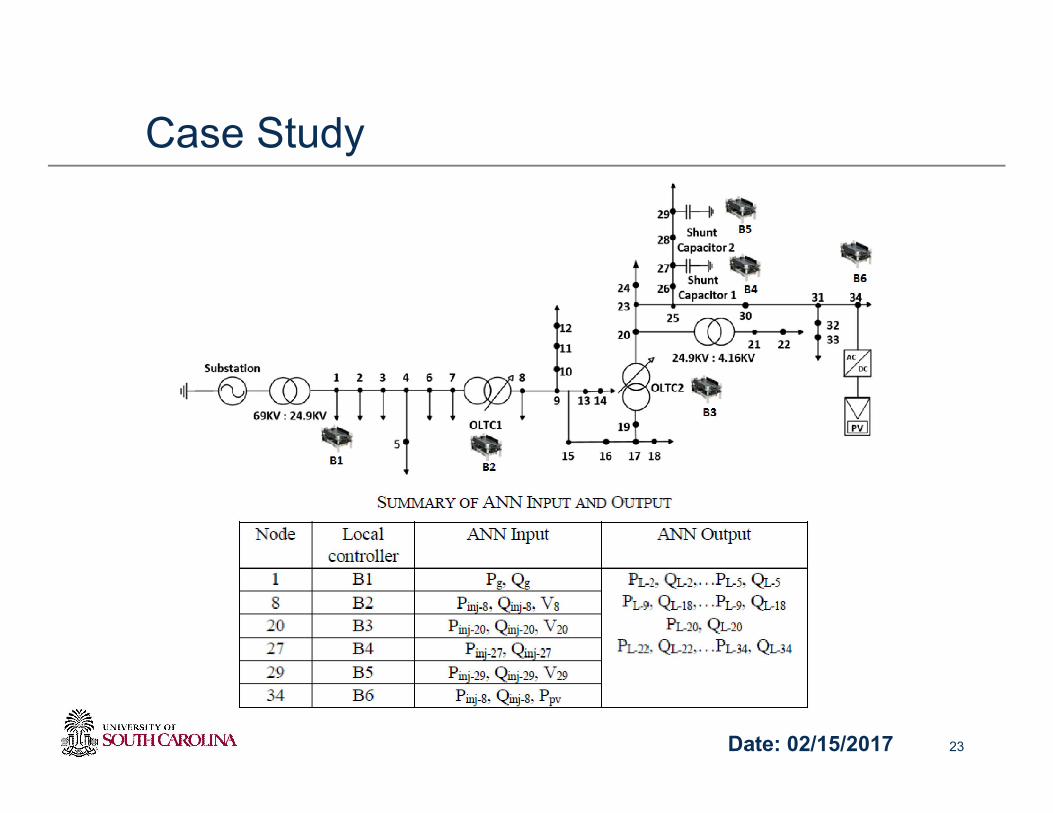
Case Study
IEEE 34 Node Test Feeder
Controlled Devices Location Decision variables
PV inverter Node 34− ���
� − ���� �
≤ ���� ≤ ���
� − ���� �
On-load tap changer Node7-8 ����, ±10 taps with 1% voltage regulation per tap.
Shunt capacitor Node 27 ���, could be 0 (disconnected) or 1 (connected)
88Date: 02/15/2017
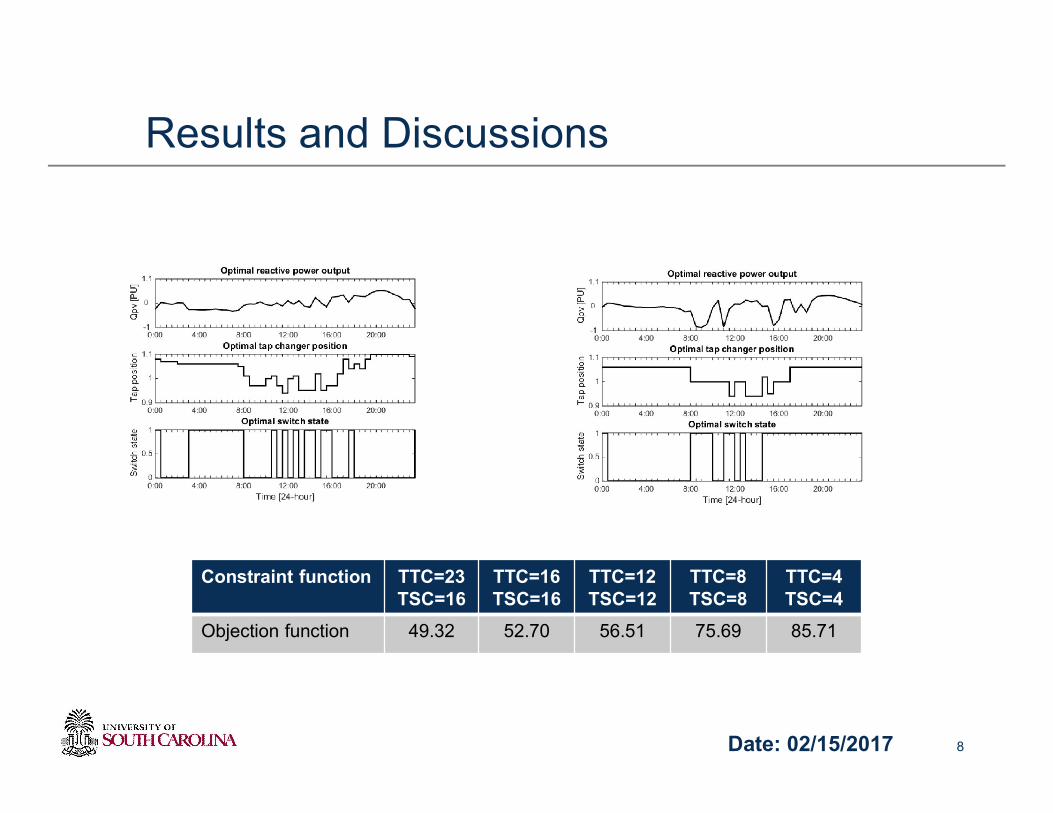
Results and Discussions
Constraint function TTC=23TSC=16
TTC=16TSC=16
TTC=12TSC=12
TTC=8TSC=8
TTC=4TSC=4
Objection function 49.32 52.70 56.51 75.69 85.71
99Date: 02/15/2017
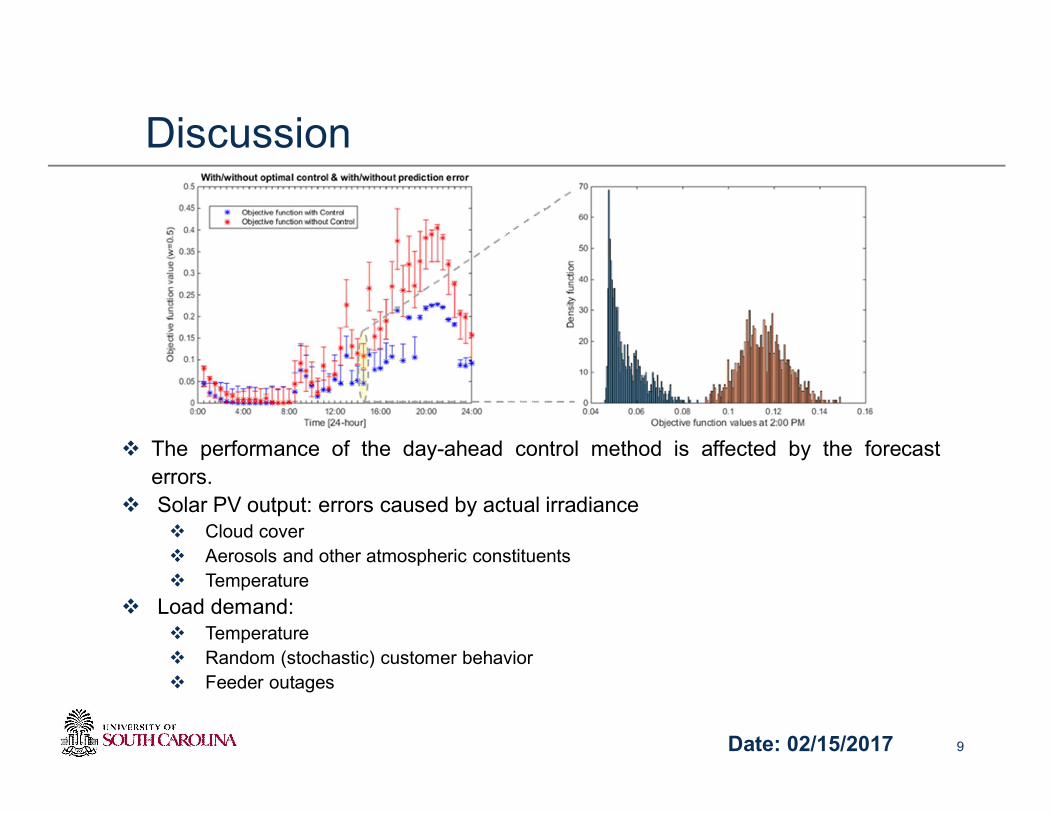
Discussion
The performance of the day-ahead control method is affected by the forecast
errors.
Solar PV output: errors caused by actual irradiance Cloud cover
Aerosols and other atmospheric constituents
Temperature
Load demand: Temperature
Random (stochastic) customer behavior
Feeder outages
1010Date: 02/15/2017
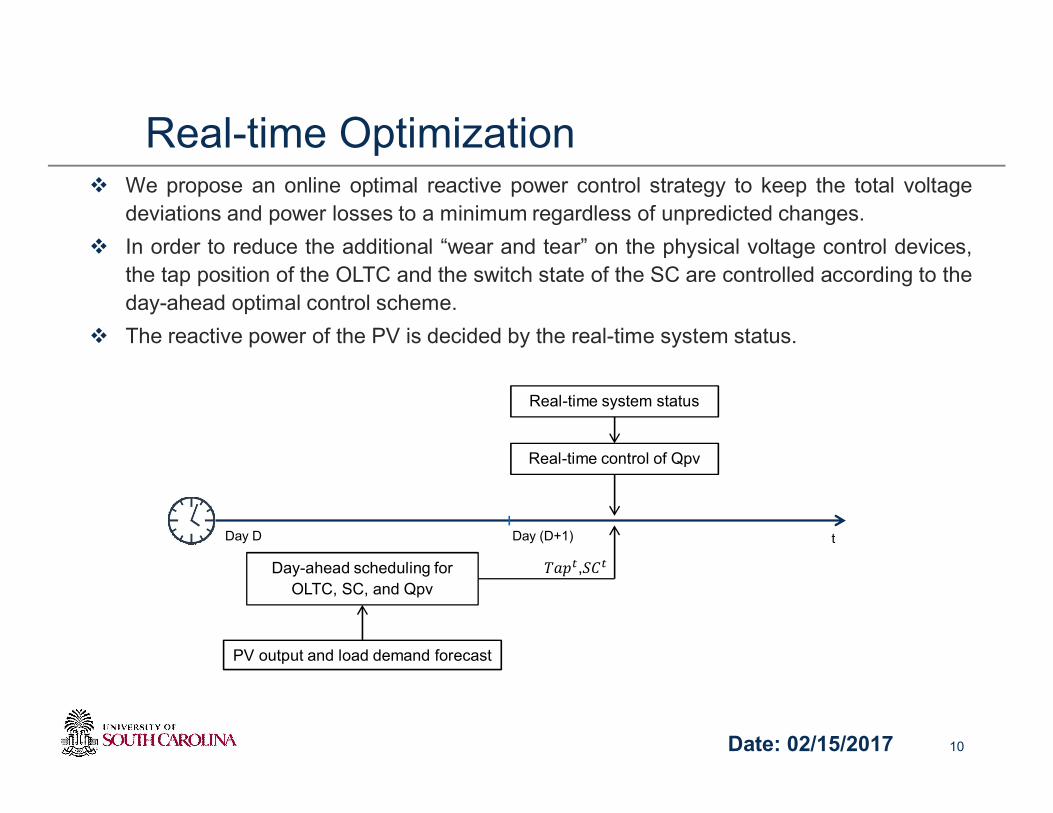
Real-time Optimization We propose an online optimal reactive power control strategy to keep the total voltage
deviations and power losses to a minimum regardless of unpredicted changes.
In order to reduce the additional “wear and tear” on the physical voltage control devices,
the tap position of the OLTC and the switch state of the SC are controlled according to the
day-ahead optimal control scheme.
The reactive power of the PV is decided by the real-time system status.
Day D Day (D+1) t
Day-ahead scheduling for
OLTC, SC, and Qpv
PV output and load demand forecast
����,���
Real-time control of Qpv
Real-time system status

1111Date: 02/15/2017
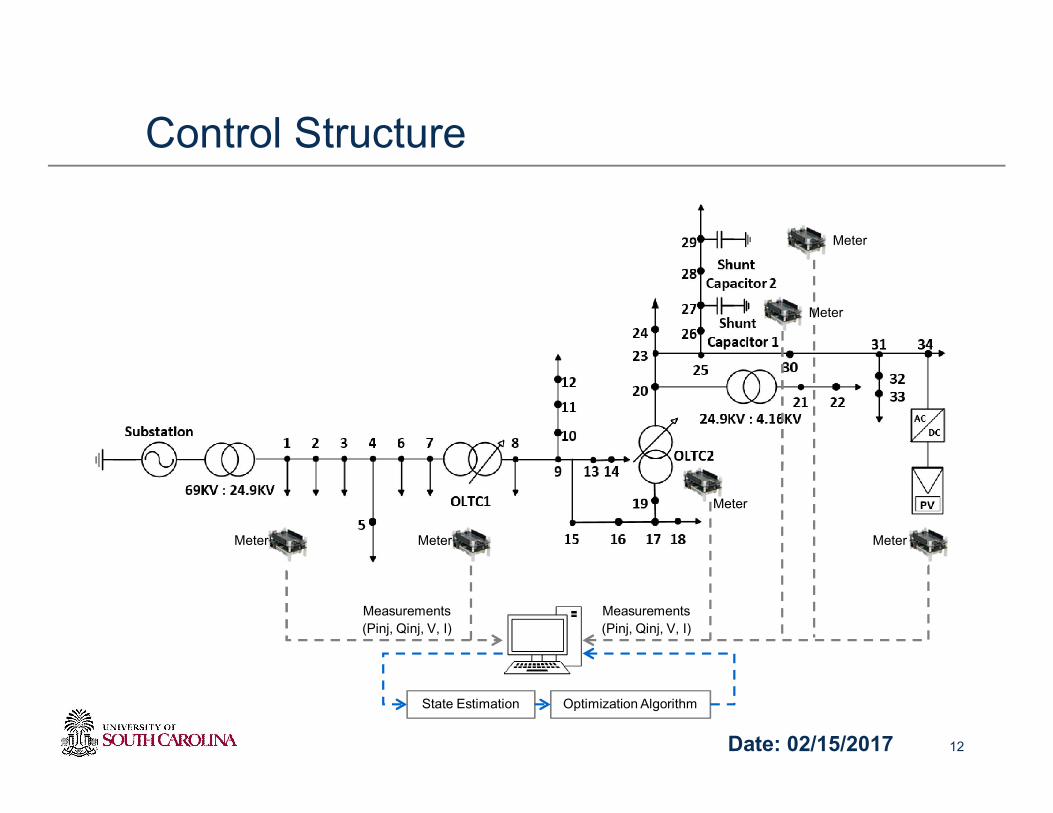
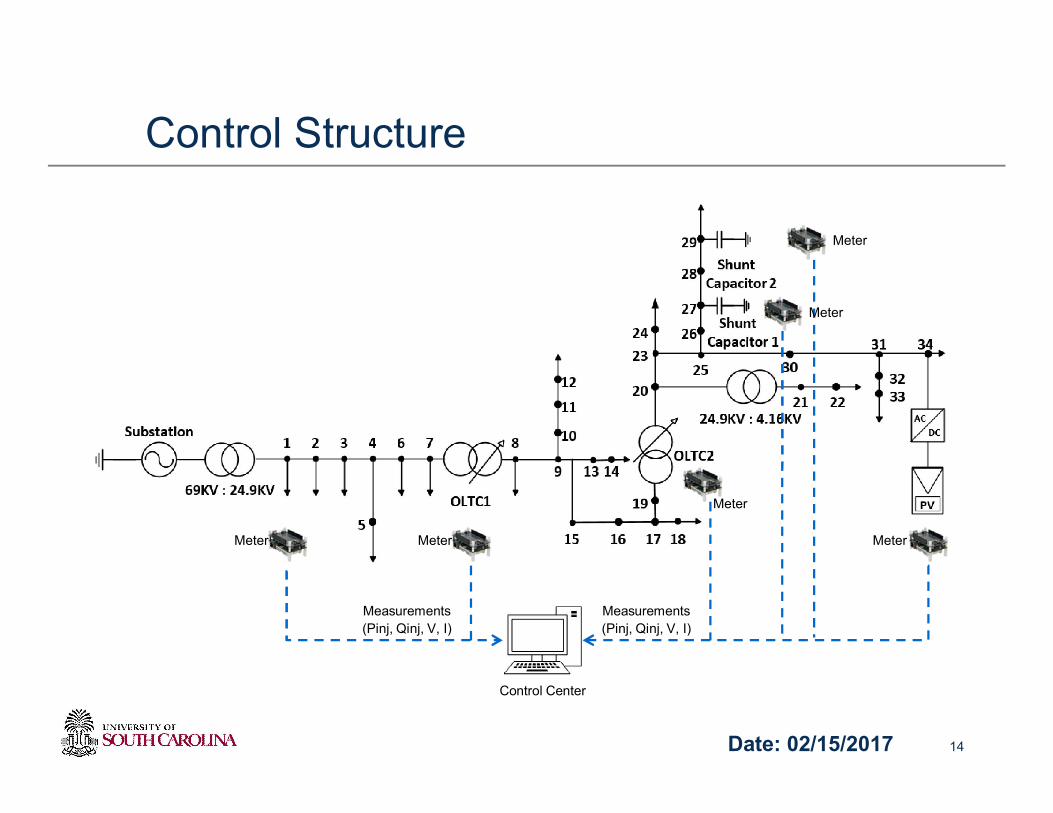
Control Structure
Meter Meter
Meter
Meter
Meter
Meter
Measurements
(Pinj, Qinj, V, I)
Measurements
(Pinj, Qinj, V, I)
Control Center
1212Date: 02/15/2017
Control Structure
Meter Meter
Meter
Meter
Meter
Meter
Measurements
(Pinj, Qinj, V, I)
Measurements
(Pinj, Qinj, V, I)
State Estimation Optimization Algorithm
1313Date: 02/15/2017
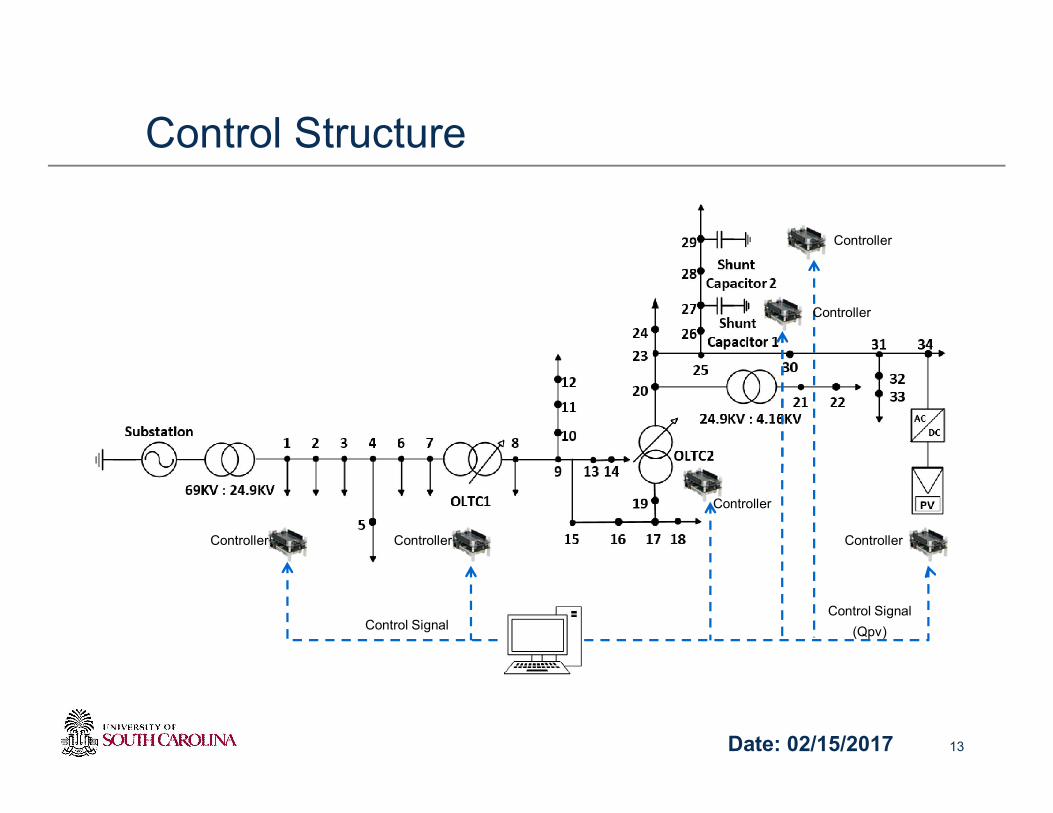
Control Structure
Controller Controller
Controller
Controller
Controller
Controller
Control Signal Control Signal
(Qpv)
1414Date: 02/15/2017
Control Structure
Meter Meter
Meter
Meter
Meter
Meter
Measurements
(Pinj, Qinj, V, I)
Measurements
(Pinj, Qinj, V, I)
Control Center
1515Date: 02/15/2017
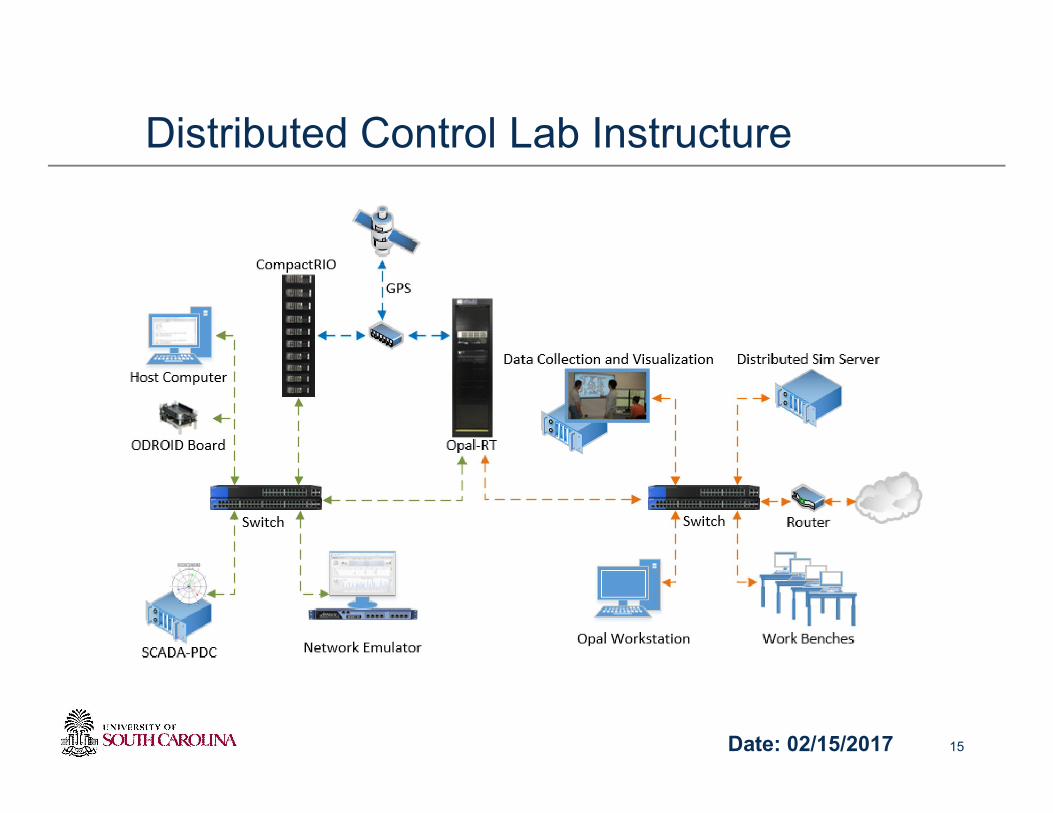
Distributed Control Lab Instructure
1616Date: 02/15/2017
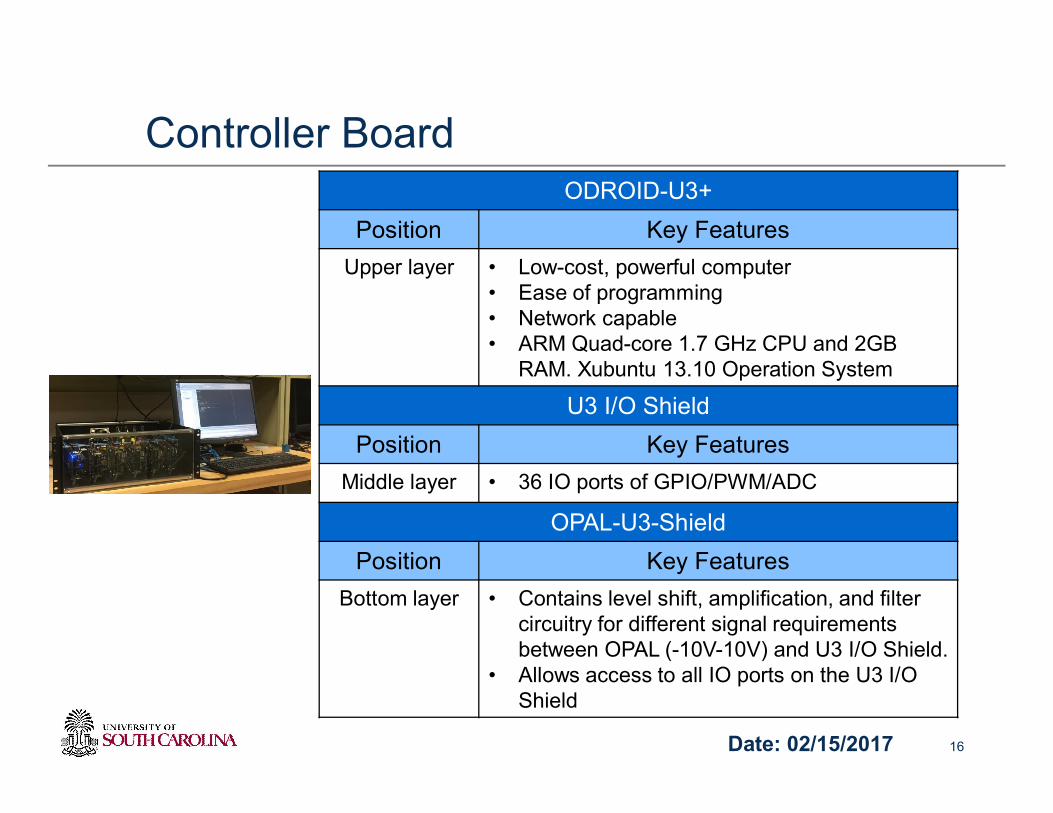
Controller Board ODROID-U3+
Position Key Features
Upper layer • Low-cost, powerful computer• Ease of programming• Network capable• ARM Quad-core 1.7 GHz CPU and 2GB
RAM. Xubuntu 13.10 Operation System
U3 I/O Shield
Position Key Features
Middle layer • 36 IO ports of GPIO/PWM/ADC
OPAL-U3-Shield
Position Key Features
Bottom layer • Contains level shift, amplification, and filter circuitry for different signal requirements between OPAL (-10V-10V) and U3 I/O Shield.
• Allows access to all IO ports on the U3 I/O Shield
1717Date: 02/15/2017
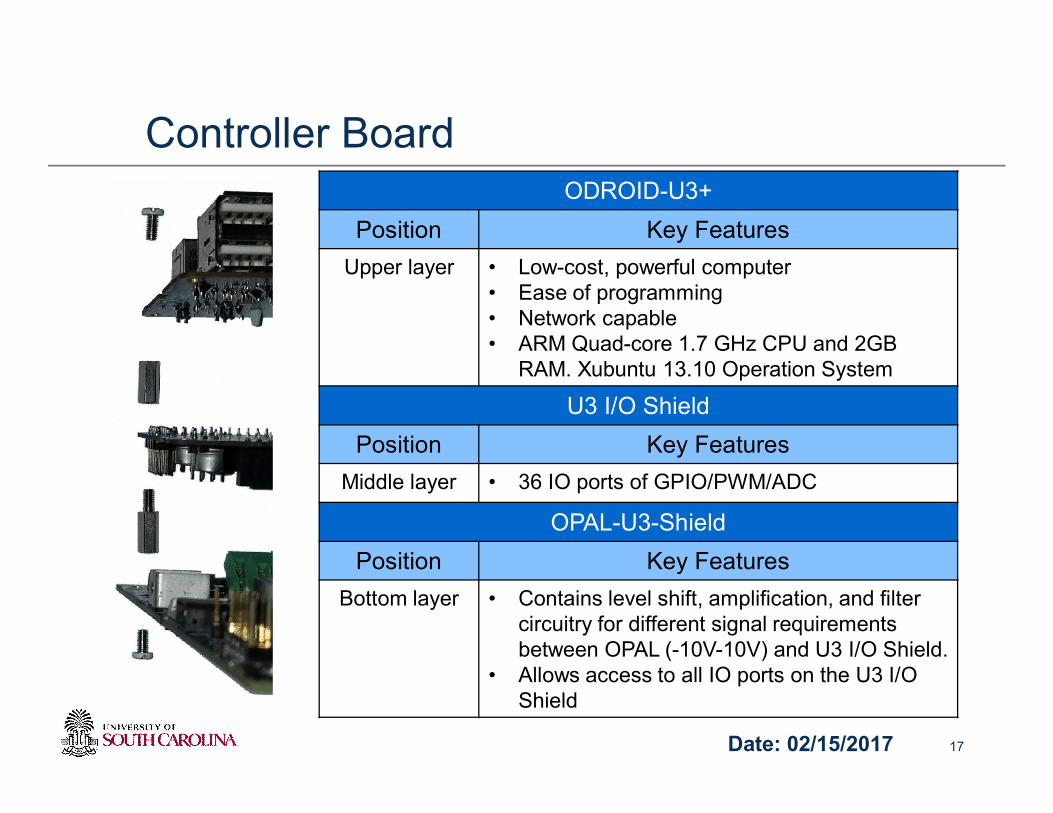
Controller Board ODROID-U3+
Position Key Features
Upper layer • Low-cost, powerful computer• Ease of programming• Network capable• ARM Quad-core 1.7 GHz CPU and 2GB
RAM. Xubuntu 13.10 Operation System
U3 I/O Shield
Position Key Features
Middle layer • 36 IO ports of GPIO/PWM/ADC
OPAL-U3-Shield
Position Key Features
Bottom layer • Contains level shift, amplification, and filter circuitry for different signal requirements between OPAL (-10V-10V) and U3 I/O Shield.
• Allows access to all IO ports on the U3 I/O Shield
1818Date: 02/15/2017
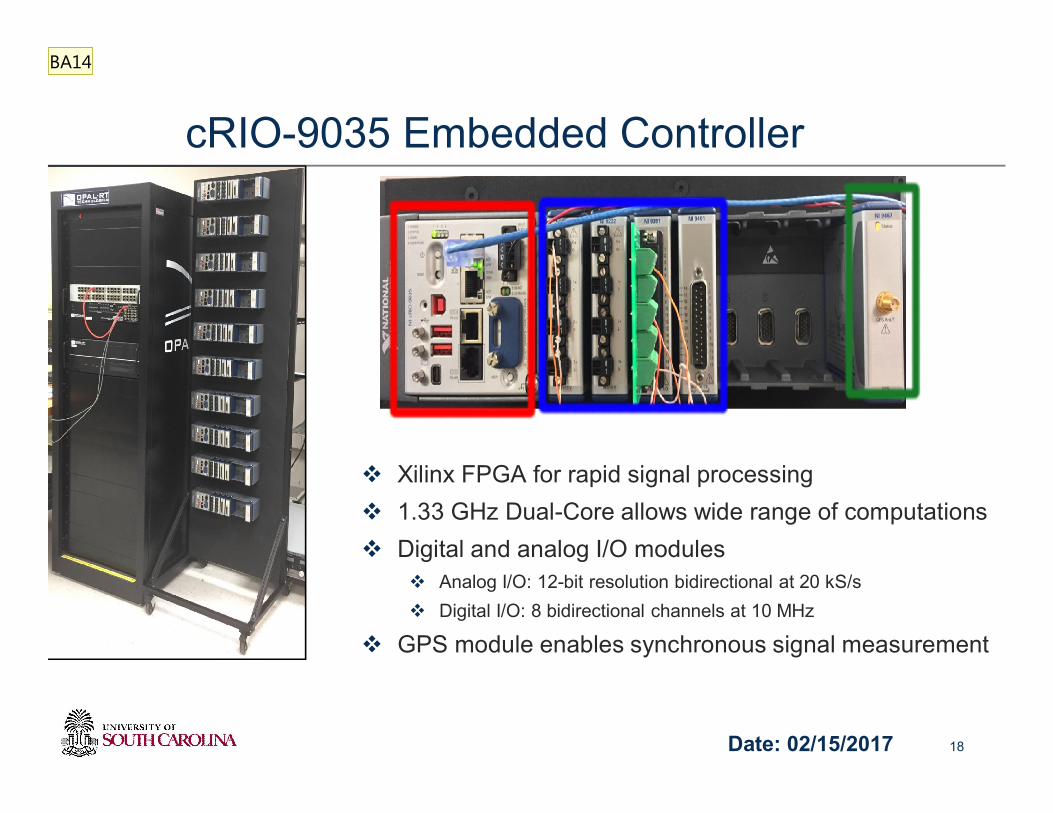
cRIO-9035 Embedded Controller
Xilinx FPGA for rapid signal processing
1.33 GHz Dual-Core allows wide range of computations
Digital and analog I/O modules
Analog I/O: 12-bit resolution bidirectional at 20 kS/s
Digital I/O: 8 bidirectional channels at 10 MHz
GPS module enables synchronous signal measurement
BA14

Slide 18
BA14 add a picture that show the full rack and add some detail on the IO modulesBENIGNI, ANDREA, 2/10/2017
1919Date: 02/15/2017
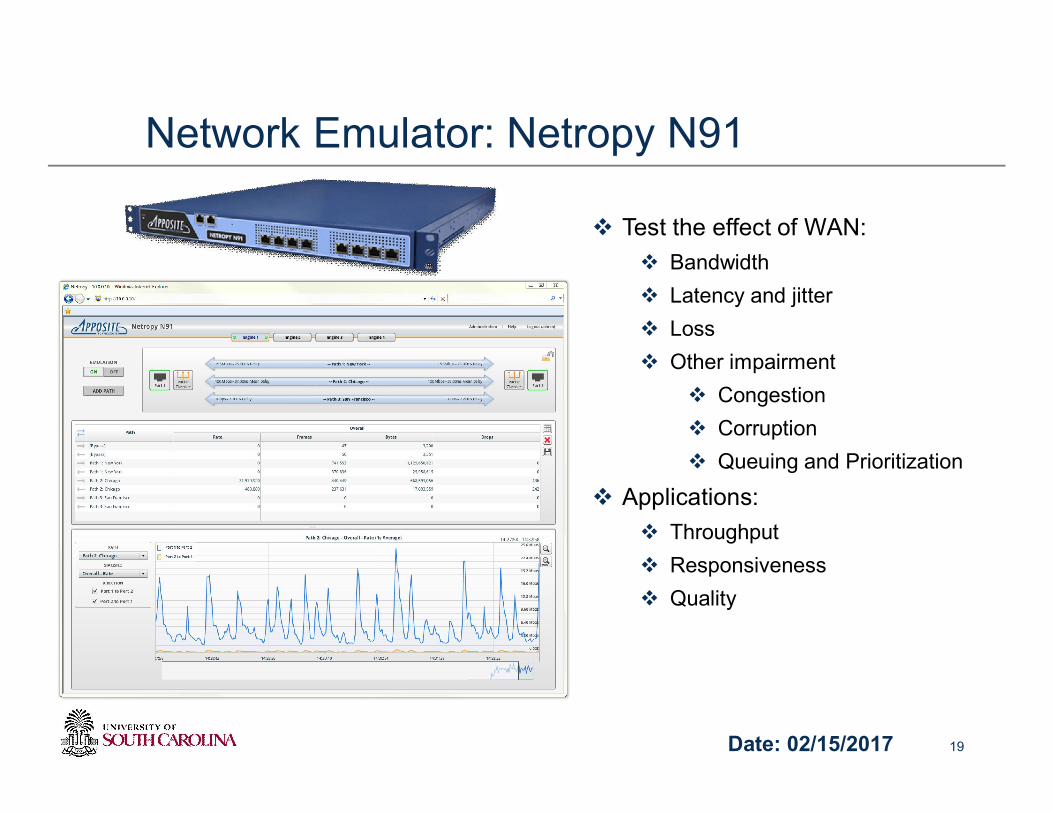
Network Emulator: Netropy N91
Test the effect of WAN:
Bandwidth
Latency and jitter
Loss
Other impairment
Congestion
Corruption
Queuing and Prioritization
Applications:
Throughput
Responsiveness
Quality
2020Date: 02/15/2017
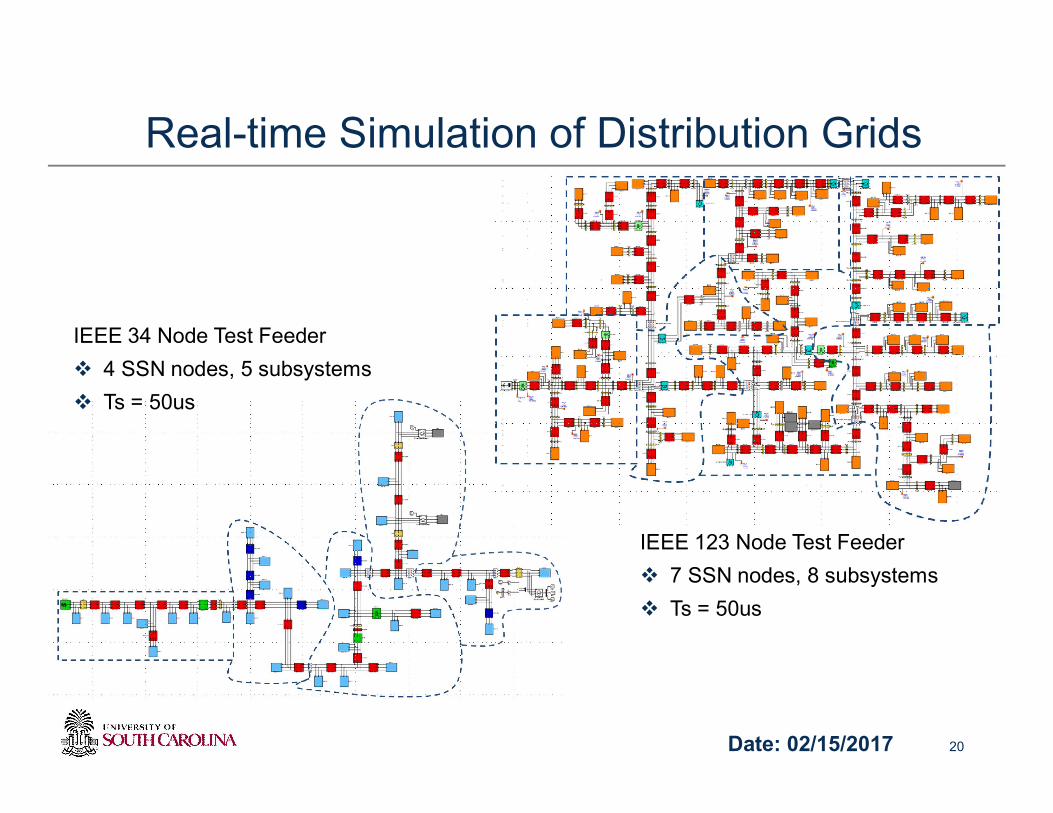
Real-time Simulation of Distribution Grids
IEEE 34 Node Test Feeder
4 SSN nodes, 5 subsystems
Ts = 50us
IEEE 123 Node Test Feeder
7 SSN nodes, 8 subsystems
Ts = 50us
2121Date: 02/15/2017
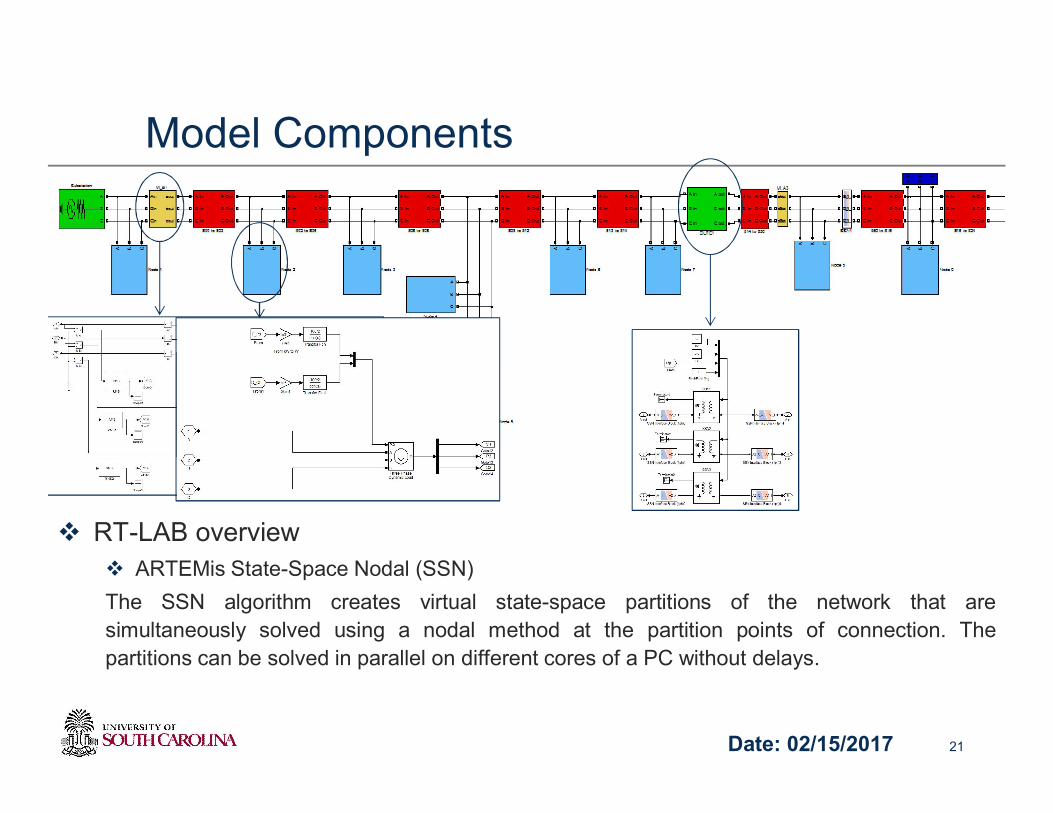
Model Components
RT-LAB overview
ARTEMis State-Space Nodal (SSN)
The SSN algorithm creates virtual state-space partitions of the network that are
simultaneously solved using a nodal method at the partition points of connection. The
partitions can be solved in parallel on different cores of a PC without delays.
2222Date: 02/15/2017
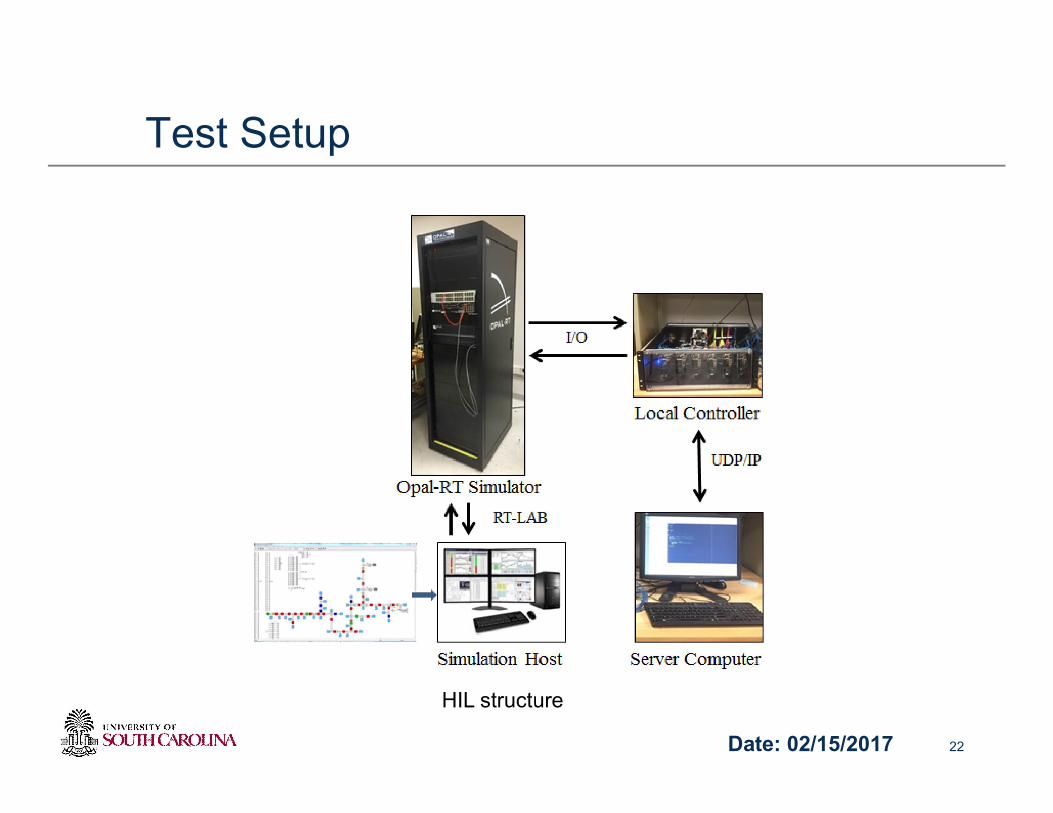
Test Setup
HIL structure
2323Date: 02/15/2017
Case Study
2424Date: 02/15/2017
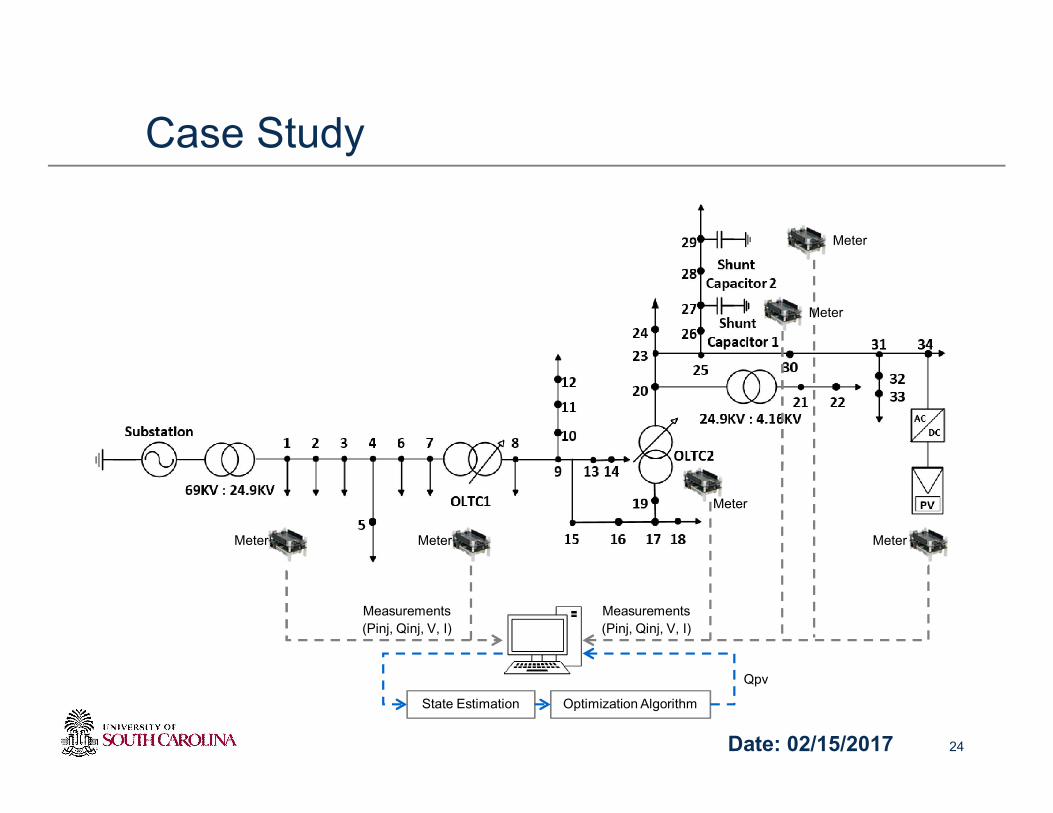
Case Study
Meter Meter
Meter
Meter
Meter
Meter
Measurements
(Pinj, Qinj, V, I)
Measurements
(Pinj, Qinj, V, I)
State Estimation Optimization Algorithm
Qpv
2525Date: 02/15/2017
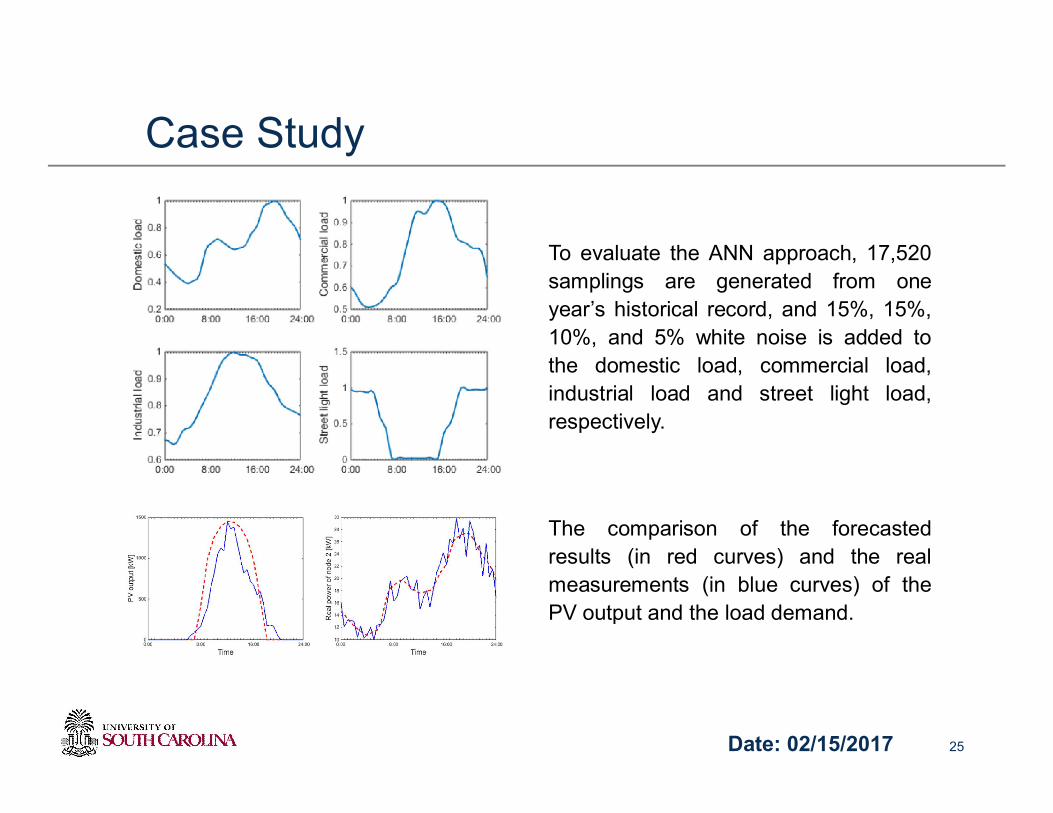
Case Study
To evaluate the ANN approach, 17,520
samplings are generated from one
year’s historical record, and 15%, 15%,
10%, and 5% white noise is added to
the domestic load, commercial load,
industrial load and street light load,
respectively.
The comparison of the forecasted
results (in red curves) and the real
measurements (in blue curves) of the
PV output and the load demand.
2626Date: 02/15/2017
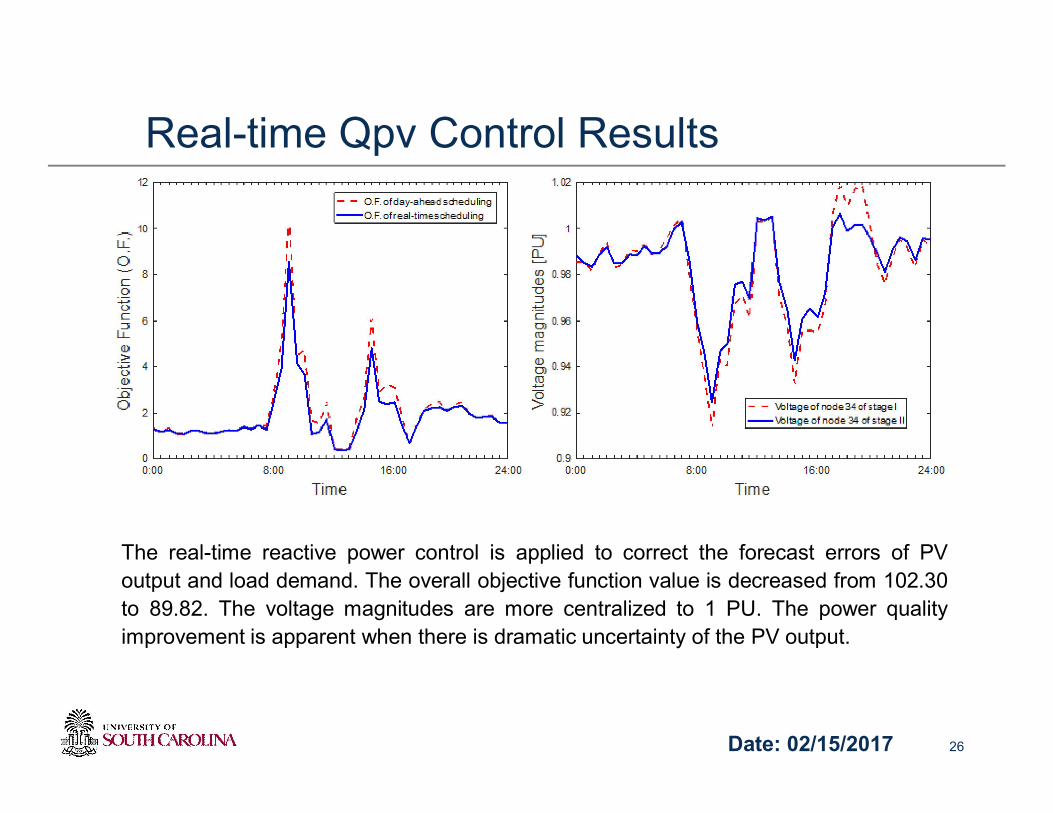
Real-time Qpv Control Results
The real-time reactive power control is applied to correct the forecast errors of PV
output and load demand. The overall objective function value is decreased from 102.30
to 89.82. The voltage magnitudes are more centralized to 1 PU. The power quality
improvement is apparent when there is dramatic uncertainty of the PV output.
2727Date: 02/15/2017
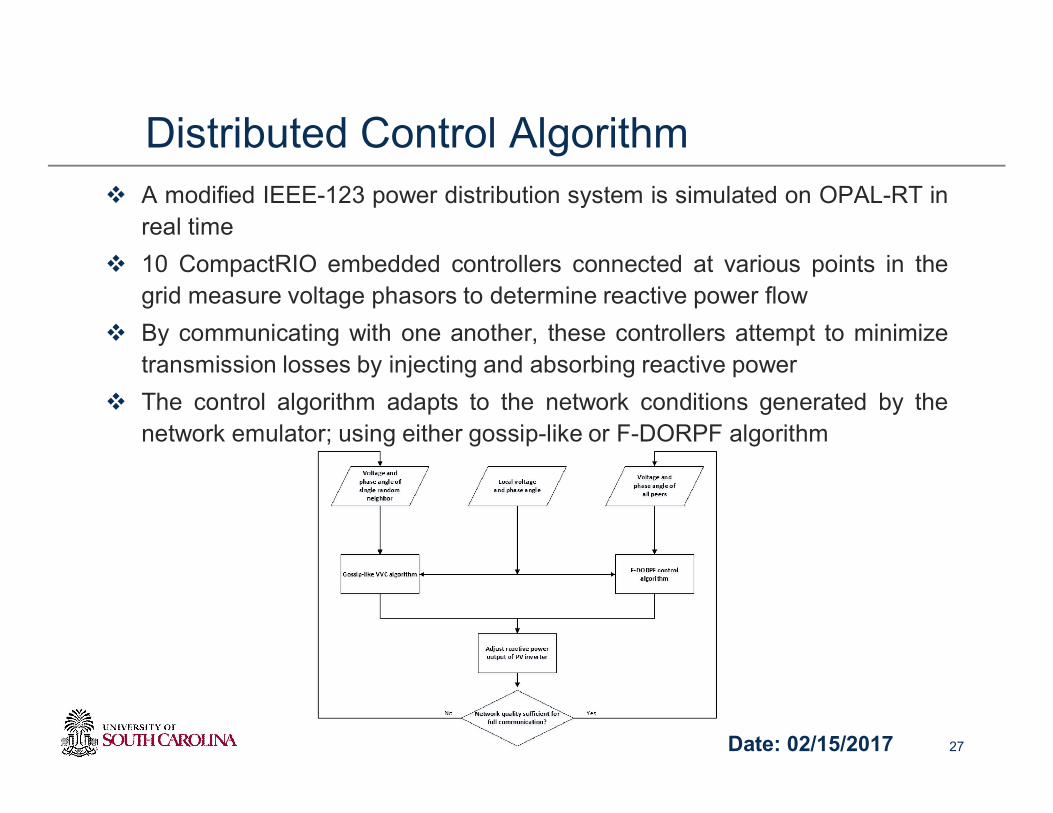
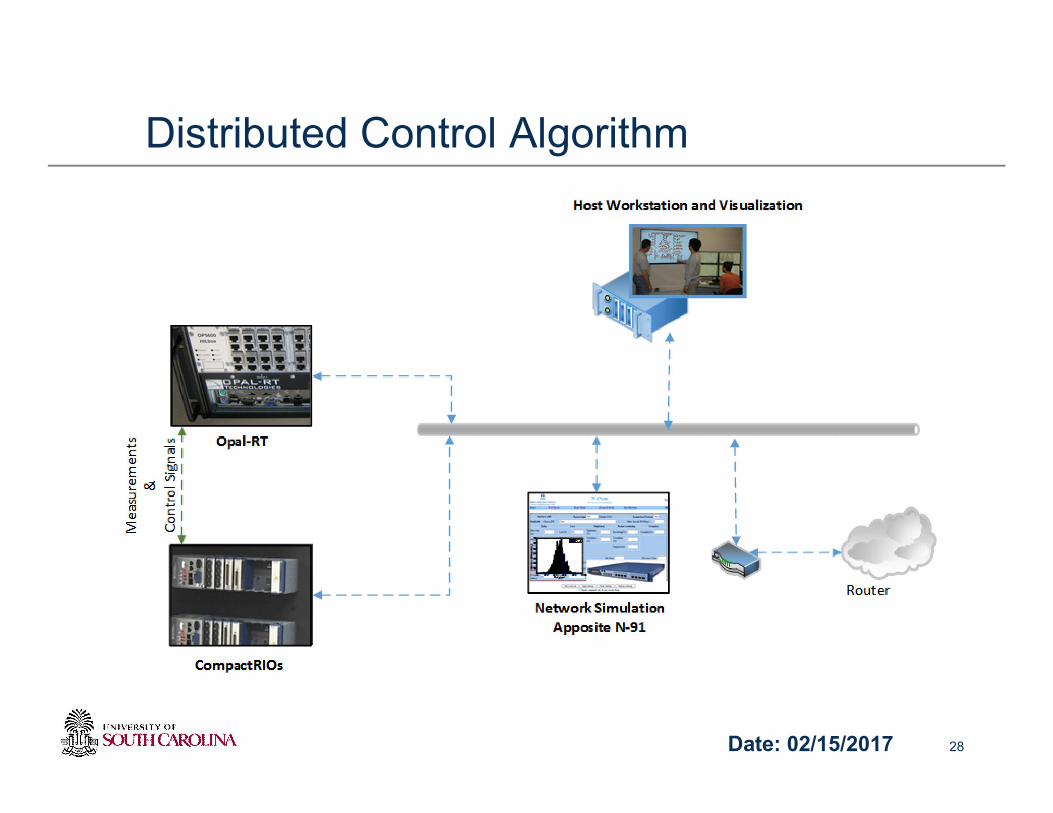
Distributed Control Algorithm
A modified IEEE-123 power distribution system is simulated on OPAL-RT in
real time
10 CompactRIO embedded controllers connected at various points in the
grid measure voltage phasors to determine reactive power flow
By communicating with one another, these controllers attempt to minimize
transmission losses by injecting and absorbing reactive power
The control algorithm adapts to the network conditions generated by the
network emulator; using either gossip-like or F-DORPF algorithm
2828Date: 02/15/2017
Distributed Control Algorithm
2929Date: 02/15/2017
Conclusions
The increasing penetration of distributed and renewable energy
resources introduces challenges to the distribution systems operation
and control
Real-time simulation (of power and communication networks) and
Hardware In the Loop simulation are fundamental tools for the design
and testing of innovative control solutions

3030Date: 02/15/2017
Thanks for your attention
Questions?
Dr. Andrea Benigni
Department of Electrical Engineering
Yan Chen, Ph.D. student
Department of Electrical Engineering