Embed Size (px)
Citation preview
SIX SIGMA YELLOW BELT TRAINING
2
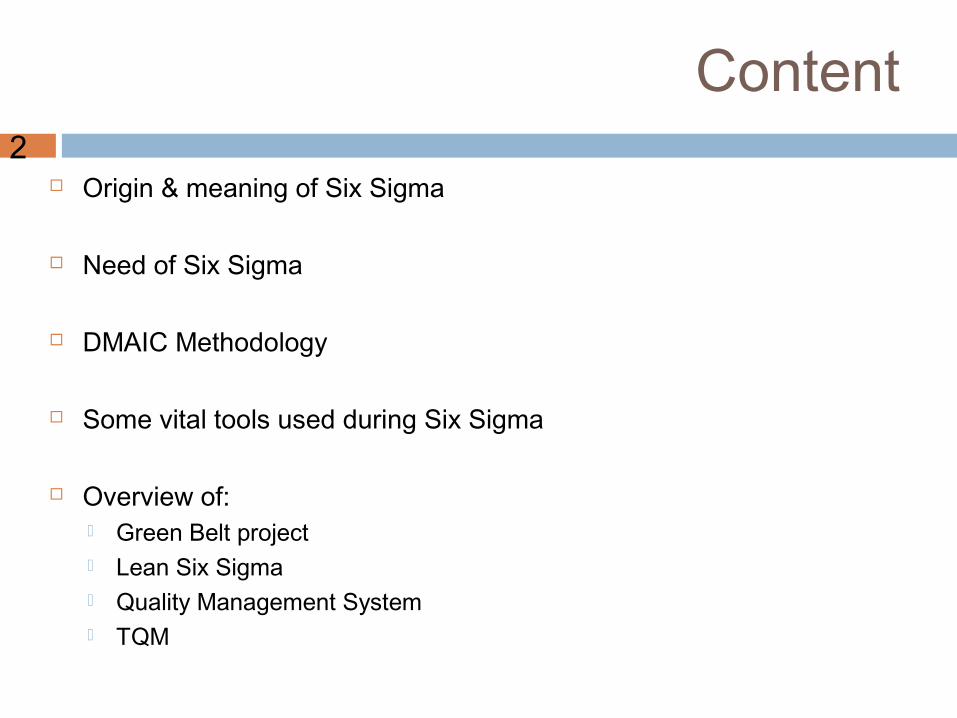
Content
Origin & meaning of Six Sigma
Need of Six Sigma
DMAIC Methodology
Some vital tools used during Six Sigma
Overview of: Green Belt project Lean Six Sigma Quality Management System TQM
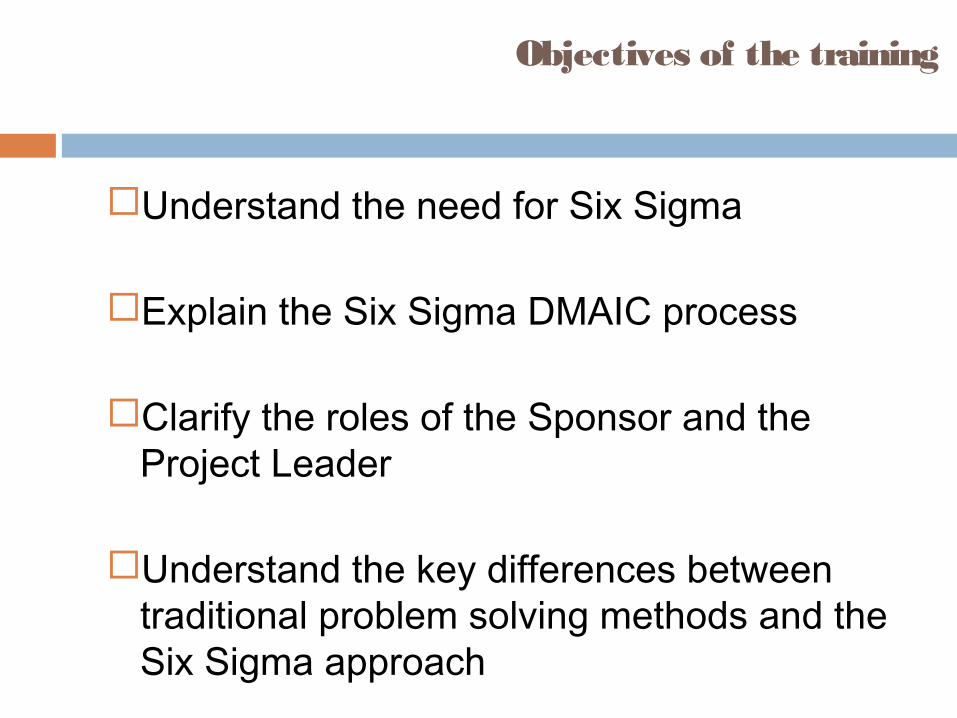
Objectives of the training
Understand the need for Six Sigma
Explain the Six Sigma DMAIC process
Clarify the roles of the Sponsor and the Project Leader
Understand the key differences between traditional problem solving methods and the Six Sigma approach
Demonstrate the 7 basic tools
Develop an awareness of the various Six Sigma tools and their applicability
Outline the key attributes of a Six Sigma project
4
“Often, problems are knots with many strands, and looking at those strands can make a problem seem
different.”
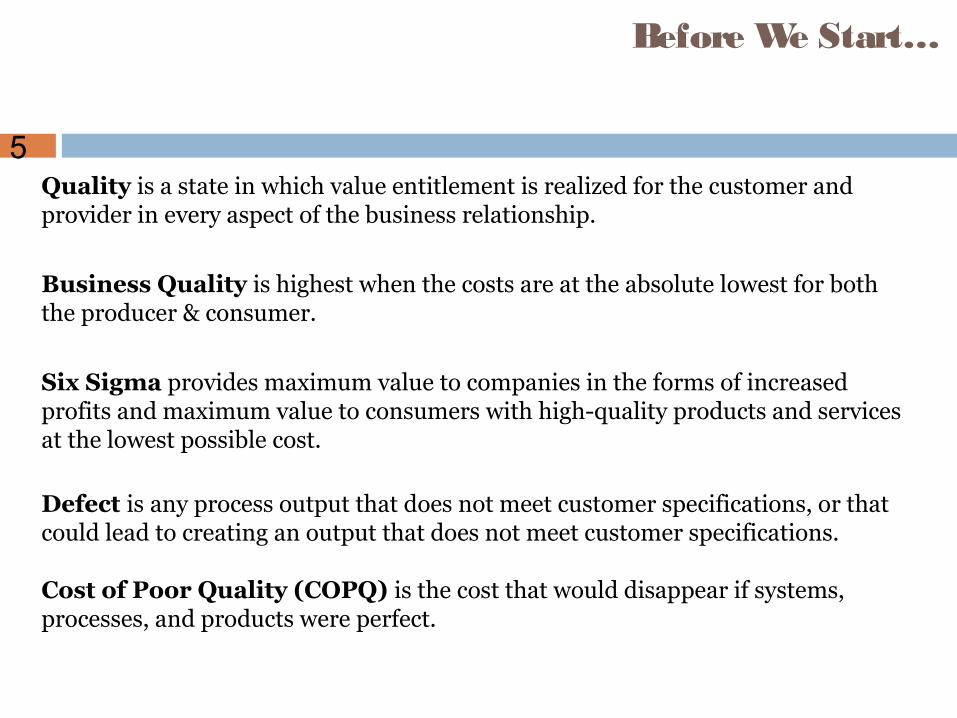
5Quality is a state in which value entitlement is realized for the customer and provider in every aspect of the business relationship.
Business Quality is highest when the costs are at the absolute lowest for both the producer & consumer.
Six Sigma provides maximum value to companies in the forms of increased profits and maximum value to consumers with high-quality products and services at the lowest possible cost.
Defect is any process output that does not meet customer specifications, or that could lead to creating an output that does not meet customer specifications.
Cost of Poor Quality (COPQ) is the cost that would disappear if systems, processes, and products were perfect.
Before We Start…
6
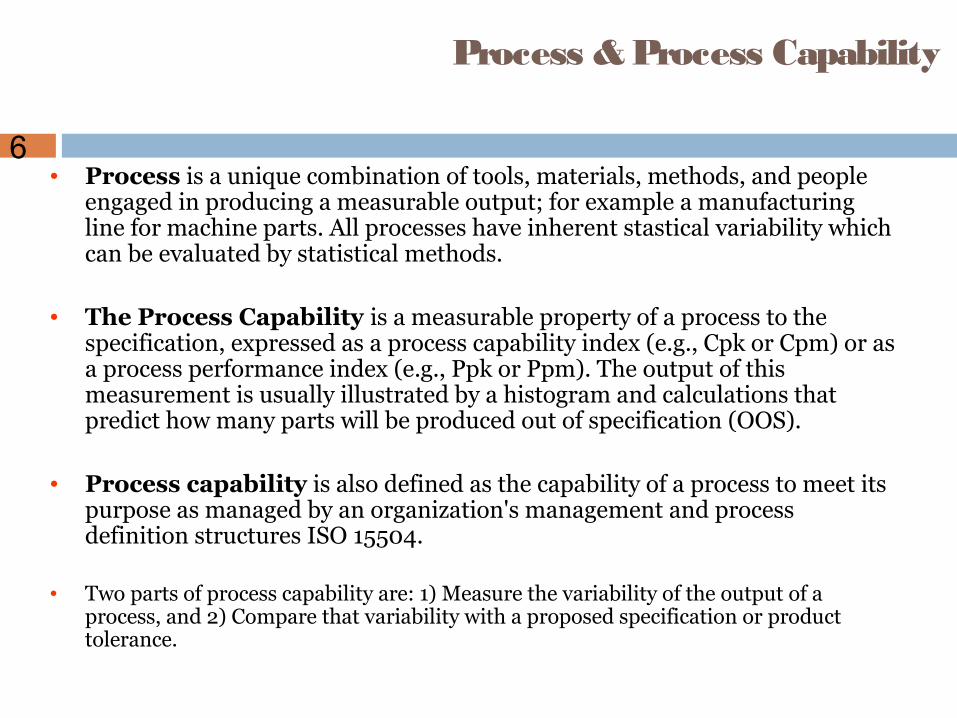
Process & Process Capability
• Process is a unique combination of tools, materials, methods, and people engaged in producing a measurable output; for example a manufacturing line for machine parts. All processes have inherent stastical variability which can be evaluated by statistical methods.
• The Process Capability is a measurable property of a process to the specification, expressed as a process capability index (e.g., Cpk or Cpm) or as a process performance index (e.g., Ppk or Ppm). The output of this measurement is usually illustrated by a histogram and calculations that predict how many parts will be produced out of specification (OOS).
• Process capability is also defined as the capability of a process to meet its purpose as managed by an organization's management and process definition structures ISO 15504.
• Two parts of process capability are: 1) Measure the variability of the output of a process, and 2) Compare that variability with a proposed specification or product tolerance.
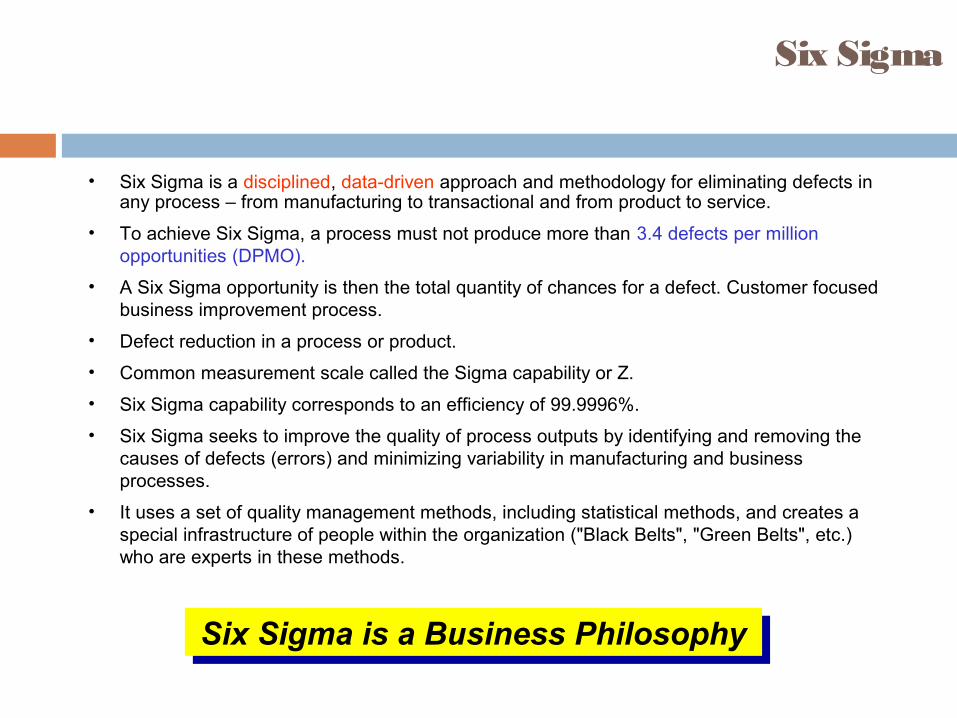
Six Sigma is a Business PhilosophySix Sigma is a Business Philosophy
Six Sigma
• Six Sigma is a disciplined, data-driven approach and methodology for eliminating defects in any process – from manufacturing to transactional and from product to service.
• To achieve Six Sigma, a process must not produce more than 3.4 defects per million opportunities (DPMO).
• A Six Sigma opportunity is then the total quantity of chances for a defect. Customer focused business improvement process.
• Defect reduction in a process or product.
• Common measurement scale called the Sigma capability or Z.
• Six Sigma capability corresponds to an efficiency of 99.9996%.
• Six Sigma seeks to improve the quality of process outputs by identifying and removing the causes of defects (errors) and minimizing variability in manufacturing and business processes.
• It uses a set of quality management methods, including statistical methods, and creates a special infrastructure of people within the organization ("Black Belts", "Green Belts", etc.) who are experts in these methods.
8
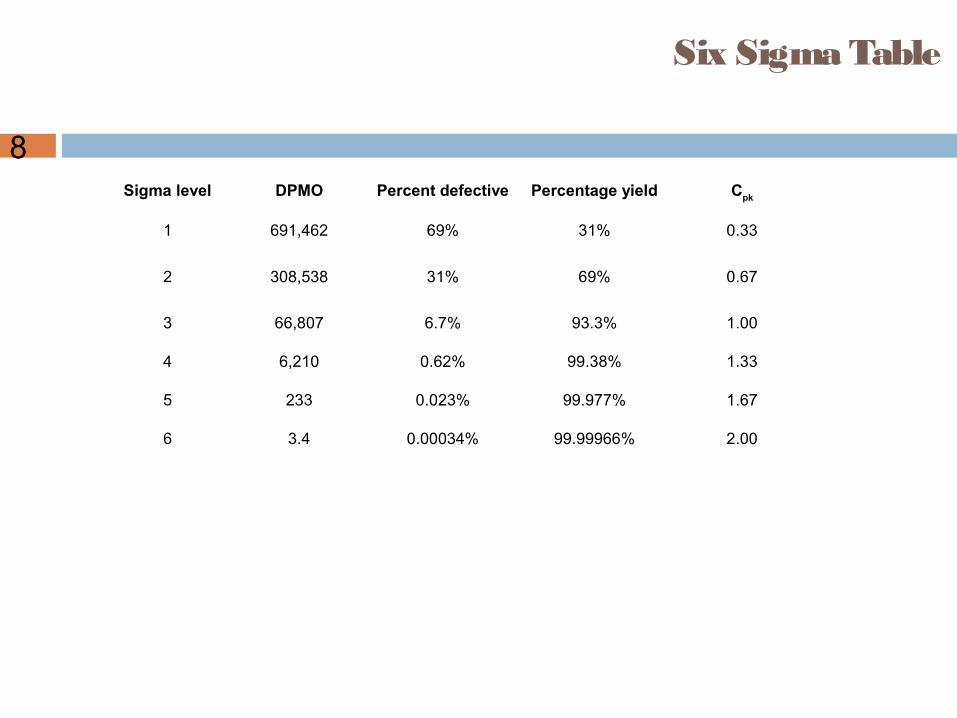
Six Sigma Table
Sigma level DPMO Percent defective Percentage yield Cpk
1 691,462 69% 31% 0.33
2 308,538 31% 69% 0.67
3 66,807 6.7% 93.3% 1.00
4 6,210 0.62% 99.38% 1.33
5 233 0.023% 99.977% 1.67
6 3.4 0.00034% 99.99966% 2.00
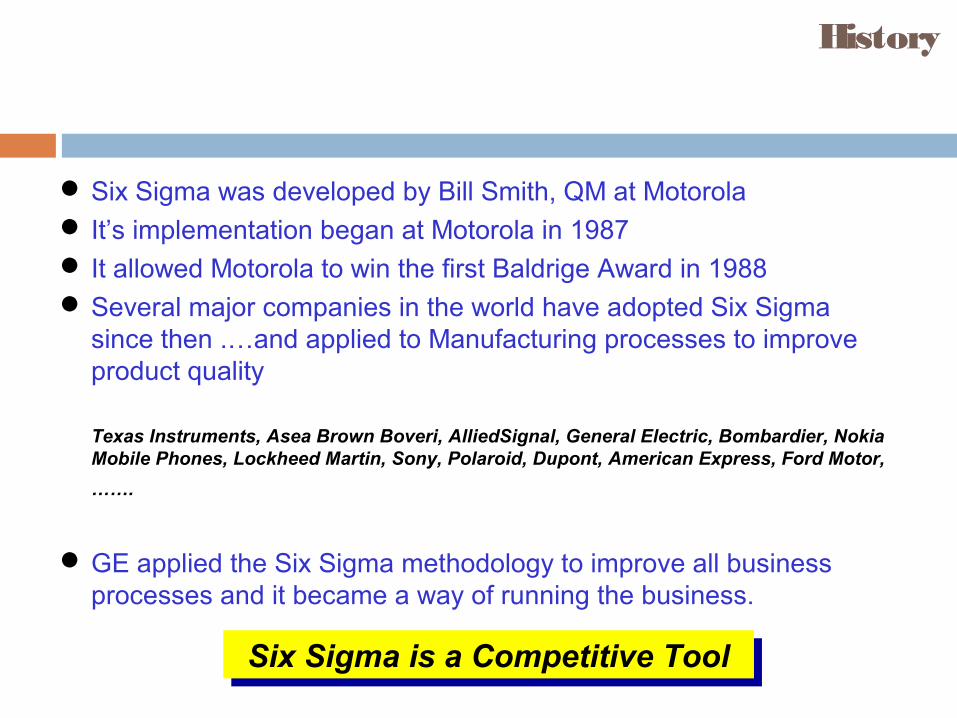
Six Sigma was developed by Bill Smith, QM at Motorola It’s implementation began at Motorola in 1987 It allowed Motorola to win the first Baldrige Award in 1988 Several major companies in the world have adopted Six Sigma
since then .…and applied to Manufacturing processes to improve product quality
Texas Instruments, Asea Brown Boveri, AlliedSignal, General Electric, Bombardier, Nokia Mobile Phones, Lockheed Martin, Sony, Polaroid, Dupont, American Express, Ford Motor,
…….
GE applied the Six Sigma methodology to improve all business processes and it became a way of running the business.
Six Sigma is a Competitive ToolSix Sigma is a Competitive Tool
History
10
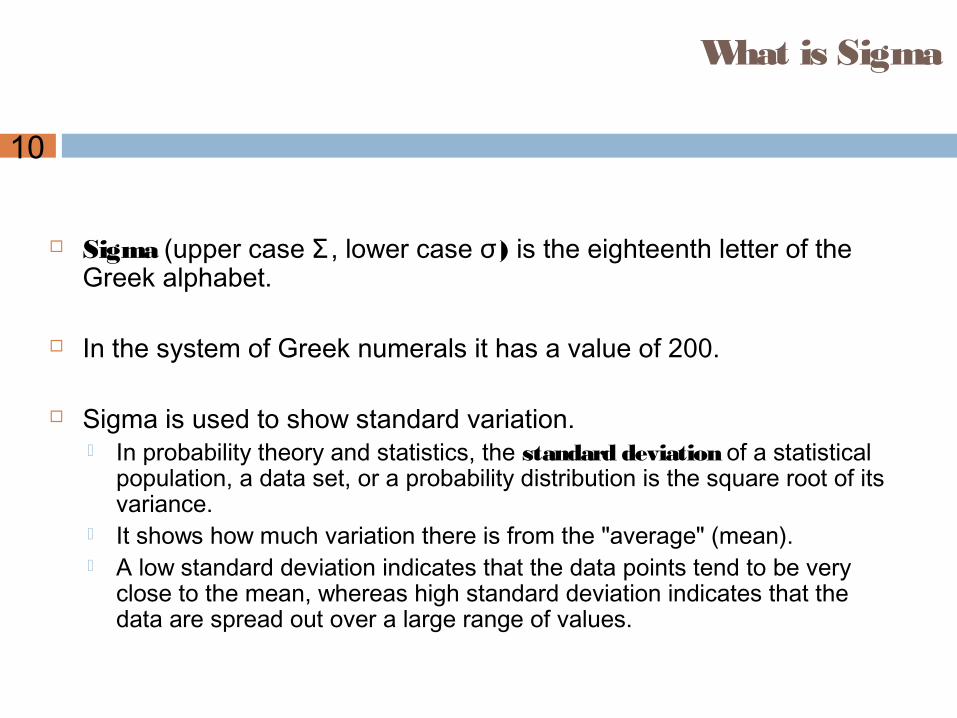
What is Sigma
Sigma (upper case Σ, lower case )σ is the eighteenth letter of the Greek alphabet.
In the system of Greek numerals it has a value of 200.
Sigma is used to show standard variation. In probability theory and statistics, the standard deviation of a statistical
population, a data set, or a probability distribution is the square root of its variance.
It shows how much variation there is from the "average" (mean). A low standard deviation indicates that the data points tend to be very
close to the mean, whereas high standard deviation indicates that the data are spread out over a large range of values.
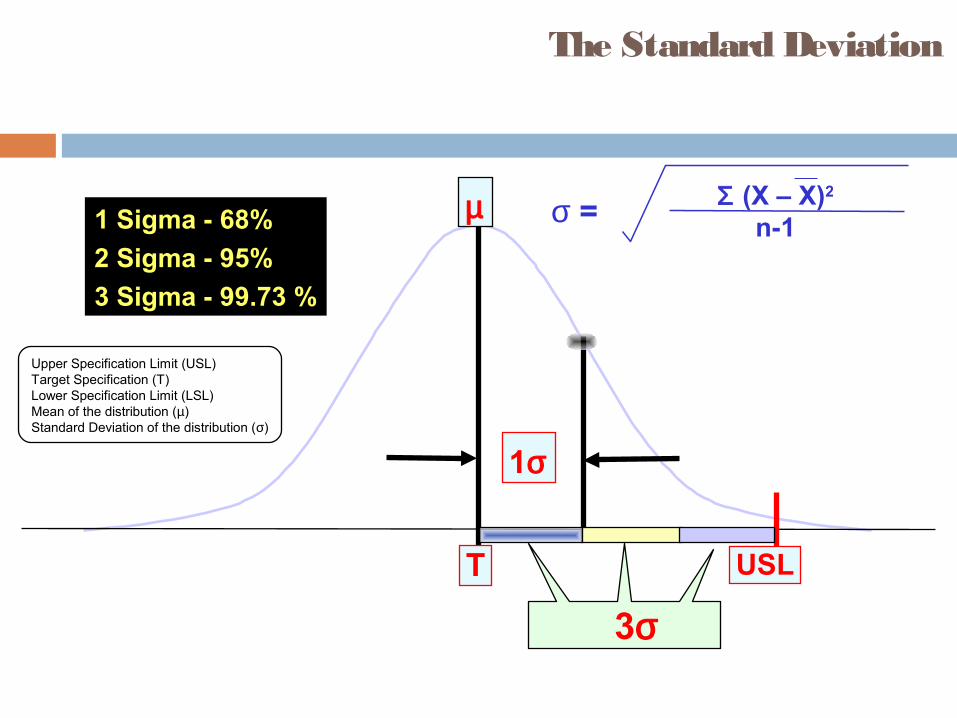
The Standard Deviation
µ
1σ
T USL
Upper Specification Limit (USL)Target Specification (T)Lower Specification Limit (LSL)Mean of the distribution (µ)Standard Deviation of the distribution (σ)
3σ
1 Sigma - 68%
2 Sigma - 95%
3 Sigma - 99.73 %
Σ (X – X)2
n-1σ =
Target
CustomerSpecification
Target CustomerSpecification
1σ
2σ
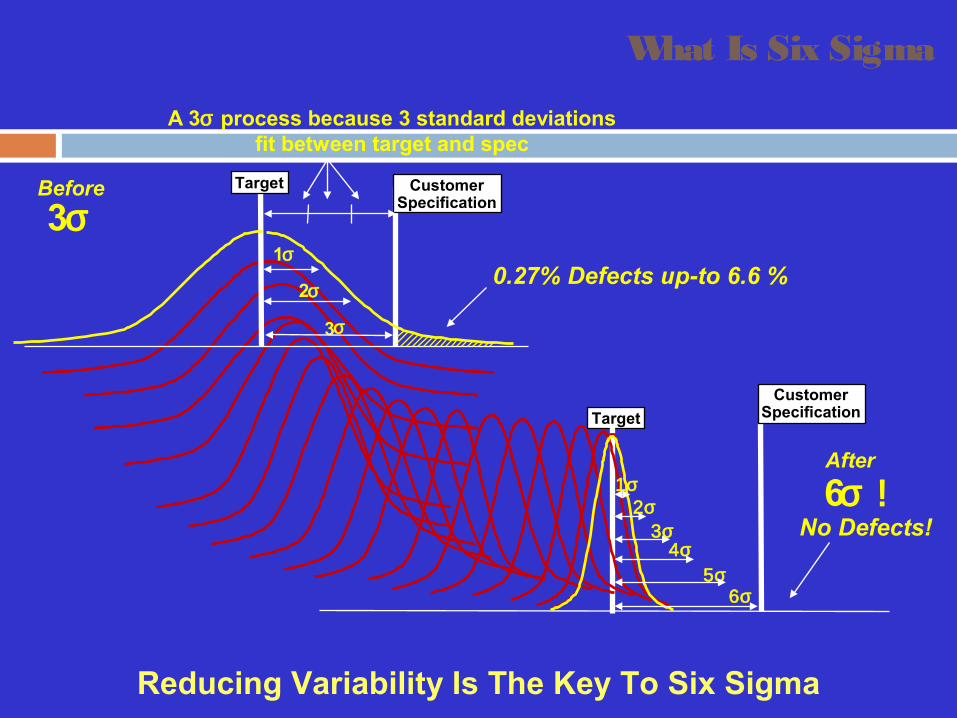
3σ
A 3σ process because 3 standard deviationsfit between target and spec
3σ
0.27% Defects up-to 6.6 %
Before
What Is Six Sigma
1σ2σ
3σ4σ
5σ6σ
After
6σ !No Defects!
Reducing Variability Is The Key To Six Sigma
13
Six Sigma -Tools
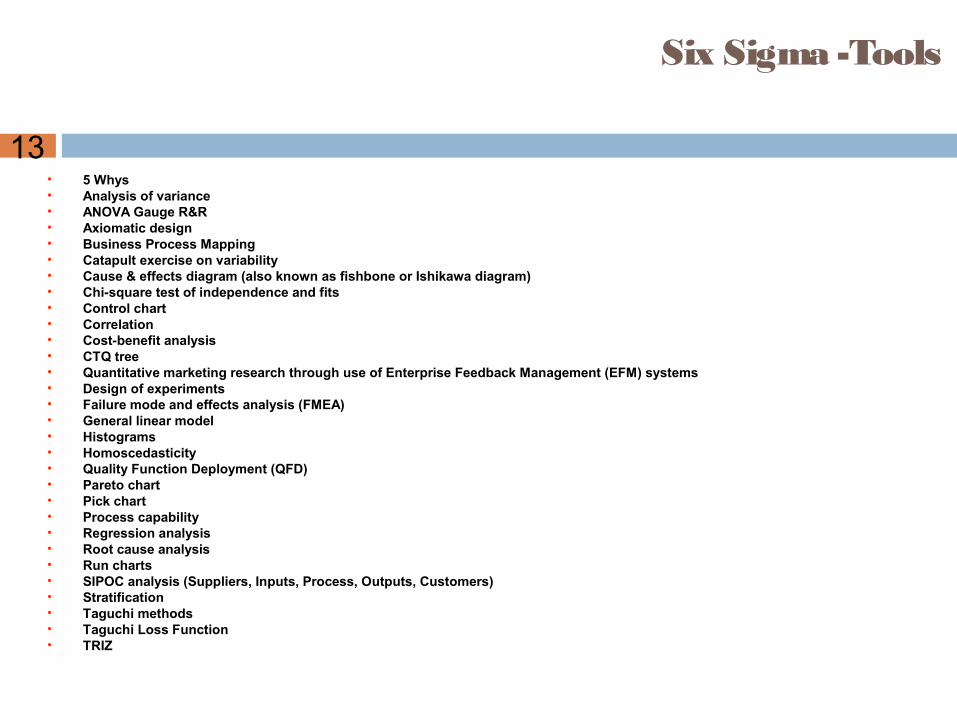
• 5 Whys • Analysis of variance• ANOVA Gauge R&R • Axiomatic design• Business Process Mapping• Catapult exercise on variability • Cause & effects diagram (also known as fishbone or Ishikawa diagram) • Chi-square test of independence and fits • Control chart• Correlation• Cost-benefit analysis• CTQ tree• Quantitative marketing research through use of Enterprise Feedback Management (EFM) systems • Design of experiments• Failure mode and effects analysis (FMEA) • General linear model• Histograms• Homoscedasticity• Quality Function Deployment (QFD) • Pareto chart• Pick chart• Process capability• Regression analysis• Root cause analysis • Run charts• SIPOC analysis (Suppliers, Inputs, Process, Outputs, Customers) • Stratification • Taguchi methods• Taguchi Loss Function• TRIZ
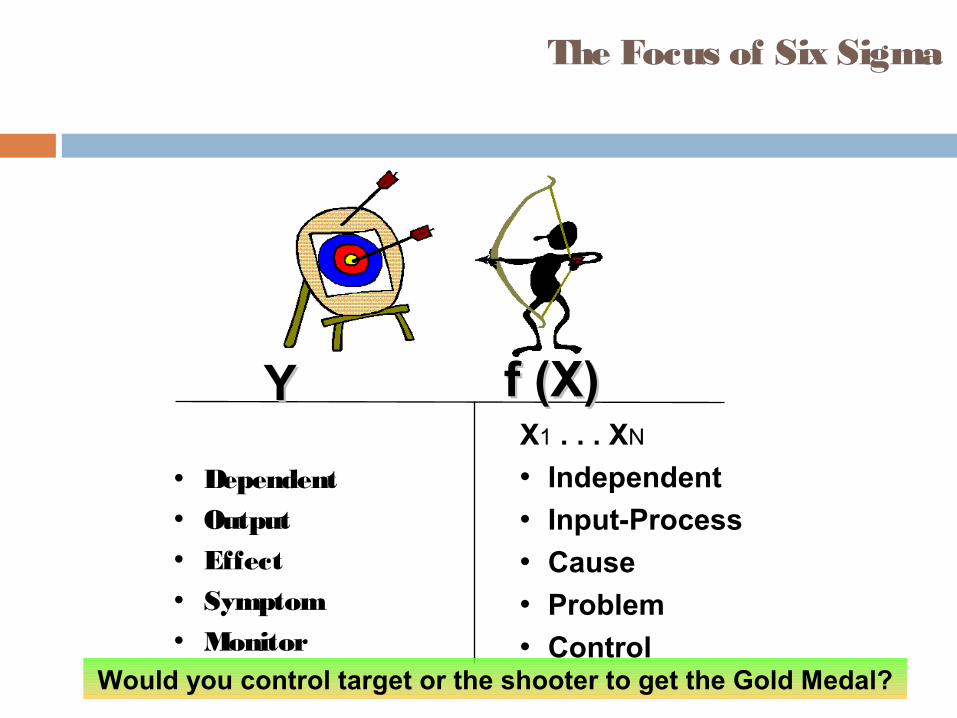
The Focus of Six Sigma
• Dependent• Output• Effect• Symptom• Monitor
X1 . . . XN
• Independent
• Input-Process
• Cause
• Problem
• Control
f (X)f (X)YY
Would you control target or the shooter to get the Gold Medal?
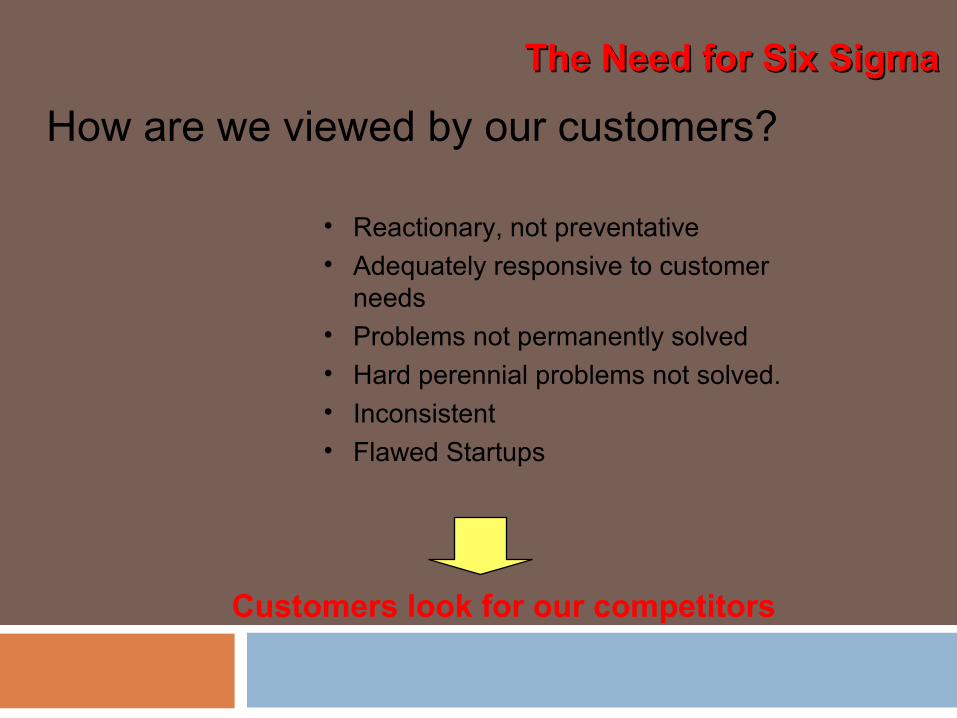
How are we viewed by our customers?
• Reactionary, not preventative• Adequately responsive to customer
needs• Problems not permanently solved• Hard perennial problems not solved. • Inconsistent• Flawed Startups
Customers look for our competitors
The Need for Six SigmaThe Need for Six Sigma
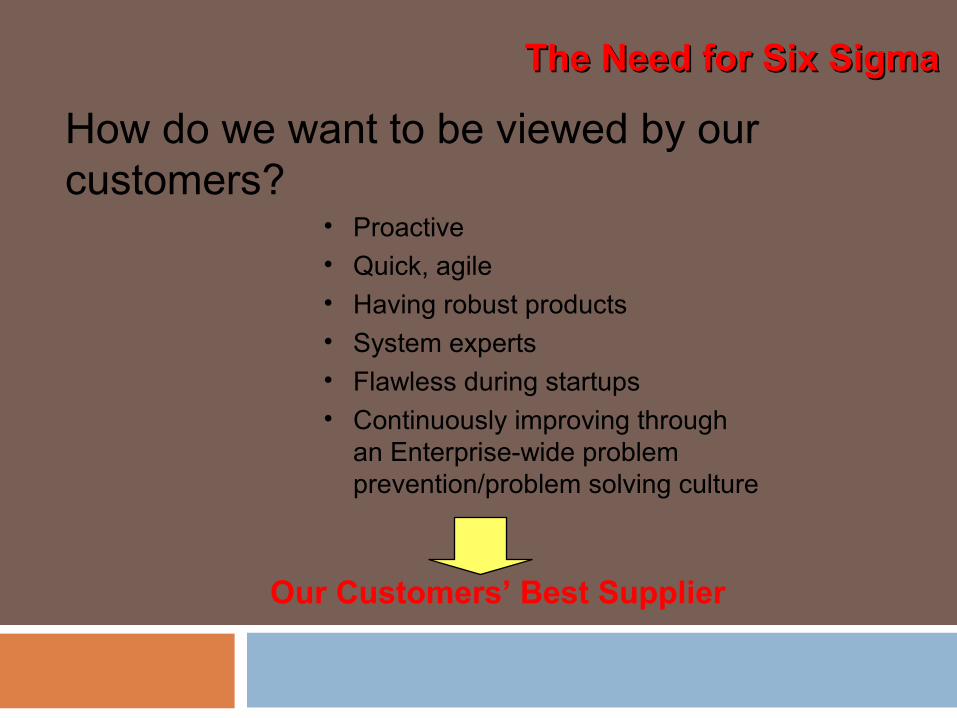
How do we want to be viewed by our customers?
• Proactive• Quick, agile• Having robust products• System experts• Flawless during startups• Continuously improving through
an Enterprise-wide problem prevention/problem solving culture
Our Customers’ Best Supplier
The Need for Six SigmaThe Need for Six Sigma
17
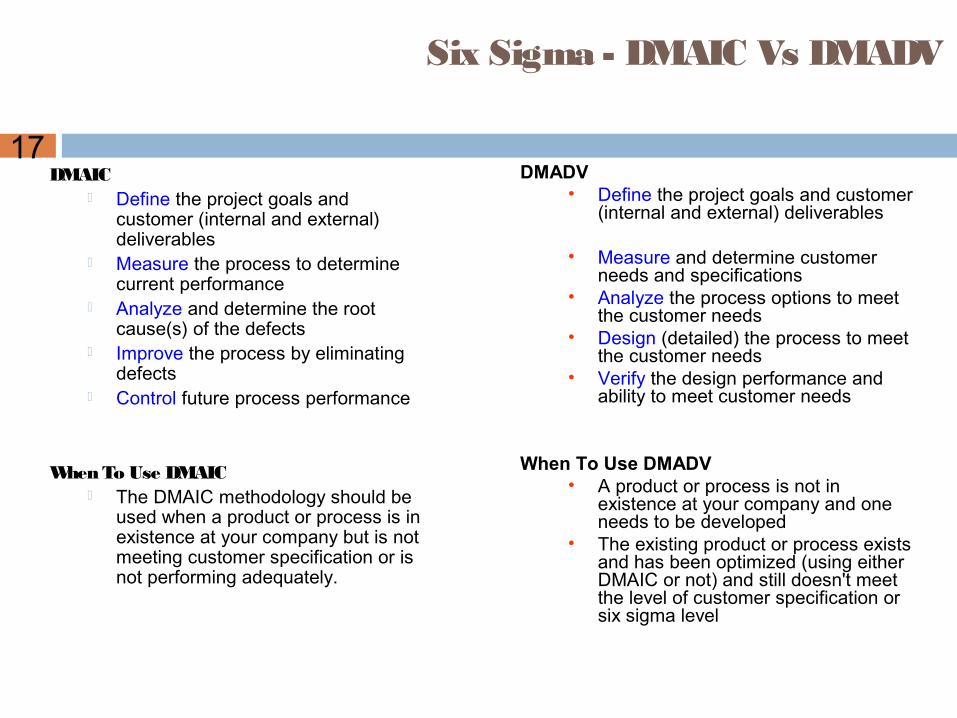
Six Sigma - DMAIC Vs DMADV
DMAIC Define the project goals and
customer (internal and external) deliverables
Measure the process to determine current performance
Analyze and determine the root cause(s) of the defects
Improve the process by eliminating defects
Control future process performance
When To Use DMAIC The DMAIC methodology should be
used when a product or process is in existence at your company but is not meeting customer specification or is not performing adequately.
DMADV • Define the project goals and customer
(internal and external) deliverables
• Measure and determine customer needs and specifications
• Analyze the process options to meet the customer needs
• Design (detailed) the process to meet the customer needs
• Verify the design performance and ability to meet customer needs
When To Use DMADV• A product or process is not in
existence at your company and one needs to be developed
• The existing product or process exists and has been optimized (using either DMAIC or not) and still doesn't meet the level of customer specification or six sigma level
18
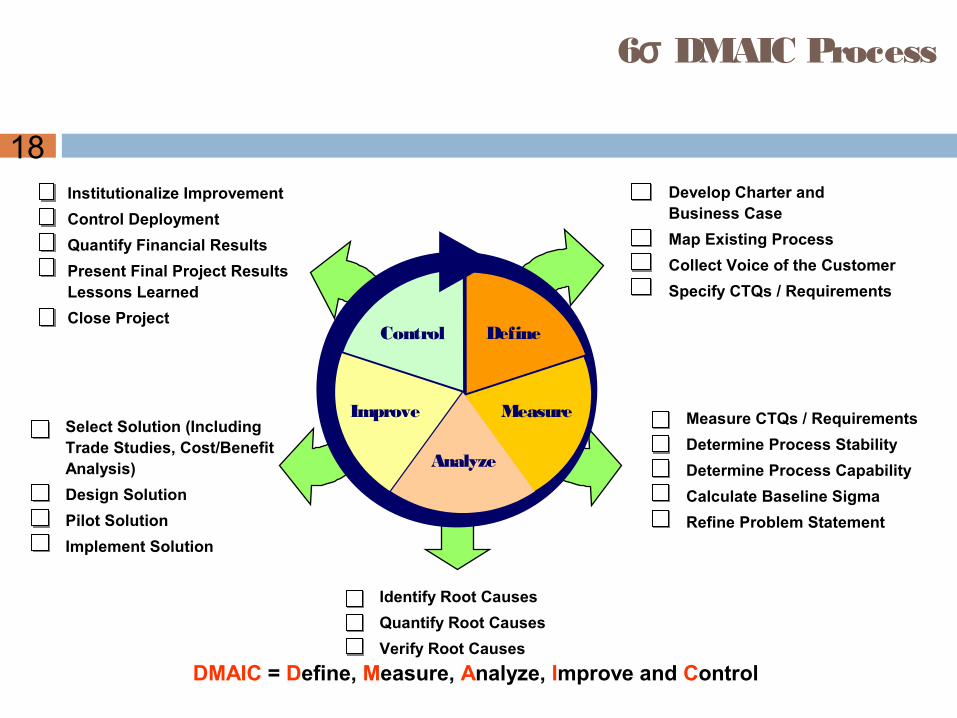
6σ DMAIC Process
Develop Charter and Business Case
Map Existing Process
Collect Voice of the Customer
Specify CTQs / Requirements
Measure CTQs / Requirements
Determine Process Stability
Determine Process Capability
Calculate Baseline Sigma
Refine Problem Statement
Identify Root Causes
Quantify Root Causes
Verify Root Causes
Institutionalize Improvement
Control Deployment
Quantify Financial Results
Present Final Project Results and Lessons Learned
Close Project
Select Solution (Including Trade Studies, Cost/Benefit Analysis)
Design Solution
Pilot Solution
Implement Solution
Define
Measure
Analyze
Improve
Control
DMAIC = Define, Measure, Analyze, Improve and Control
19
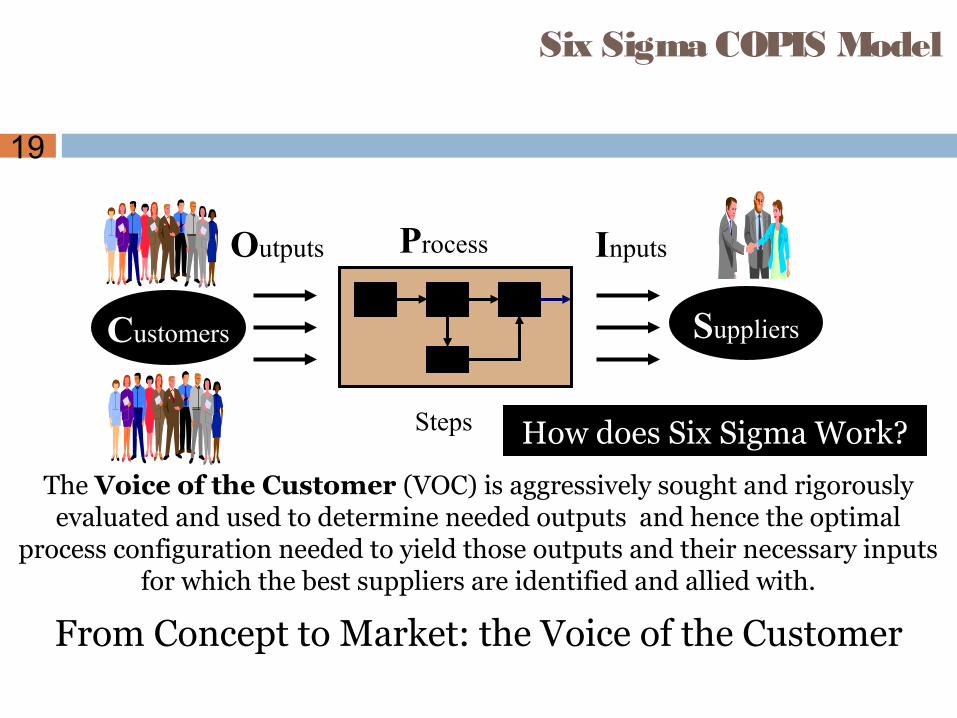
Six Sigma COPIS Model
Customers Suppliers
Outputs InputsProcess
Steps
The Voice of the Customer (VOC) is aggressively sought and rigorously evaluated and used to determine needed outputs and hence the optimal
process configuration needed to yield those outputs and their necessary inputs for which the best suppliers are identified and allied with.
From Concept to Market: the Voice of the Customer
How does Six Sigma Work?
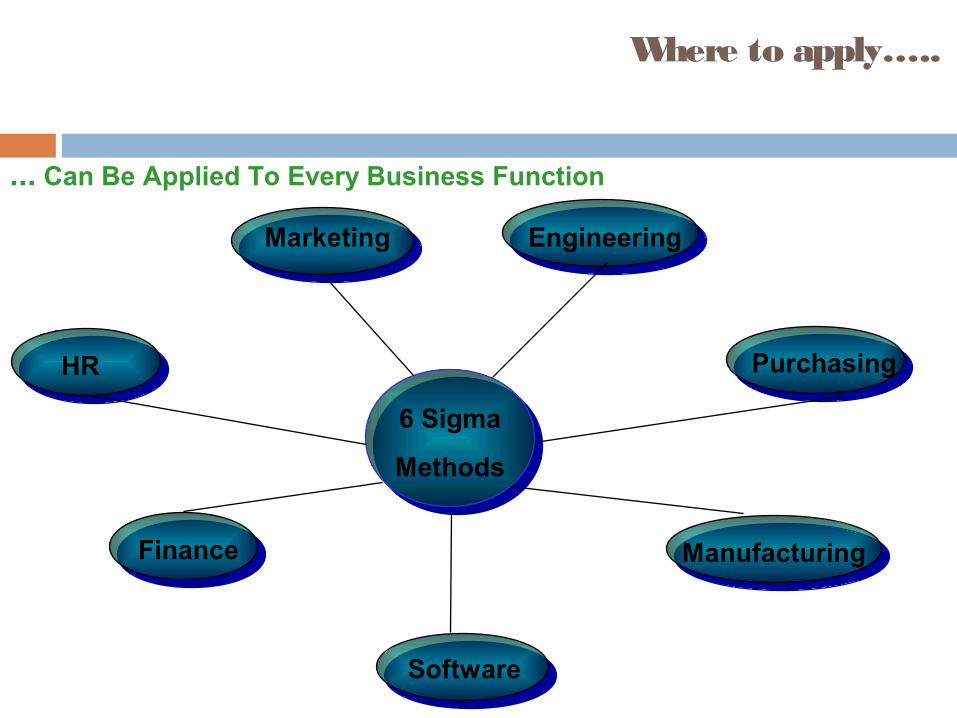
6 Sigma
Methods
Manufacturing
EngineeringMarketing
Purchasing
Software
HR
Finance
... Can Be Applied To Every Business Function
Where to apply…..
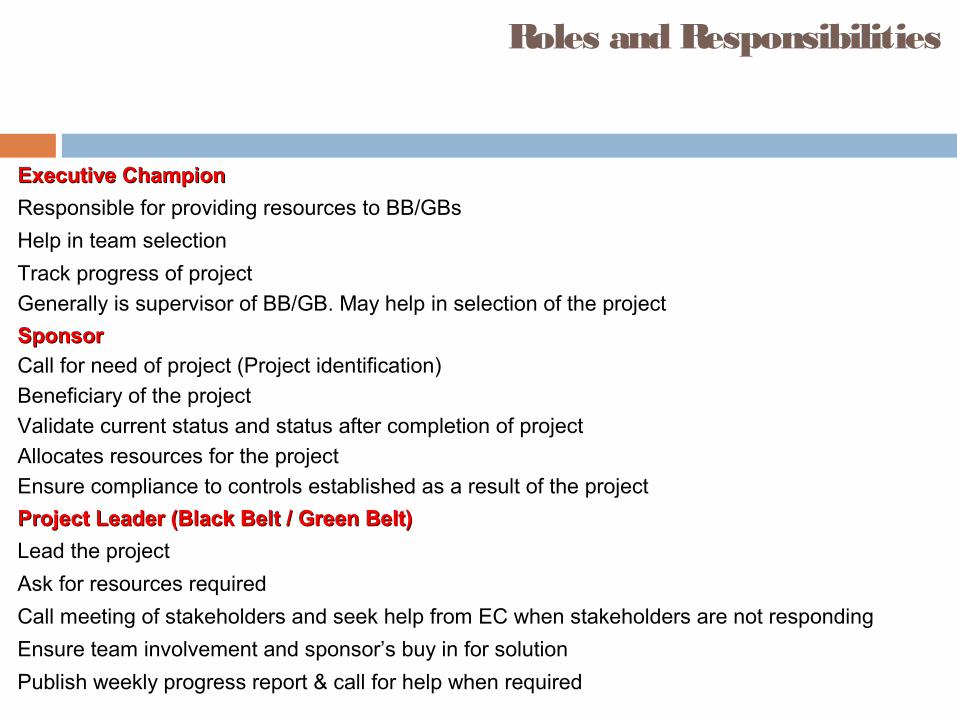
Executive ChampionExecutive Champion
Responsible for providing resources to BB/GBs
Help in team selection
Track progress of project
Generally is supervisor of BB/GB. May help in selection of the project
SponsorSponsor
Call for need of project (Project identification)
Beneficiary of the project
Validate current status and status after completion of project
Allocates resources for the project
Ensure compliance to controls established as a result of the project
Project Leader (Black Belt / Green Belt)Project Leader (Black Belt / Green Belt)
Lead the project
Ask for resources required
Call meeting of stakeholders and seek help from EC when stakeholders are not responding
Ensure team involvement and sponsor’s buy in for solution
Publish weekly progress report & call for help when required
Roles and Responsibilities
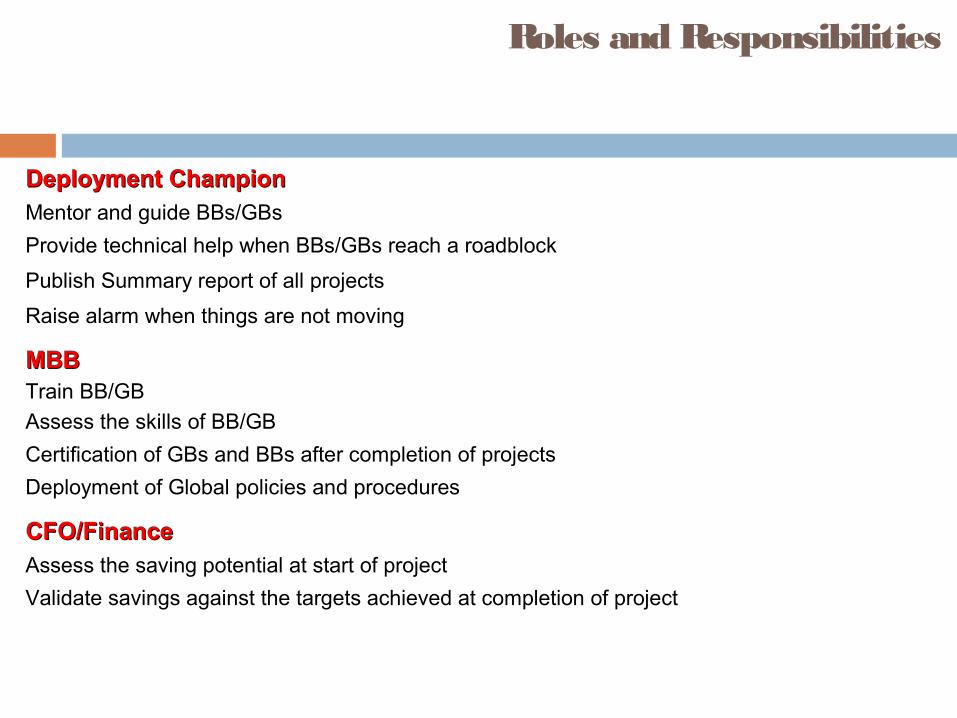
Deployment ChampionDeployment ChampionMentor and guide BBs/GBs
Provide technical help when BBs/GBs reach a roadblock
Publish Summary report of all projects
Raise alarm when things are not moving
MBBMBBTrain BB/GB
Assess the skills of BB/GB
Certification of GBs and BBs after completion of projects
Deployment of Global policies and procedures
CFO/FinanceCFO/FinanceAssess the saving potential at start of project
Validate savings against the targets achieved at completion of project
Roles and Responsibilities
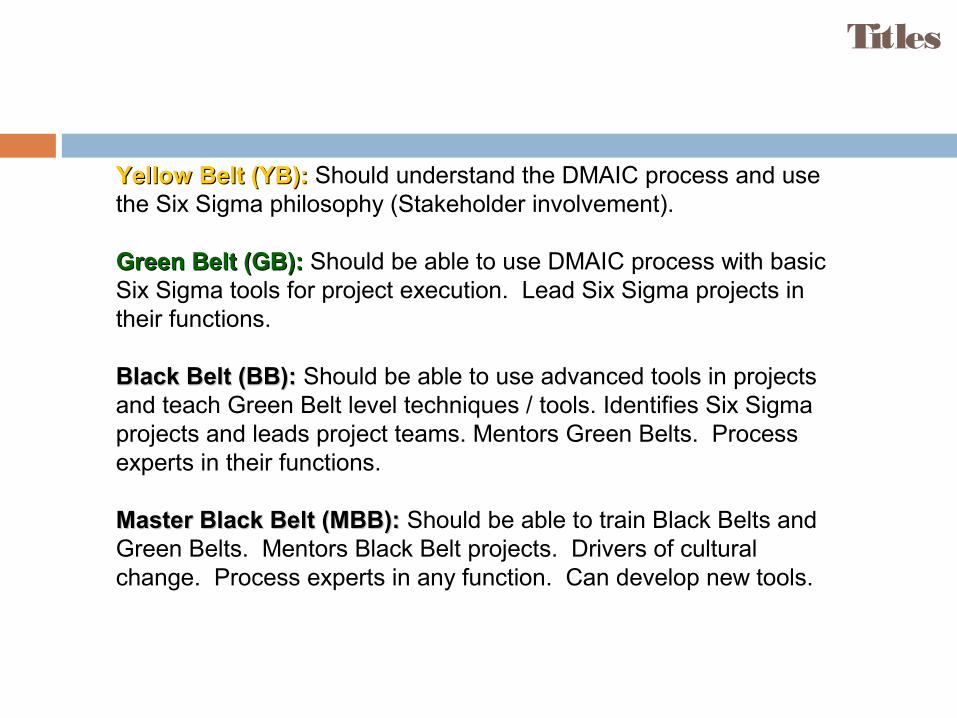
Titles
Yellow Belt (YB):Yellow Belt (YB): Should understand the DMAIC process and use the Six Sigma philosophy (Stakeholder involvement).
Green Belt (GB):Green Belt (GB): Should be able to use DMAIC process with basic Six Sigma tools for project execution. Lead Six Sigma projects in their functions.
Black Belt (BB):Black Belt (BB): Should be able to use advanced tools in projects and teach Green Belt level techniques / tools. Identifies Six Sigma projects and leads project teams. Mentors Green Belts. Process experts in their functions.
Master Black Belt (MBB):Master Black Belt (MBB): Should be able to train Black Belts and Green Belts. Mentors Black Belt projects. Drivers of cultural change. Process experts in any function. Can develop new tools.
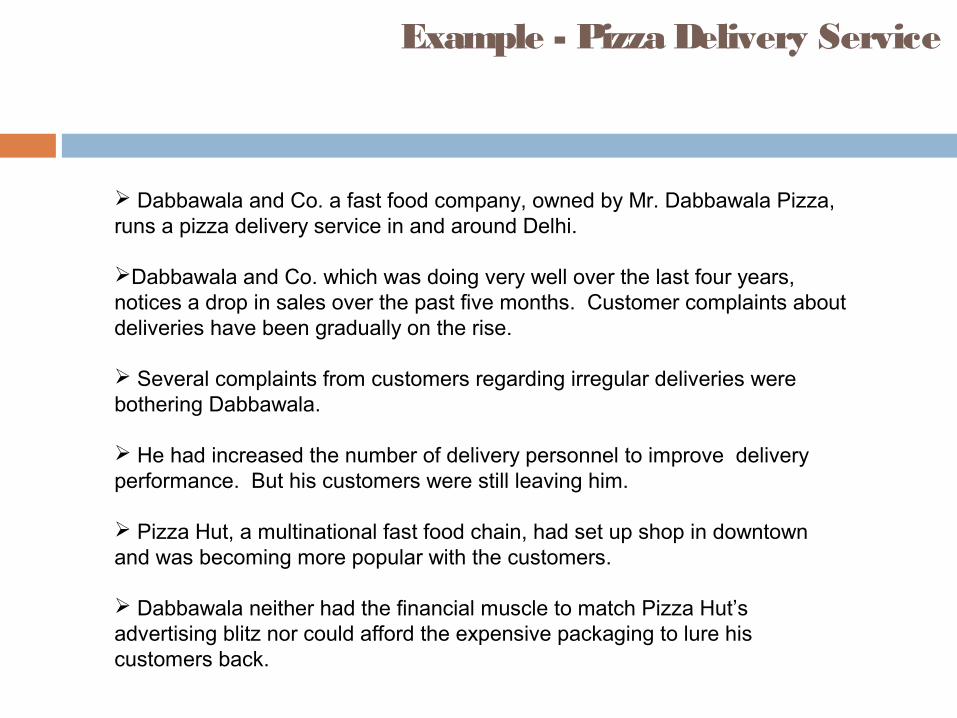
Example - Pizza Delivery Service
Dabbawala and Co. a fast food company, owned by Mr. Dabbawala Pizza, runs a pizza delivery service in and around Delhi. Dabbawala and Co. which was doing very well over the last four years, notices a drop in sales over the past five months. Customer complaints about deliveries have been gradually on the rise.
Several complaints from customers regarding irregular deliveries were bothering Dabbawala.
He had increased the number of delivery personnel to improve delivery performance. But his customers were still leaving him.
Pizza Hut, a multinational fast food chain, had set up shop in downtown and was becoming more popular with the customers.
Dabbawala neither had the financial muscle to match Pizza Hut’s advertising blitz nor could afford the expensive packaging to lure his customers back.
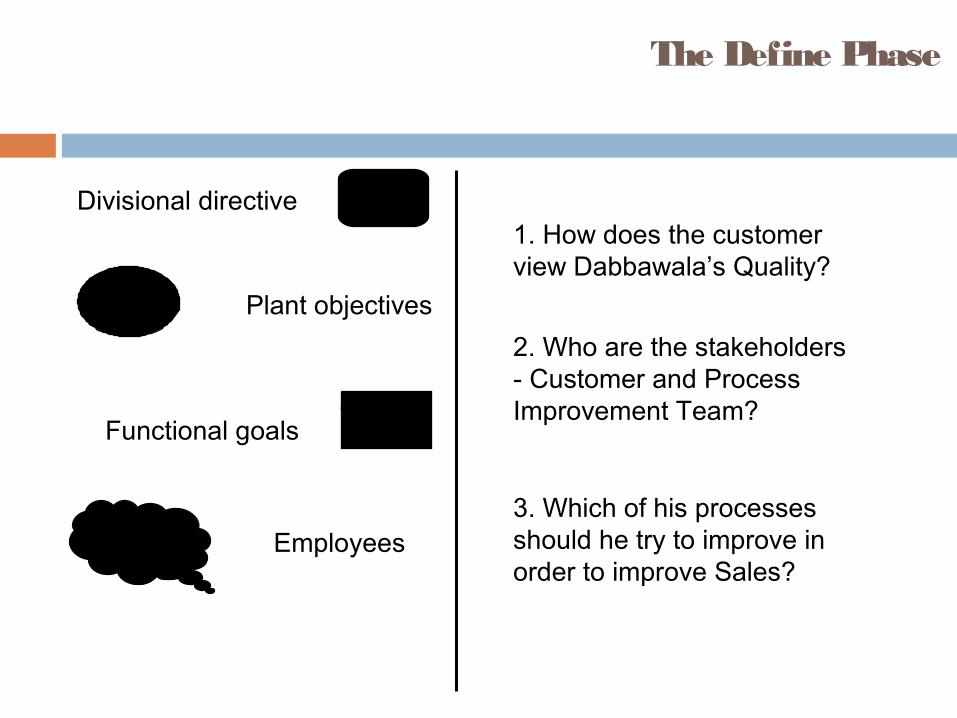
1. How does the customer view Dabbawala’s Quality?
2. Who are the stakeholders - Customer and Process Improvement Team?
3. Which of his processes should he try to improve in order to improve Sales?
The Define Phase
Grow revenues
ImproveSales
So what’s new
Get moreorders
Divisional directive
Plant objectives
Functional goals
Employees
A. IDENTIFY PROJECT CTQs:
A requirement of the customer is that the Pizza should be delivered on time. Thus for the customer, Delivery Delivery is Critical to Critical to the Qualitythe Quality of Dabbawala’s service (CTQCTQ).
Voice of Customer (VOC) Affinity Diagram CTQ Tree.
The Define Phase - Step A
B. DEVELOP TEAM CHARTER:
The Business CaseWhy should the project be done
Problem and Goal StatementDescription of the problem/opportunity
Roles and ResponsibilitiesThe team, expectations and responsibilities
Stakeholder Analysis, TMAP, Gantt Chart
The Define Phase - Step B
C. DEFINE PROJECT SCOPE:
Identify the high level process to be improvedDefine boundaries of project
SIPOCStratification AnalysisContract Sheet
The Define Phase - Step C
The 7 Basic Tools - 1
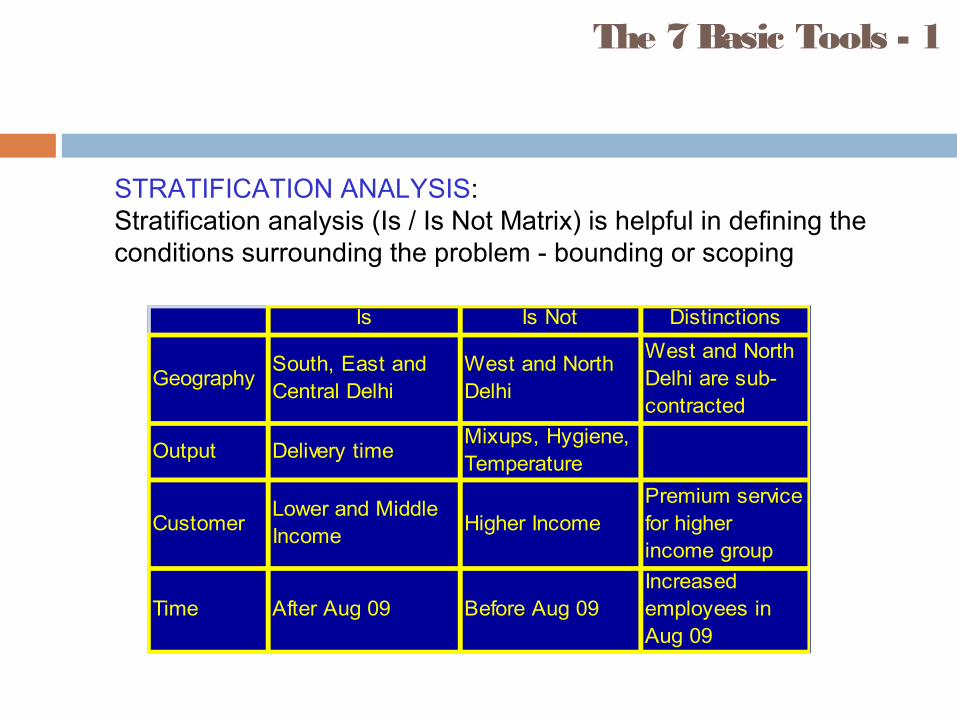
STRATIFICATION ANALYSIS:Stratification analysis (Is / Is Not Matrix) is helpful in defining the conditions surrounding the problem - bounding or scoping
Is Is Not Distinctions
GeographySouth, East and Central Delhi
West and North Delhi
West and North Delhi are sub-contracted
Output Delivery timeMixups, Hygiene, Temperature
CustomerLower and Middle Income
Higher IncomePremium service for higher income group
Time After Aug 09 Before Aug 09Increased employees in Aug 09
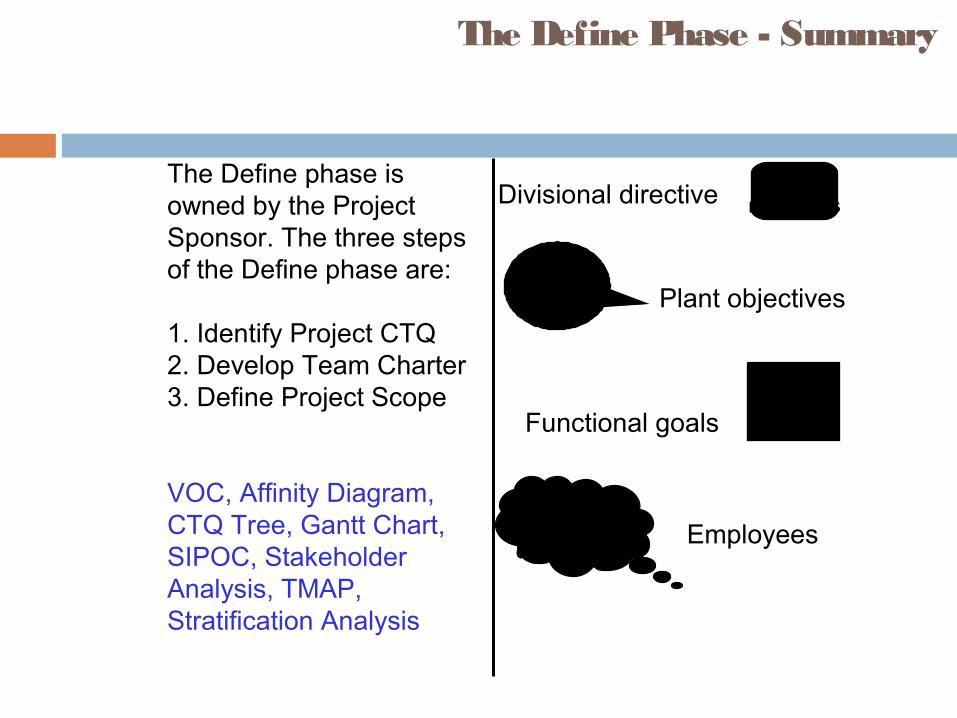
The Define Phase - Summary
The Define phase is owned by the Project Sponsor. The three steps of the Define phase are:
1. Identify Project CTQ2. Develop Team Charter3. Define Project Scope
VOC, Affinity Diagram, CTQ Tree, Gantt Chart, SIPOC, Stakeholder Analysis, TMAP, Stratification Analysis
Grow revenues
Widen Customer
Base
Reducevariation in
delivery time
ImproveDeliveryprocess
Divisional directive
Plant objectives
Functional goals
Employees
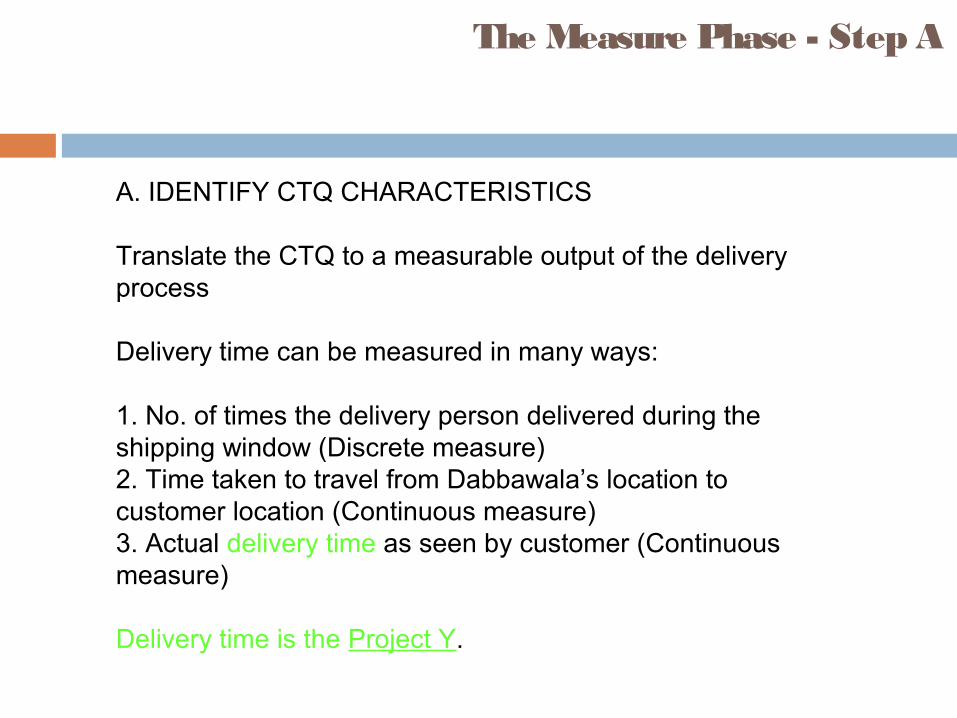
A. IDENTIFY CTQ CHARACTERISTICS
Translate the CTQ to a measurable output of the delivery process
Delivery time can be measured in many ways:
1. No. of times the delivery person delivered during the shipping window (Discrete measure)2. Time taken to travel from Dabbawala’s location to customer location (Continuous measure)3. Actual delivery time as seen by customer (Continuous measure)
Delivery time is the Project Y.
The Measure Phase - Step A
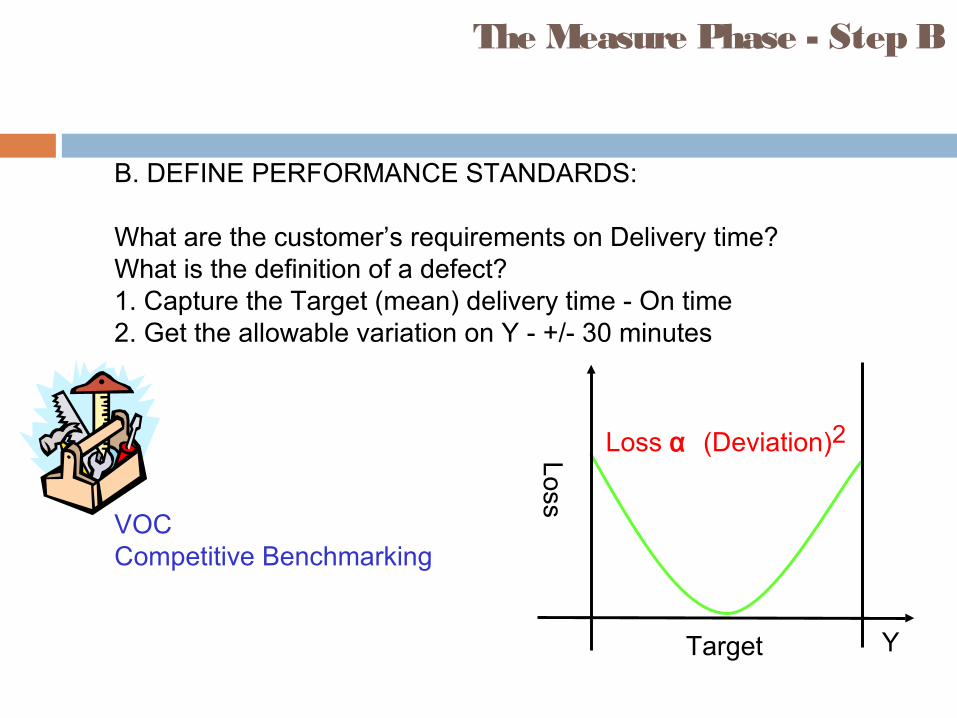
B. DEFINE PERFORMANCE STANDARDS:
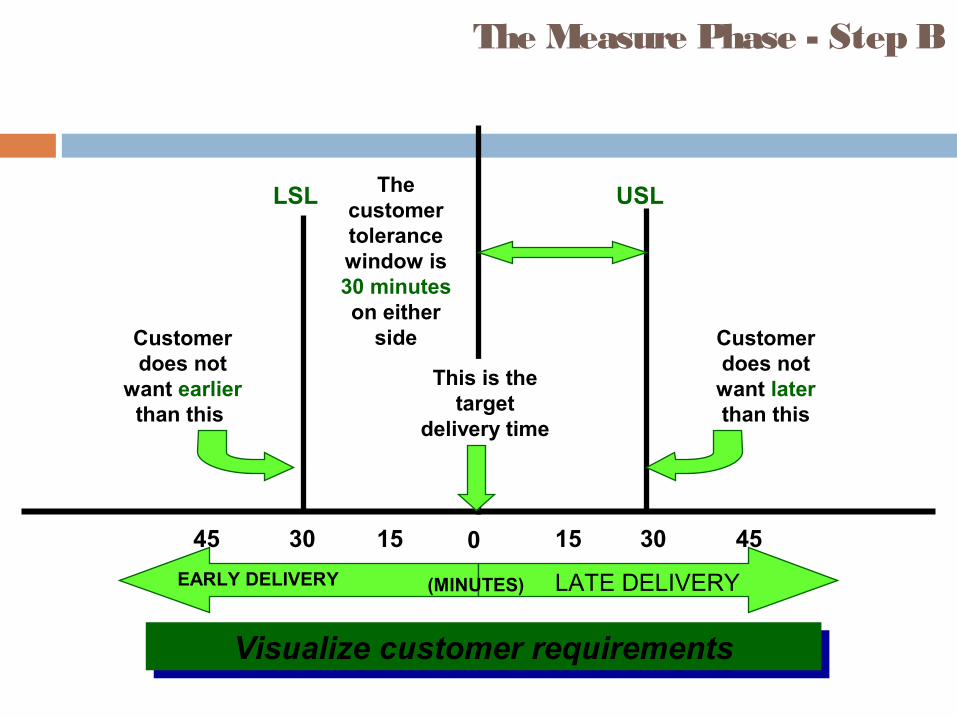
What are the customer’s requirements on Delivery time?What is the definition of a defect?1. Capture the Target (mean) delivery time - On time2. Get the allowable variation on Y - +/- 30 minutes
VOCCompetitive Benchmarking
The Measure Phase - Step B
Target
Loss
Y
Loss α (Deviation)2
LATE DELIVERY
153045 15 30 450
LSL USL
Visualize customer requirementsVisualize customer requirements
Customer does not
want earlier than this
The customer tolerance window is 30 minutes on either
side
This is the target
delivery time
EARLY DELIVERY (MINUTES)
Customer does not want later than this
The Measure Phase - Step B
The Measure Phase - Step B
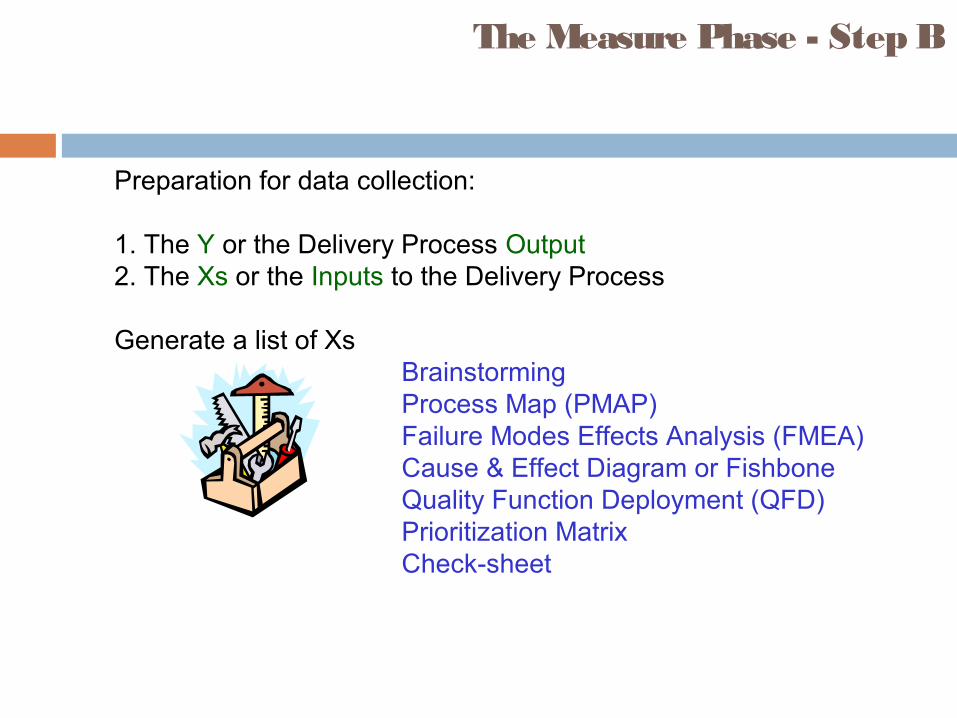
Preparation for data collection:
1. The Y or the Delivery Process Output2. The Xs or the Inputs to the Delivery Process
Generate a list of XsBrainstorming Process Map (PMAP)Failure Modes Effects Analysis (FMEA)Cause & Effect Diagram or FishboneQuality Function Deployment (QFD)Prioritization MatrixCheck-sheet
The 7 Basic Tools - 2
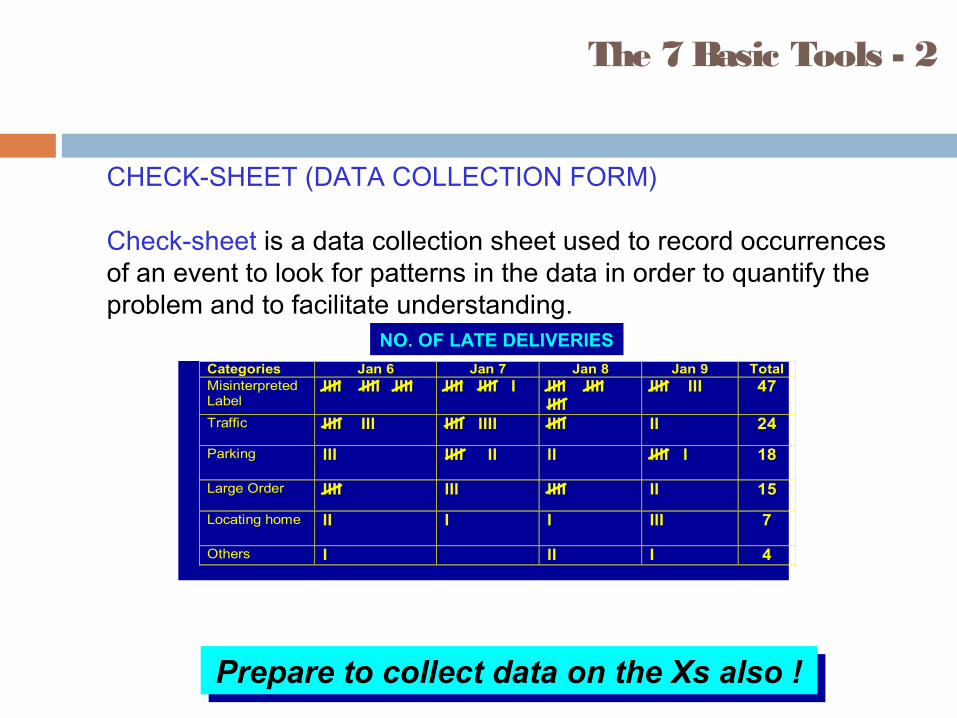
CHECK-SHEET (DATA COLLECTION FORM)
Check-sheet is a data collection sheet used to record occurrences of an event to look for patterns in the data in order to quantify the problem and to facilitate understanding.
Categories Jan 6 Jan 7 Jan 8 Jan 9 TotalMisinterpretedLabel
llll llll llll llll llll l llll llllllll
llll lll 47
Traffic llll lll llll llll llll ll 24
Parking lll llll ll ll llll l 18
Large Order llll lll llll ll 15
Locating home ll l l lll 7
Others l ll l 4
NO. OF LATE DELIVERIES
Prepare to collect data on the Xs also !Prepare to collect data on the Xs also !
The Measure Phase - Step C
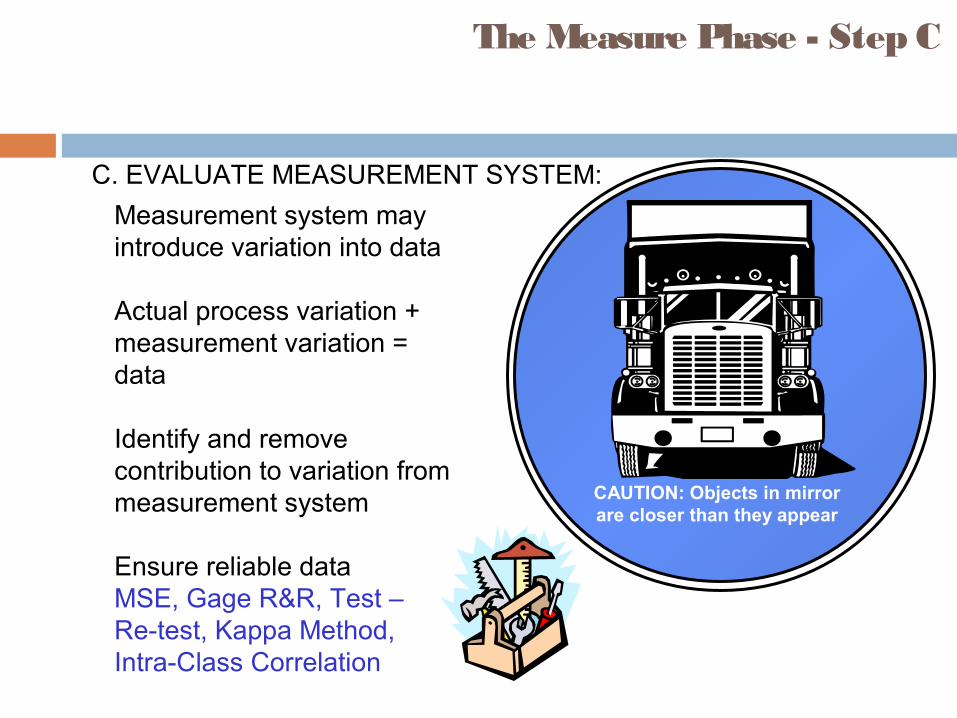
C. EVALUATE MEASUREMENT SYSTEM:
CAUTION: Objects in mirror are closer than they appear
Measurement system mayintroduce variation into data
Actual process variation + measurement variation = data
Identify and remove contribution to variation from measurement system
Ensure reliable dataMSE, Gage R&R, Test – Re-test, Kappa Method, Intra-Class Correlation
The Measure Phase - Summary
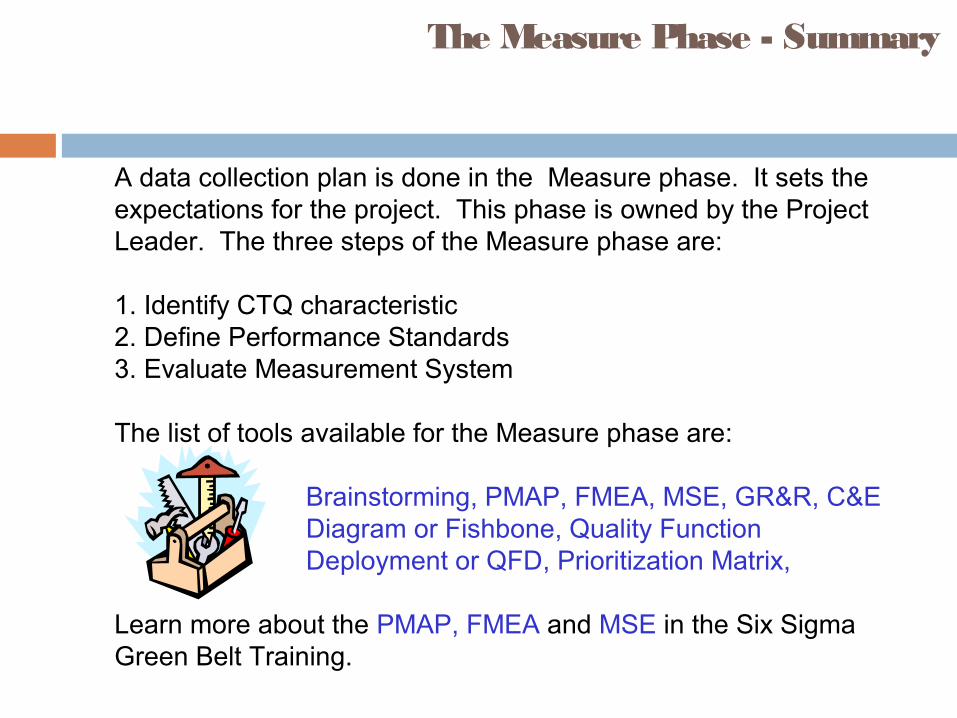
A data collection plan is done in the Measure phase. It sets the expectations for the project. This phase is owned by the Project Leader. The three steps of the Measure phase are:
1. Identify CTQ characteristic2. Define Performance Standards3. Evaluate Measurement System
The list of tools available for the Measure phase are:
Brainstorming, PMAP, FMEA, MSE, GR&R, C&E Diagram or Fishbone, Quality Function Deployment or QFD, Prioritization Matrix,
Learn more about the PMAP, FMEA and MSE in the Six Sigma Green Belt Training.
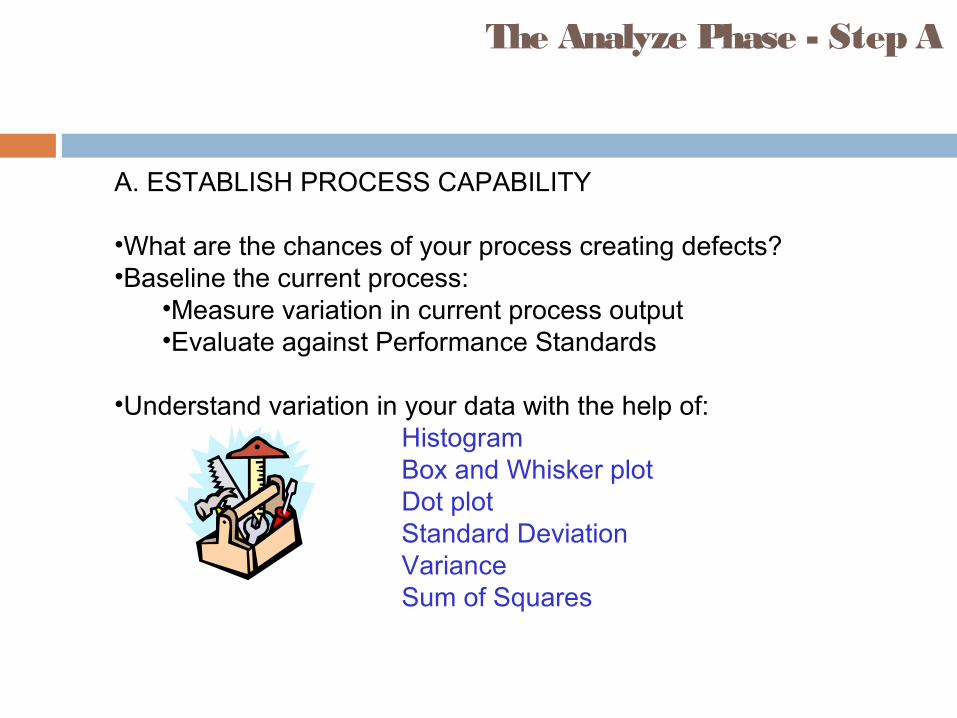
A. ESTABLISH PROCESS CAPABILITY
•What are the chances of your process creating defects?•Baseline the current process:
•Measure variation in current process output•Evaluate against Performance Standards
•Understand variation in your data with the help of:HistogramBox and Whisker plotDot plotStandard DeviationVarianceSum of Squares
The Analyze Phase - Step A
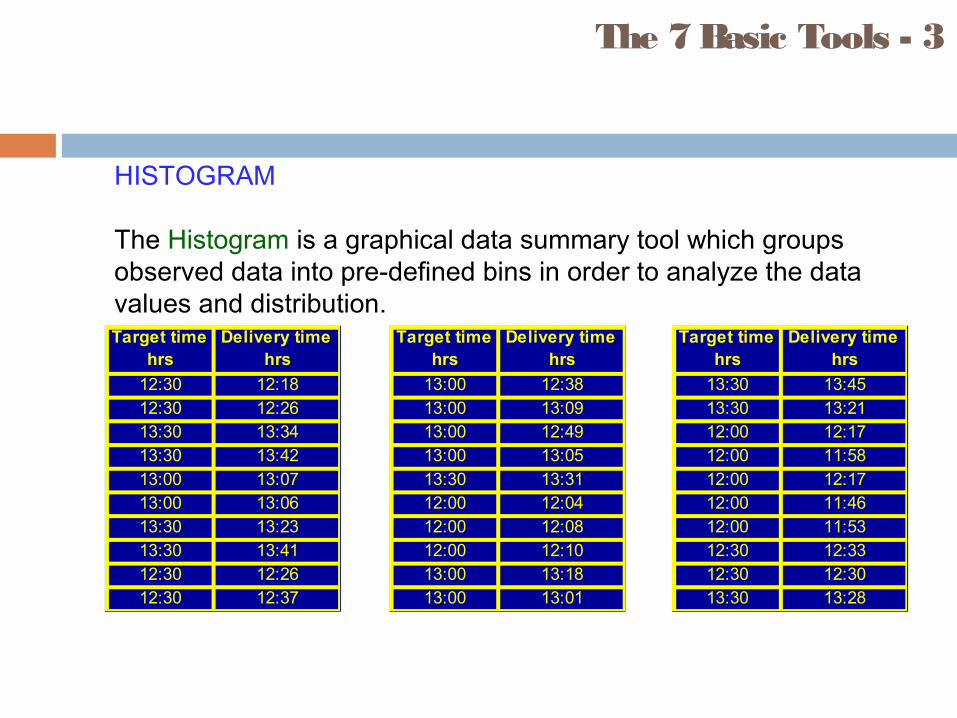
The 7 Basic Tools - 3
HISTOGRAM
The Histogram is a graphical data summary tool which groups observed data into pre-defined bins in order to analyze the data values and distribution. Target time
hrsDelivery time
hrs
12:30 12:1812:30 12:2613:30 13:3413:30 13:4213:00 13:0713:00 13:0613:30 13:2313:30 13:4112:30 12:2612:30 12:37
Target time hrs
Delivery time hrs
13:00 12:3813:00 13:0913:00 12:4913:00 13:0513:30 13:3112:00 12:0412:00 12:0812:00 12:1013:00 13:1813:00 13:01
Target time hrs
Delivery time hrs
13:30 13:4513:30 13:2112:00 12:1712:00 11:5812:00 12:1712:00 11:4612:00 11:5312:30 12:3312:30 12:3013:30 13:28
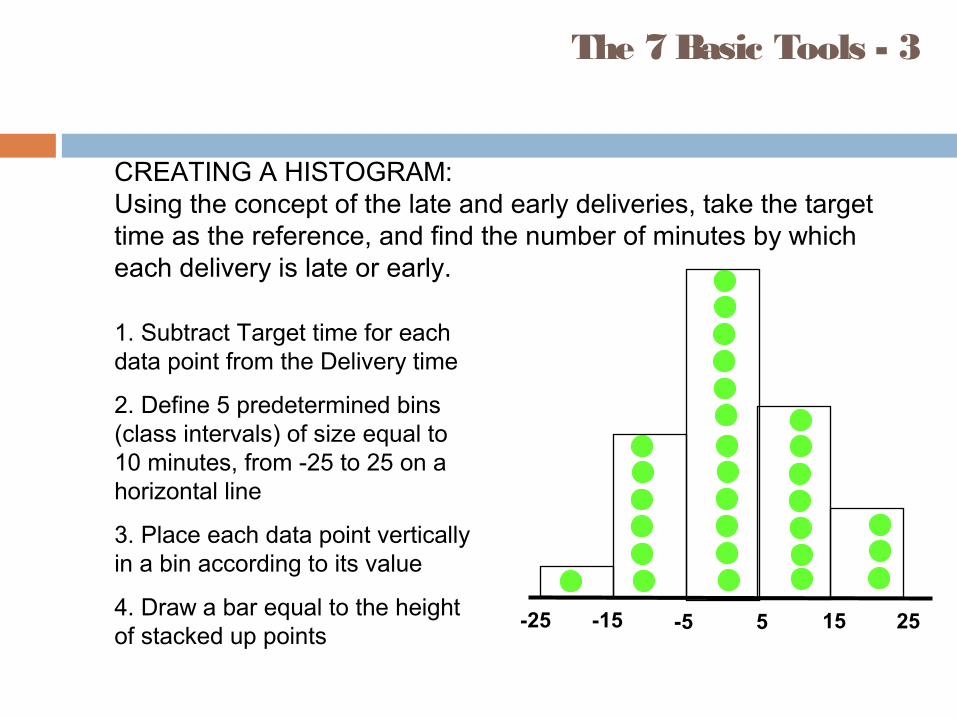
The 7 Basic Tools - 3
CREATING A HISTOGRAM:Using the concept of the late and early deliveries, take the target time as the reference, and find the number of minutes by which each delivery is late or early.
1. Subtract Target time for each data point from the Delivery time
2. Define 5 predetermined bins (class intervals) of size equal to 10 minutes, from -25 to 25 on a horizontal line
3. Place each data point vertically in a bin according to its value
4. Draw a bar equal to the height of stacked up points
-25 25-15 -5 5 15
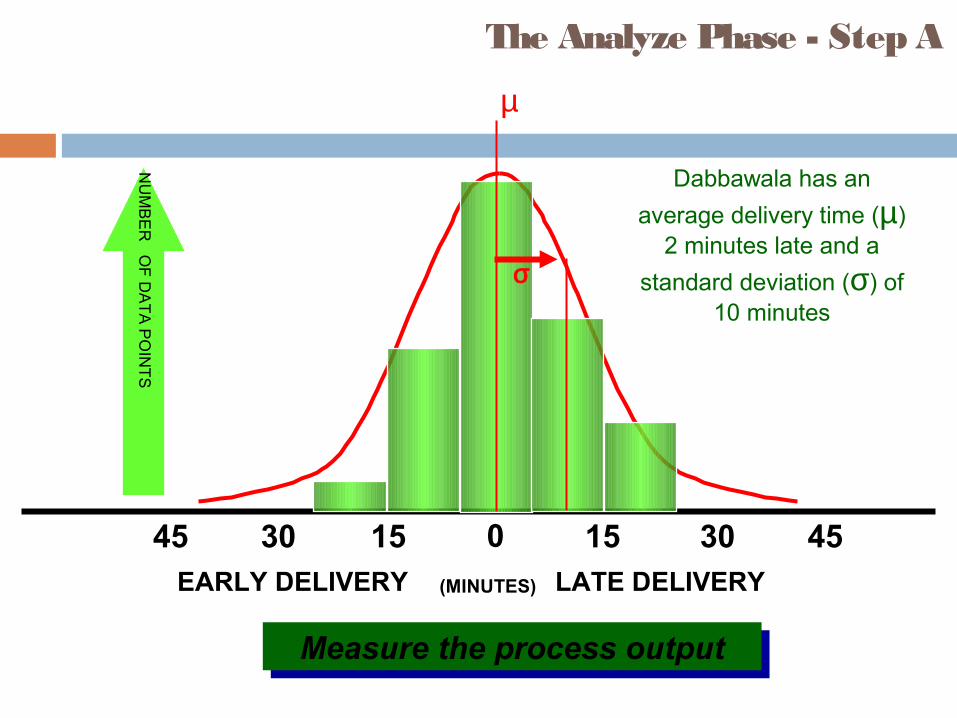
The Analyze Phase - Step A
LATE DELIVERY
153045 15 30 450
Measure the process outputMeasure the process output
EARLY DELIVERY (MINUTES)
NU
MB
ER
OF
DA
TA
PO
INT
S
Dabbawala has an
average delivery time (µ) 2 minutes late and a
standard deviation (σ) of 10 minutes
µ
σ
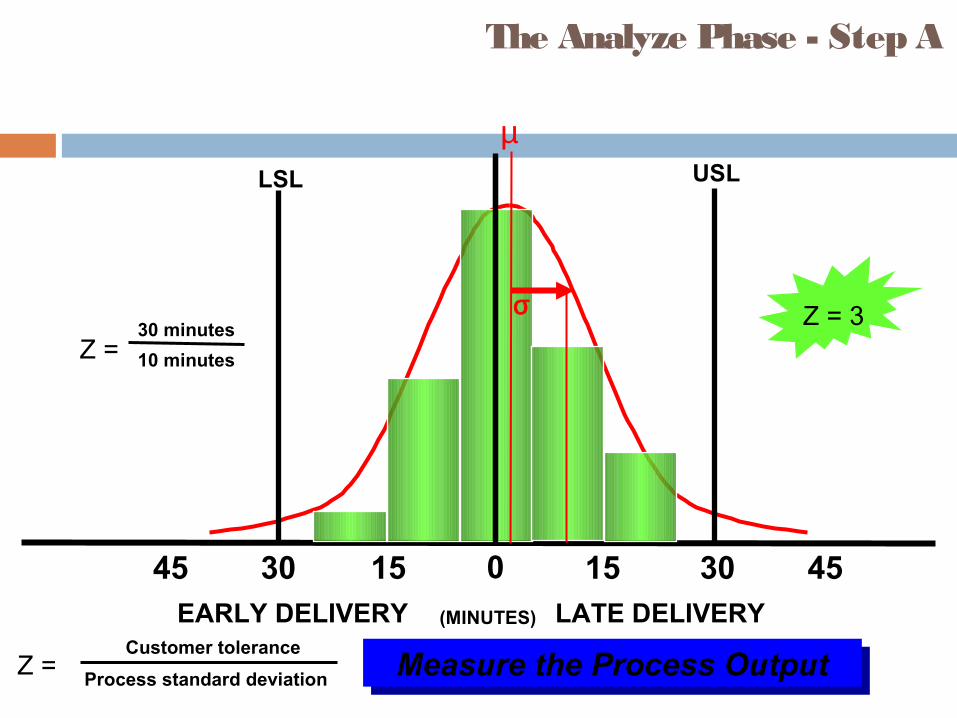
The Analyze Phase - Step A
LATE DELIVERY
153045 15 30 450
Measure the Process OutputMeasure the Process Output
EARLY DELIVERY (MINUTES)
µ
σ
USLLSL
10 minutes
30 minutesZ =
Process standard deviation
Customer toleranceZ =
Z = 3
The Analyze Phase - Step A
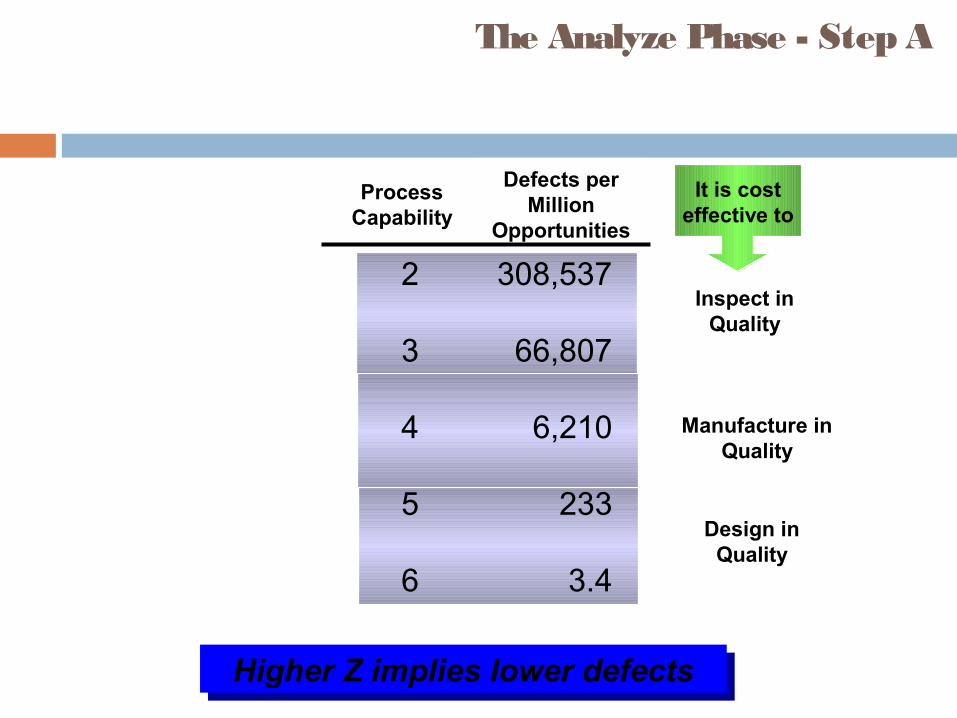
ProcessCapability
Defects per Million
Opportunities
2 308,537
3 66,807
4 6,210
5 233
6 3.4
Higher Z implies lower defectsHigher Z implies lower defects
Inspect in Quality
Manufacture in Quality
Design in Quality
It is cost effective to
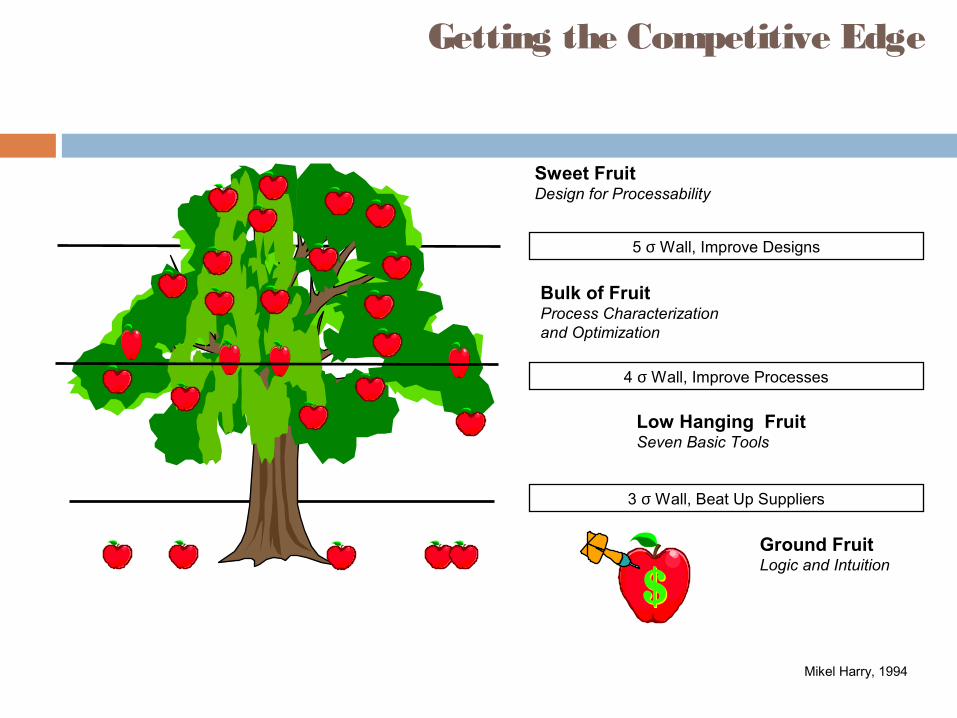
Sweet Fruit Design for Processability
Bulk of FruitProcess Characterization and Optimization
Low Hanging FruitSeven Basic Tools
Ground FruitLogic and Intuition
3 σ Wall, Beat Up Suppliers
4 σ Wall, Improve Processes
5 σ Wall, Improve Designs
Mikel Harry, 1994
Getting the Competitive Edge
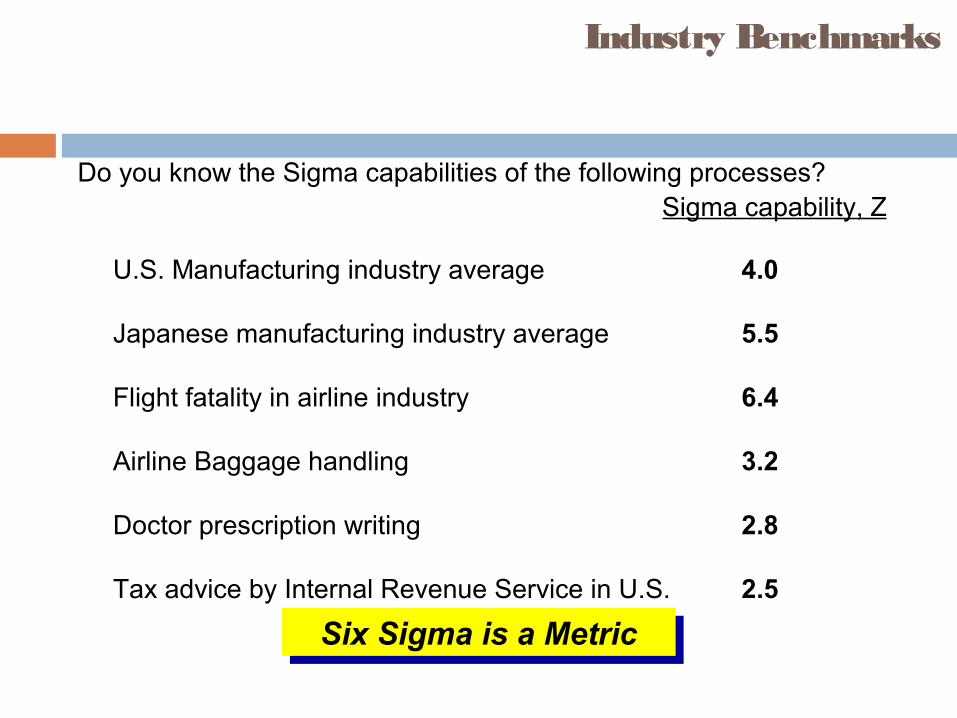
Do you know the Sigma capabilities of the following processes?
U.S. Manufacturing industry average
Japanese manufacturing industry average
Flight fatality in airline industry
Airline Baggage handling
Doctor prescription writing
Tax advice by Internal Revenue Service in U.S.
4.0
5.5
6.4
3.2
2.8
2.5
Sigma capability, Z
Industry Benchmarks
Six Sigma is a MetricSix Sigma is a Metric
Target
USLLSL
CenterProcess
ReduceSpread
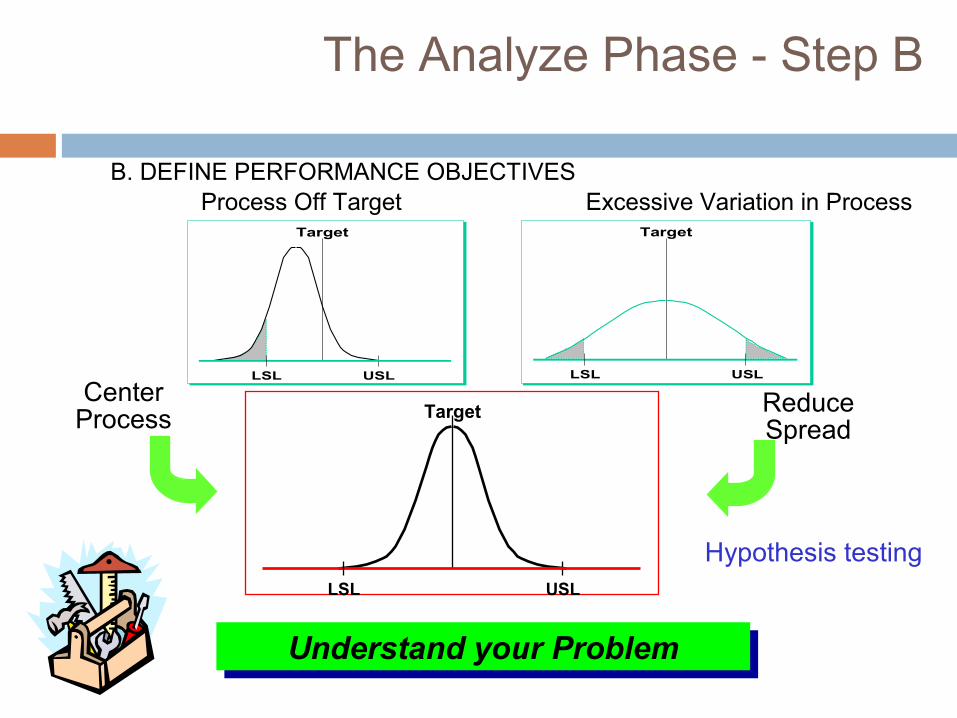
The Analyze Phase - Step B
Process Off Target Excessive Variation in ProcessTarget
USLLSL
Target
USLLSL
Understand your ProblemUnderstand your Problem
B. DEFINE PERFORMANCE OBJECTIVES
Hypothesis testing
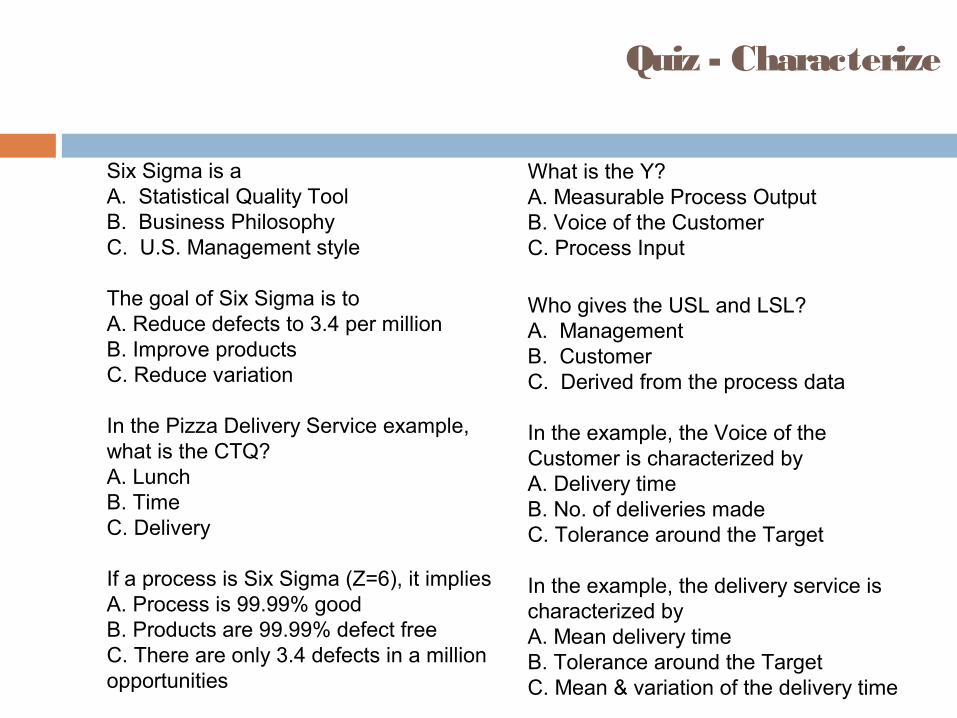
Quiz - Characterize
Six Sigma is aA. Statistical Quality ToolB. Business PhilosophyC. U.S. Management style
The goal of Six Sigma is toA. Reduce defects to 3.4 per millionB. Improve productsC. Reduce variation
In the Pizza Delivery Service example, what is the CTQ?A. LunchB. TimeC. Delivery
If a process is Six Sigma (Z=6), it implies A. Process is 99.99% goodB. Products are 99.99% defect freeC. There are only 3.4 defects in a million opportunities
What is the Y?A. Measurable Process OutputB. Voice of the CustomerC. Process Input
Who gives the USL and LSL?A. ManagementB. CustomerC. Derived from the process data
In the example, the Voice of the Customer is characterized byA. Delivery timeB. No. of deliveries madeC. Tolerance around the Target
In the example, the delivery service is characterized byA. Mean delivery timeB. Tolerance around the TargetC. Mean & variation of the delivery time
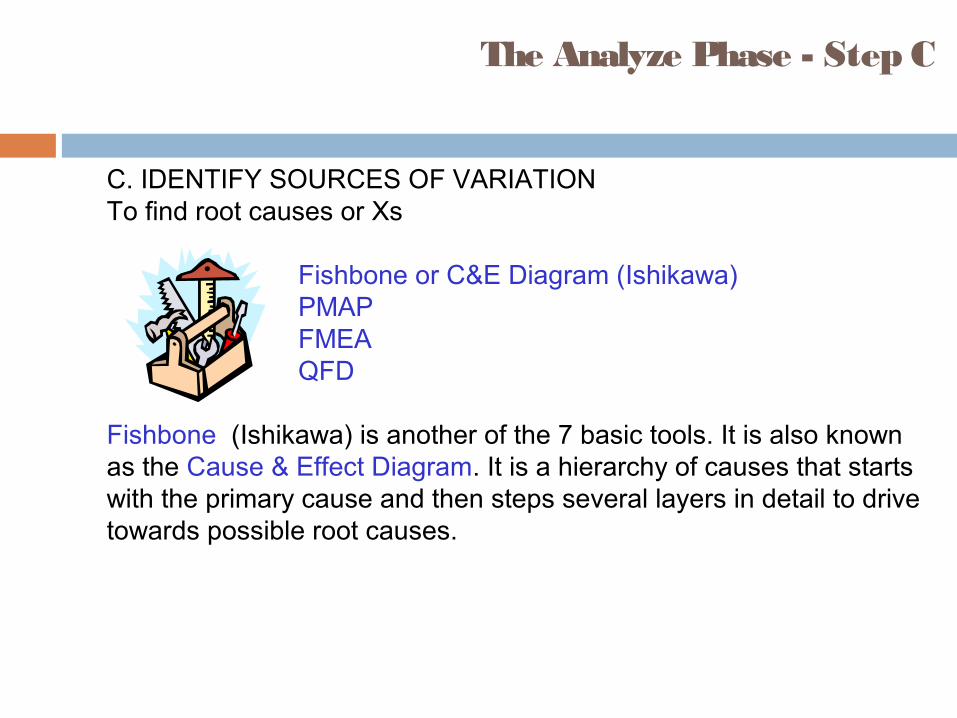
C. IDENTIFY SOURCES OF VARIATIONTo find root causes or Xs
Fishbone or C&E Diagram (Ishikawa)PMAPFMEAQFD
Fishbone (Ishikawa) is another of the 7 basic tools. It is also known as the Cause & Effect Diagram. It is a hierarchy of causes that starts with the primary cause and then steps several layers in detail to drive towards possible root causes.
The Analyze Phase - Step C
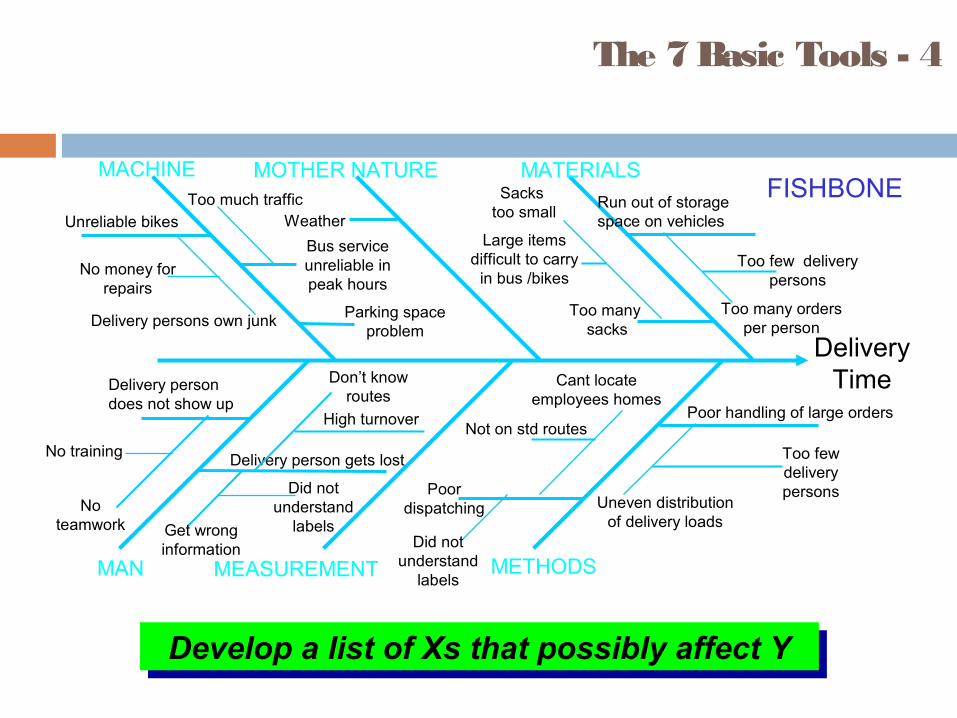
DeliveryTime
MACHINE MOTHER NATURE MATERIALS
MAN METHODS
Poor dispatching
Delivery person gets lost
Delivery person does not show up Poor handling of large orders
Run out of storage space on vehiclesWeather
Too many sacks
Develop a list of Xs that possibly affect YDevelop a list of Xs that possibly affect Y
The 7 Basic Tools - 4
Don’t know routes
High turnover
Get wrong information
Did not understand
labelsNo
teamwork
No training
Unreliable bikes
Delivery persons own junk
Cant locate employees homes
Not on std routes
Did not understand
labels
Too few delivery persons
Uneven distribution of delivery loads
MEASUREMENT
No money for repairs
Too many orders per person
Too few delivery persons
Large items difficult to carry
in bus /bikes
Sacks too small
Bus service unreliable in peak hours
Too much traffic
Parking space problem
FISHBONE
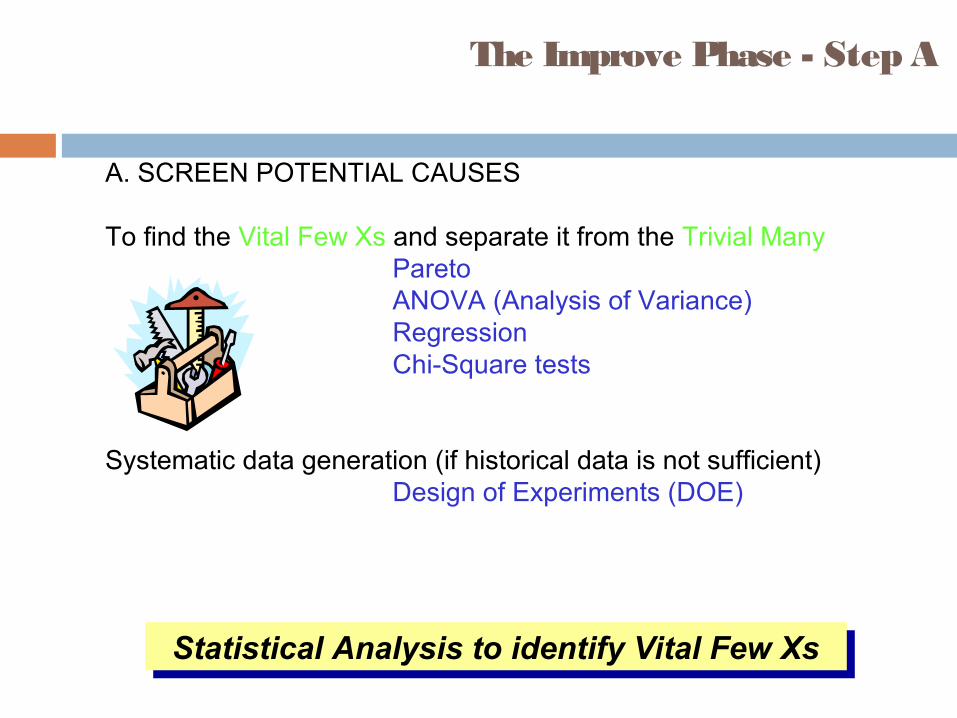
A. SCREEN POTENTIAL CAUSES
To find the Vital Few Xs and separate it from the Trivial ManyParetoANOVA (Analysis of Variance)RegressionChi-Square tests
Systematic data generation (if historical data is not sufficient)Design of Experiments (DOE)
Statistical Analysis to identify Vital Few XsStatistical Analysis to identify Vital Few Xs
The Improve Phase - Step A
The 7 Basic Tools -5
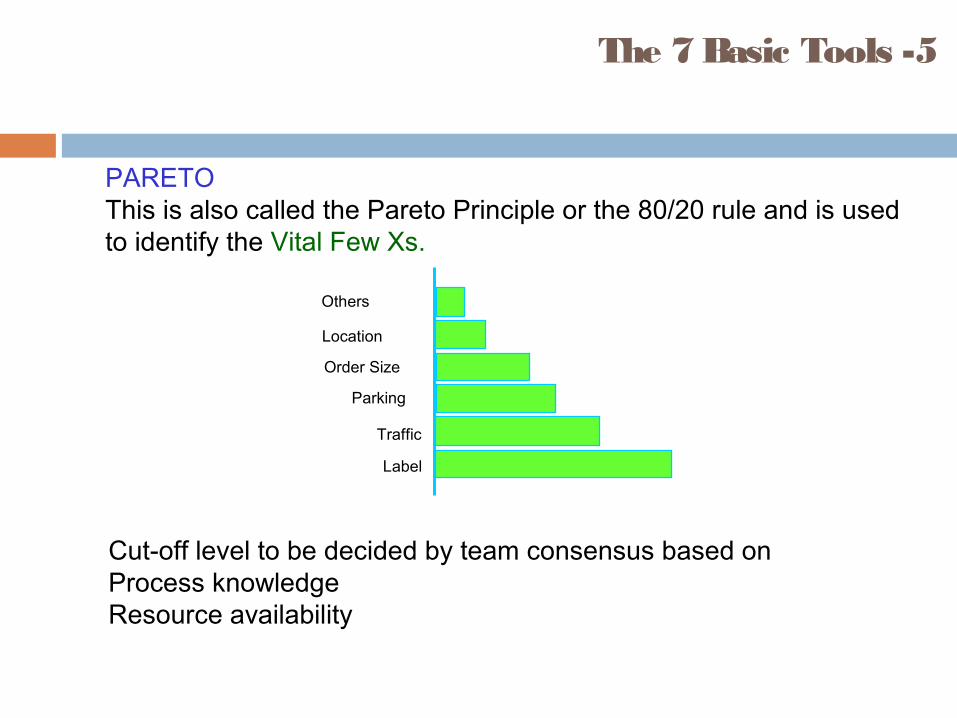
PARETOThis is also called the Pareto Principle or the 80/20 rule and is used to identify the Vital Few Xs.
Label
Traffic
Parking
Order Size
Location
Others
Cut-off level to be decided by team consensus based onProcess knowledgeResource availability
The Improve Phase - Step B
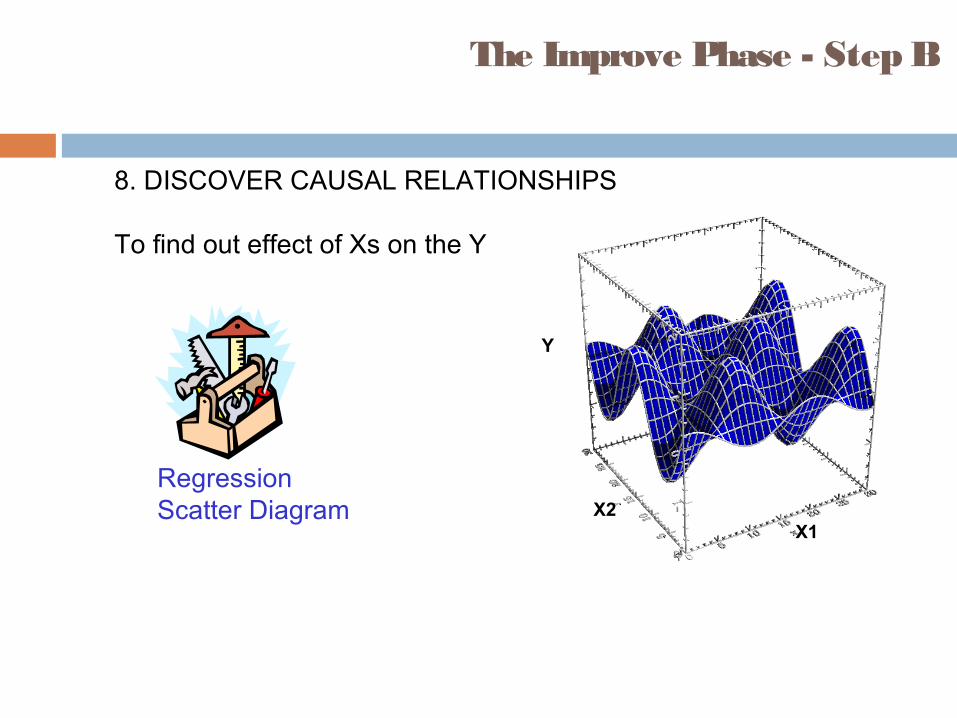
8. DISCOVER CAUSAL RELATIONSHIPS
To find out effect of Xs on the Y
X1
Y
X2
RegressionScatter Diagram
The 7 Basic Tools - 6
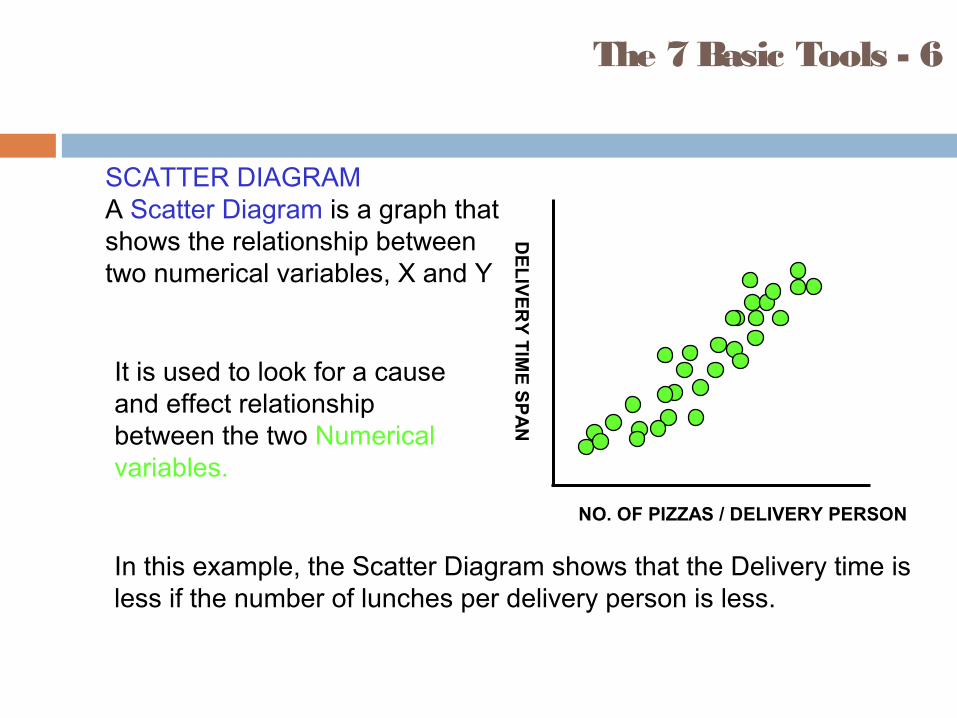
SCATTER DIAGRAMA Scatter Diagram is a graph that shows the relationship between two numerical variables, X and Y
NO. OF PIZZAS / DELIVERY PERSON
DE
LIV
ER
Y T
IME
SP
AN
It is used to look for a cause and effect relationship between the two Numerical variables.
In this example, the Scatter Diagram shows that the Delivery time is less if the number of lunches per delivery person is less.
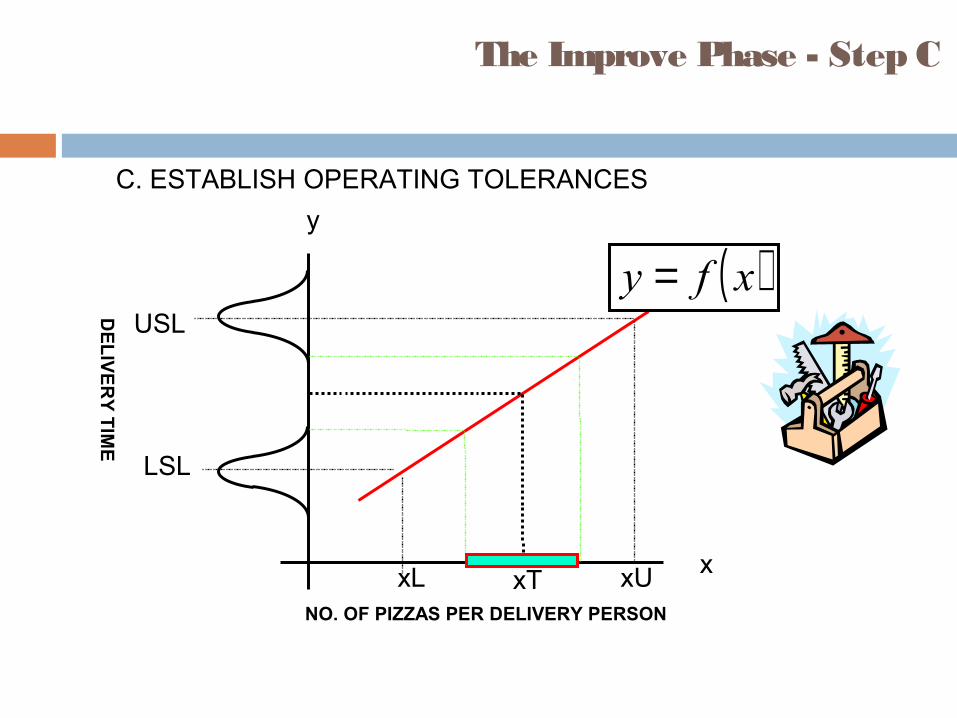
C. ESTABLISH OPERATING TOLERANCES
The Improve Phase - Step C
xL xT xU
USL
LSL
x
y
( )xfy =
NO. OF PIZZAS PER DELIVERY PERSON
DE
LIV
ER
Y T
IME
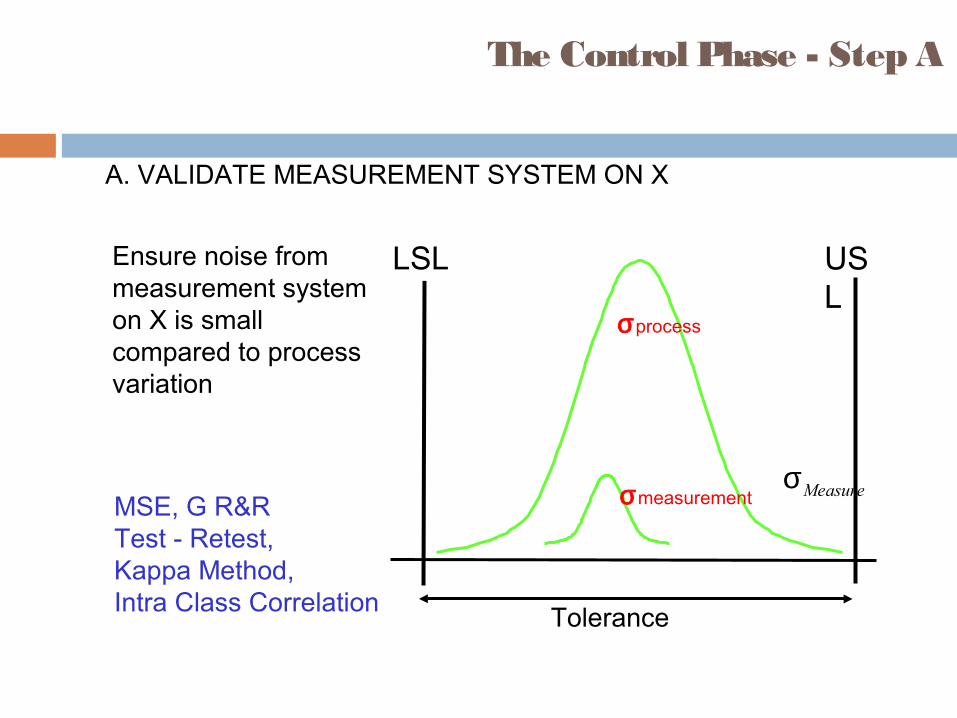
A. VALIDATE MEASUREMENT SYSTEM ON X
The Control Phase - Step A
Measureσ
LSL USL
Tolerance
Ensure noise from measurement system on X is small compared to process variation
σprocess
σmeasurementMSE, G R&RTest - Retest,Kappa Method,Intra Class Correlation
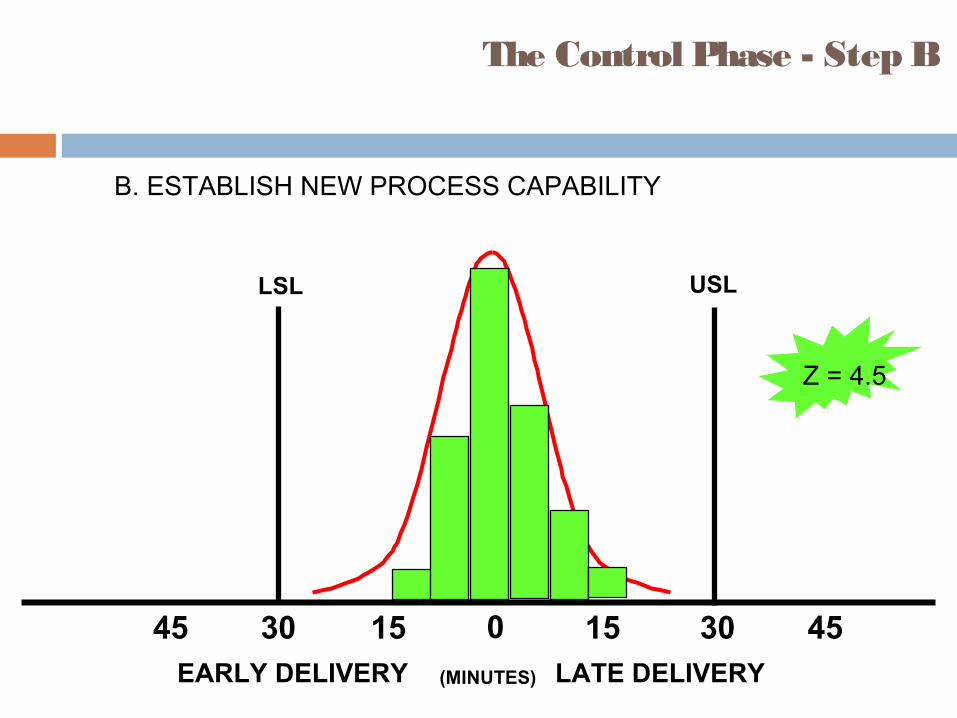
B. ESTABLISH NEW PROCESS CAPABILITY
The Control Phase - Step B
LATE DELIVERY
153045 15 30 450EARLY DELIVERY (MINUTES)
USLLSL
Z = 4.5
C. IMPLEMENT PROCESS CONTROL
A good Control Plan should be put in place to ensure sustained improvement. This may include:
1. Use of Control Charts to monitor Xs2. Documentation of Control Plan3. Update of process documents such as PFMEA4. Error Proofing5. Standardization
The Control Phase - Step C
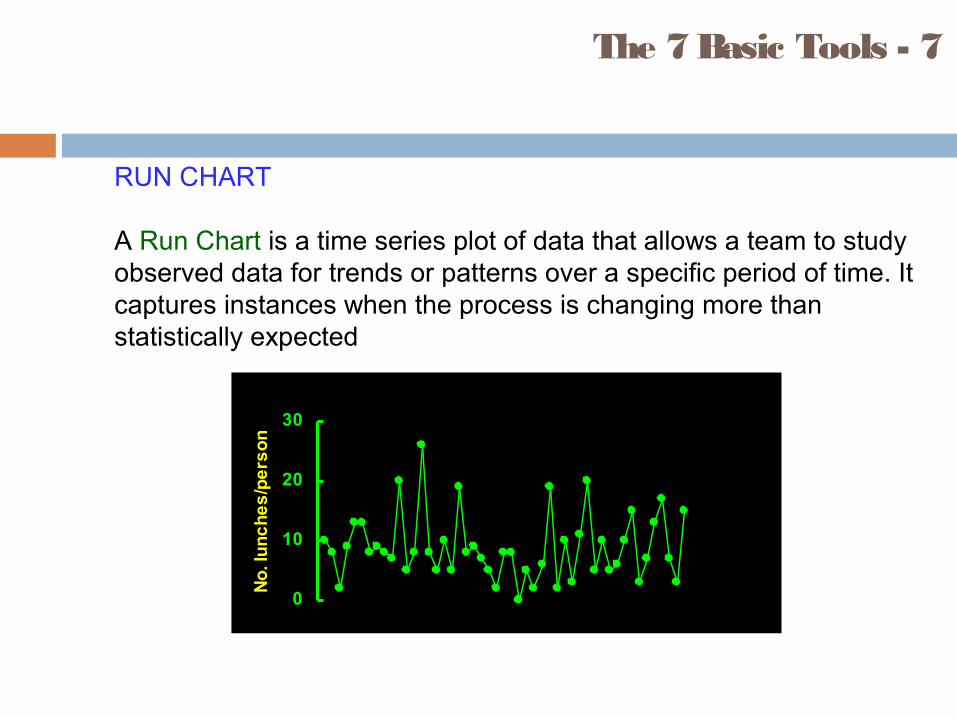
RUN CHART
A Run Chart is a time series plot of data that allows a team to study observed data for trends or patterns over a specific period of time. It captures instances when the process is changing more than statistically expected
The 7 Basic Tools - 7
0
10
20
30
No
. lu
nc
he
s/p
ers
on
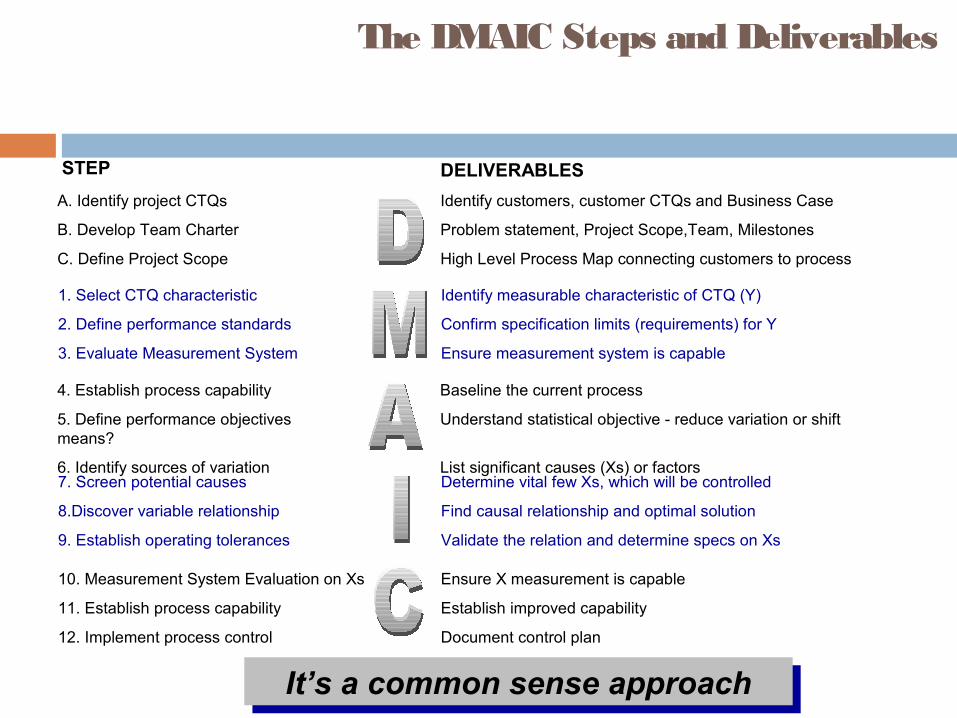
The DMAIC Steps and Deliverables
A. Identify project CTQs Identify customers, customer CTQs and Business Case
B. Develop Team Charter Problem statement, Project Scope,Team, Milestones
C. Define Project Scope High Level Process Map connecting customers to process
1. Select CTQ characteristic Identify measurable characteristic of CTQ (Y)
2. Define performance standards Confirm specification limits (requirements) for Y
3. Evaluate Measurement System Ensure measurement system is capable
4. Establish process capability Baseline the current process
5. Define performance objectives Understand statistical objective - reduce variation or shift means?
6. Identify sources of variation List significant causes (Xs) or factors7. Screen potential causes Determine vital few Xs, which will be controlled
8.Discover variable relationship Find causal relationship and optimal solution
9. Establish operating tolerances Validate the relation and determine specs on Xs
10. Measurement System Evaluation on Xs Ensure X measurement is capable
11. Establish process capability Establish improved capability
12. Implement process control Document control plan
It’s a common sense approachIt’s a common sense approach
STEP DELIVERABLES
Attributes of a Six Sigma GB project
1. Customer Focused: A Six Sigma GB project should address a customer CTQ
2. Data Driven: In a Six Sigma GB project, decisions should be made using data analysis and not on gut feelings or intuitions
3. Variation reduction: Six Sigma GB projects address the issue of variation in process outputs and is aimed at reducing variation
DMAIC Summary
Knowing Customer CTQsData driven improvementsFocus on the (Xs) of the processApplication of statistical tools to business
problemsUnderstanding process capability and its impact
on qualityAn environment that demands only the highest
performance standards.
Success will be defined when our customers notice !
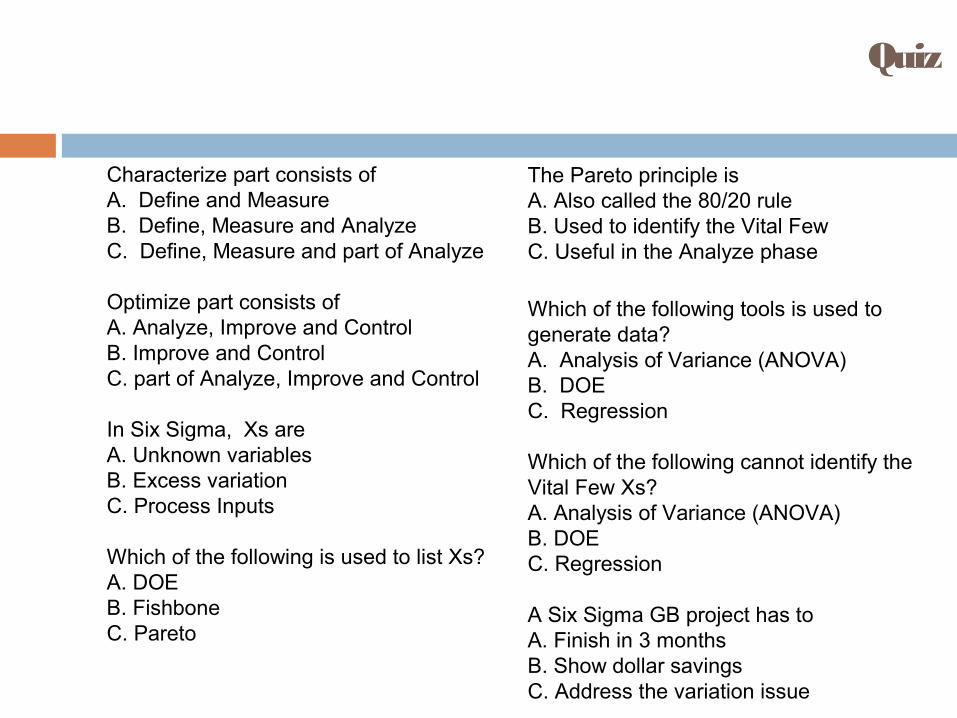
Quiz
Characterize part consists ofA. Define and MeasureB. Define, Measure and AnalyzeC. Define, Measure and part of Analyze
Optimize part consists ofA. Analyze, Improve and ControlB. Improve and ControlC. part of Analyze, Improve and Control
In Six Sigma, Xs areA. Unknown variablesB. Excess variationC. Process Inputs
Which of the following is used to list Xs? A. DOEB. FishboneC. Pareto
The Pareto principle isA. Also called the 80/20 ruleB. Used to identify the Vital FewC. Useful in the Analyze phase
Which of the following tools is used to generate data?A. Analysis of Variance (ANOVA)B. DOEC. Regression
Which of the following cannot identify the Vital Few Xs?A. Analysis of Variance (ANOVA)B. DOEC. Regression
A Six Sigma GB project has toA. Finish in 3 monthsB. Show dollar savingsC. Address the variation issue
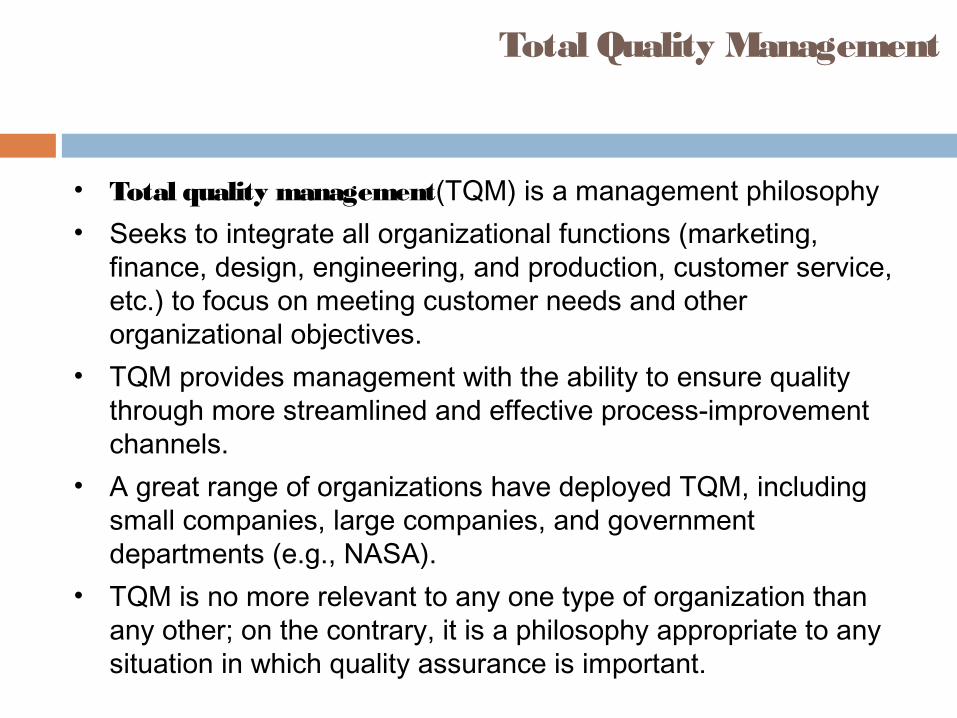
Total Quality Management
• Total quality management(TQM) is a management philosophy• Seeks to integrate all organizational functions (marketing,
finance, design, engineering, and production, customer service, etc.) to focus on meeting customer needs and other organizational objectives.
• TQM provides management with the ability to ensure quality through more streamlined and effective process-improvement channels.
• A great range of organizations have deployed TQM, including small companies, large companies, and government departments (e.g., NASA).
• TQM is no more relevant to any one type of organization than any other; on the contrary, it is a philosophy appropriate to any situation in which quality assurance is important.
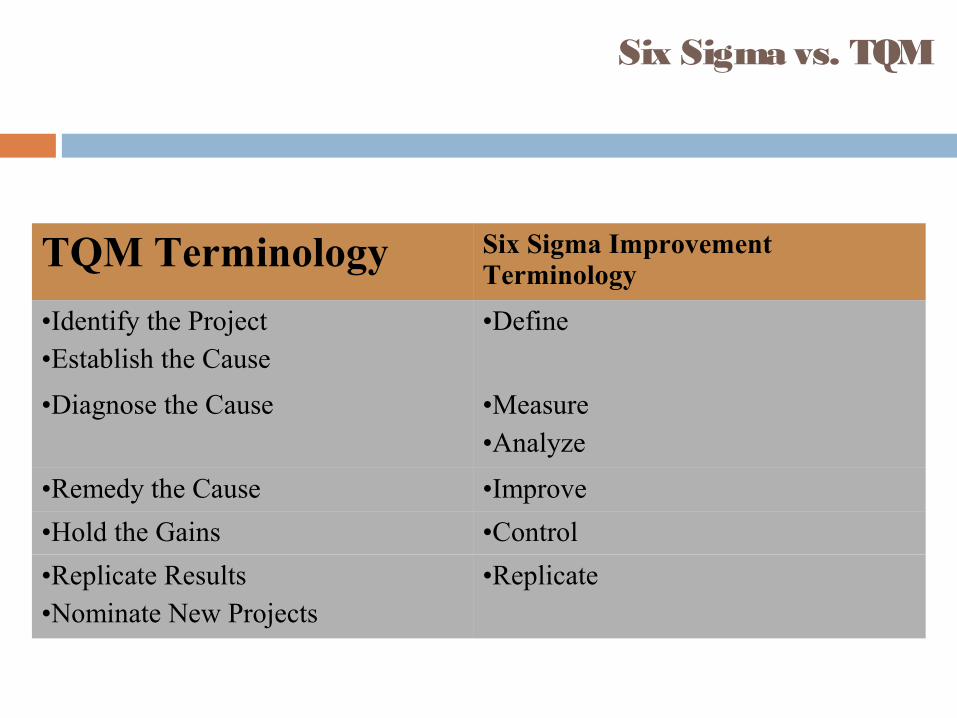
Six Sigma vs. TQM
TQM Terminology Six Sigma Improvement Terminology
•Identify the Project•Establish the Cause
•Define
•Diagnose the Cause •Measure•Analyze
•Remedy the Cause •Improve
•Hold the Gains •Control
•Replicate Results•Nominate New Projects
•Replicate
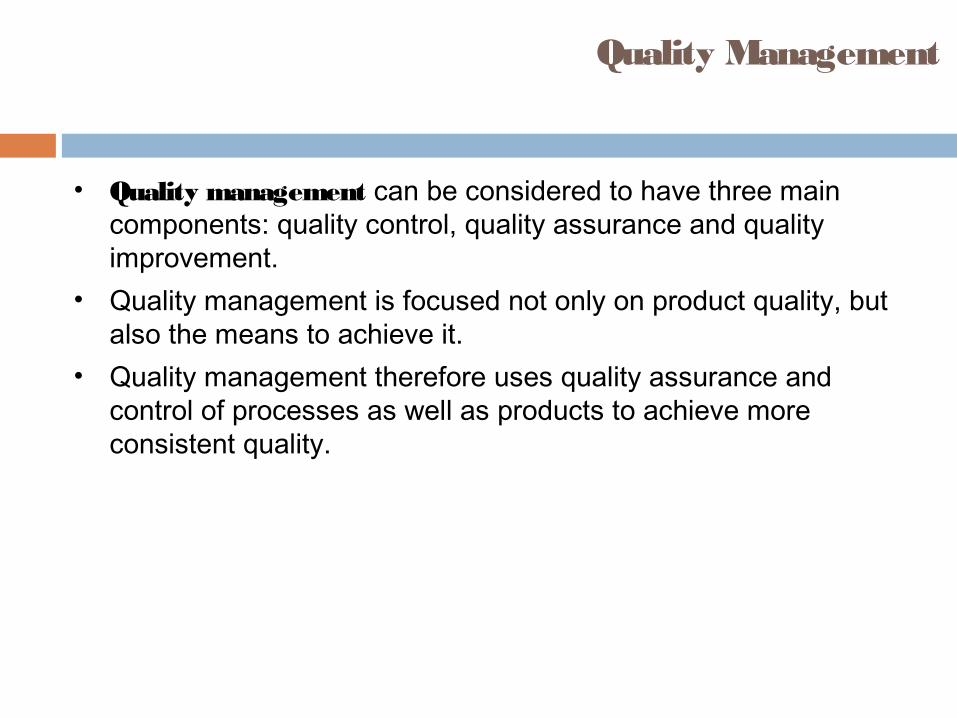
Quality Management
• Quality management can be considered to have three main components: quality control, quality assurance and quality improvement.
• Quality management is focused not only on product quality, but also the means to achieve it.
• Quality management therefore uses quality assurance and control of processes as well as products to achieve more consistent quality.
Quality Management System
• The International Organization for Standardization (ISO) created the Quality Management System (QMS) standards in 1987.
• The last major revision was in the year 2008 and the series was called ISO 9000:2000 series.
• are meant to certify the processes and the system of an organization, not the product or service itself.
• ISO 9000 defines a QMS as:
“ Ma na g e m e nt s y s te m to d ire c t a nd c o ntro l a n o rg a niz a tio n with re g a rd to q ua lity ”
The Benefits of a QMS
• Encourages active and effective leadership• Involves and empowers staff• Staff will clearly understand their responsibilities• Ensures consistency • Focuses on root cause of problems
…Thank You