Embed Size (px)
Citation preview


www.netpicks.com/profit-factor-expectancy/
You are going to learn the minimum basic trading performance metrics
Profit factorExpectancy
Win rateLoss rateAverage win/loss#of trades# of winning trades# of losing trades
Profit FactorStatistical Expectancy
Expectation

# of winning tradesdivided by
total number of trades
# of losing trades divided by
total # of all trades
The most important metric to be linked
with win rate is average win and
average loss
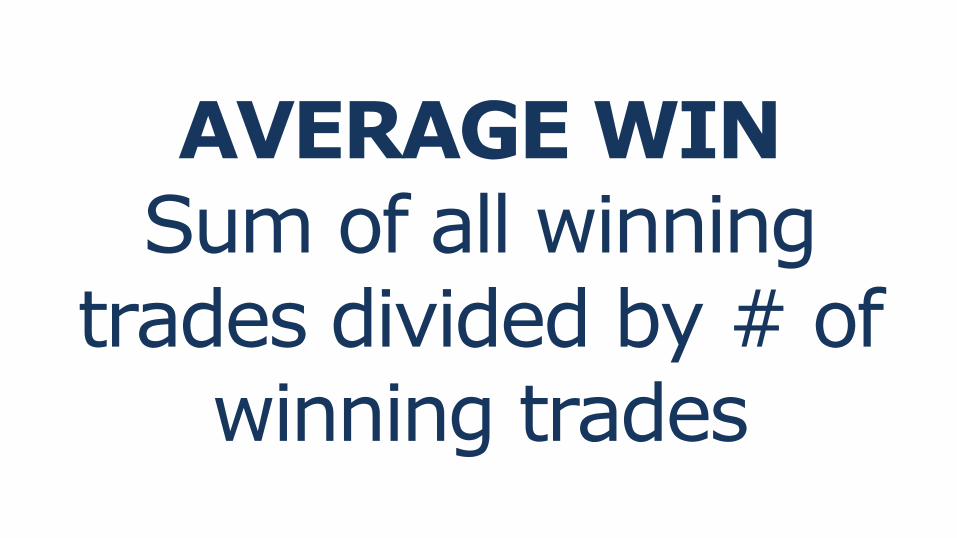
AVERAGE WINSum of all winning
trades divided by # of winning trades
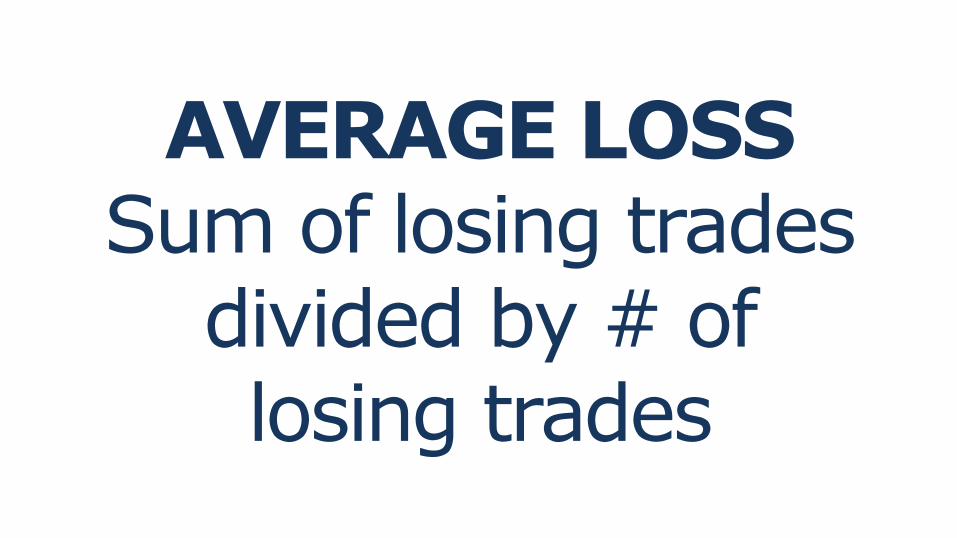
AVERAGE LOSSSum of losing trades
divided by # oflosing trades

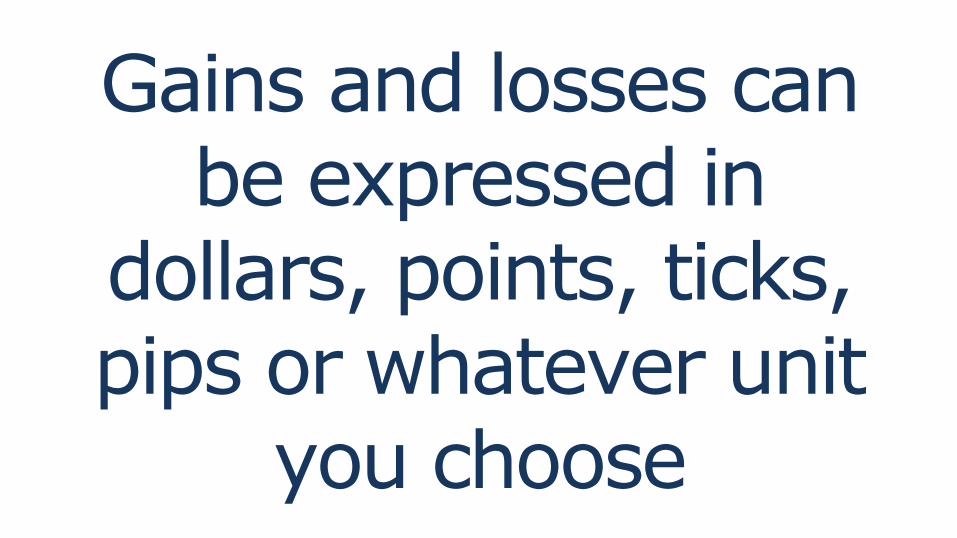
Gains and losses can be expressed in
dollars, points, ticks, pips or whatever unit
you choose
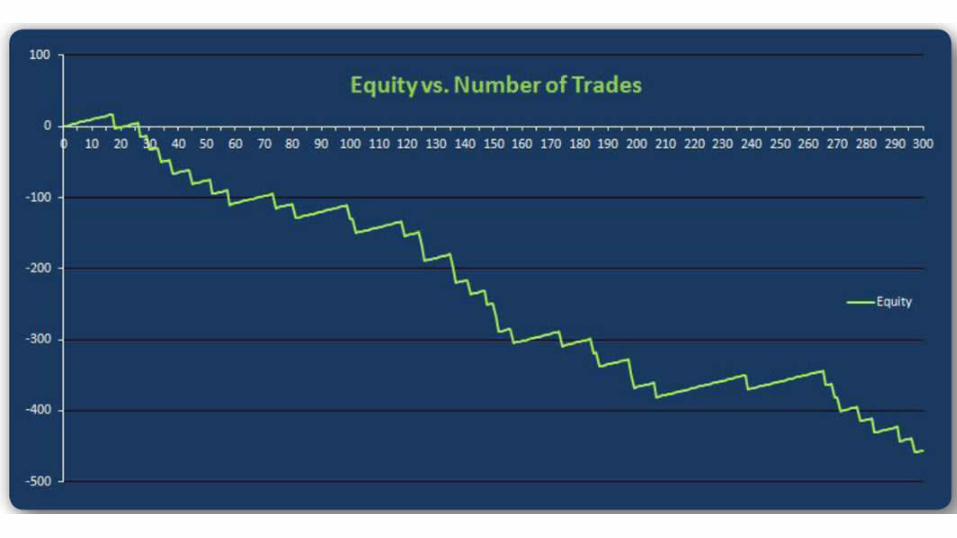
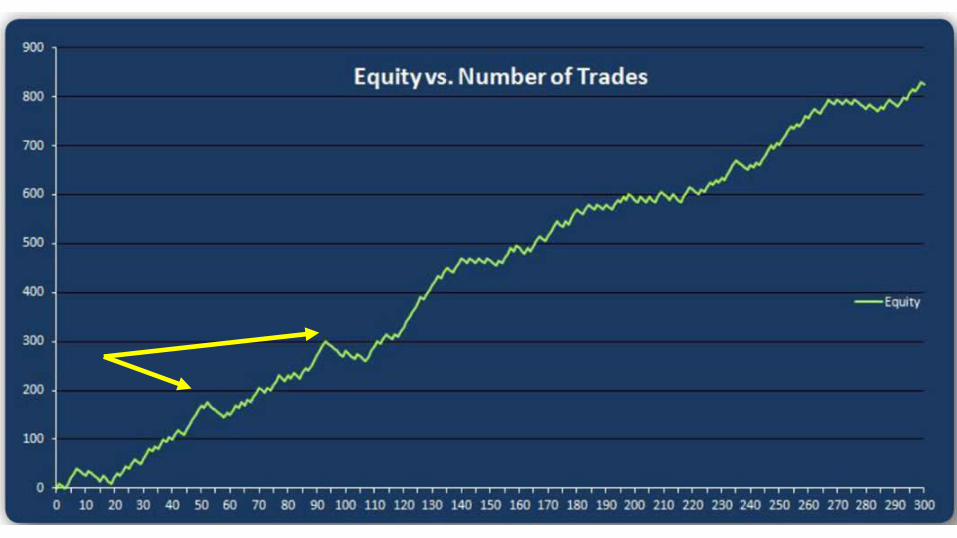
The inevitable losses occur wiping out all gains
A strategy capable of this type of behavior
would an options spread selling strategy
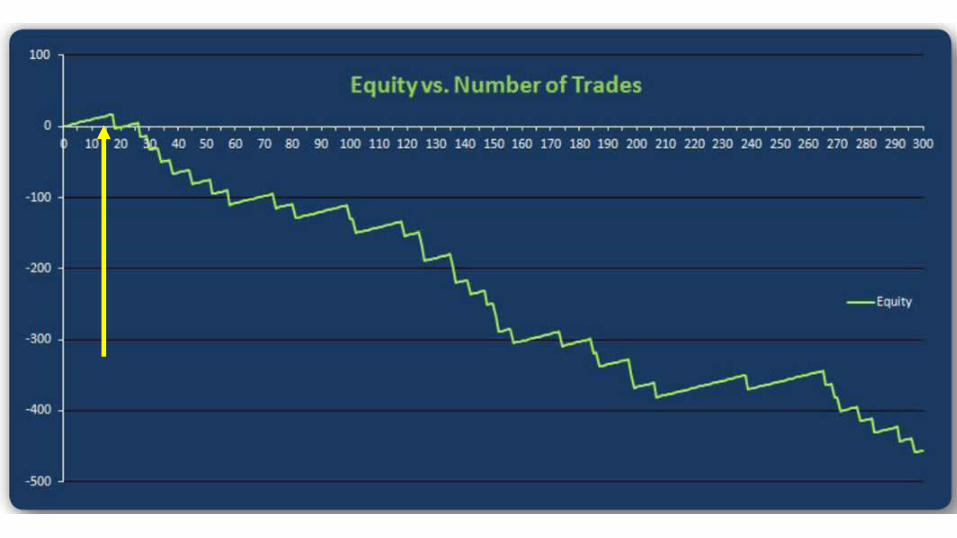
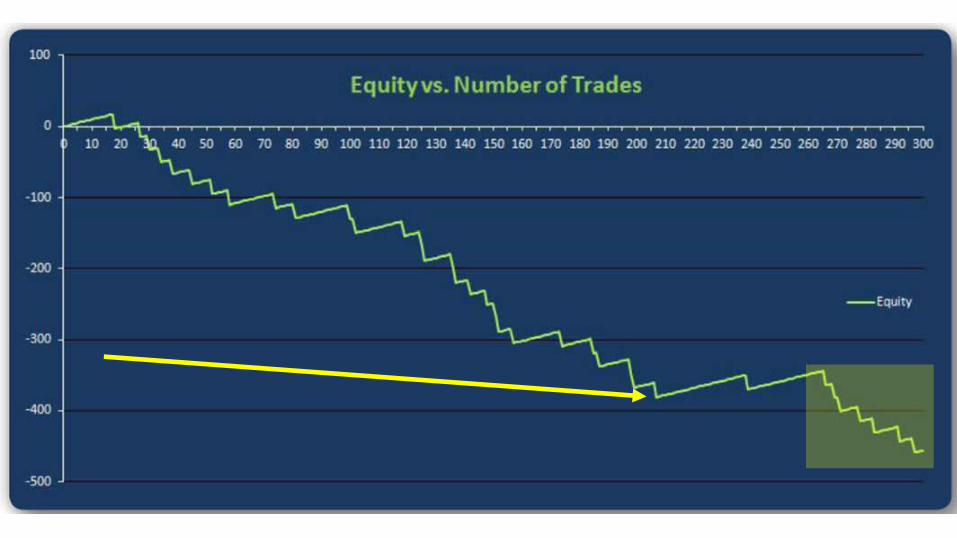
When the win/ loss ratio is this unfavorable, even a high winning rate is not enough to make up for
the losses
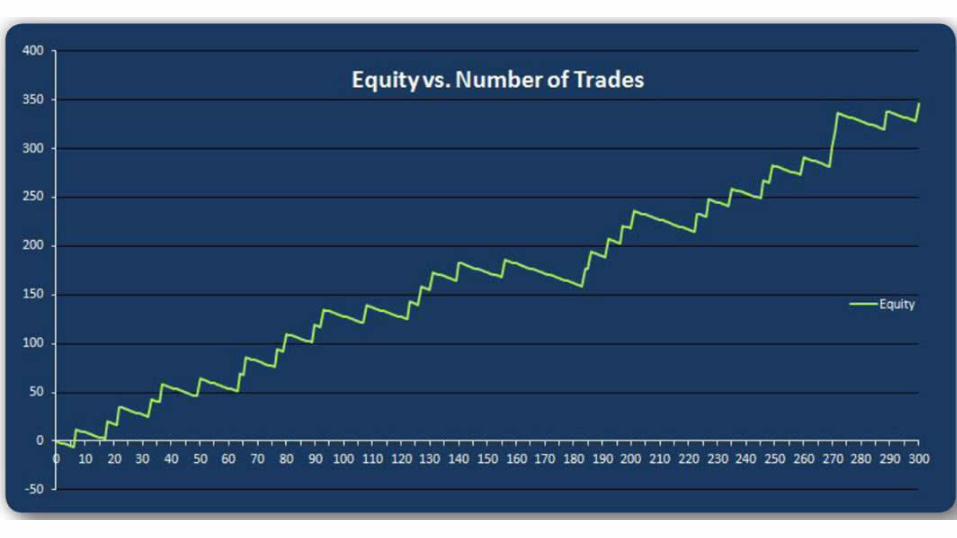
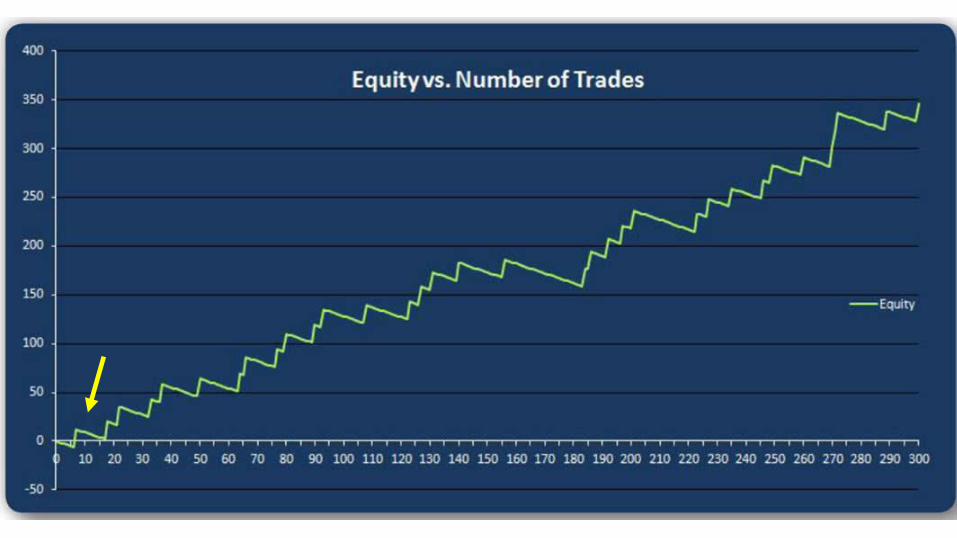
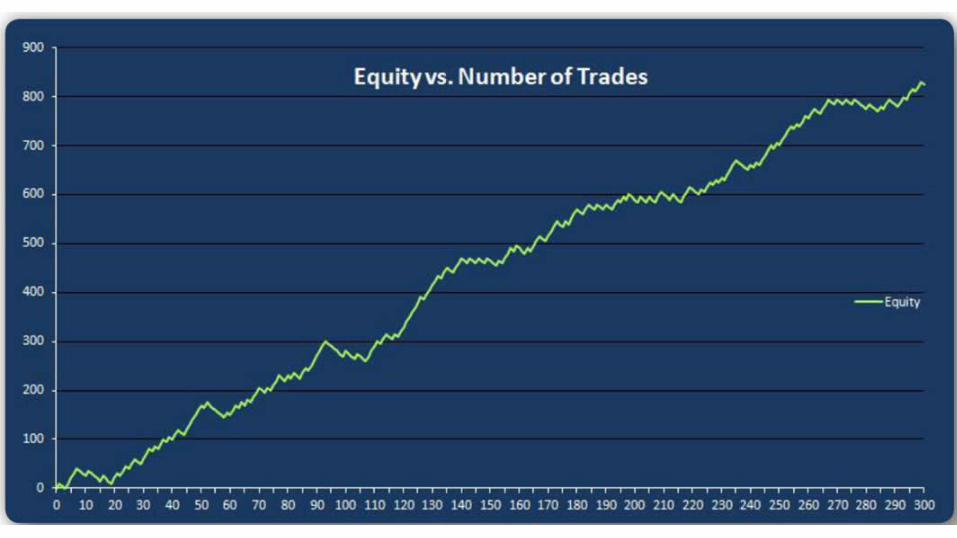
There are lots of small losers, but when the
trade is successful, the gain is large
How do we determine whether or not a trade plan has the potential
to be profitable?
SEEK OUT THEPROFIT FACTOR CALCULATION
Profit factor needs to be greater than 1.0 to have a winning plan
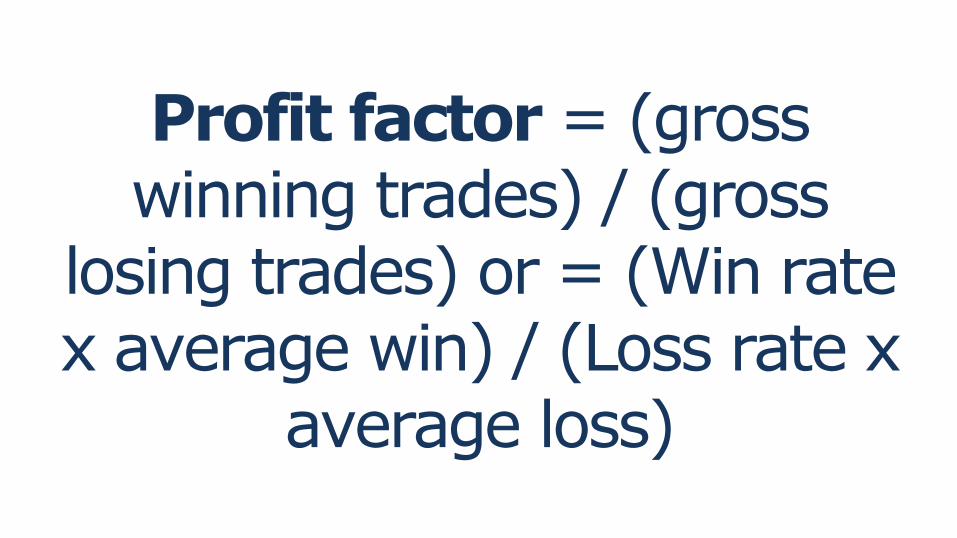
Profit factor = (gross winning trades) / (gross
losing trades) or = (Win rate x average win) / (Loss rate x
average loss)
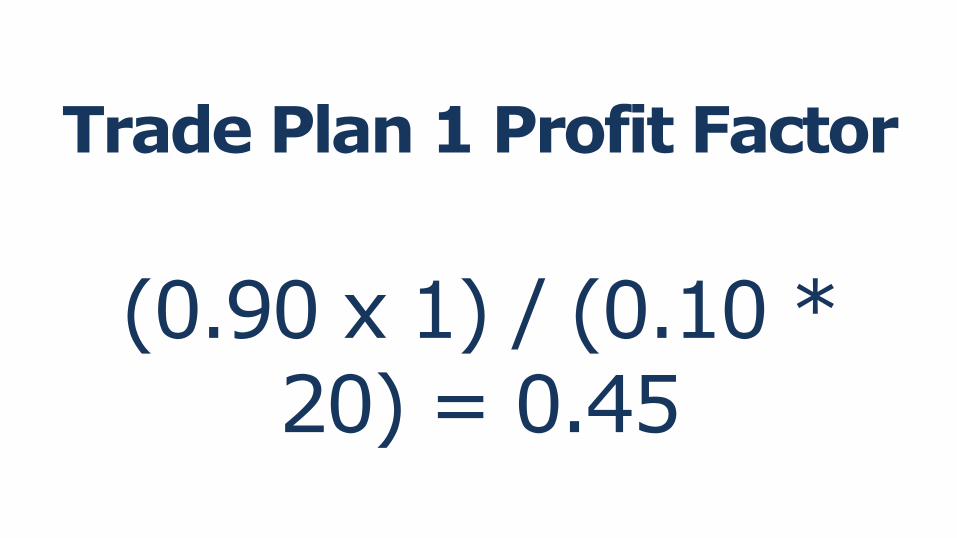
Trade Plan 1 Profit Factor
(0.90 x 1) / (0.10 * 20) = 0.45
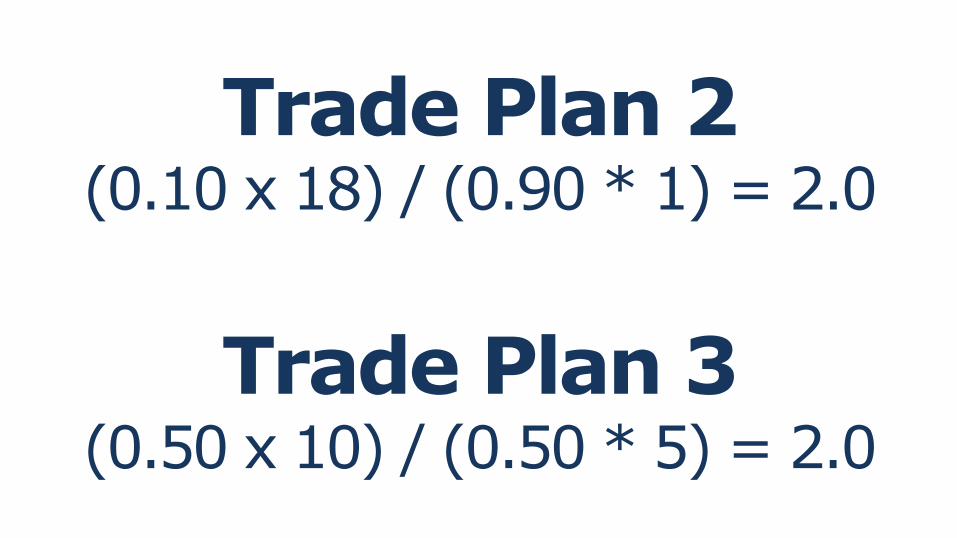
Trade Plan 2 (0.10 x 18) / (0.90 * 1) = 2.0
Trade Plan 3(0.50 x 10) / (0.50 * 5) = 2.0
Statistical Trading Expectancy
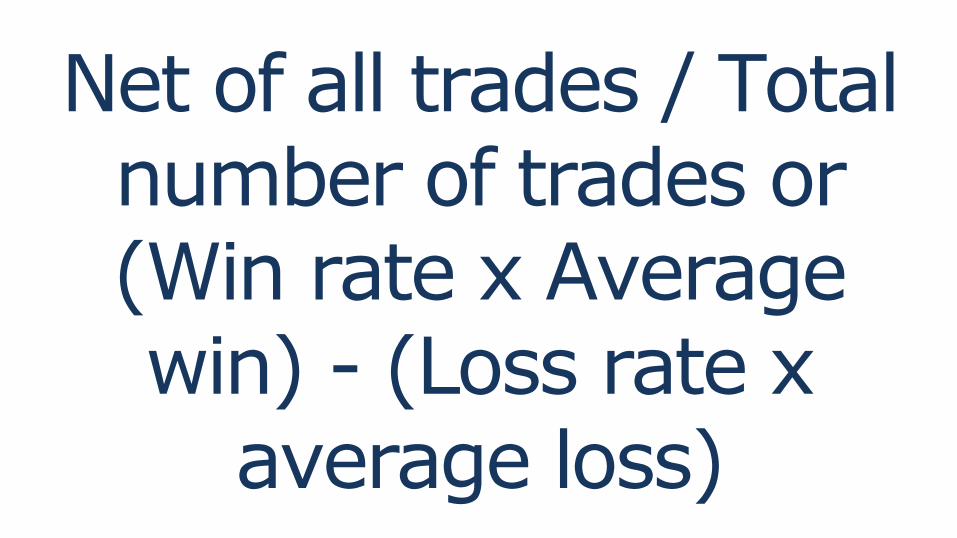
Net of all trades / Total number of trades or (Win rate x Average win) - (Loss rate x
average loss)
It gives us the expected profit, on average, for each
trade made
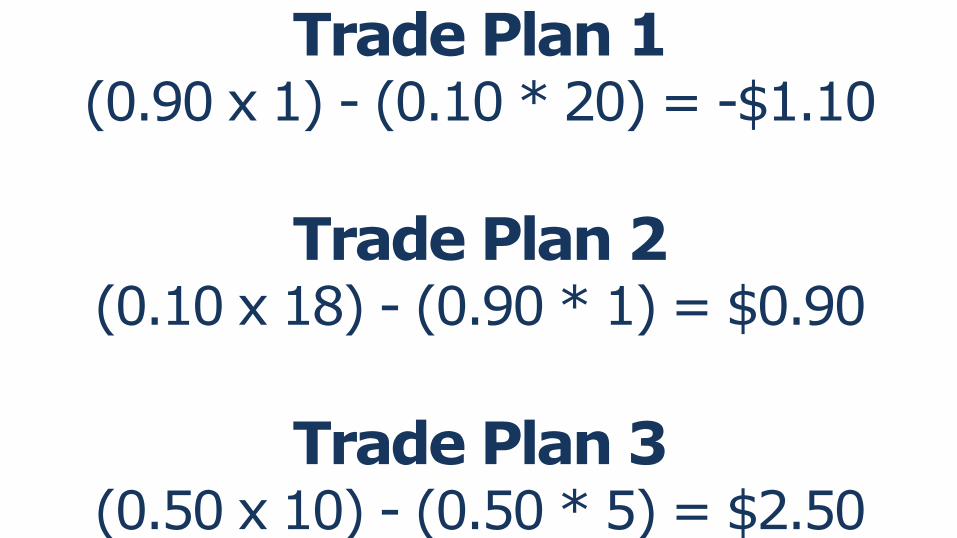
Trade Plan 1(0.90 x 1) - (0.10 * 20) = -$1.10
Trade Plan 2(0.10 x 18) - (0.90 * 1) = $0.90
Trade Plan 3(0.50 x 10) - (0.50 * 5) = $2.50
Notice that the trade plan 3 has a greaterexpectancy per trade
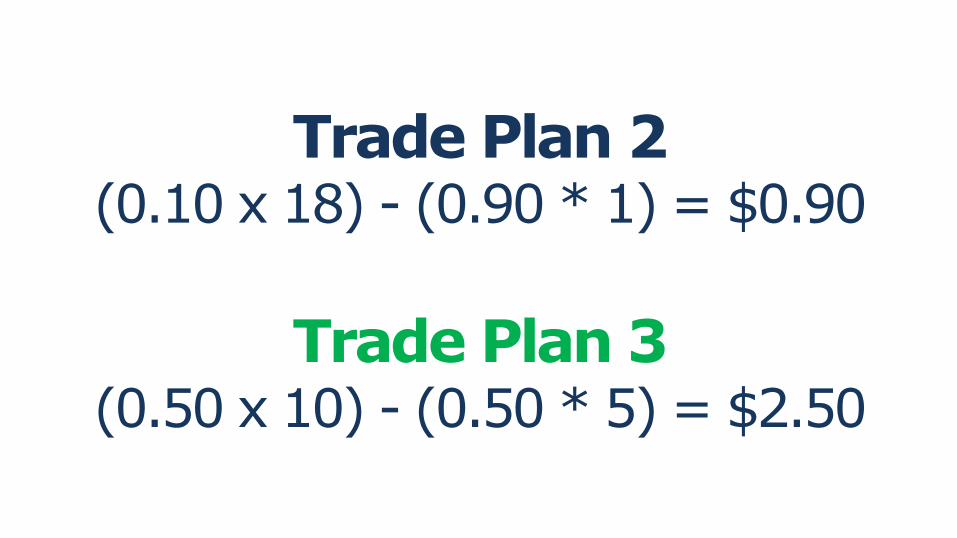
Trade Plan 2(0.10 x 18) - (0.90 * 1) = $0.90
Trade Plan 3(0.50 x 10) - (0.50 * 5) = $2.50

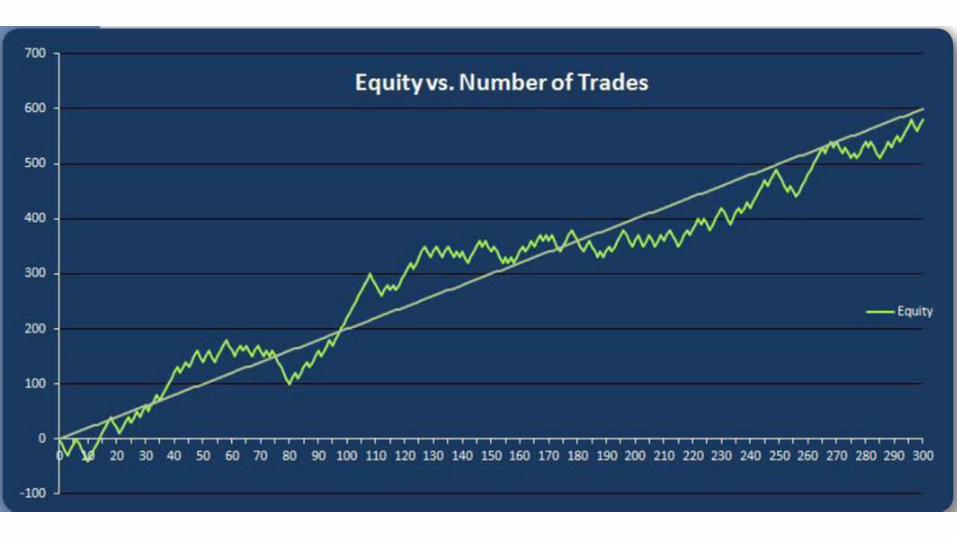
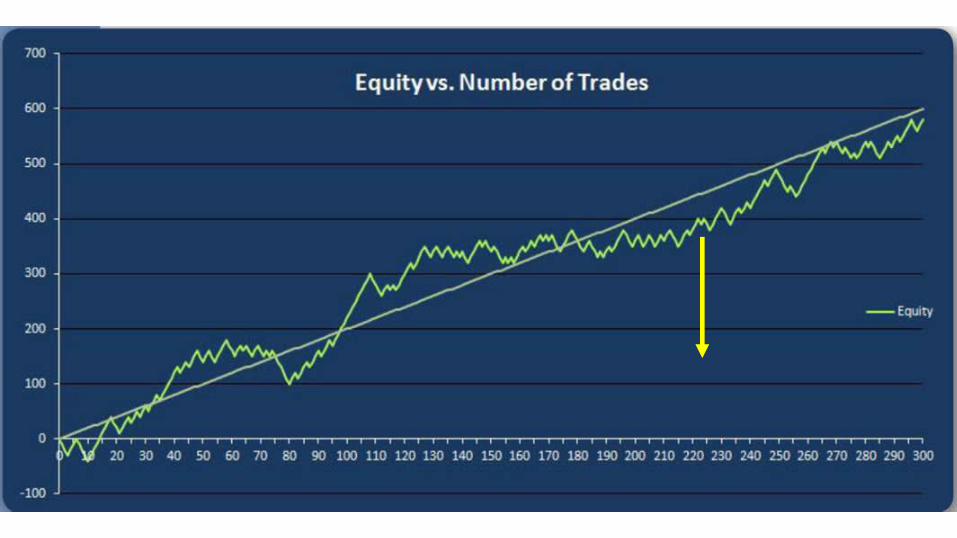
The previous equity charts confirm this

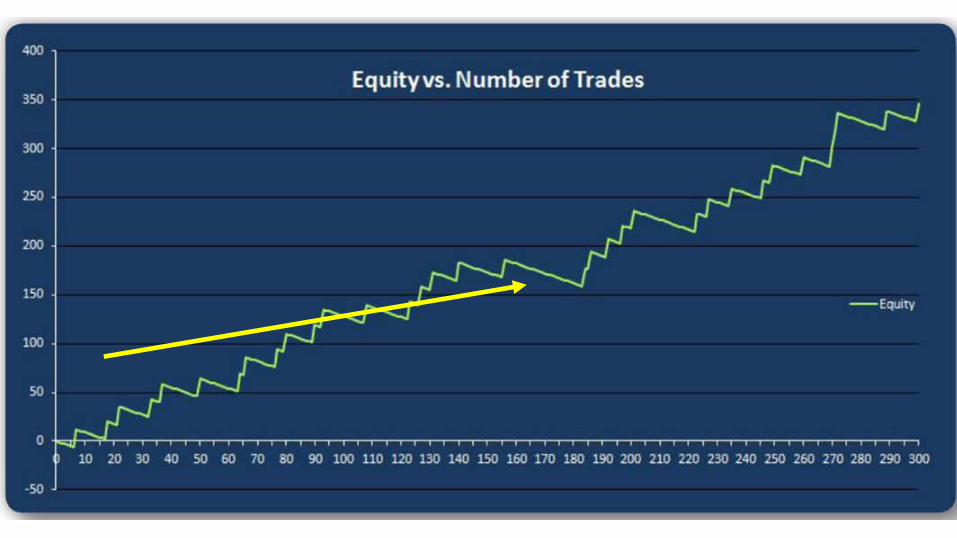
Even though average win = average loss this trade plan is
profitable because win rate > than 50%
We need to include not only win rate, average wins/losses & profit
factor…..
…we need to add expectancy and number
of trades in as well

TRADING EXPECTATION
ExpectationExpectancy / Average loss
High Expectation Small changes in average loss will have little effect on
our net profits
As this ratio gets smaller, small changes
in average loss will have a greater impact
on net gains
If expectation < 0, then expectancy (gain must be less than 0 and it is a losing plan
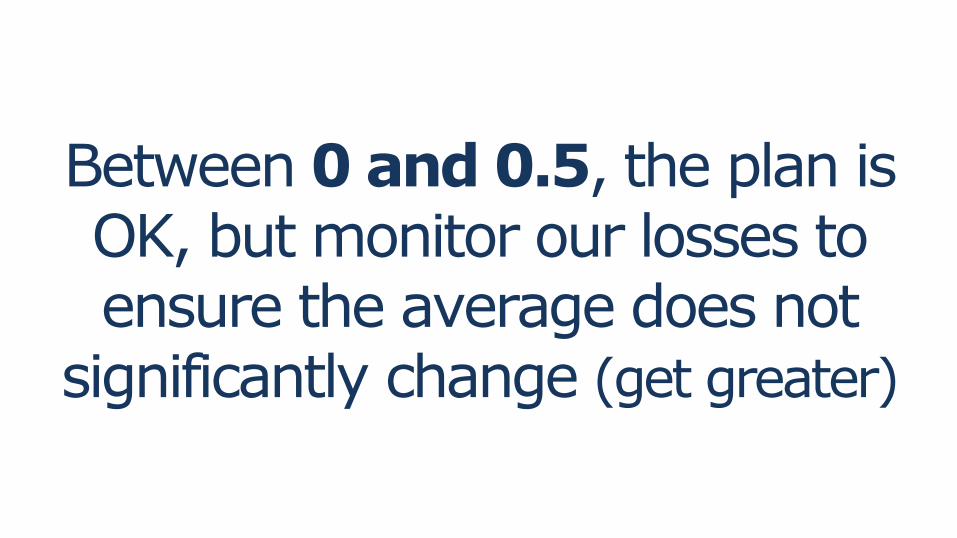
Between 0 and 0.5, the plan is OK, but monitor our losses to ensure the average does not
significantly change (get greater)
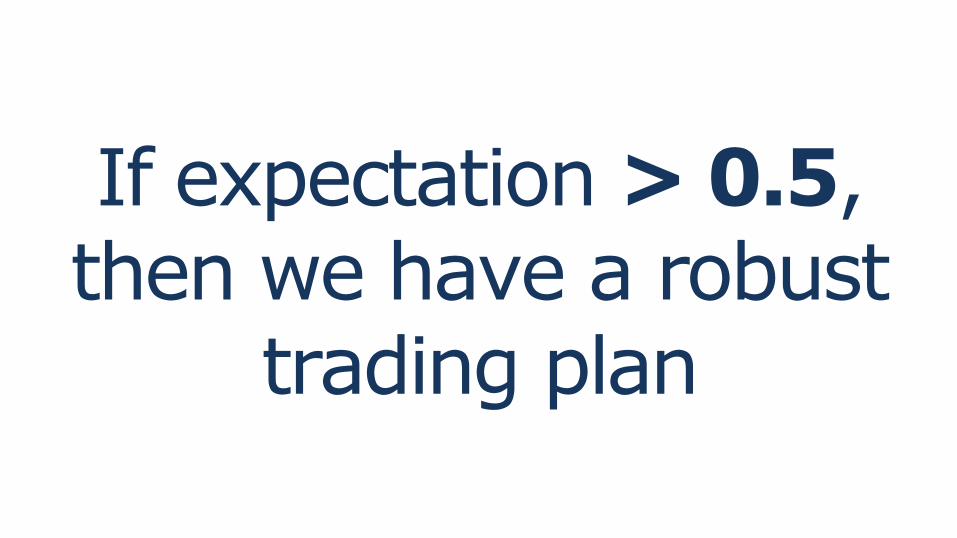
If expectation > 0.5, then we have a robust
trading plan
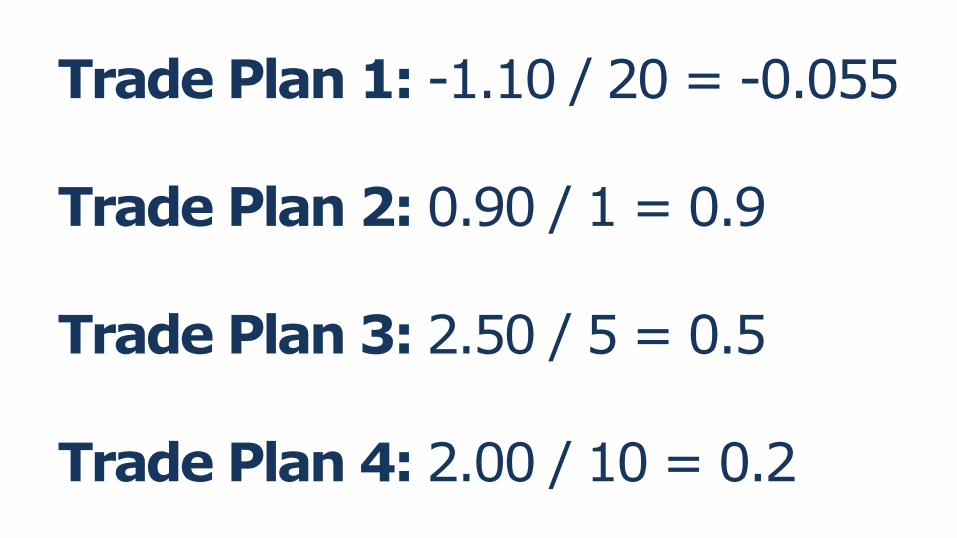
Trade Plan 1: -1.10 / 20 = -0.055
Trade Plan 2: 0.90 / 1 = 0.9
Trade Plan 3: 2.50 / 5 = 0.5
Trade Plan 4: 2.00 / 10 = 0.2
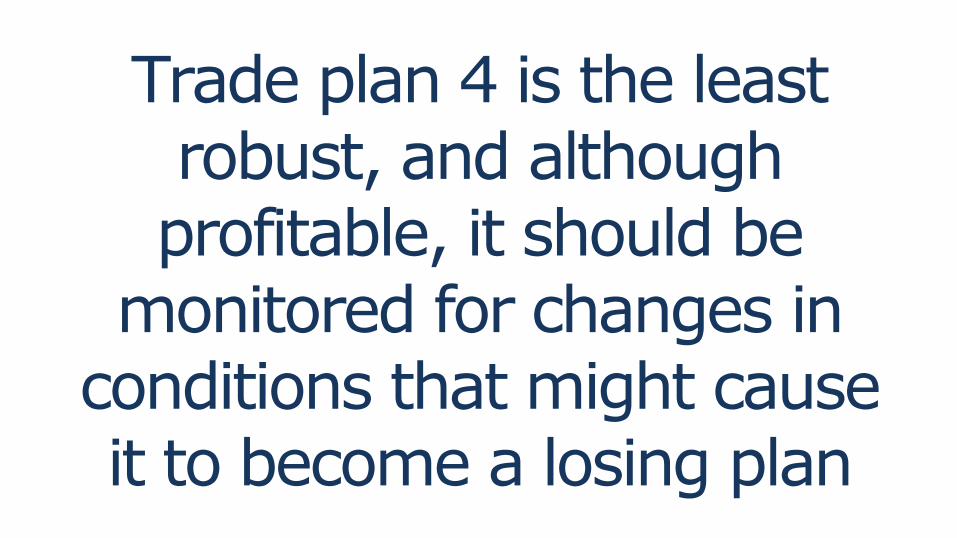
Trade plan 4 is the least robust, and although profitable, it should be
monitored for changes in conditions that might cause it to become a losing plan
The metrics presented here will at least ensure
that the plan has potential to be
profitable in the long run
The next time someone asks for your
win rate, give them some other statistics.
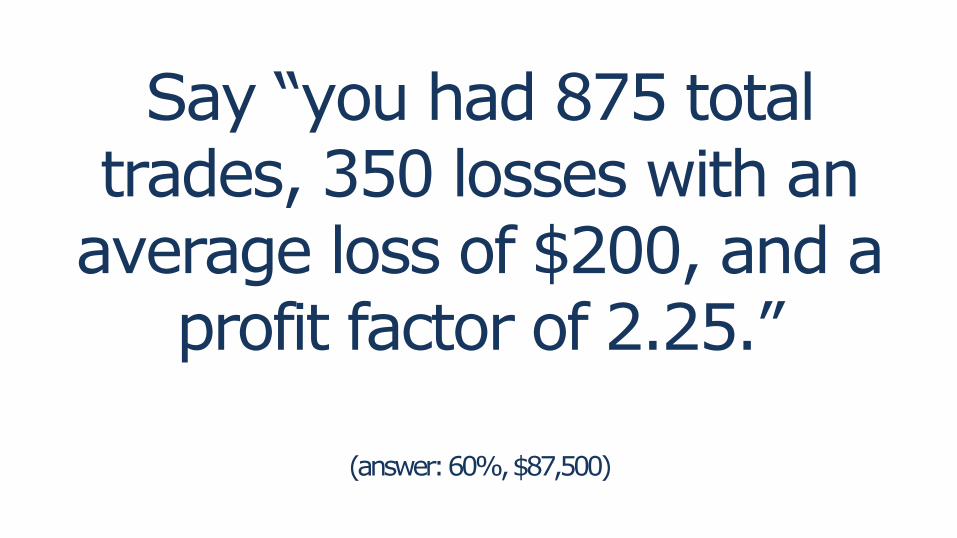
Say “you had 875 total trades, 350 losses with an
average loss of $200, and a profit factor of 2.25.”
(answer: 60%, $87,500)


![Proposals to Extend Healthy Life Expectancy in Shizuoka ...€¦ · [Gap between life expectancy and healthy life expectancy in Shizuoka Prefecture] Healthy life expectancy *Source:](https://img.pdfslide.us/doc/110x75/5f427921a09c2479a15262fb/proposals-to-extend-healthy-life-expectancy-in-shizuoka-gap-between-life-expectancy.jpg)