Embed Size (px)
DESCRIPTION
Citation preview

Leadership for Web 2.0 in Education: Promise&RealityCCoonndduucctteedd bbyy MMeettiirrii GGrroouupp
S u p p o r t e d b y

Authors: Cheryl Lemke and Ed Coughlin, Metiri Group Research Team: Lauren Garcia, Daren Reifsneider, and Jessica Baas, Metiri Group
This publication was made possible through a grant from the John D. and Catherine T. MacArthur Foundation. The John D. and Catherine T. MacArthur Foundation supports creative people and effective institutions committed to building a more just, verdant, and peaceful world. In 2006, MacArthur launched a $50 million digital media and learning initiative to help determine how digital technologies are changing the way young people learn, play, socialize, and participate in civic life. To learn more about the MacArthur Foundation and its grantmaking in digital media and learning, visit www.macfound.org. The Consortium for School Networking (CoSN), a non-profit organization, is the premier voice in education technology leadership. Its mission is to advance the K-12 education community's capacity to effectively use technology to improve learning through advocacy, policy, and leadership development. Its members represent chief technology officers (CTOs), technology leaders in school districts, state and local education agencies, nonprofits, and companies and individuals who share its vision. To learn more about CoSN, visit www.cosn.org. This report was conceptualized by the Consortium for School Networking and commissioned by CoSN to Metiri. Metiri Group, a nationally recognized consulting firm located in the greater Los Angeles area, specializes in education technology, professional development, 21st Century Learning, and evaluation of K-12 learning. To learn more about Metiri, visit www.metiri.com. Suggested citation: Lemke, C., Coughlin, E., Garcia, L., Reifsneider, D., & Baas, J. (2009). Leadership for Web 2.0 in Education: Promise and Reality. Culver City, CA: Metiri Group. Commissioned by CoSN through support from the John D. and Catherine T. MacArthur Foundation.

Table of Contents
EXECUTIVESUMMARY........................................................................................................................................5
INTRODUCTION ................................................................................................................................................. 13
THEDISTRICTADMINISTRATORS’PERCEPTIONSOFWEB2.0 ......................................................... 14
WEB2.0:EDUCATIONALPOLICIES .............................................................................................................. 19
TEACHING,LEARNINGANDWEB2.0 .......................................................................................................... 33
SYSTEMICTHINKINGANDLEADERSHIP ................................................................................................... 40
APPENDIX ............................................................................................................................................................ 51
Supported by
www.macfound.org
Conducted by
About the Study
The intent of this study is to document K-12 Web 2.0 policies, practices, and perspectives in American schools from the perspective of school district administrators. The study was made possible through the generous support of the John D. and Catherine T. MacArthur Foundation.
The CoSN study methodology included: 1) the design and field testing of a Web 2.0 survey for three respondent groups: school district superintendents, curriculum directors, and technology directors; 2) the constructing of a representative, random sample from the 14,199 public school districts in the U.S. stratified by four locales (e.g., urban, suburban, town, and rural); 3) the data collection through online surveys; 4) the weighting of findings to ensure demographic representativeness; and 5) analysis and reporting of the results.
The report is based on the surveys from nearly 1200 district administrators, including 389 superintendents, 441 technology directors, and 359 curriculum directors. The reader will note that throughout the report, Metiri identifies the respondent group(s) and the associated weighted number of respondents who answered any particular question or series of questions. The complete methodology for the survey is included in the Appendix.
For further information, see www.cosn.org.

“Social network sites, online games, video-sharing sites, and gadgets such as iPods and mobile phones are now fixtures of youth culture. They have so permeated young lives that it is hard to believe that less than a decade ago these technologies barely existed.
Today’s youth may be coming of age and struggling for autonomy and identity as did their predecessors, but they are doing so amid new worlds for communication, friendship, play, and self-expression.”
- Dr. Mizuko Ito, MacArthur Foundation Living and Learning with New Media, 2009
Web 2.0 in American schools: Administrator Perspectives 5
Leadership for Web 2.0 in Education: Promise and Reality Executive Summary “Today's digital natives (our students) expect to communicate, learn and explore their world using technology 24/7. To keep up with them, to meet their learning preferences and to engage them in the learning process, we need to make schools relevant to them. We cannot do that without keeping up with technology and Web 2.0.”
– A Curriculum Director in New York Web 2.0 tools can provide highly interactive and participatory environments that establish communities, open a myriad of communication channels, and ensure each individual and group a voice. In fact, there is a growing body of evidence that the collaboration inherent in the participatory nature of Web 2.0 tools can be leveraged to deepen student learning through authentic, real-world learning. Today’s children and youth are immersed in the participatory Web 2.0 culture outside of schools, but too many are being asked to check their technologies each morning at the schoolhouse door. In this study, the Consortium for School Networking (CoSN) set out to answer the question, “To what extent are American K-12 schools redesigning schools to tap into the learning potential of Web 2.0?” Through the generous support of the John D. and Catherine T. MacArthur Foundation, and with cooperation from ASCD and Common Sense Media, CoSN commissioned the Metiri Group to conduct the study. The findings indicate that, at this point in time, educational mindsets and school cultures do not yet align learning to the realities of the 21st Century.
Supported by
www.macfound.org
Conducted by
There are, however, also encouraging data which suggest that district administrators do see the educational significance for Web 2.0 and recognize the need for educational innovation. This report will provide a basis for the development of a plan of action that CoSN, in conjunction with other educational organizations and agencies, will develop and implement in the months ahead.
Web 2.0 – A Definition Web 2.0 is defined as an online application that uses the World Wide Web (www) as a platform and allows for participatory involvement, collaboration, and interactions among users. Web 2.0 is also characterized by the creation and sharing of intellectual and social resources by end users. Examples of Web 2.0 applications are web logs or “blogs”; online diaries that allow the originator and readers to state ideas and react; WIKIS (e.g., Wikipedia), which are topical collections of information that can be edited by multiple individuals within a group; and social networking sites (e.g., Facebook) where users can create personalized pages of information and interact with others.

6 Web 2.0 in American schools: Administrator Perspectives
Education and Web 2.0: Circa 2009 Education is a key element of the 2009 stimulus package launched by U.S. leaders to revive the vibrancy and strength of the American economy. The parallel investments in the economy and education underscore the importance of an informed, educated, 21st Century citizenry and workforce to this nation’s recovery. The realities of the 21st Century – globalization, innovation fueling the economy, mounting complexity of issues in every realm of society, rapidity of technological advances – must be addressed in the preparation of children and youth in this country and around the globe. In order to be competitive and responsible economically, politically, environmentally, and socially, U.S. youth must graduate from school ready to thrive in those realities, one of which is the participatory culture of Web 2.0 technologies. The results from this study indicate that the velocity of innovation and change in society, as represented by Web 2.0, is outpacing K-12 education’s current capacity for innovation. These findings represent a call to action for the nation’s leaders. Innovative leadership will be required if all 14,199 school districts in the nation are to redesign learning to align to the realities of the 21st Century. The call is both immediate in its urgency to ensure that educators are effectively tapping the potential of participatory environments inherent in Web 2.0, and long-term in the need to use Web 2.0 to establish school cultures that continuously promote and embrace innovations that advance deep, authentic learning. Through this study, CoSN has established a baseline metric for the innovative work ahead of K-12 schools. The convergence of emerging technologies, such as Web 2.0, together with the call for action from the American Recovery and Reinvestment Act (ARRA) represents a window of opportunity for educational policymakers and practitioners to take action. CoSN will be working with the John D. and Catherine T. MacArthur Foundation to advance this work. CoSN and its collaborators invite readers to review and reflect on these findings and then to join forces with CoSN in leading the systemic, innovative change required of today’s schools.
“… everywhere we look, there is work to be done. The state of the economy calls for action, bold and swift, and we will act — not only to create new jobs, but to lay a new foundation for growth… we will transform our schools and colleges and universities to meet the demands of a new age. All this we can do. And all this we will do.”
– President Obama’s inaugural speech, 20 January 2009
Methodology: The CoSN study methodology included: 1) the design and field testing of a Web 2.0 survey for three respondent groups: school district superintendents, curriculum directors, and technology directors; 2) the constructing of a representative, random sample from the 14,199 public school districts in the U.S. stratified by four locales (e.g., urban, suburban, town, and rural); 3) the data collection through online surveys; 4) the weighting of findings to ensure demographic representativeness; and 5) analysis and reporting of the results.
The report is based on the surveys from nearly 1200 district administrators, including 389 superintendents, 441 technology directors, and 359 curriculum directors. Not all questions were asked of the three administrator respondent groups. Throughout the report, the respondent group(s) and the associated weighted number of respondents who answered each question are identified. A complete methodology is included in the full report.

Web 2.0 in American schools: Administrator Perspectives 7
Summary Of Key Findings
1. The nation’s school district administrators are overwhelmingly positive
about the impact of Web 2.0 on students’ lives and on their education.
Nearly three-quarters of respondents (superintendents and curriculum directors) said that Web 2.0 technologies had been a positive or highly positive force in students’ communication skills and the quality of their schoolwork. Over 50% of those same administrators believe that Web 2.0 has had a positive or highly positive impact on students’ interest in school (67%), interests outside of school (70%), self-direction in learning (65%), sense of community and culture (65%), peer relationships (58%), relationships with parents and family (56%), and homework habits (55%). On the flip side, nearly half of these district administrators said that Web 2.0 had a negative or highly negative influence on exercise/physical conditioning. In addition, some district administrators (26%) said Web 2.0 negatively impacted homework habits. Figure1:Percentageofdistrictadministratorsregisteringpositive/highlypositiveornegative/highlynegativeratingsastotheeffectoftheuseofWeb2.0applicationsonaspectsofastudent’slifeandeducation.
n=1827 (Superintendents and Curriculum Directors). NOTE: The 3rd option: “No Impact” is not shown here
2. Keeping students interested and engaged in school is the top priority for
Web 2.0 use in American schools.
Over 77% of district administrators who responded to this question (superintendents and curriculum directors) agreed or strongly agreed with the statement “Web 2.0 has value for teaching and learning.” When asked about the impact that Web 2.0 will have on teacher-parent communication, student-teacher relationships, and student-to-student relationships, most anticipated that Web 2.0 would have a positive impact.
The seven highest-ranking priorities for Web 2.0 use by district administrators were:
1. Keep students interested and engaged in school 2. Meet the needs of different kinds of learners 3. Develop critical thinking skills 4. Develop capabilities in students that can't be acquired through traditional methods 5. Provide alternative learning environments for students 6. Extend learning beyond the school day 7. Prepare students to be lifelong learners
-49%
-19%
-26%
-21%
-21%
-15%
-12%
-16%
-12%
-11%
-14%
11%
46%
55%
56%
58%
65%
65%
67%
70%
73%
73%
-80% -40% 0% 40% 80%
Exercise/conditioning
Behavior in school
Homework habits
Relationships with parents/family
Peer relationships
Sense of community/culture
Self-direction/regulation
Interest in school
Outside interests
Quality of schoolwork
Communications skill
Highly negative or negative influences
Highly positive or positive influences

8 Web 2.0 in American schools: Administrator Perspectives
It is also interesting to note that two issues identified nationally as key to America’s competitiveness, global awareness and teaming/collaboration, did not make the top 7 list. With participatory cultures the essence of Web 2.0, it is apparent that K-12 district administrators have yet to realize that potential for learning.
3. The majority of district administrators believe that student use of Web
2.0 should be limited to participation on approved educational websites.
Over 60% of district administrators polled (superintendents, technology directors, and curriculum directors) believe that student use of Web 2.0 should be limited to approved educational sites. A significant minority of district administrators (24%) holds the less restrictive position that all use should be allowed, provided it is supervised. A higher percent of urban administrators were more inclined toward that less restrictive position than were their colleagues in other locales. Few districts ban all use, but nearly 15% advocate restricting use to within-district participation or limiting use to the accessing of information only. The least restrictive policies were advocated by curriculum directors (versus technology directors and superintendents) and by urban district administrators (in comparison to suburban, town, and rural locales).
Figure2.PercentageofdistrictadministratorsdescribingtheirdistrictpositionsregardingtheuseofWeb2.0inschools.
n=3,228 (Superintendents, Technology Directors, and Curriculum Directors). *Weighted average across all respondent groups.
School districts are only now developing new policies and practices regarding Web 2.0. Most are exploring the potential of Web 2.0 as they seek to build student awareness, keep students safe, and develop a sense of responsibility and rights related to Internet use among students, staff, and community. The following quote from a superintendent of schools exemplifies that struggle.
“Ensuring that students know how to utilize Web 2.0 tools in a safe and ethical way. The technology is here to stay—but our efforts to educate students on ethical use of this technology is primarily in implementing its regular use in the classroom.”
– A Superintendent in Nebraska
1%
10%
8%
60%
21%
0%
2%
6%
69%
23%
0%
7%
9%
58%
25%
0% 20% 40% 60% 80%
No use should be allowed in the district (0%*)
Use should be limited to “access information only" (7%*)
Within-district participation should be allowed (8%*)
Participation on approved educational sites should be allowed (61%*)
All use should be allowed provided it is supervised (24%*)
Curriculum Director
Technology Director
Superintendent

Web 2.0 in American schools: Administrator Perspectives 9
4. The majority of school districts ban social networking (70%) and chat
rooms (72%) while allowing prescribed educational use for most of the other Web 2.0 tools (e.g., blogging, using wikis, sharing music or sound files, sharing visual media, posting messages, participating in virtual worlds, playing interactive games, creating polls or surveys, etc.). Over three-fourths of all technology directors agreed or strongly agreed with the following statement: “Web 2.0 has caused the district to have discussions regarding its possible use and misuse.” The majority (57%) agreed or strongly agreed that Web 2.0 had caused their district policymakers to become nervous about student use. Most technology directors also reported that some incidences of misuse had occurred in their districts. They identified the number one problem with student use of Web 2.0 as “wasting of time/distractions to learning,” followed by: use of non-authoritative or biased sources, inappropriate or rude online social interactions, accessing inappropriate materials, and students giving out personal information. The data from the surveys indicate that districts institute formal policies mainly in areas that surface as problems, such as those listed above. Currently most schools ban social networking and chat rooms, and over a third ban the sharing of visual media files, playing interactive games, sharing music or sound files and posting message on web sites. See Figure 3. Figure3:PercentageoftechnologydirectorswhoreportedwhichtypeofpoliciesguidetheuseofspecificWeb2.0applicationsintheirdistricts.
n=907 (Technology Directors)
Most district administrators reported relying on acceptable use policies, filtering systems, and informal practices to guide student use of the Web. Over 50% of district administrators reported that their filtering systems were more restrictive than that required by the federal policies.
72%
70%
39%
38%
37%
33%
31%
30%
27%
18%
14%
7%
5%
27%
29%
56%
57%
56%
61%
58%
57%
63%
64%
63%
72%
74%
2%
1%
5%
5%
7%
6%
11%
12%
11%
18%
23%
22%
21%
0% 20% 40% 60% 80% 100%
Participating in chat rooms
Social Networking
Sharing visual media files (e.g., photos, images, videos, YouTube, etc.)
Playing interactive games
Sharing music or sound files
Posting messages
Site-building (FreeWebs, etc.)
Participating in virtual worlds
Blogging
Creating polls or surveys
WIKI’s (Collaborative-editing information sites such as Wikipedia)
Creating and sharing content
Participating in online, collaborative projects
Prohibits all student use
Allows prescribed educational use of the web only
Allows all student use of the web

10 Web 2.0 in American schools: Administrator Perspectives
5. While reporting low levels of general use, curriculum directors did
describe significant opportunities for use of Web 2.0 tools in curricula and teaching materials.
District administrators reported that the uses of Web 2.0 most easily integrated into more traditional instructional practices are currently the ones most commonly included in curricula and instructional practices such as sharing visual media, creating polls or surveys, and participating in online, collaborative projects. Figure4:PercentageofdistrictadministratorswhoreportedWeb2.0useinteachingmaterialsadoptedbythedistrictorincludedintheformalcurricula
n=715 (Curriculum Directors). Note: Percentages sum to more than 100 percent due to multiple responses.
While district administrators believe there is potential value to learning in the Web 2.0 applications with significantly less use, the implication is that the more such use would require significant shifts in instructional approach, use of time, role and responsibility of learner and teacher, etc., the less likely it is that they will be used in schools.
6. Curriculum directors reported that Web 2.0 will be used most effectively at all grade levels in the content areas of social studies, writing, science, and reading. A majority of curriculum directors anticipate that Web 2.0 will positively impact four major content areas at all grade levels: social studies, writing, science, and reading. The top three Web 2.0 applications associated with use in these content areas are: sharing visual media, online collaborative projects, and creating polls and surveys. Over half of the curriculum directors reported that they expect little Web 2.0 impact at the elementary level in the areas of mathematics, visual and performing arts, or foreign language. Conversely, curriculum directors anticipated a positive Web 2.0 impact in those areas at the middle and high school levels.
16%
20%
27%
30%
31%
38%
46%
54%
63%
77%
% 20% 40% 60% 80% 100%
Social networking (Facebook, etc.)
Participating in virtual worlds
Playing interactive games
Participating in online communities of interest (Science Fiction, Going Green, etc.)
Site-building (FreeWebs, etc.)
Sharing music or sound files
Blogging (Web logs or diaries)
Participating in online, collaborative projects
Creating polls or surveys
Sharing visual media files (photos, images, videos, presentations, etc.)

Web 2.0 in American schools: Administrator Perspectives 11
7. While there was broad agreement that Web 2.0 applications hold educational value, the use of these tools in American classrooms remains the province of individual pioneering classrooms.
The majority of administrators reported that Web 2.0 tools have not been integrated into their district’s curriculum. Over half of superintendents and curriculum directors also reported that these applications were not being used to support teaching and learning in their districts.
8. Web 2.0 is outpacing K-12 education’s current capacity to innovate.
School district administrators acknowledged the critical need to use Web 2.0 to transform teaching and learning, and to change the structure of schools over the next decade. And yet, few had systemically begun to research, plan, or implement effective uses of Web 2.0, nor had they used Web 2.0 to restructure their schools into more participatory cultures. More than 95% of district administrators said that Web 2.0 will require a new type of teacher training, 86% said that Web 2.0 will result in a blending between formal and informal learning, and 79% said that schools should take full responsibility for modeling Web 2.0 to deepen learning. Yet only 44% reported taking full responsibility for the restructuring of schools to accommodate Web 2.0. Figure5.Percentageofdistrictadministratorswho“Agreed”or“Stronglyagreed”that:
n=1,644(SuperintendentsandCurriculumDirectors).
Figure6.Percentageofdistrictadministratorswhosaidthatschoolshadfullresponsibilityfor:
n=2,487 Superintendents, Technology Directors, and Curriculum Directors). NOTE: Respondents were asked to rate the statements above on a 6-point scale, anchored at 1 “No Responsibility” to 6 “Full Responsibility.” Percentages above are the sum of respondents who selected either 5 or 6.
“The traditional way we ‘do school’ will change as students have more access to the world around them. If we are producing globally competitive students, we have to adapt to the world they will encounter.”
–An Urban Superintendent
96% 86%
0%
20%
40%
60%
80%
100%
Web 2.0 requires a new type of teacher
training
Web 2.0 will engender a cohesive blend between formal learning in schools & informal learning off
campus
79%
44%
0%
20%
40%
60%
80%
100%
Modeling appropriate uses of Web 2.0 that
deepen learning
Restructuring to accommodate Web
2.0

12 Web 2.0 in American schools: Administrator Perspectives
9. District administrators, the persons responsible for decision making on
Web 2.0 in schools, are more passive than active users in the Web 2.0 space.
Most of the current use of Web 2.0 applications by district administrators (superintendents, technology directors, and curriculum directors) is restricted to accessing and viewing of content using a few of the more common applications such as Wiki’s and blogs. Figure7:PercentageofdistrictadministratorsindicatingtheirhighestlevelofuseofeachoftheseWeb2.0applications.
n=2395 (Superintendents, Technology Directors, and Curriculum Directors) There was some variation in the personal use of Web 2.0 by administrators according to job classification (i.e., technology directors’ usage was more interactive than was superintendents or curriculum directors). However, overall use by all three administrator roles was primarily limited to the accessing of content, with very low percentages either interacting or responding on line, and fewer still originating content online. This lack of experience with Web 2.0 by decision makers may be due to the recency of Web 2.0, but comments from survey respondents indicate that it serves as a barrier to informed decision making. “I am not sure we all know what is out there to be used — no less how to effectively use it!” – A Superintendent
45%
14%
10%
29%
14%
55%
20%
35%
52%
18%
6%
5%
20%
4%
18%
12%
22%
11%
6%
10%
2%
20%
2%
7%
11%
12%
11%
% 20% 40% 60% 80% 100%
Communities of interest
Shared bookmarking
Collaborative gaming
Virtual Learning Environments
Virtual worlds
Media sharing sites
Personal profiling sites
Web logs (blogs)
WIKI’s
I access and view content
I interact and respond to others’ content
I originate content for others to access and react to

Web 2.0 in American schools: Administrator Perspectives 13
Leadership for Web 2.0 in Education: Promise and Reality Introduction “Today's digital natives (our students) expect to communicate, learn, and explore their world using technology 24/7. To keep up with them, to meet their learning preferences, and to engage them in the learning process, we need to make schools relevant to them. We cannot do that without keeping up with technology and Web 2.0.”
– A Curriculum Director in New York
Today’s schools must “adapt to a new reality” – the reality of a society where the populace lives and breathes Web 2.0, in real-time, online 24/7, in participatory communities. This publication provides readers with a look at the findings from the 2009 CoSN Web 2.0 survey of school district administrators from across the United States. The results are based on online surveys completed by nearly 1200 district administrators from a stratified sample of the 14,199 public school districts in the nation. Surveys were completed between December 2008 and February 2009. The findings are representative of the four locales, urban, suburban, town, and rural. The purpose of this study is three-fold. First, to establish a 2009 baseline for Web 2.0 policies, practices, and perspectives in American K-12 schools. Second, to investigate the similarities and differences between the three perspectives of superintendents, technology directors, and curriculum directors on a host of issues related to Web 2.0. And third, to ascertain the depth of understanding, the commitment to restructuring of schools to leverage Web 2.0, and the urgency for such change among K-12 district administrators. The methodology for the survey design and sampling is included in the Appendix. The executive summary provides the key findings from the study. The CoSN study team invites your feedback and reflections at the www.cosn.org site.
Web 2.0 – A Definition Web 2.0 is defined as an online application that uses the World Wide Web (www) as a platform and allows for participatory involvement, collaboration, and interactions among users. Web 2.0 is also characterized by the creation and sharing of intellectual and social resources by end users. Examples of Web 2.0 applications are web logs or “blogs”; online diaries that allow the originator and readers to state ideas and react; WIKIS (e.g., Wikipedia), which are topical collections of information that can be edited by multiple individuals within a group; and social networking sites (e.g., Facebook) where users can create personalized pages of information and interact with others.
14 Web 2.0 in American schools: Administrator Perspectives
The District Administrators’ Perceptions of Web 2.0
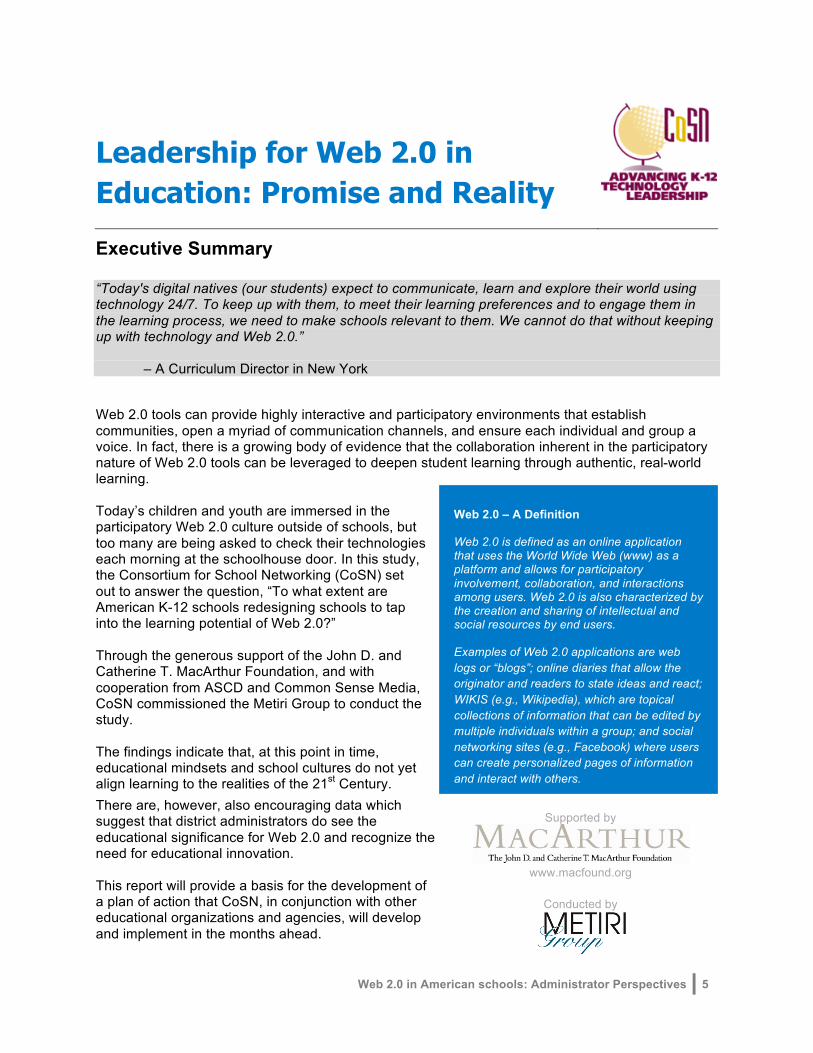
District administrators, including superintendents, technology directors, and curriculum directors, were surveyed on their perceptions of how Web 2.0 has impacted the lives and education of their students, and how Web 2.0 will impact teaching and learning in K-12 schools. District administrators said that Web 2.0 was generally a positive influence on students’ lives, especially on their communications skills, the quality of their schoolwork, and interests outside of school. However, nearly half of district administrators said Web 2.0 had a negative or highly negative
influence on exercise/physical conditioning. In addition, despite the fact that the majority of district administrators felt that Web 2.0 had had a positive or highly positive influence on students’ homework, nearly a quarter of their colleagues disagreed, noting a negative or slightly negative influence. The only area in which superintendents and curriculum directors’ ratings differed significantly was in reference to students’ “sense of community and culture," with 71% of curriculum directors rating it as positive in comparison to 57% of superintendents. Across all areas, the urban district administrators reported the largest percentage of positive or highly positive responses, followed by suburban, town, and rural locales. For example, while 76% of urban respondents said student behavior was positively or highly positively influenced by Web 2.0, only 46% of rural respondents agreed. Figure8:Percentageofdistrictadministratorsregisteringpositive/highlypositiveornegative/highlynegativeratingsastotheeffectoftheuseofWeb2.0applicationsonaspectsofastudent’slifeandeducation.
*n=1827 (Superintendents and Curriculum Directors); **n=1899 (Superintendents and Curriculum Directors) Note: Percentages do not add to 100% because the neutral option of No Impact is not shown here.
49%
19%
26%
21%
21%
15%
12%
16%
12%
11%
14%
11%
46%
55%
56%
58%
65%
65%
67%
70%
73%
73%
0% 20% 40% 60% 80% 100%
Exercise/physical conditioning*
Behavior in school*
Homework habits**
Relationships with parents/family**
Peer relationships*
Sense of community/culture**
Self-direction/regulation*
Interest in school**
Outside interests (hobbies, sports, clubs, etc.)**
Quality of schoolwork*
Communications skill*
Highly positive or positive influences
Highly negative or negative influences
The majority of district administrators believe that Web 2.0 has had a positive influence on most aspects of students’ lives and education, with two notable exceptions: behavior in school and exercise/physical conditioning.

Web 2.0 in American schools: Administrator Perspectives 15
TheOpportunity Over 75% of all district administrators, (superintendents and curriculum directors) who were polled indicated that Web 2.0 holds potential value for teaching and learning. District administrators’ top three priorities for improving student learning through the use of Web 2.0 were:
Keeping students interested and engaged in school Meeting the needs of different kinds of learners Developing critical thinking skills
The table below provides insights into the priorities of each of the respondent groups as well as district administrators in urban, suburban, town, and rural locales. It is notable that the top three priorities did not differ across respondent groups or locales. Just as notable are the low ranking by district administrators of two issues that have been identified as critical to U.S. competitiveness – global awareness and teaming/collaboration. While global awareness was included in both superintendents’ and suburban district administrators’ top seven priorities, it was a 9th or 10th priority for curriculum directors and other locales. Given the participatory nature of Web 2.0, the fact that teaming and collaboration didn’t make it into the top 10 of any group suggests that educators do not yet place high value on the essence of Web 2.0 – participatory, interactive communication, collaboration, and contribution. See Table 1. Table1:Rankingsofdistrictadministrators’topprioritiesforimprovingstudentlearningthroughtheuseofWeb2.0,nationally,byrespondentgroup,andbylocale.
Rankings by Respondent Group
Rankings by Locale
Ranked National Priorities for Web 2.0* Superintendents Curriculum Directors
Urban Districts
Suburban Districts
Town Districts
Rural Districts
1. Keep students interested and engaged in school 1 1 1 1 1 1
2. Meet the needs of different kinds of learners 2 2
2 2 2 2
3. Develop critical thinking skills 3 3 3 3 3 3
4. Develop capabilities in students that can't be acquired through traditional methods
6
4 4
5 5 5
5. Provide alternative learning environments for students 5 5 6 9 6 4
6. Extend learning beyond the school day 4
6 5
7 4 7
7. Prepare students to be lifelong learners 8 7 7 8 8 6
8. Prepare students to be thoughtful, ethical, and informed participants in online environments
9 8 8
6 9 8
9. Increase students’ global awareness 7 9 9 4 10 9
10. Connect students in our schools with students in other locations.
10 10 13 10 7 10
n=2046 (Superintendents and Curriculum Directors) *Other options of lower priority to respondents and not listed above include: offer opportunities for students to create innovative products; build the capacity of students to function successfully on teams; provide opportunities for all students to voice ideas; document student progress over time (e.g., performance assessment); provide opportunities for community-based projects.
Keeping students interested and engaged is a top priority of district administrators as they strive to improve student learning through Web 2.0 in American schools.

16 Web 2.0 in American schools: Administrator Perspectives
Example: Keeping students interested and engaged in school “We used our secure blog to ‘discuss’ social networking, text speak, and cell phones with our 9th grade students in a summer program. They were positively impacted because they could share their experiences with their parents and increase communication with their families and teachers.” – A Technology Director in Texas “A biology class sits in on open heart surgery; students work on class work from home; students who can't come to class click on a podcast for a ‘lecture,’ ...” – A Technology Director in Michigan “We threw out the textbook when studying globalization and Skyped people who do business together in Chicago and Hong Kong - much more meaningful.” – A Technology Director in Illinois Example: Meeting the needs of different kinds of learners “The high school mathematics department is videoing teacher explanations of problem-solving and putting the videos on Moodle, and on student's iTouch and iPods, so that the students can review the instructions as many times as needed.” – A Curriculum Director from Minnesota The survey results indicate that significant percentages of district administrators believe that Web 2.0 will have a positive impact on student-to-student, student-to-teacher, and teacher-to-parent relationships. An analysis of the data revealed that curriculum directors’ responses were considerably more positive in these views than were superintendents. See Figure 9. The percentage of districts administrators with negative or highly negative responses was below 10% on teacher/parent communication and student/teacher relationships, but was 16% for student/student relationships. It seems district administrators are indicating that this latter area is one to watch as Web 2.0 is leveraged in schools. Figure9:PercentageofsuperintendentsandcurriculumdirectorswhoanticipatepositiveimpactsfromWeb2.0onthetypesofrelationshipslistedbelow.
n=1580 (Superintendents and Curriculum Directors) There were also distinct differences of opinion among administrators across locales on these issues. The percentage of urban and suburban administrators who anticipated positive or very positive impacts on student/student relationships and student/teacher relationships was somewhat larger than that of town or rural administrators. On the topic of teacher/parent communication, the most optimistic were suburban district administrators. See Figure 10.
56%
63%
75%
73%
77%
86%
0% 20% 40% 60% 80% 100%
Student/student relationships
Student/teacher relationships
Teacher/parent communication
Curriculum Directors
Superintendents
Web 2.0 in American schools: Administrator Perspectives 17
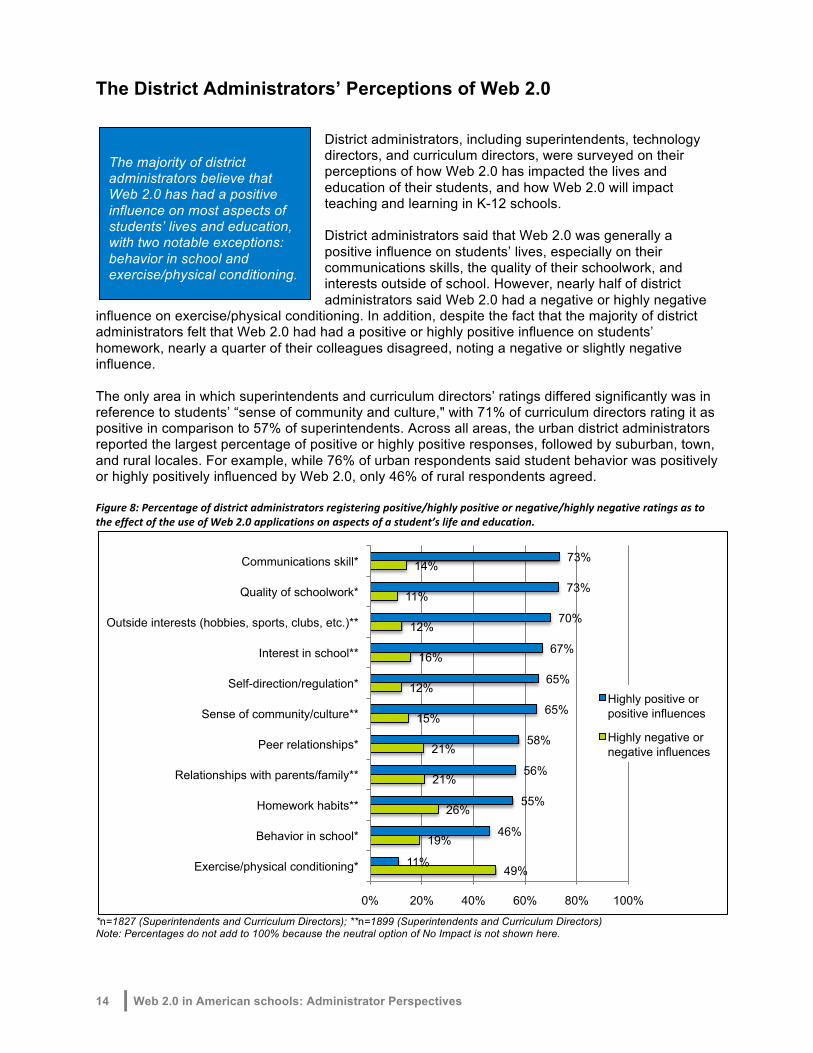
Figure10:Percentageofdistrictadministrators,disaggregatedbylocale,whoanticipatepositiveimpactsfromWeb2.0onstudent/studentrelationships.
n=1580 (Superintendents and Curriculum Directors)
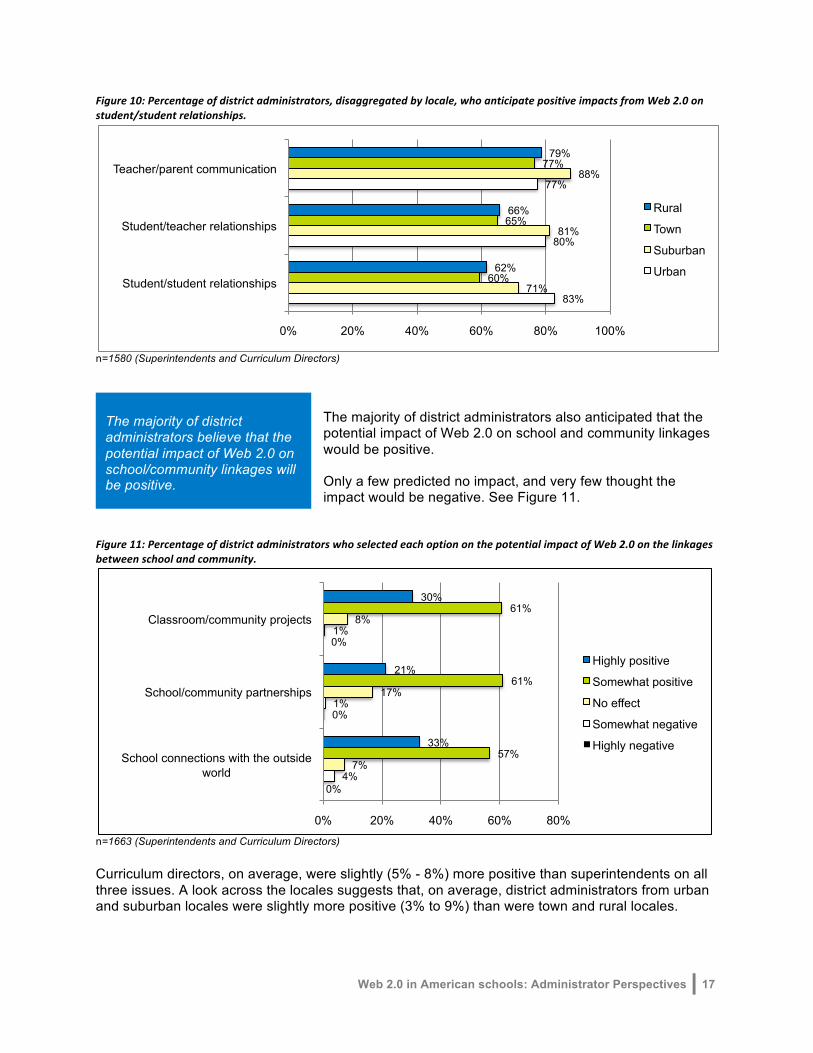
The majority of district administrators also anticipated that the potential impact of Web 2.0 on school and community linkages would be positive. Only a few predicted no impact, and very few thought the impact would be negative. See Figure 11.
Figure11:PercentageofdistrictadministratorswhoselectedeachoptiononthepotentialimpactofWeb2.0onthelinkagesbetweenschoolandcommunity.
n=1663 (Superintendents and Curriculum Directors) Curriculum directors, on average, were slightly (5% - 8%) more positive than superintendents on all three issues. A look across the locales suggests that, on average, district administrators from urban and suburban locales were slightly more positive (3% to 9%) than were town and rural locales.
83%
80%
77%
71%
81%
88%
60%
65%
77%
62%
66%
79%
0% 20% 40% 60% 80% 100%
Student/student relationships
Student/teacher relationships
Teacher/parent communication
Rural
Town
Suburban
Urban
0%
0%
0%
4%
1%
1%
7%
17%
8%
57%
61%
61%
33%
21%
30%
0% 20% 40% 60% 80%
School connections with the outside world
School/community partnerships
Classroom/community projects
Highly positive
Somewhat positive
No effect
Somewhat negative
Highly negative
The majority of district administrators believe that the potential impact of Web 2.0 on school/community linkages will be positive.

18 Web 2.0 in American schools: Administrator Perspectives
Leveraging Web 2.0 in the Content Areas
Curriculum directors identified four key content areas that they predicted would be most positively impacted by Web 2.0 in upcoming years. They are: social studies, writing, science, and reading. While these results were consistent across the grade levels, there were differences of opinion regarding any impact beyond the top four. As Figure 12 demonstrates, curriculum directors (the only group asked this question) were slightly more positive about the potential of Web 2.0 for high schools and middle schools than for elementary schools.
At the elementary level, 45% or less of curriculum directors predicted a positive effect for Web 2.0 in physical education/health, visual and performing arts, ELL/ESL, and mathematics. At the middle and high school levels, the only area where less than 50% of curriculum directors anticipated a positive impact due to Web 2.0 was in physical education/health. Figure12:PercentageofcurriculumdirectorswhoanticipatedthatWeb2.0wouldhaveapositiveimpactonidentifiedcurricularareasattheelementary,middle,orhighschoollevels.
n=881 (Curriculum Directors) For more specific information on educational uses of Web 2.0 in the content areas across the grade levels see the Teaching, Learning and Web 2.0 section of this report.
25%
45%
43%
42%
43%
60%
59%
63%
61%
31%
51%
52%
56%
62%
68%
67%
72%
71%
38%
53%
62%
64%
68%
71%
73%
74%
76%
0% 20% 40% 60% 80%
Physical Education/Health
ELL, ESL
Mathematics
Visual & Performing Arts
Foreign Language
Reading
Science
Writing
Social Studies
High School
Middle School
Elementary
Curriculum directors predicted that, across all grade levels, Web 2.0 would be used most effectively in the content areas of social studies, writing, science, and reading.

Web 2.0 in American schools: Administrator Perspectives 19
Web 2.0: Educational Policies
For most school districts, policies and practices regarding Web 2.0 are only now evolving. While district administrators recognize the promises of Web 2.0 for learning, they are extremely wary of the potential pitfalls. Listed below are some direct quotes from district administrators, which provide insights into the challenges and opportunities of Web 2.0. The comments are in response to the question, “What keeps you awake at night about Web 2.0?” Comments: What keeps you awake at night about Web 2.0?
“How do we enable access and still protect students? How do we overcome the media hype on abuses to demonstrate a purpose to many educators who are not Web 2.0 savvy and do not see a purpose? How do we help teachers use this resource with students in a productive and purposeful way? How do we modify policies and security systems to take advantage of, and function in, the environments where many of students live?”
– A Curriculum Director in Maryland
“I do worry about access to inappropriate sites and blogs. We have had significant problems with MySpace, Blink, and Facebook with middle schoolers placing inappropriate and untrue information, bullying others on-line, fighting off-line about it, and having access to people who are not good for them. We have blocked access at school.”
– A Curriculum Director in Wisconsin
“I am always concerned about student safety on the Internet. With the advent of Web 2.0, there are so many more areas of the web that students want to use. I value the information found on the web, but I worry about the possibilities of students being exploited by adults, especially on social sites.”
– A Technology Director in Tennessee
“Ensuring that students know how to utilize Web 2.0 tools in a safe and ethical way. The technology is here to stay—but our efforts to educate students on ethical use of this technology is primarily in implementing its regular use in the classroom.”
– A Superintendent in Nebraska
As their comments suggest, district administrators are concerned about balancing the responsibility and liability associated with Internet safety with the potential learning opportunities of Web 2.0 and the need to prepare students to thrive in the coming Web 3.0 world.
20 Web 2.0 in American schools: Administrator Perspectives
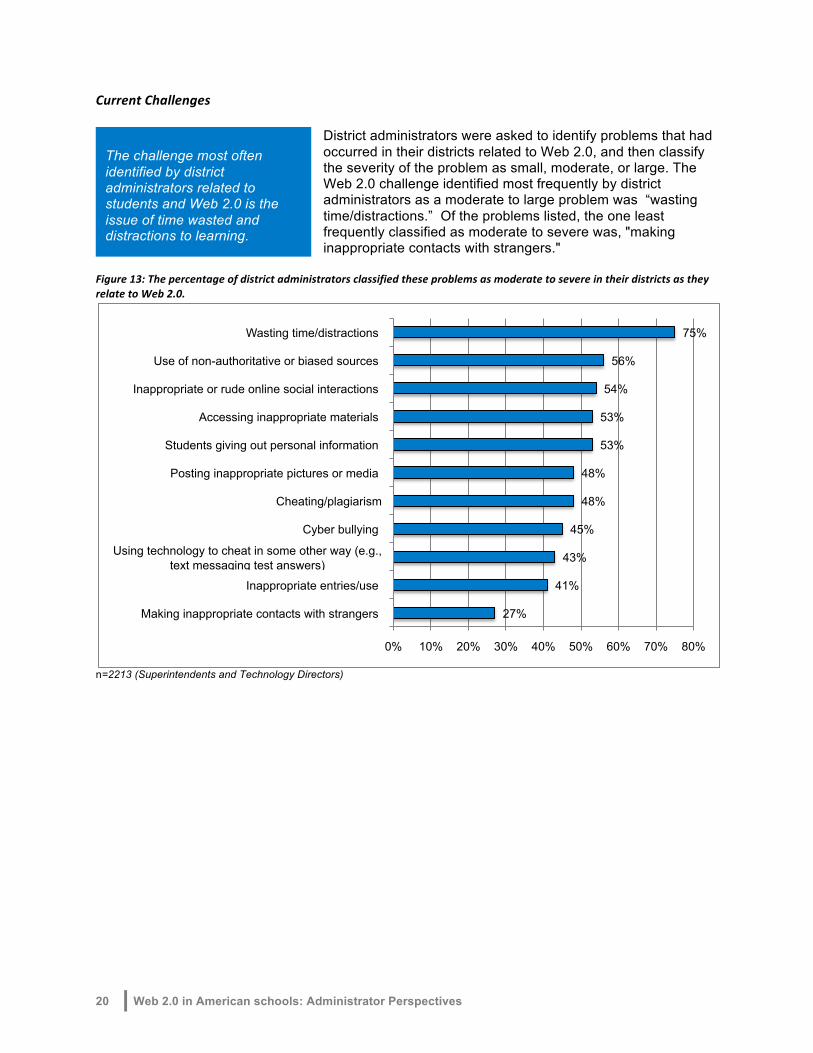
CurrentChallenges District administrators were asked to identify problems that had occurred in their districts related to Web 2.0, and then classify the severity of the problem as small, moderate, or large. The Web 2.0 challenge identified most frequently by district administrators as a moderate to large problem was “wasting time/distractions.” Of the problems listed, the one least frequently classified as moderate to severe was, "making inappropriate contacts with strangers."
Figure13:ThepercentageofdistrictadministratorsclassifiedtheseproblemsasmoderatetosevereintheirdistrictsastheyrelatetoWeb2.0.
n=2213 (Superintendents and Technology Directors)
27%
41%
43%
45%
48%
48%
53%
53%
54%
56%
75%
0% 10% 20% 30% 40% 50% 60% 70% 80%
Making inappropriate contacts with strangers
Inappropriate entries/use
Using technology to cheat in some other way (e.g., text messaging test answers)
Cyber bullying
Cheating/plagiarism
Posting inappropriate pictures or media
Students giving out personal information
Accessing inappropriate materials
Inappropriate or rude online social interactions
Use of non-authoritative or biased sources
Wasting time/distractions
The challenge most often identified by district administrators related to students and Web 2.0 is the issue of time wasted and distractions to learning.

Web 2.0 in American schools: Administrator Perspectives 21
SeverityofWeb2.0Problems All indications from district administrators suggest there are key problems inherent in Web 2.0 use that must be addressed through Internet safety and acceptable use policies. Over 50% of district administrators identified five key issues as severe or moderately severe problems. Superintendents and technology directors generally agreed on the severity of the problems listed in Figure 13 except in four cases. In two of those cases (inappropriate or rude online social interactions and cyber bullying), the superintendents perceived the problem to be more severe than did the technology directors.
In the other two cases (use of non-authoritative or biased sources and wasting time/distractions), the superintendents perceived the problem to be less severe than did the technology directors. See Table 2. Table2:Comparisonofsuperintendents’andtechnologydirectors’perceptionsofmoderatetosevereclassificationofWeb2.0problems,wheredifferenceofaverageswasatleast10%.
Web 2.0 Problem for Schools Percentage of Superintendents who classified the problem as moderate to severe
Percentage of Technology Directors who classified the problem as moderate to severe
Difference between rating by Superintendent and Technology Director
Use of non-authoritative or biased sources
45% 66% 21%
Inappropriate or rude online social interactions
65% 43% 22%
Cyber bullying 55% 35% 20% Wasting time/distractions 69% 80% 11%
CurrentPoliciesonWeb2.0
The majority of superintendents, curriculum directors, and technology directors polled indicated that some level of Web 2.0 use should be allowed and enabled in K-12 schools. District administrators were asked to describe their position on Web 2.0, given options from the non-restrictive to very restrictive. The majority (i.e., 61% of district administrators) selected a moderately restrictive option: “participation on approved educational sites should be allowed,” and 24% reported, “all use should be allowed provided it is supervised.” On average across respondent groups, only 7% of the positions were highly restrictive (i.e., use restricted to
“access information only,” or only within-district use should be allowed). As Figure 14 indicates, curriculum directors and technology directors were slightly less restrictive in their positions than were superintendents, but all groups overwhelmingly believe that Web 2.0 belongs in schools. Later in this document, district administrators are asked for further clarification of their school districts’ positions on specific Web 2.0 applications such as Wiki’s, blogs, social networking, etc. See Figure 18.
The majority of district administrators felt that student use of Web 2.0 should be limited to participation on approved educational websites, while less than a quarter thought that all use should be allowed provided it is supervised.
While few problems were rated as very severe, the majority of district administrators rated five problems as moderately severe. They are: wasting time/distractions, use of non-authoritative or biased sources, inappropriate or rude online social interactions, accessing inappropriate materials, and students giving out personal information.

22 Web 2.0 in American schools: Administrator Perspectives
Figure14:PercentageofdistrictadministratorsdescribingtheirdistrictpositionsregardingtheuseofWeb2.0inschools.
n=3228 (Superintendents, Technology Directors, and Curriculum Directors) *Weighted percentage across all respondent groups. The aforementioned Web 2.0 policy positions varied considerably across locales and respondent groups. For example, consider the 24% of respondents who held the most non-restrictive position, “all use should be allowed provided it is supervised.” Those respondents came disproportionately from the ranks of curriculum directors (25%) and urban district administrators (37%), and were underrepresented from rural locales and from the ranks of superintendents. See Figure 15. Figure15:PercentofdistrictadministratorswhodescribedtheircurrentpositiononWeb2.0policiesastheleastrestrictive,“alluseshouldbeallowedprovideditissupervised.”
n=3228 (Superintendents, Technology Directors, and Curriculum Directors)
1%
10%
8%
60%
21%
0%
2%
6%
69%
23%
0%
7%
9%
58%
25%
0% 20% 40% 60% 80%
No use should be allowed in the district (0%*)
Use should be limited to “access information only" (7%*)
Within-district participation should be allowed (8%*)
Participation on approved educational sites should be allowed (61%*)
All use should be allowed provided it is supervised (24%*)
Curriculum Director
Technology Director
Superintendent
21%
23%
25%
37%
25%
27%
21%
0% 10% 20% 30% 40% 50%
Superintendent
Technology Director
Curriculum Director
Urban
Suburban
Town
Rural

Web 2.0 in American schools: Administrator Perspectives 23
DistrictResponsestoWeb2.0 Are policy leaders and district and school administrators nervous about the use of Web 2.0 in their schools? District administrators say, Yes! Over 53% of district administrators agreed that Web 2.0 “has caused our district policymakers to become nervous about allowing student access to it.” Nearly 80% of district administrators say their districts are having discussions regarding the possible use and misuse of Web
2.0, and 54% of district administrators say Web 2.0 is so new to them that they have not really had a chance to consider how it might be used. See Figure 16. While Web 2.0 is a relatively new topic to 57% of superintendents and 53% of curriculum directors, it is not new to 78% of technology directors. Two curriculum directors commented on the need to move the discussion of Web 2.0 from a technology issue into a curriculum/learning agenda. Comments: View Web 2.0 from a learning perspective! “Why is it that [Web 2.0] is not at the curriculum leaders table, on an agenda, built into the process?” - A Technology Director in Pennsylvania “Teachers and administrators don't know enough to support the students' world...Teachers teach like they were taught; administrators administrator like evaluators of the past...we are a different world. When will our educational system be supported by all federal and state agencies to become the learning environment we must become...It's all so complicated when all we need to do is learn how to learn.” – A Technology Director in Michigan That said, there is significant nervousness about Web 2.0 in schools, serious discussions taking place about potential uses and abuses, and early discussions about how Web 2.0 might be used to the learning advantage of students. While their percentages did not differ much, the majority of curriculum directors thought that Web 2.0 had caused district policymakers to become nervous about allowing student access, while only a minority of technology directors agreed. Similarly, while 56% of curriculum directors considered Web 2.0 so new that their districts had not really had a chance to consider how it might be used, only 41% of technology directors agreed with that assessment. However, higher percentages of technology directors reported that Web 2.0 had caused the district to have discussions regarding its possible use and misuse. See Figure 16. While overall the majority of district administrators agreed with all three statements, there were some differences across locales. Rural district administrators were the most likely to agree about the newness of Web 2.0 when compared to other locales and the least likely to agree that Web 2.0 has caused the district to have discussions regarding its possible use and misuse.
Due in part to the recency of Web 2.0, most districts have been more reactive than proactive in establishing Web 2.0 policies and practices.

24 Web 2.0 in American schools: Administrator Perspectives
Figure16:Percentageofdistrictadministratorsexpressingtheirlevelofagreementforthefollowingphrasesthatcompletethestatement,Web2.0:
n=4528 (Superintendents, Technology Directors, and Curriculum Directors)
Web2.0Policies School districts are in the early stages of developing formal and informal Web 2.0 policies. The policies they have in their repertoire fall into the category of formal and informal. The formal policies are enacted through board policy; official decisions formally communicated through an acceptable user policy that students and/or parents must sign prior to use; a student handbook; official memos that regulate specific uses of Web 2.0; or a written procedure guiding the deployment and operation of a filtering system. The informal is either prescribed use or prohibitions on an ad hoc basis where the prescription or prohibition may vary from educator to educator.
In the case of Web 2.0, many administrators are using existing, pre-Web 2.0 policies such as standards of student conduct, acceptable use policies, and others to guide Web 2.0 use. Often a district will continue to use existing policy until a problem arises, at which time a formal policy may be considered and/or adopted. Most technology directors report that the use of Web 2.0 is guided by filtering student access to the Internet (60%). While some technology directors report that their districts guide Web 2.0 use through formal policies, the evolution of informal practices is more the norm. In fact, only 3% of technology directors report that their districts have formal policies adopted specifically to address Web 2.0. Another 21% depend on formal policies in place before Web 2.0, which they believe now also guide the use of Web 2.0, and 15% depend on informal policies or common practices.
54%
79%
53%
41%
82%
48%
56%
75%
53%
59%
81%
57%
0% 20% 40% 60% 80% 100%
Is so new, our district has not really had a chance to consider how it might be
used
Has caused the district to have discussions regarding its possible use
and misuse
Has caused our district policymakers to become nervous about allowing student
access to it
Superintendent
Curriculum Director
Technology Director
All
The use of Web 2.0 is guided largely by existing, pre-Web 2.0 policies, operationalized through acceptable use policies, Web filtering, and informal practices. Policies specific to Web 2.0 are more the exception than the rule, and when adopted, are typically restrictive in response to encountered problems.

Web 2.0 in American schools: Administrator Perspectives 25
Figure17:Percentageoftechnologydirectorsindicatinghowtheirdistrict’suseofWeb2.0isguided.
n=852 (Technology Directors) * Note: While only 3% of technology directors say formal policies have been adopted to specifically address Web 2.0, in another question 41% of technology directors indicated that their district’s acceptable user policy was updated to address Web 2.0. Technology directors offered examples of either district policies written specifically for Web 2.0, or leadership practices related to the same, which they consider to be exemplary: Comments: Exemplary policies or leadership strategies for Web 2.0 “When planning a Web 2.0 project, teachers are asked to complete a project proposal and give advance notice to building principals.” – A Technology Director in Alaska “Our AUP [acceptable use policy] specifically addresses blogs, wiki, email, web publishing, social websites, etc. and the level of responsibility for oversight and action.” – A Technology Director in Colorado “We are currently exploring and looking for sample policies to guide us. We have a grass roots effort from teachers who want to utilize these tools for educational purposes and we're attempting to set guiding policies that allow use, but are protective.” – A Technology Director in Texas
CurrentPoliciesonWeb2.0Applications Technology directors were asked to identify the types of policies that guide specific use of Web 2.0 applications in their districts. The only Web 2.0 applications for which the majority of district administrators reported highly restrictive policies were social networking (70%) and participating in chat rooms (72%). The majority of technology directors said the rest of the Web 2.0 applications fell under the policy, “allows prescribed educational use only.” The chart below (Figure 18) lists the Web 2.0 applications in order from those under the least restrictive policies, according to the technology directors, to those under the most restrictive.
21%
3%
60%
15%
0% 10% 20% 30% 40% 50% 60% 70%
Formal policies in place before Web 2.0, which now also guide our Web 2.0 use
Formal policies adopted specifically to address Web 2.0*
Filtering student access to the internet
Informal policies or common practices
The majority of school districts ban social networking (70%) and chat rooms (72%) while allowing prescribed use for other Web 2.0 tools (e.g., blogging, using Wikis, sharing music or sound files, sharing visual media, posting messages, participating in virtual worlds, playing interactive games, creating polls or surveys, etc.)

26 Web 2.0 in American schools: Administrator Perspectives
Figure18:PercentageoftechnologydirectorswhoreportedthetypeofpoliciesthatguidetheuseofspecificWeb2.0applicationsintheirdistricts.
n=907 (Technology Directors) Typically, the more restrictive the policy the more apt the policy was to be formal rather than informal. The percentage of technology directors who said that formal policies guided the Web 2.0 application ranged from 62% for the restrictive policies, to 32% for the less restrictive. Similarly, the percentage of technology directors who stated that informal policies guided student use of the Web 2.0 application ranged from 38% for the restrictive policies, to 68% for the less restrictive. It would seem that, in many cases, policies are instituted based on reactions to problems and/or abuses.
AcceptableUsePolicies
Technology directors almost universally (94%) report that students and/or parents are required to sign an acceptable use policy (AUP) prior to student Internet use at school. Despite the standard practice requiring AUPs, 51% of district administrators say those policies have not been updated to specifically address Web 2.0 applications.
72%
70%
39%
38%
37%
33%
31%
30%
27%
18%
14%
7%
5%
27%
29%
56%
57%
56%
61%
58%
57%
63%
64%
63%
72%
74%
2%
1%
5%
5%
7%
6%
11%
12%
11%
18%
23%
22%
21%
0% 20% 40% 60% 80% 100%
Participating in chat rooms
Social Networking
Sharing visual media files (e.g., photos, images, videos, YouTube, etc.)
Playing interactive games
Sharing music or sound files
Posting messages
Site-building (FreeWebs, etc.)
Participating in virtual worlds
Blogging
Creating polls or surveys
WIKI’s (Collaborative-editing information sites such as Wikipedia)
Creating and sharing content
Participating in online, collaborative projects
Prohibits all student use
Allows prescribed educational use of the web only
Allows all student use of the web
While acceptable use policies (AUPs) are standard practice in schools, 51% of districts have not yet updated their AUPs to reflect Web 2.0.
Web 2.0 in American schools: Administrator Perspectives 27
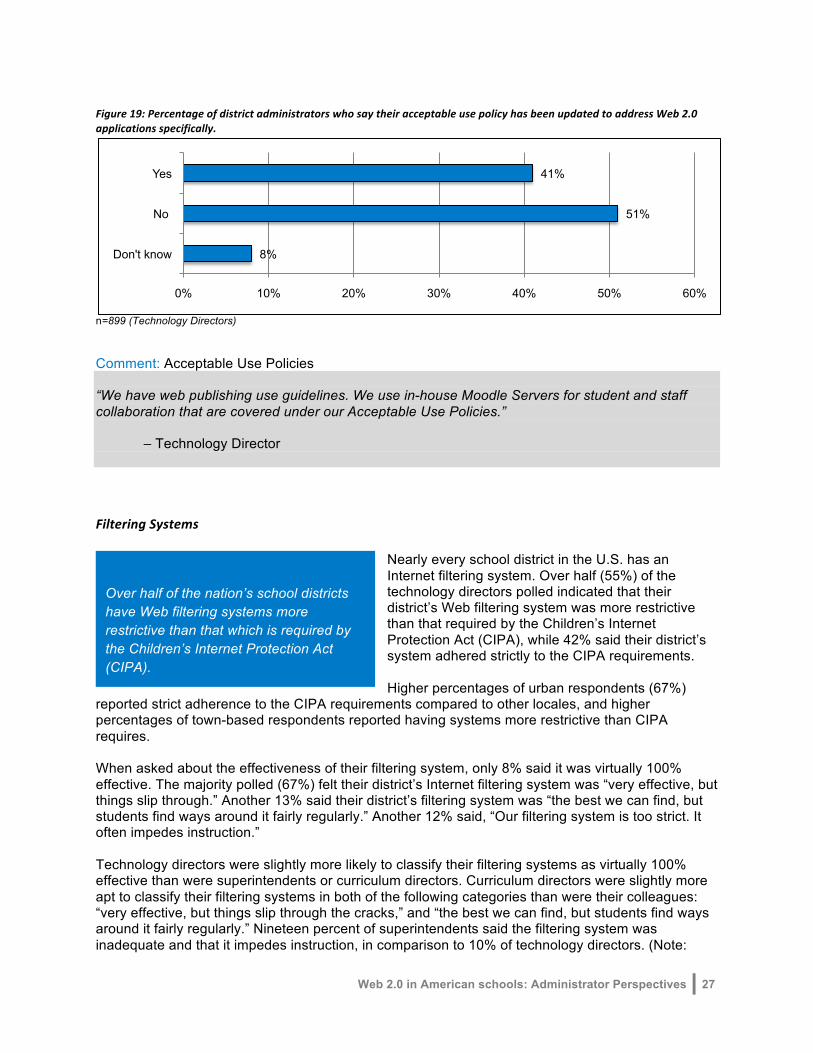
Figure19:PercentageofdistrictadministratorswhosaytheiracceptableusepolicyhasbeenupdatedtoaddressWeb2.0applicationsspecifically.
n=899 (Technology Directors) Comment: Acceptable Use Policies “We have web publishing use guidelines. We use in-house Moodle Servers for student and staff collaboration that are covered under our Acceptable Use Policies.”
– Technology Director
FilteringSystems Nearly every school district in the U.S. has an Internet filtering system. Over half (55%) of the technology directors polled indicated that their district’s Web filtering system was more restrictive than that required by the Children’s Internet Protection Act (CIPA), while 42% said their district’s system adhered strictly to the CIPA requirements. Higher percentages of urban respondents (67%)
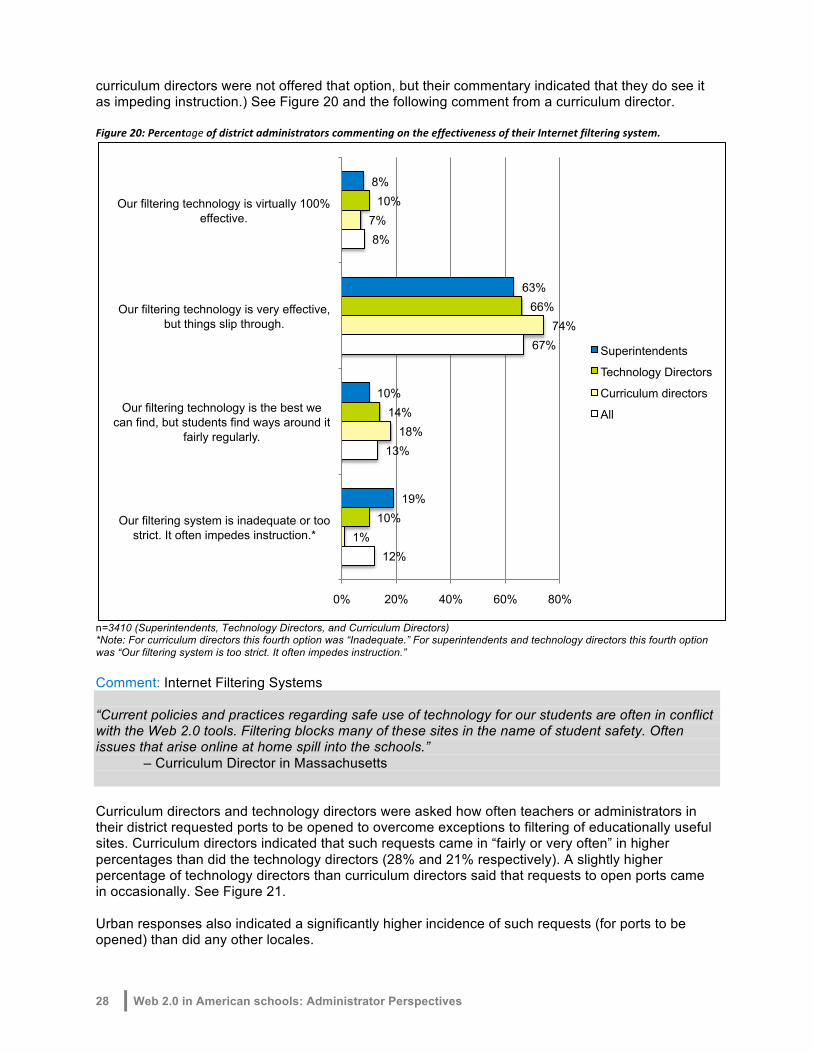
reported strict adherence to the CIPA requirements compared to other locales, and higher percentages of town-based respondents reported having systems more restrictive than CIPA requires. When asked about the effectiveness of their filtering system, only 8% said it was virtually 100% effective. The majority polled (67%) felt their district’s Internet filtering system was “very effective, but things slip through.” Another 13% said their district’s filtering system was “the best we can find, but students find ways around it fairly regularly.” Another 12% said, “Our filtering system is too strict. It often impedes instruction.” Technology directors were slightly more likely to classify their filtering systems as virtually 100% effective than were superintendents or curriculum directors. Curriculum directors were slightly more apt to classify their filtering systems in both of the following categories than were their colleagues: “very effective, but things slip through the cracks,” and “the best we can find, but students find ways around it fairly regularly.” Nineteen percent of superintendents said the filtering system was inadequate and that it impedes instruction, in comparison to 10% of technology directors. (Note:
8%
51%
41%
0% 10% 20% 30% 40% 50% 60%
Don't know
No
Yes
Over half of the nation’s school districts have Web filtering systems more restrictive than that which is required by the Children’s Internet Protection Act (CIPA).
28 Web 2.0 in American schools: Administrator Perspectives
curriculum directors were not offered that option, but their commentary indicated that they do see it as impeding instruction.) See Figure 20 and the following comment from a curriculum director. Figure20:PercentageofdistrictadministratorscommentingontheeffectivenessoftheirInternetfilteringsystem.
n=3410 (Superintendents, Technology Directors, and Curriculum Directors) *Note: For curriculum directors this fourth option was “Inadequate.” For superintendents and technology directors this fourth option was “Our filtering system is too strict. It often impedes instruction.” Comment: Internet Filtering Systems “Current policies and practices regarding safe use of technology for our students are often in conflict with the Web 2.0 tools. Filtering blocks many of these sites in the name of student safety. Often issues that arise online at home spill into the schools.” – Curriculum Director in Massachusetts Curriculum directors and technology directors were asked how often teachers or administrators in their district requested ports to be opened to overcome exceptions to filtering of educationally useful sites. Curriculum directors indicated that such requests came in “fairly or very often” in higher percentages than did the technology directors (28% and 21% respectively). A slightly higher percentage of technology directors than curriculum directors said that requests to open ports came in occasionally. See Figure 21. Urban responses also indicated a significantly higher incidence of such requests (for ports to be opened) than did any other locales.
12%
13%
67%
8%
1%
18%
74%
7%
10%
14%
66%
10%
19%
10%
63%
8%
0% 20% 40% 60% 80%
Our filtering system is inadequate or too strict. It often impedes instruction.*
Our filtering technology is the best we can find, but students find ways around it
fairly regularly.
Our filtering technology is very effective, but things slip through.
Our filtering technology is virtually 100% effective.
Superintendents
Technology Directors
Curriculum directors
All

Web 2.0 in American schools: Administrator Perspectives 29
Figure21:Percentageofdistrictadministratorsindicatinghowoftenteachersoradministratorsrequestportstobeopenedtoovercomeexceptionsduetofilteringofeducationallyusefulsites.
n=1807 (Technology Directors and Curriculum Directors)
Comment: Internet Filtering Systems “Firewalls, web filters and administrative trust in teachers and students of Web 2.0 usage are great detriments to accessing Web 2.0 applications.”
– A Curriculum Director in Washington State
Web2.0DecisionMakingThe majority of district administrators reported that Web 2.0 decision making is shared between the district office and the school campuses. While just 2% reported that Web 2.0 decisions were made exclusively at the campus level, 25% said that such decisions were made exclusively at the district level. Over 20% of district administrators said that, to date, no decisions on Web 2.0 have been made. As Figure 17 indicates, that may be due to the districts’ dependence on informal policies or common practices, on Internet filtering to guide practice, or on a dependence on formal policies in place before Web 2.0, used now to also guide Web 2.0 use.
While 70% of urban and 67% of suburban district administrators reported that decisions were made at both levels, those percentages dropped to 48% in towns and 44% in rural areas.
14%
62%
21%
3%
13%
66%
19%
2%
14%
58%
24%
4%
0% 10% 20% 30% 40% 50% 60% 70% 80%
Virtually never
Occasionally
Fairly often
Very often
Curriculum directors
Technology directors
All
Decision making on Web 2.0 was generally reported to be a shared responsibility between the district and campus levels, and was typically accomplished through teams or groups rather than a single individual.
30 Web 2.0 in American schools: Administrator Perspectives
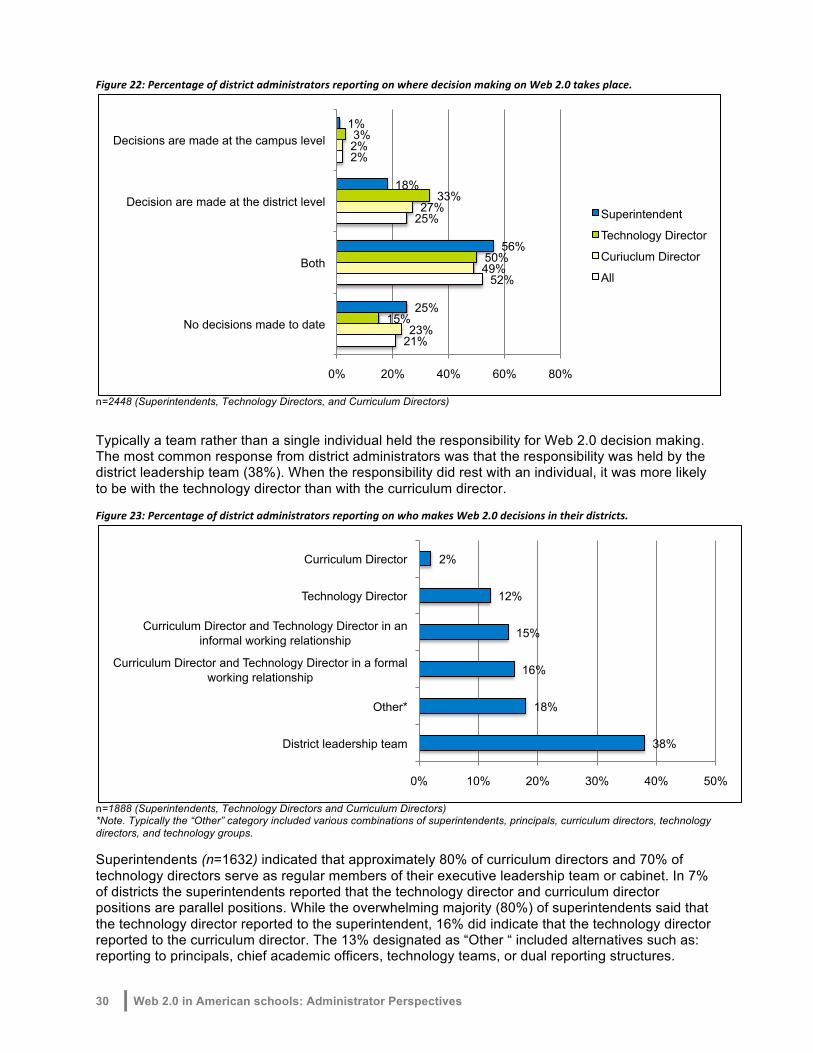
Figure22:PercentageofdistrictadministratorsreportingonwheredecisionmakingonWeb2.0takesplace.
n=2448 (Superintendents, Technology Directors, and Curriculum Directors) Typically a team rather than a single individual held the responsibility for Web 2.0 decision making. The most common response from district administrators was that the responsibility was held by the district leadership team (38%). When the responsibility did rest with an individual, it was more likely to be with the technology director than with the curriculum director. Figure23:PercentageofdistrictadministratorsreportingonwhomakesWeb2.0decisionsintheirdistricts.
n=1888 (Superintendents, Technology Directors and Curriculum Directors) *Note. Typically the “Other” category included various combinations of superintendents, principals, curriculum directors, technology directors, and technology groups. Superintendents (n=1632) indicated that approximately 80% of curriculum directors and 70% of technology directors serve as regular members of their executive leadership team or cabinet. In 7% of districts the superintendents reported that the technology director and curriculum director positions are parallel positions. While the overwhelming majority (80%) of superintendents said that the technology director reported to the superintendent, 16% did indicate that the technology director reported to the curriculum director. The 13% designated as “Other “ included alternatives such as: reporting to principals, chief academic officers, technology teams, or dual reporting structures.
21%
52%
25%
2%
23%
49%
27%
2%
15%
50%
33%
3%
25%
56%
18%
1%
0% 20% 40% 60% 80%
No decisions made to date
Both
Decision are made at the district level
Decisions are made at the campus level
Superintendent
Technology Director
Curiuclum Director
All
38%
18%
16%
15%
12%
2%
0% 10% 20% 30% 40% 50%
District leadership team
Other*
Curriculum Director and Technology Director in a formal working relationship
Curriculum Director and Technology Director in an informal working relationship
Technology Director
Curriculum Director
Web 2.0 in American schools: Administrator Perspectives 31
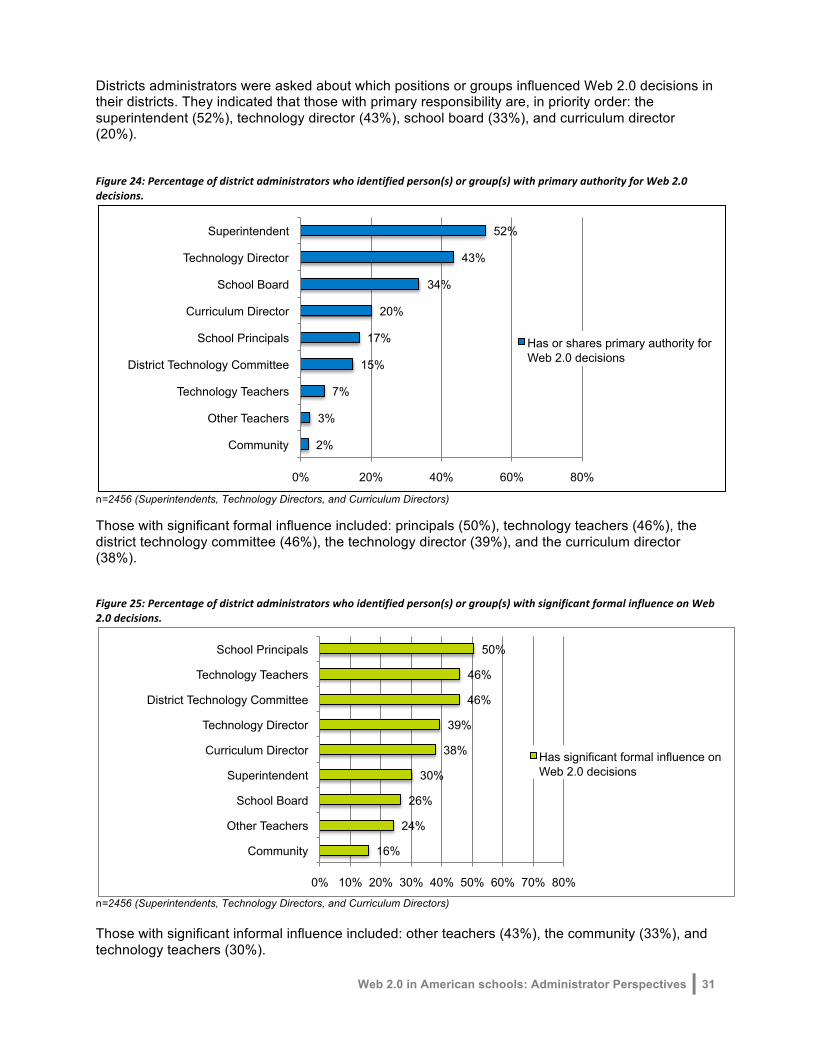
Districts administrators were asked about which positions or groups influenced Web 2.0 decisions in their districts. They indicated that those with primary responsibility are, in priority order: the superintendent (52%), technology director (43%), school board (33%), and curriculum director (20%). Figure24:Percentageofdistrictadministratorswhoidentifiedperson(s)orgroup(s)withprimaryauthorityforWeb2.0decisions.
n=2456 (Superintendents, Technology Directors, and Curriculum Directors) Those with significant formal influence included: principals (50%), technology teachers (46%), the district technology committee (46%), the technology director (39%), and the curriculum director (38%). Figure25:Percentageofdistrictadministratorswhoidentifiedperson(s)orgroup(s)withsignificantformalinfluenceonWeb2.0decisions.
n=2456 (Superintendents, Technology Directors, and Curriculum Directors) Those with significant informal influence included: other teachers (43%), the community (33%), and technology teachers (30%).
2%
3%
7%
15%
17%
20%
34%
43%
52%
0% 20% 40% 60% 80%
Community
Other Teachers
Technology Teachers
District Technology Committee
School Principals
Curriculum Director
School Board
Technology Director
Superintendent
Has or shares primary authority for Web 2.0 decisions
16%
24%
26%
30%
38%
39%
46%
46%
50%
0% 10% 20% 30% 40% 50% 60% 70% 80%
Community
Other Teachers
School Board
Superintendent
Curriculum Director
Technology Director
District Technology Committee
Technology Teachers
School Principals
Has significant formal influence on Web 2.0 decisions

32 Web 2.0 in American schools: Administrator Perspectives
Figure26:Percentageofdistrictadministratorswhoidentifiedperson(s)orgroup(s)withsignificantinformalinfluenceonWeb2.0decisions.
n=2456 (Superintendents, Technology Directors, and Curriculum Directors) Interestingly, 13% of superintendents and 14% of technology directors said that curriculum directors had no influence on Web 2.0 decisions and 10% of district administrators said the community had no influence on Web 2.0 decisions.
Summary The results from this section indicate that, to date, the policies that have been instituted in American public schools regarding Web 2.0 tend to be reactive rather than proactive. While there are examples in many schools of innovative uses of Web 2.0 for teaching and learning, few instances were cited where policies were enacted to advance a vision for leveraging Web 2.0 for learning.
8%
10%
15%
16%
20%
23%
30%
33%
43%
0% 20% 40% 60% 80%
Technology Director
Superintendent
School Board
Curriculum Director
School Principals
District Technology Committee
Technology Teachers
Community
Other Teachers
Has significant informal influence on Web 2.0 decisions
Web 2.0 in American schools: Administrator Perspectives 33
Teaching, Learning and Web 2.0
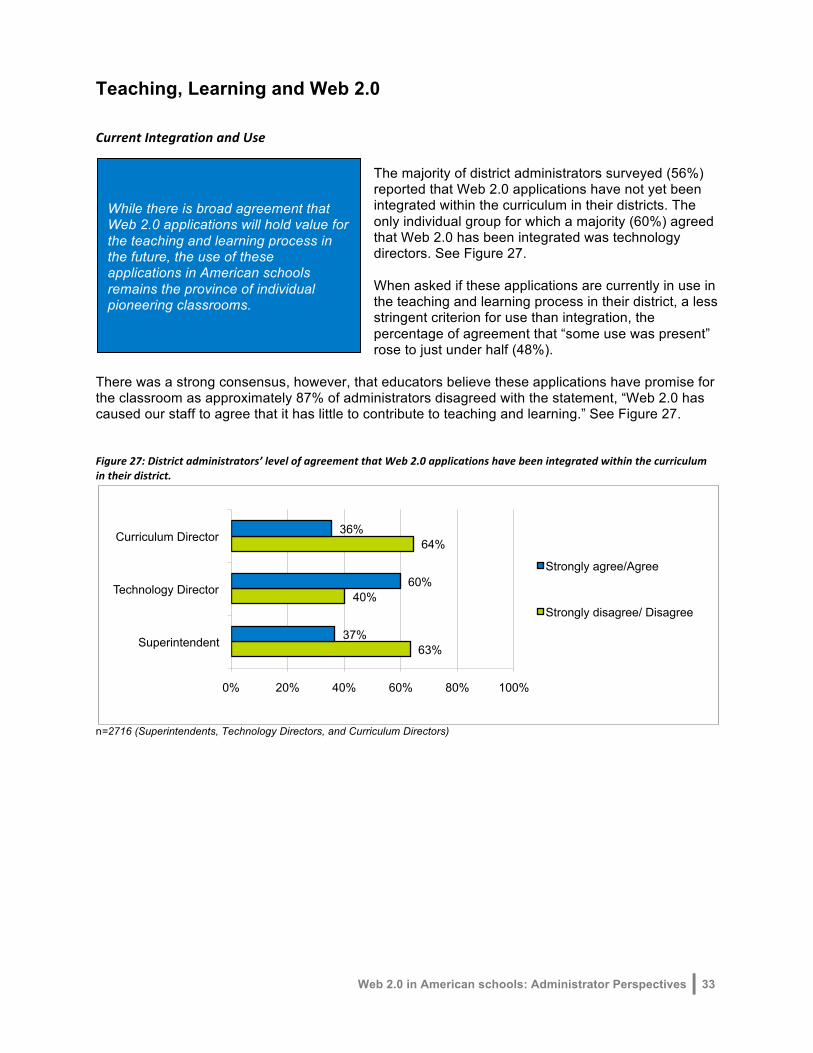
CurrentIntegrationandUse The majority of district administrators surveyed (56%) reported that Web 2.0 applications have not yet been integrated within the curriculum in their districts. The only individual group for which a majority (60%) agreed that Web 2.0 has been integrated was technology directors. See Figure 27. When asked if these applications are currently in use in the teaching and learning process in their district, a less stringent criterion for use than integration, the percentage of agreement that “some use was present” rose to just under half (48%).
There was a strong consensus, however, that educators believe these applications have promise for the classroom as approximately 87% of administrators disagreed with the statement, “Web 2.0 has caused our staff to agree that it has little to contribute to teaching and learning.” See Figure 27. Figure27:Districtadministrators’levelofagreementthatWeb2.0applicationshavebeenintegratedwithinthecurriculumintheirdistrict.
n=2716 (Superintendents, Technology Directors, and Curriculum Directors)
63%
40%
64%
37%
60%
36%
0% 20% 40% 60% 80% 100%
Superintendent
Technology Director
Curriculum Director
Strongly agree/Agree
Strongly disagree/ Disagree
While there is broad agreement that Web 2.0 applications will hold value for the teaching and learning process in the future, the use of these applications in American schools remains the province of individual pioneering classrooms.

34 Web 2.0 in American schools: Administrator Perspectives
Figure28:Web2.0hascausedourstafftoagreethatithaslittletocontributetoteachingandlearning.
n=2716 (Superintendents, Technology Directors, and Curriculum Directors) Figure29:Web2.0hascausedourstafftoagreethatithaslittletocontributetoteachingandlearningbylocale.
n=2716 (Superintendents, Technology Directors, and Curriculum Directors) In responding to the general use questions described above in Figure 29, town and rural administrators were significantly less positive about the promise that Web 2.0 might have to support teaching and learning (14% to 16% agreeing that their staff has decided Web 2.0 has little to contribute to teaching and learning, versus 7% to 9% for urban and suburban leaders). Town and rural administrators were also less positive about the levels at which Web 2.0 was currently integrated (or simply used) in classrooms in their districts.
84%
89%
86%
16%
11%
14%
0% 20% 40% 60% 80% 100%
Superintendent
Technology Director
Curriculum Director
Strongly agree/Agree
Strongly disagree/ Disagree
14%
8%
0% 10% 20% 30% 40% 50%
Rural/Town
Urban/Suburban
Strongly agree/Agree
Web 2.0 in American schools: Administrator Perspectives 35
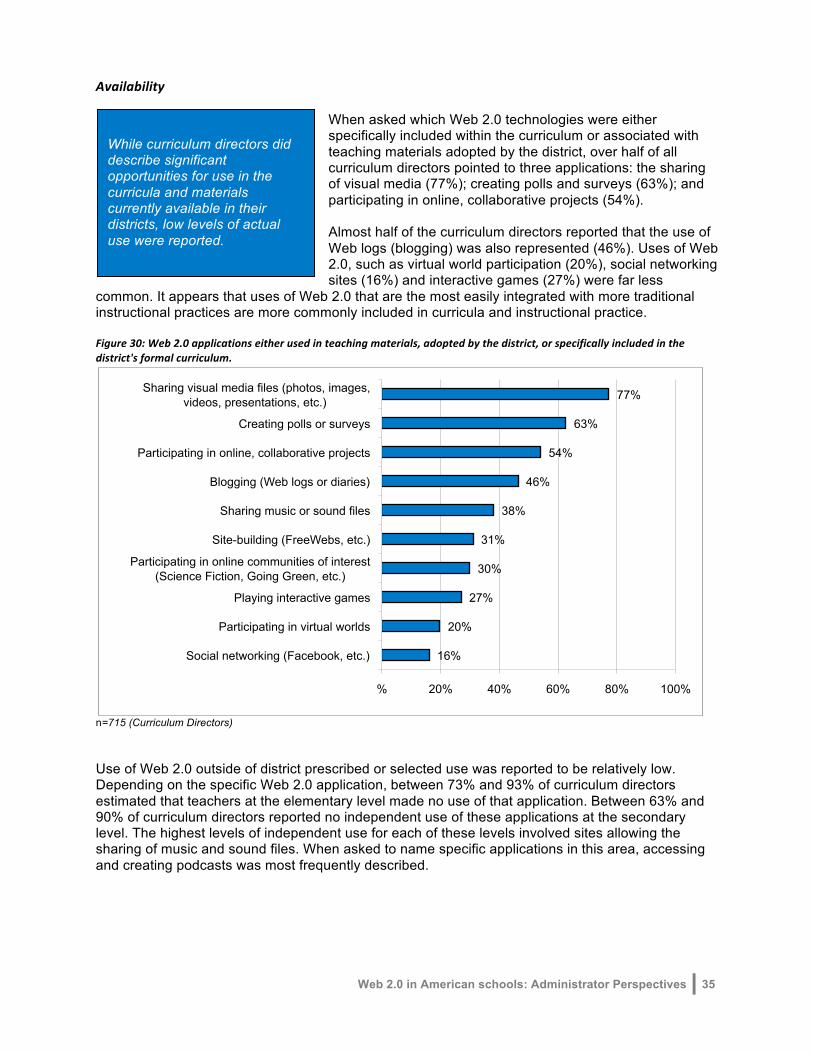
Availability When asked which Web 2.0 technologies were either specifically included within the curriculum or associated with teaching materials adopted by the district, over half of all curriculum directors pointed to three applications: the sharing of visual media (77%); creating polls and surveys (63%); and participating in online, collaborative projects (54%). Almost half of the curriculum directors reported that the use of Web logs (blogging) was also represented (46%). Uses of Web 2.0, such as virtual world participation (20%), social networking sites (16%) and interactive games (27%) were far less
common. It appears that uses of Web 2.0 that are the most easily integrated with more traditional instructional practices are more commonly included in curricula and instructional practice. Figure30:Web2.0applicationseitherusedinteachingmaterials,adoptedbythedistrict,orspecificallyincludedinthedistrict'sformalcurriculum.
n=715 (Curriculum Directors)
Use of Web 2.0 outside of district prescribed or selected use was reported to be relatively low. Depending on the specific Web 2.0 application, between 73% and 93% of curriculum directors estimated that teachers at the elementary level made no use of that application. Between 63% and 90% of curriculum directors reported no independent use of these applications at the secondary level. The highest levels of independent use for each of these levels involved sites allowing the sharing of music and sound files. When asked to name specific applications in this area, accessing and creating podcasts was most frequently described.
16%
20%
27%
30%
31%
38%
46%
54%
63%
77%
% 20% 40% 60% 80% 100%
Social networking (Facebook, etc.)
Participating in virtual worlds
Playing interactive games
Participating in online communities of interest (Science Fiction, Going Green, etc.)
Site-building (FreeWebs, etc.)
Sharing music or sound files
Blogging (Web logs or diaries)
Participating in online, collaborative projects
Creating polls or surveys
Sharing visual media files (photos, images, videos, presentations, etc.)
While curriculum directors did describe significant opportunities for use in the curricula and materials currently available in their districts, low levels of actual use were reported.

36 Web 2.0 in American schools: Administrator Perspectives
Figure31:WhichWeb2.0applicationsarebeingusedbyteachers,butarenotspecificallyinthedistrictcurriculum.
n=659 (Curriculum Directors). *The high levels of use are 2% or less in all categories. Teacher’s independent use of Web 2.0 varied significantly based on locale. Urban and suburban curriculum directors reported higher levels of independent use than did town or rural administrators. Figure32:PercentageofuseforselectedWeb2.0applicationsforUrban/Suburbanvs.Town/Rural
n=659 (Curriculum Directors)
91%
88%
87%
87%
83%
82%
81%
76%
74%
69%
8%
9%
5%
12%
14%
16%
15%
15%
21%
23%
2%
6%
1%
2%
4%
9%
5%
8%
0% 20% 40% 60% 80% 100%
Creating polls or surveys
Social networking (Facebook, etc.)
Sharing visual media files (photos, images, videos, presentations, etc.)
Participating in virtual worlds
Blogging (Web logs or diaries)
Participating in online, collaborative projects
Site-building (FreeWebs, etc.)
Playing interactive games
Participating in online communities of interest (Science Fiction, Going Green, etc.)
Sharing music or sound files
No use
Low levels of use
Moderate levels of use
High levels of use*
81%
33%
67%
53%
69%
21%
50%
46%
71%
50%
77%
31%
75%
47%
49%
25%
47%
30%
47%
38%
0% 20% 40% 60% 80% 100%
Sharing music or sound files
Sharing visual media files (photos, images, videos, presentations, etc.)
Participating in online communities of interest (Science Fiction, Going Green, etc.)
Blogging (Web logs or diaries)
Site-building (FreeWebs, etc.)
Creating polls or surveys
Participating in online, collaborative projects
Participating in virtual worlds
Playing interactive games
Social networking (Facebook, etc.)
Town & Rural
Urban & Suburban
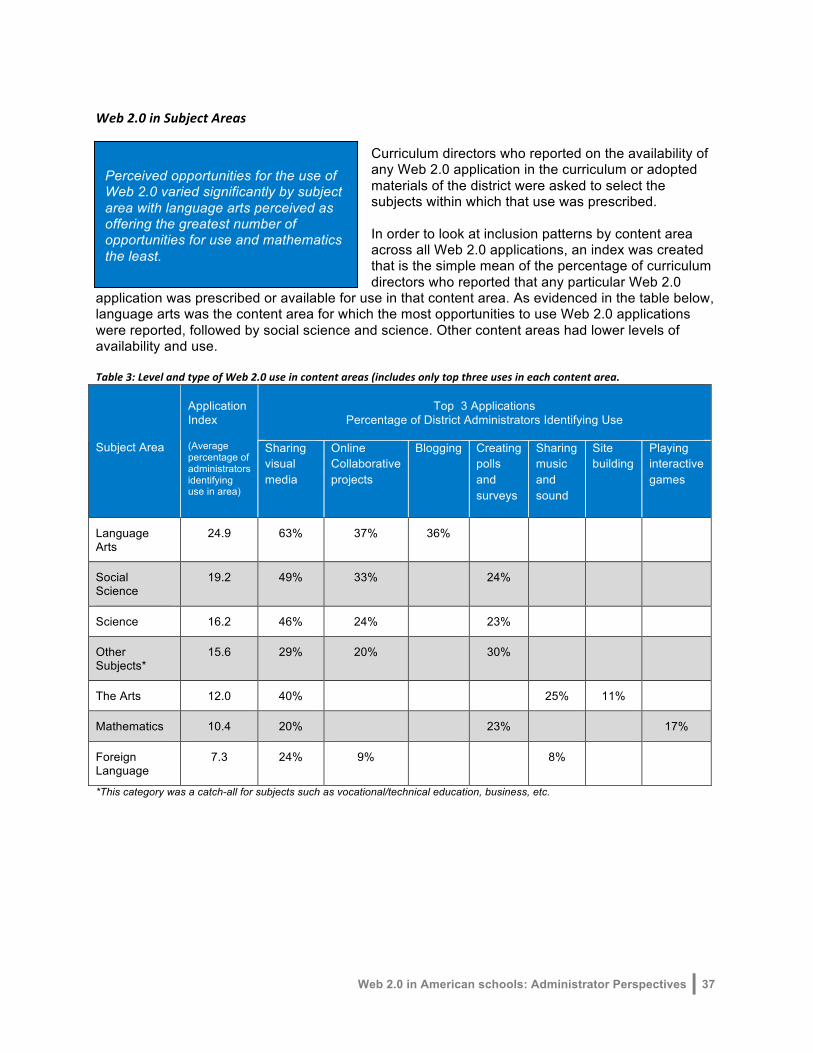
Web 2.0 in American schools: Administrator Perspectives 37
Web2.0inSubjectAreas Curriculum directors who reported on the availability of any Web 2.0 application in the curriculum or adopted materials of the district were asked to select the subjects within which that use was prescribed. In order to look at inclusion patterns by content area across all Web 2.0 applications, an index was created that is the simple mean of the percentage of curriculum directors who reported that any particular Web 2.0
application was prescribed or available for use in that content area. As evidenced in the table below, language arts was the content area for which the most opportunities to use Web 2.0 applications were reported, followed by social science and science. Other content areas had lower levels of availability and use. Table3:LevelandtypeofWeb2.0useincontentareas(includesonlytopthreeusesineachcontentarea.
Top 3 Applications
Percentage of District Administrators Identifying Use
Subject Area
Application Index (Average percentage of administrators identifying use in area)
Sharing visual media
Online Collaborative projects
Blogging Creating polls and surveys
Sharing music and sound
Site building
Playing interactive games
Language Arts
24.9 63% 37% 36%
Social Science
19.2 49% 33% 24%
Science 16.2 46% 24% 23%
Other Subjects*
15.6 29% 20% 30%
The Arts 12.0 40% 25% 11%
Mathematics 10.4 20% 23% 17%
Foreign Language
7.3 24% 9% 8%
*This category was a catch-all for subjects such as vocational/technical education, business, etc.
Perceived opportunities for the use of Web 2.0 varied significantly by subject area with language arts perceived as offering the greatest number of opportunities for use and mathematics the least.
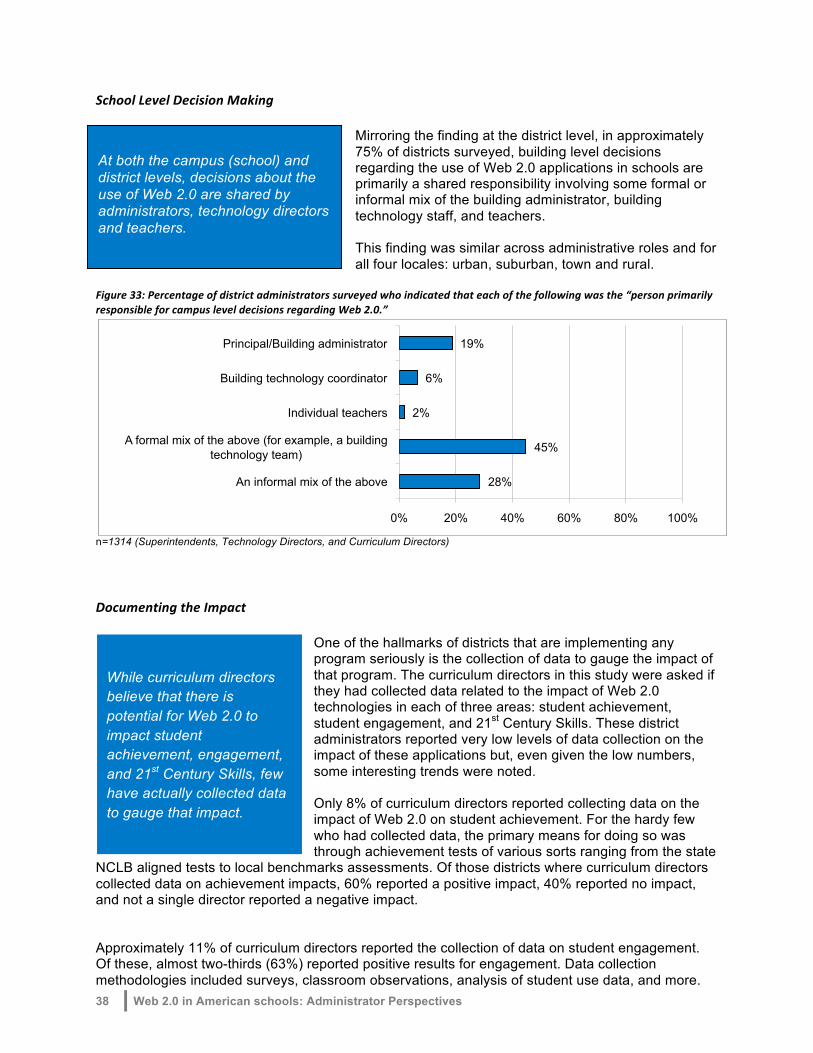
38 Web 2.0 in American schools: Administrator Perspectives
SchoolLevelDecisionMaking Mirroring the finding at the district level, in approximately 75% of districts surveyed, building level decisions regarding the use of Web 2.0 applications in schools are primarily a shared responsibility involving some formal or informal mix of the building administrator, building technology staff, and teachers. This finding was similar across administrative roles and for all four locales: urban, suburban, town and rural.
Figure33:Percentageofdistrictadministratorssurveyedwhoindicatedthateachofthefollowingwasthe“personprimarilyresponsibleforcampusleveldecisionsregardingWeb2.0.”
n=1314 (Superintendents, Technology Directors, and Curriculum Directors)
DocumentingtheImpact One of the hallmarks of districts that are implementing any program seriously is the collection of data to gauge the impact of that program. The curriculum directors in this study were asked if they had collected data related to the impact of Web 2.0 technologies in each of three areas: student achievement, student engagement, and 21st Century Skills. These district administrators reported very low levels of data collection on the impact of these applications but, even given the low numbers, some interesting trends were noted. Only 8% of curriculum directors reported collecting data on the impact of Web 2.0 on student achievement. For the hardy few who had collected data, the primary means for doing so was through achievement tests of various sorts ranging from the state
NCLB aligned tests to local benchmarks assessments. Of those districts where curriculum directors collected data on achievement impacts, 60% reported a positive impact, 40% reported no impact, and not a single director reported a negative impact. Approximately 11% of curriculum directors reported the collection of data on student engagement. Of these, almost two-thirds (63%) reported positive results for engagement. Data collection methodologies included surveys, classroom observations, analysis of student use data, and more.
28%
45%
2%
6%
19%
0% 20% 40% 60% 80% 100%
An informal mix of the above
A formal mix of the above (for example, a building technology team)
Individual teachers
Building technology coordinator
Principal/Building administrator
At both the campus (school) and district levels, decisions about the use of Web 2.0 are shared by administrators, technology directors and teachers.
While curriculum directors believe that there is potential for Web 2.0 to impact student achievement, engagement, and 21st Century Skills, few have actually collected data to gauge that impact.
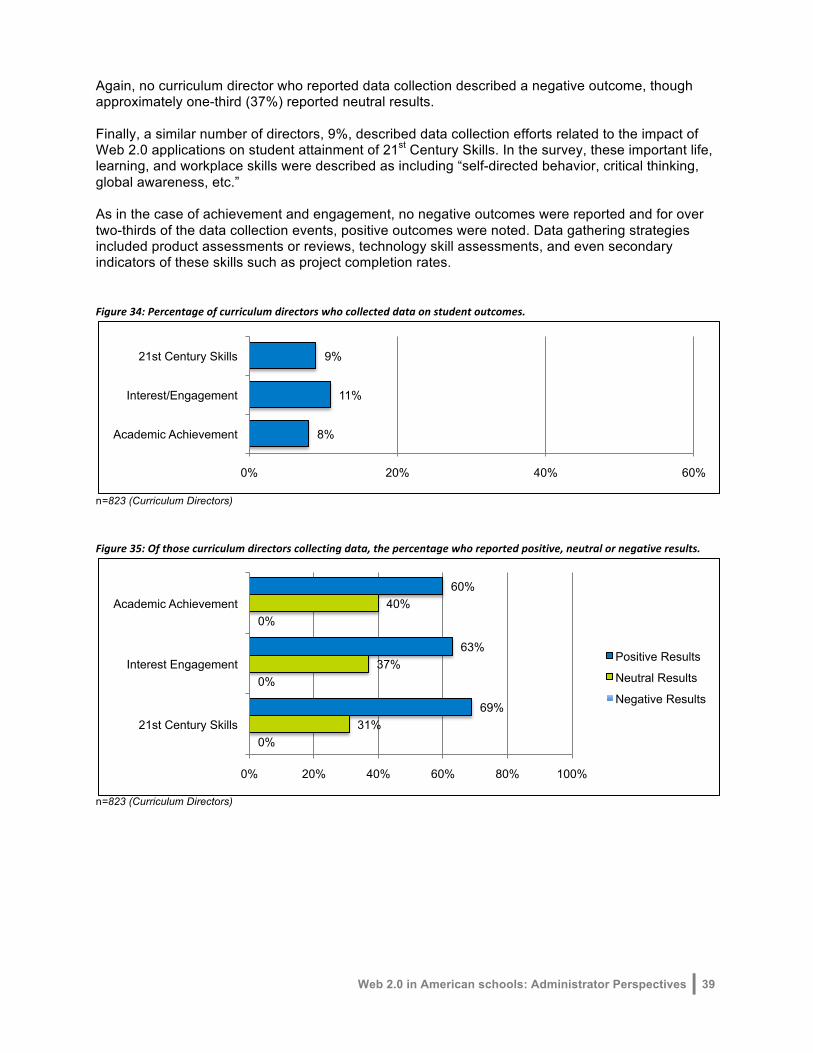
Web 2.0 in American schools: Administrator Perspectives 39
Again, no curriculum director who reported data collection described a negative outcome, though approximately one-third (37%) reported neutral results. Finally, a similar number of directors, 9%, described data collection efforts related to the impact of Web 2.0 applications on student attainment of 21st Century Skills. In the survey, these important life, learning, and workplace skills were described as including “self-directed behavior, critical thinking, global awareness, etc.” As in the case of achievement and engagement, no negative outcomes were reported and for over two-thirds of the data collection events, positive outcomes were noted. Data gathering strategies included product assessments or reviews, technology skill assessments, and even secondary indicators of these skills such as project completion rates.
Figure34:Percentageofcurriculumdirectorswhocollecteddataonstudentoutcomes.
n=823 (Curriculum Directors)
Figure35:Ofthosecurriculumdirectorscollectingdata,thepercentagewhoreportedpositive,neutralornegativeresults.
n=823 (Curriculum Directors)
8%
11%
9%
0% 20% 40% 60%
Academic Achievement
Interest/Engagement
21st Century Skills
0%
0%
0%
31%
37%
40%
69%
63%
60%
0% 20% 40% 60% 80% 100%
21st Century Skills
Interest Engagement
Academic Achievement
Positive Results
Neutral Results
Negative Results

40 Web 2.0 in American schools: Administrator Perspectives
Systemic Thinking and Leadership
While the majority of district administrators believe that Web 2.0 can be leveraged to positively impact learning, they are less likely to agree that Web 2.0 has had an impact on their own administrative work. The literature on Web 2.0 would suggest it facilitates communication through participatory environments. That seems not to be the case with most district administrators. While they report that it hasn’t complicated their work, they also say that it hasn’t resulted in more participatory decision making either. Less than 20% of administrators say that Web 2.0 is a vehicle for the majority of their own professional learning.
When asked about the impact on the work of teachers, district administrators do agree that Web 2.0 has established online communities of practice for teachers and administrators. Yet, only 42% said that it keeps them in touch with teachers in their districts. In addition, 31% say that Web 2.0 has resulted in views expressed in online communities that are not typical of the entire staff, suggesting that Web 2.0 is not yet used to facilitate discussions and debates where staff express diverse opinions. Over a third said that Web 2.0 resulted in more participatory decision making. See Figure 36. Figure36:PercentageofdistrictsadministratorswhostronglyagreeoragreewiththefollowingstatementsrelatedtotheimpactofWeb2.0ontheirworkasadministrators.
n=2439 (Superintendents, Technology Directors, and Curriculum Directors) While 70% of district administrators said that Web 2.0 provides opportunities for teachers to establish Wikis, blogs, etc., only a third said that it increases the likelihood that staff would listen to student perspectives. See Figure 37. Figure37:PercentageofdistrictsadministratorswhostronglyagreeoragreewiththefollowingstatementsrelatedtotheimpactofWeb2.0ontheirworkasadministrators.
n=2439 (Superintendents, Technology Directors, and Curriculum Directors)
38%
31%
42%
63%
0% 20% 40% 60% 80%
Results in more participatory decision making in my district
Results in views expressed in local online communities that are not typical of our entire staff
Keeps me more in touch with teachers in my district
Establishes online communities of practice for teachers and administrators
34%
70%
0% 10% 20% 30% 40% 50% 60% 70% 80%
Increases the likelihood that staff listen to student perspectives
Provides opportunities for teachers to establish Wikis, blogs, etc. For student use
To date, the participatory nature of Web 2.0 has not significantly impacted the work of district administrators, nor whether staff or student perspectives are voiced, heard, or considered.
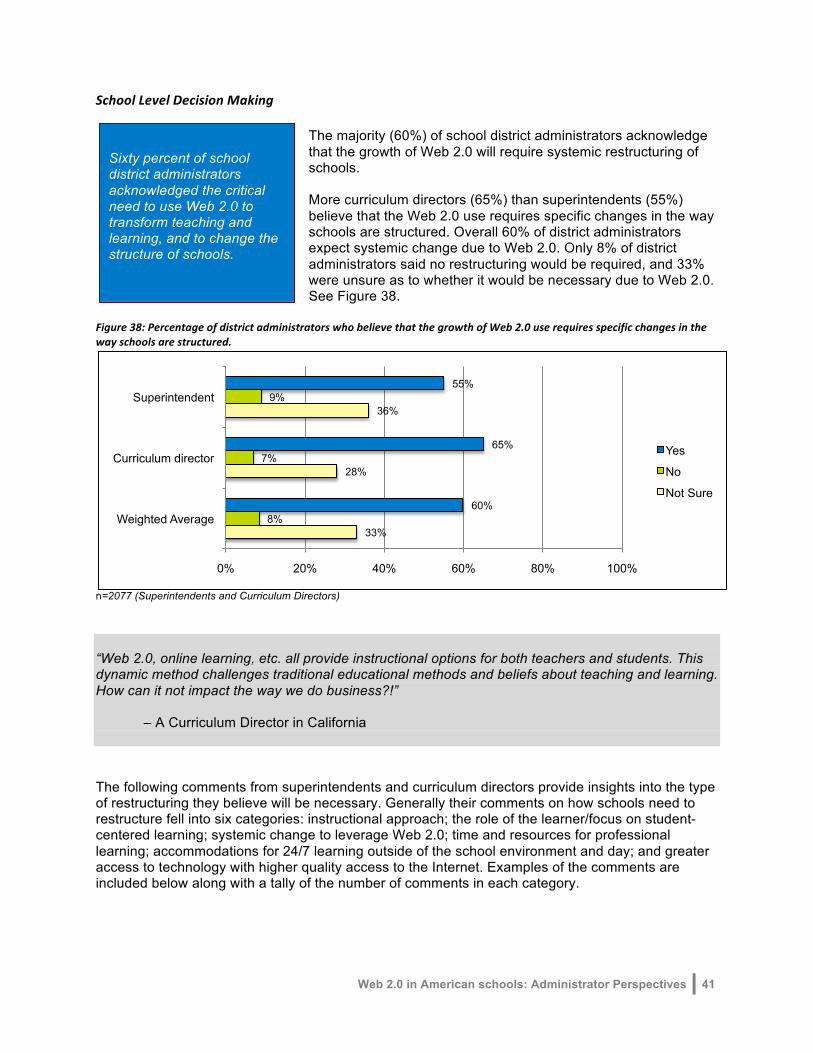
Web 2.0 in American schools: Administrator Perspectives 41
SchoolLevelDecisionMaking The majority (60%) of school district administrators acknowledge that the growth of Web 2.0 will require systemic restructuring of schools. More curriculum directors (65%) than superintendents (55%) believe that the Web 2.0 use requires specific changes in the way schools are structured. Overall 60% of district administrators expect systemic change due to Web 2.0. Only 8% of district administrators said no restructuring would be required, and 33% were unsure as to whether it would be necessary due to Web 2.0. See Figure 38.
Figure38:PercentageofdistrictadministratorswhobelievethatthegrowthofWeb2.0userequiresspecificchangesinthewayschoolsarestructured.
n=2077 (Superintendents and Curriculum Directors) “Web 2.0, online learning, etc. all provide instructional options for both teachers and students. This dynamic method challenges traditional educational methods and beliefs about teaching and learning. How can it not impact the way we do business?!” – A Curriculum Director in California The following comments from superintendents and curriculum directors provide insights into the type of restructuring they believe will be necessary. Generally their comments on how schools need to restructure fell into six categories: instructional approach; the role of the learner/focus on student-centered learning; systemic change to leverage Web 2.0; time and resources for professional learning; accommodations for 24/7 learning outside of the school environment and day; and greater access to technology with higher quality access to the Internet. Examples of the comments are included below along with a tally of the number of comments in each category.
33%
28%
36%
8%
7%
9%
60%
65%
55%
0% 20% 40% 60% 80% 100%
Weighted Average
Curriculum director
Superintendent
Yes
No
Not Sure
Sixty percent of school district administrators acknowledged the critical need to use Web 2.0 to transform teaching and learning, and to change the structure of schools.

42 Web 2.0 in American schools: Administrator Perspectives
Restructure: Instructional approach (76 comments) “We need to meet the needs of today's students, instead of teaching with the same methods used thirty years ago. The students are very adept with Web 2.0. We need to catch up in order to keep the students motivated and engaged.”
– A Curriculum Director in Illinois “It will change the way we not only deliver curriculum but the way curriculum is designed. We need to redefine what students really need to know and be able to do. We are still testing students on a traditional knowledge base.”
– A Superintendent in Indiana Restructure: Role of the learner/focus on student-centered learning (53 comments) “Student structured time becomes more valuable if learning is student directed. Our rigid organization of instructional minutes does not fit with this model very well.”
– A Curriculum Director in California “The only students that can succeed in the absence of teachers, schools, and structure are the small percentage of highly self-disciplined students. The remainder are kids and they will need direct genuine human contact in order to optimize their growth.”
– A Superintendent in Missouri “It will require a dynamic interface between students and teachers in the areas of: access to materials/information, teaching practices, ethics in use of materials, assessment, and computer use, access and design. – A Superintendent in Washington State Restructure: Advance greater access to technology and more reliable, high bandwidth access to the Internet (51 comments) “Classrooms have to be stocked with the hardware necessary to participate in Web 2.0 engagement and learning.”
– A Superintendent in Texas “… technical requirements need to be assessed and upgraded (i.e. wireless capabilities, computer access, etc.). Our students use Web 2.0 on a daily basis – it is part of their world.”
– A Curriculum Director in North Carolina
Web 2.0 in American schools: Administrator Perspectives 43
Restructure: Systematic approach to the effective use of Web 2.0 (38 comments) “The structure of most high schools is a 1950s model. If we are to move to virtual, more customized education structures, then what is meant by ‘school day,’ ‘instructional minutes,’ ADA will have to change…”
– A Curriculum Director in California “There will be a challenge in meshing the idea of a standards based approach currently being required through NCLB with a student centered approach using 2.0.”
– A Superintendent in Kansas Restructure: Time and resources for teachers and administrators’ professional growth and development related to Web 2.0 (44 comments) “District Administrators and teaching staff need more relevant and pertinent examples of integrating Web 2.0 applications in the curriculum. Many of the Web 2.0 applications will need to mature before use and content is promoted as educationally relevant.”
– A Superintendent in Kansas “First of all, we have a myriad of Web 2.0 beliefs and skill sets among our professional staff. Those with skills use and engage students. Those without are fearful, apprehensive, and punish students (take away the technology) for using.”
– A Curriculum Director in Colorado Restructure: Learning that takes place 24 hours a day, 7 days a week, outside of schools (14 comments) “Walls, doors, and windows are nonexistent. Learning, and teaching, can happen anywhere and at anytime. The world in real time becomes our textbook.” – A Superintendent in Montana “I believe high schools will become somewhat like a college campus, students coming in when they may have a specific class or need help, as well as a social hub.”
– A Superintendent in Pennsylvania DistrictadministratorswerespecificallyaskedaboutwhethertheuseofWeb2.0requiresinstructionalpracticestochange.Again,largerpercentagesofcurriculumdirectors(88%)saidyesthandidsuperintendents(75%),Overall,83%ofdistrictsadministratorssaidthatinstructionalpracticesneededtochange.SeeFigure 39.

44 Web 2.0 in American schools: Administrator Perspectives
Figure39:Percentageofdistrictadministratorsindicatingtheiranswer(Yes/No/Notsure)tothequestion,“DoyoubelievethatthegrowthofWeb2.0userequiresspecificchangestoinstructionalpracticesinschools?”
n=2077 (Superintendents and Curriculum Directors) Those district administrators who agreed with the statement described the changes they felt were needed in instructional practices and the actions necessary to accomplish such change. An analysis of survey comments indicates that district administrators know that, “the Web 2.0 is not going away,” that it will require “a new mindset” about teaching and learning, and that “students are digital learners, multi-tasking, engaging in collaborative learning and multi-sensory learning – students who will not respond to traditional teaching.” Changes in Instructional Practices: Shifts in practice (83 comments) “The growth of Web 2.0 will require teachers and schools to rethink how they are currently providing content to students. Students live in a connected and collaborative world. They must "disconnect" when they come to school. Schools are missing out on great opportunities to educate students with tools that they use everyday. Furthermore, that connected, collaborative world is the future that students will not only ‘play’ in, they will also work in.”
– A Superintendent in Kansas “Classroom teachers should be providing project-based assessments, with the use of collaborative production tools and communication tools and data gathering tools so students are working in teams.” – A Curriculum Director in Massachusetts “Stop relying on lecture mode and start interacting.” – A Superintendent in Vermont Changes in Instructional Practices: Support teachers in this transformation (184 comments) “…[Web 2.0 is] a huge learning curve for most teachers, no background knowledge.” – A Superintendent in Louisiana “…[Web 2.0) use requires a far more extensive, detailed and knowledgeable professional development than most districts can provide both from a budgetary and from a capacity perspective.
14%
10%
19%
3%
2%
5%
83%
88%
75%
0% 20% 40% 60% 80% 100%
Weighted Average
Curriculum director
Superintendent
Yes
No
Not Sure
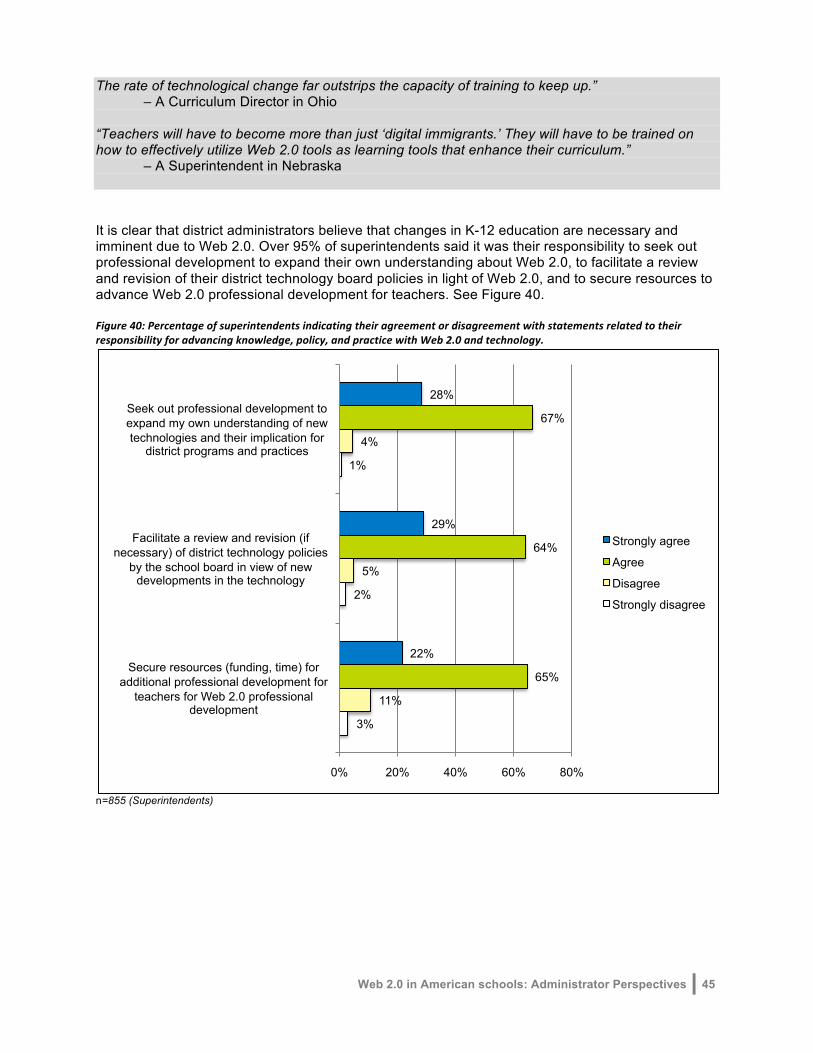
Web 2.0 in American schools: Administrator Perspectives 45
The rate of technological change far outstrips the capacity of training to keep up.” – A Curriculum Director in Ohio “Teachers will have to become more than just ‘digital immigrants.’ They will have to be trained on how to effectively utilize Web 2.0 tools as learning tools that enhance their curriculum.” – A Superintendent in Nebraska It is clear that district administrators believe that changes in K-12 education are necessary and imminent due to Web 2.0. Over 95% of superintendents said it was their responsibility to seek out professional development to expand their own understanding about Web 2.0, to facilitate a review and revision of their district technology board policies in light of Web 2.0, and to secure resources to advance Web 2.0 professional development for teachers. See Figure 40. Figure40:Percentageofsuperintendentsindicatingtheiragreementordisagreementwithstatementsrelatedtotheirresponsibilityforadvancingknowledge,policy,andpracticewithWeb2.0andtechnology.
n=855 (Superintendents)
3%
2%
1%
11%
5%
4%
65%
64%
67%
22%
29%
28%
0% 20% 40% 60% 80%
Secure resources (funding, time) for additional professional development for
teachers for Web 2.0 professional development
Facilitate a review and revision (if necessary) of district technology policies
by the school board in view of new developments in the technology
Seek out professional development to expand my own understanding of new technologies and their implication for
district programs and practices
Strongly agree
Agree
Disagree
Strongly disagree

46 Web 2.0 in American schools: Administrator Perspectives
PerceivedLeadershipRoleinWeb2.0
District administrators were also asked about their responsibility as leaders in advancing the effective use of Web 2.0. The majority of district administrators accepted high levels of responsibility for modeling appropriate Web 2.0 use and social interactions, teaching Web 2.0 safety, preparing students to be effective and ethical Web 2.0 users, and educating parents about Web 2.0. See Figure 41. However, district administrators took only moderate levels of responsibility for restructuring schools to leverage Web 2.0.
Figure41:ThepercentageofschoolleaderswhoindicatedspecificlevelsofresponsibilityforadvancingWeb2.0throughthefollowingstrategies.
n=2487 (Superintendents, Technology Directors, and Curriculum Directors) There were significant differences in the responses to this question across the locales. While district administrators from towns were consistently more apt to accept full responsibility, rural administrators were more apt to accept moderate responsibility. Responses were similar from the respondent groups except on the question of restructuring, where 60% of curriculum directors indicated a high degree of responsibility, in comparison to 44% of superintendents and 43% of technology directors.
8%
6%
4%
2%
2%
2%
2%
47%
43%
40%
35%
31%
21%
19%
44%
51%
56%
63%
67%
77%
79%
0% 20% 40% 60% 80% 100%
Restructure
Educate parents re: appropriate uses/potential risks
Prepare students to be effective users
Model appropriate social interactions
Prepare students to be ethical users
Teach students how to be safe users
Model appropriate uses that deepen learning
Full Responsibility (5-6)
Moderate Responsibility (3-4)
Low Responsibility (1-2)
District administrators acknowledged that schools need to prepare students and their parents to use Web 2.0, but they have not yet accepted full responsibility for restructuring schools in order to leverage Web 2.0.
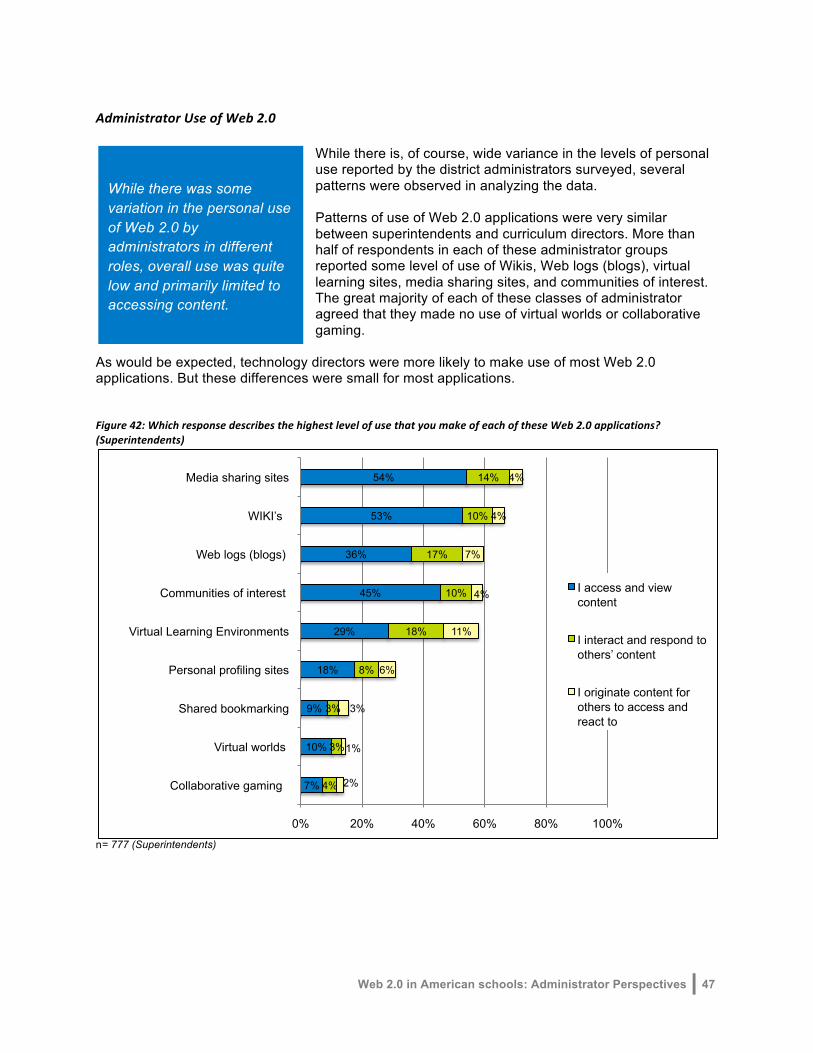
Web 2.0 in American schools: Administrator Perspectives 47
AdministratorUseofWeb2.0
While there is, of course, wide variance in the levels of personal use reported by the district administrators surveyed, several patterns were observed in analyzing the data. Patterns of use of Web 2.0 applications were very similar between superintendents and curriculum directors. More than half of respondents in each of these administrator groups reported some level of use of Wikis, Web logs (blogs), virtual learning sites, media sharing sites, and communities of interest. The great majority of each of these classes of administrator agreed that they made no use of virtual worlds or collaborative gaming.
As would be expected, technology directors were more likely to make use of most Web 2.0 applications. But these differences were small for most applications. Figure42:WhichresponsedescribesthehighestlevelofusethatyoumakeofeachoftheseWeb2.0applications?(Superintendents)
n= 777 (Superintendents)
7%
10%
9%
18%
29%
45%
36%
53%
54%
4%
3%
3%
8%
18%
10%
17%
10%
14%
2%
1%
3%
6%
11%
4%
7%
4%
4%
0% 20% 40% 60% 80% 100%
Collaborative gaming
Virtual worlds
Shared bookmarking
Personal profiling sites
Virtual Learning Environments
Communities of interest
Web logs (blogs)
WIKI’s
Media sharing sites
I access and view content
I interact and respond to others’ content
I originate content for others to access and react to
While there was some variation in the personal use of Web 2.0 by administrators in different roles, overall use was quite low and primarily limited to accessing content.
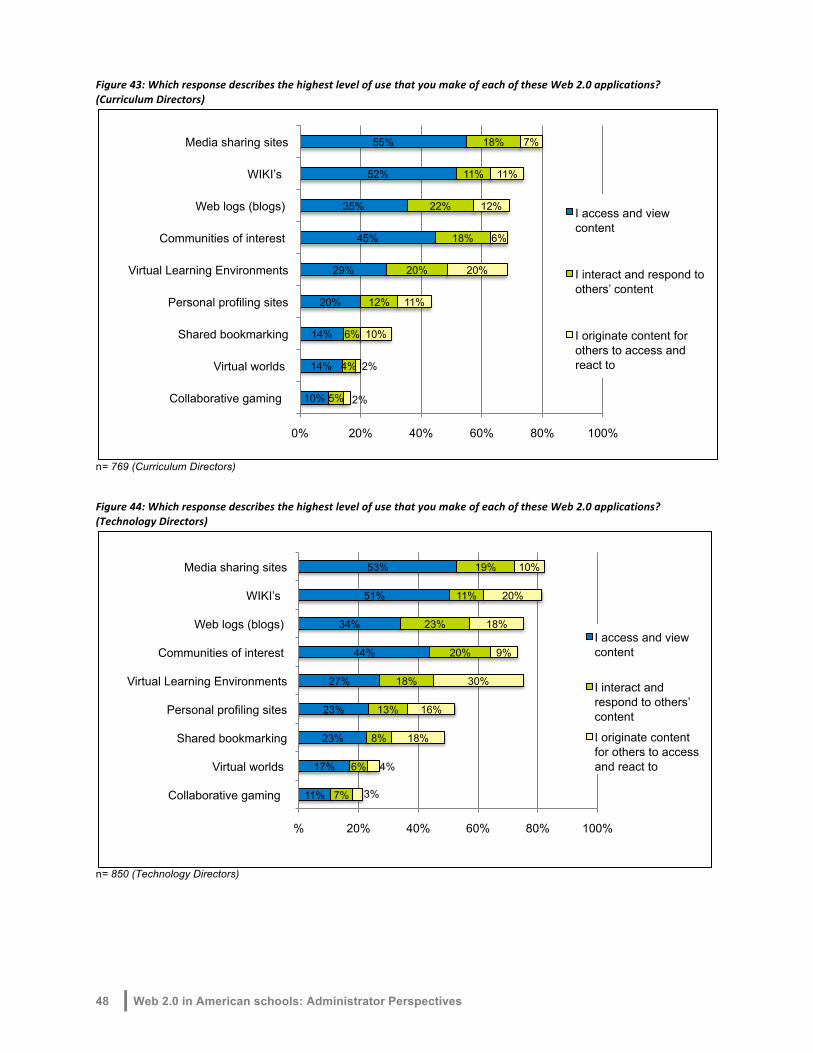
48 Web 2.0 in American schools: Administrator Perspectives
Figure43:WhichresponsedescribesthehighestlevelofusethatyoumakeofeachoftheseWeb2.0applications?(CurriculumDirectors)
n= 769 (Curriculum Directors) Figure44:WhichresponsedescribesthehighestlevelofusethatyoumakeofeachoftheseWeb2.0applications?(TechnologyDirectors)
n= 850 (Technology Directors)
10%
14%
14%
20%
29%
45%
35%
52%
55%
5%
4%
6%
12%
20%
18%
22%
11%
18%
2%
2%
10%
11%
20%
6%
12%
11%
7%
0% 20% 40% 60% 80% 100%
Collaborative gaming
Virtual worlds
Shared bookmarking
Personal profiling sites
Virtual Learning Environments
Communities of interest
Web logs (blogs)
WIKI’s
Media sharing sites
I access and view content
I interact and respond to others’ content
I originate content for others to access and react to
11%
17%
23%
23%
27%
44%
34%
51%
53%
7%
6%
8%
13%
18%
20%
23%
11%
19%
3%
4%
18%
16%
30%
9%
18%
20%
10%
% 20% 40% 60% 80% 100%
Collaborative gaming
Virtual worlds
Shared bookmarking
Personal profiling sites
Virtual Learning Environments
Communities of interest
Web logs (blogs)
WIKI’s
Media sharing sites
I access and view content
I interact and respond to others’ content
I originate content for others to access and react to
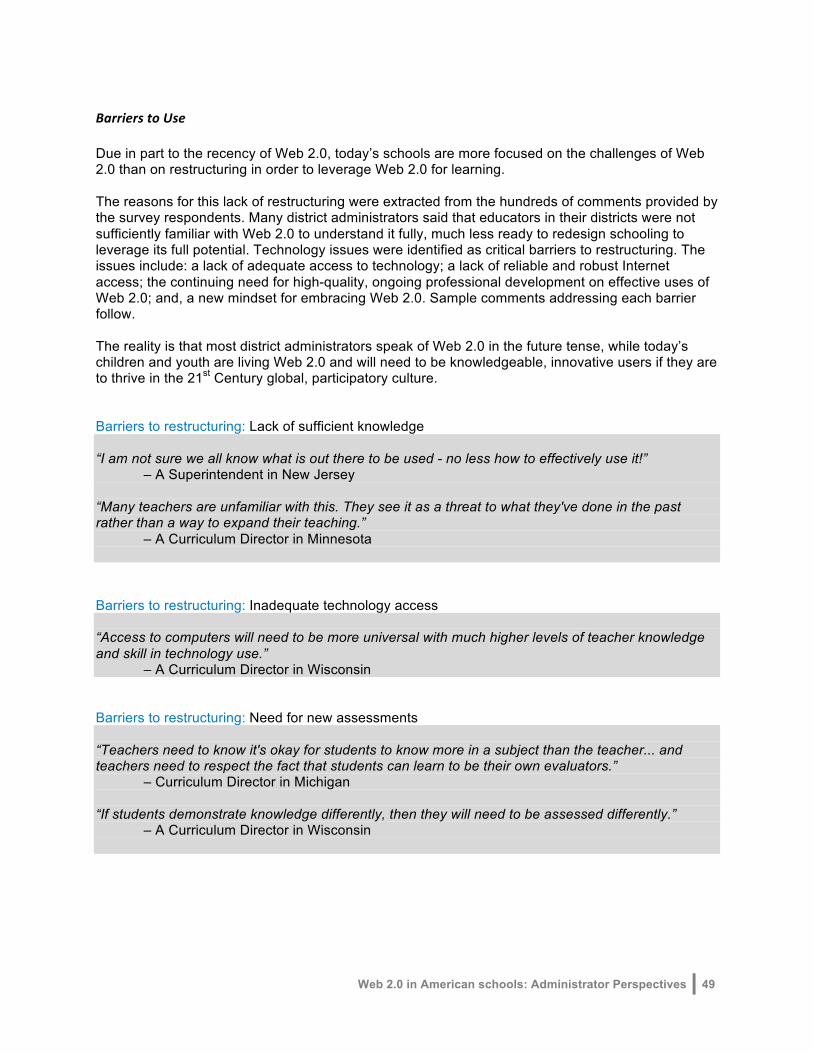
Web 2.0 in American schools: Administrator Perspectives 49
BarrierstoUse Due in part to the recency of Web 2.0, today’s schools are more focused on the challenges of Web 2.0 than on restructuring in order to leverage Web 2.0 for learning. The reasons for this lack of restructuring were extracted from the hundreds of comments provided by the survey respondents. Many district administrators said that educators in their districts were not sufficiently familiar with Web 2.0 to understand it fully, much less ready to redesign schooling to leverage its full potential. Technology issues were identified as critical barriers to restructuring. The issues include: a lack of adequate access to technology; a lack of reliable and robust Internet access; the continuing need for high-quality, ongoing professional development on effective uses of Web 2.0; and, a new mindset for embracing Web 2.0. Sample comments addressing each barrier follow. The reality is that most district administrators speak of Web 2.0 in the future tense, while today’s children and youth are living Web 2.0 and will need to be knowledgeable, innovative users if they are to thrive in the 21st Century global, participatory culture. Barriers to restructuring: Lack of sufficient knowledge “I am not sure we all know what is out there to be used - no less how to effectively use it!” – A Superintendent in New Jersey “Many teachers are unfamiliar with this. They see it as a threat to what they've done in the past rather than a way to expand their teaching.” – A Curriculum Director in Minnesota Barriers to restructuring: Inadequate technology access “Access to computers will need to be more universal with much higher levels of teacher knowledge and skill in technology use.” – A Curriculum Director in Wisconsin Barriers to restructuring: Need for new assessments “Teachers need to know it's okay for students to know more in a subject than the teacher... and teachers need to respect the fact that students can learn to be their own evaluators.” – Curriculum Director in Michigan “If students demonstrate knowledge differently, then they will need to be assessed differently.” – A Curriculum Director in Wisconsin

50 Web 2.0 in American schools: Administrator Perspectives
Barriers to restructuring: Teachers and administrators need professional development on Web 2.0 “Use of Web 2.0 will require additional teacher training in the use of this technology, particularly as a tool for differentiated instruction.” – A Curriculum Director in Virginia Barriers to restructuring: A new mindset to embrace learning with Web 2.0 “The growth of Web 2.0 will require teachers and schools to rethink how they are currently providing content to students. Students live in a connected and collaborative world. [Today] they must ‘disconnect’ when they come to school.” – A Superintendent in Kansas

Web 2.0 in American schools: Administrator Perspectives 51
APPENDIX Methodology
The intent of the survey design was to establish a random sample of school districts representative of the 14,199 public school districts in the United States, stratified by the 4 locales: urban, suburban, town, and rural. From each district within that sample, three district administrators, the superintendent, district technology director, and curriculum director was invited to participate in the CoSN survey. Split questionnaire To encourage participation and prevent survey fatigue, a split questionnaire survey design was employed. Apart from a primary section with questions that are considered to be vitally important for all respondents to answer (e.g., size and location of district, number of years employed in the district, age, etc.), the remaining questions for each respondent group were equally divided, with some questions asked of both groups. This clearly cut down the time to complete the survey, reducing the respondent burden.
Table 4 below presents the proportional breakdown by urbanicity, using the split questionnaire design and over-sampling to account for non-response. However, since the minimum acceptable sample size for each subgroup was determined to be 100 based on the concept of statistical power (Cohen, 1988), the number of districts in the urban sample was increased from 45 to 100.1 This increase, plus rounding, increased the sample from 729 to 793 for Form A and Form B (Table 4).
Table4.Numberofdistrictsbyform
Number of Districts
Percent of Total
Form A sample
Form B sample
Urban 800 6% 100 100 Suburban 2,833 20% 146 146 Town 2,528 18% 131 131 Rural 8,038 57% 416 416 Total 14,199 100% 793 793 Pilot The surveys were piloted by 57 district administrators and other educational professionals to ensure that (1) the items were clear and unambiguous, (2) terminology was used correctly, (3) the survey did not place an undue burden on district administrators, and (4) the survey was unbiased. Changes were made to the content and format of the final questionnaire based on the pilot.
Sampling methods This section describes the methods used to select the sample of school districts in the study. Although school districts are the sampling unit, three specific district-level administrators, employed within the selected districts, are the actual unit of analysis. The primary goal of the study is to generalize the study results to a larger population.
1 Statistical power is the probability of achieving statistically significant results when a true relationship is present.

52 Web 2.0 in American schools: Administrator Perspectives
Sampling frame The frame of the accessible population was identified through the 2006 Common Core of Data (CCD) databases. The CCD is the U.S. Department of Education’s primary database of school districts in the United States. The 2006-07 CCD file was used to produce a list of districts representing the study population.
Sample size Cochran’s sample size determination formula for n with continuous data (Cochran, 1977), was used to determine the minimum sample size. Districts were selected using a stratified random sample without replacement within each stratum.
Using Bartlett, Kotrlik’s, and Higgins (2001) formula in “Selecting an appropriate sample size for conducting survey research,” an appropriate sample size was determined using the continuous formula. This formula was chosen because the primary purpose of the study was to measure the level of administrator knowledge and use of Web 2.0 applications. Although the instrument includes both continuous and categorical variables, the primary variables were deemed continuous. Also the Bartlett et al. procedures for determining the appropriate sample size, common issues in sample size determination, and non-respondent sampling matters were taken into consideration.
Generalizability The study findings were intended to be generalizable to all school districts in the country. To meet this objective, the district samples needed to be selected in such a way that every school district in the country was represented in the study sample. The district sample becomes nationally representative by applying a sampling weight to each district, based upon each district’s probability of being selected into the sample.
Precision of statistical estimates Precision refers to the width of the confidence intervals around the study estimates. The smaller the confidence intervals, the more precise the study estimates are, and thus, the more confidence we have in the study findings. Other things being equal, the larger the sample size, the narrower the width of the confidence interval (i.e., the more precise the study estimates). It should also be noted that, with a given sample size, the confidence intervals are widest (i.e., the estimates are least precise) for study estimates of 50%. The width of the confidence intervals decreases as the study estimates get closer to 0% and 100%.
There is no universally acceptable level of precision; acceptable precision is subjective and is usually based on the consequences of the decisions being made using the study estimates. However, at some point, the confidence intervals might be so wide that the estimates are essentially meaningless. For this study, the expected level of precision is +/- 3%.
Target population The population of interest for this study was district-level administrators from public school districts in the 50 States and the District of Columbia. The specific administrators targeted included (1) superintendents, (2) technology directors, and (3) curriculum directors.
Districts in this preliminary list were omitted from the sampling frame for various reasons (e.g., districts with no students or no schools) summarized in Table 5.

Web 2.0 in American schools: Administrator Perspectives 53
Table5.TypesofdistrictsIncludedandexcludedfromsamplingframe
NCES code for type of agency
Included 1 = Local school district that is not a component of a supervisory union.
Included 2 = Local school district component of a supervisory union sharing a superintendent and administrative services with other local school districts.
Excluded 3 = Supervisory union administrative center, or a county superintendent serving the same purpose.
Excluded 4 = Regional education services agency, or a county superintendent serving the same purpose.
Excluded 5 = State-operated institution charged, at least in part, with providing elementary and/or secondary instruction or services to a special needs population.
Excluded 6 = Federally operated institution charged, at least in part, with providing elementary and/or secondary instruction or services to a special needs population.
Excluded 7 = Other education agencies that do not fit into the first six categories.
The NCES database was used to determine district type and locale. Only standard and component districts were included in the sample. After removing the necessary districts, the sampling frame consists of 14,199 districts.
Subgroups In addition to producing reasonably precise national estimates, the study was designed to be capable of producing reasonably precise estimates for urbanicity, the subgroup of interest. Urbanicity is based on a U.S. Census classification of places as urban or rural. City is a place that is urban, inside urban area; town is a place that is urban, outside urban area; rural is a place not classified as urban. The newly updated classification system has four major locale categories— city, suburban, town, and rural. Table 6 presents the number of districts within each urbanicity category.
Table6.Numberofpublicschooldistrictswithineachlocale
n Percent
City 800 6%
Suburb 2,833 20%
Town 2,528 18%
Rural 8,038 57%
Total 14,199 100%
Acceptable Margin of Error The general rule relative to acceptable margins of error in educational and social research for continuous data is: a 3% margin of error is acceptable (Krejcie & Morgan, 1970). Therefore, a 3%

54 Web 2.0 in American schools: Administrator Perspectives
margin of error would result in the researcher being confident that the true mean of a four point scale is within ±.12 (.03 times 4 points on the scale) of the mean calculated from the research sample.
Using the formula for continuous data as outlined in Bartlett et al. (2001), the sample size for out identified population of public school districts identifies 474 responses as being representative.
Where =value for selected alpha level of 0.25 in each tail = 1.96.
Where = estimate of the standard deviation in the population = (4 points on the scale divided by 3 standard deviations that include almost all of the possible values in the range) = 1.333.
Where =acceptable margin of error for mean being estimated (4 points on the scale * acceptable margin of error (.03)) = 0.12
Accounting for non-response According to the formula for continuous data in Bartlett et al. (2001), a sample size of 474 would be sufficient for a population of 14,199. However, to account for non-response, the anticipated return rate was set at 65%. To ensure that adequate data were collected, 474 was divided by 0.65 to account for non-response, resulting in 729.
Therefore, from this list of 14,199 districts, we drew a proportional stratified sample of 793 two times for each form to represent the study population in the 50 states and the District of Columbia. Since the frame for this study includes three different district level administrators, the study used a stratified random sample of 4,755 (1,585*3) administrators from 1,449 school districts.
Once the sample was randomly selected, names and contact information (address and telephone number) were obtained from Market Data Resources (MDR) and used to personalize the correspondence to potential respondents.
Weights Although the sample was designed to be proportionate to the total population, the difference between expected and actual sample size resulted in the need for some minor weighting adjustments to achieve equal representation across the sample. Therefore, all data were appropriately weighted so that samples were nationally representative (see Table 7).
Respondent and Response Rates Letters were mailed to the three administrators of each sampled district on December 4, 2008. The letter introduced the study and requested that the survey be completed by the person in the position specified. If there was not a specific position, then the letter recommended that the person who was most knowledgeable about the district participate. Telephone follow up was conducted in late January 2009 with districts who did not respond to the initial mailing.

Web 2.0 in American schools: Administrator Perspectives 55
Methods to maximize response rates Several steps were taken to encourage cooperation and completion of the survey within the data collection period. These efforts included follow-up and reminder calls, postcards, and e-mails to non-respondents. An incentive was also used to encourage participation. Respondents who completed the questionnaire were entered into a prize drawing to win one of the following prizes:
• A pack of 3 iPod Touches
• A library of 25 of the top selling ASCD books
• A Metiri webinar on 21st Century Skills customized for your district
• A registration and $500 in travel for the '09 ASCD or CoSN conferences Table7.Weightedsamplestatisticsbyrespondentgroupandlocale.Administrator Role
Locale Districts
(N) Proportion
of N Sampled
(s) Weighted
ns Responded
(n) Adjusted sample*
% of total
sampled
Response Rate
Weight (w)
Weighted n
Superintendent City
794 6% 220 220 49 110 12% 22% 2.17 22
Superintendent Suburban
2,781 20% 348 348 73 19% 21% 5.11 348
Superintendent Town
2,492 18% 312 312 71 17% 23% 4.71 312
Superintendent Rural
7,822 56% 983 983 196 53% 20% 5.35 983
Superintendent Total
13,889 100% 1,863 1,863 389 100% 21% 1,665
Technology Director City
794 6% 220 220 71 110 12% 32% 1.50 46
Technology Director Suburban
2,781 20% 348 348 91 19% 26% 4.10 348
Technology Director Town
2,492 18% 312 312 88 17% 28% 3.80 312
Technology Director Rural
7,822 56% 983 983 191 53% 19% 5.49 983
Technology Director Total
13,889 100% 1,863 1,863 441 100% 24% 1,689
Curriculum Director City
794 6% 189 27 54 110 15% 29% 1.97 27
Curriculum Director Suburban
2,781 20% 267 348 91 22% 34% 4.10 348
Curriculum Director Town
2,492 18% 230 312 74 19% 32% 4.52 312
Curriculum Director Rural
7,822 56% 546 983 140 44% 26% 7.49 983
Curriculum Director Total *
13,889 100% 1232 1670 359 100% 29% 1,670
Overall Total 13,889 100% 4,958 1,189 26% 5,023
* Note: The study includes an oversample of the urban districts, in order for there to be a sufficient number of respondents.
56 Web 2.0 in American schools: Administrator Perspectives
Sources
Bartlett, J.E., II, Kotrlik, J.W., & Higgins, C. (2001). Organizational research: Determining appropriate sample size for survey research. Information Technology, Learning, and Performance Journal, 19(1) 43-50.
Cochran, W.G. (1977). Sampling techniques (3rd ed.). New York: Wiley.
Cohen, J. (1988). Statistical power analysis for the behavioral sciences. Hillsdale, NJ: Lawrence Erlbaum Associates.
Krejcie, R.V., & Morgan, D.W. (1970). Determining sample size for research activities. Educational and Psychological Measurement, ˙∆˜y, 607-610.


![Five Web20[1]](https://img.pdfslide.us/doc/110x75/577d25271a28ab4e1e9e29a1/five-web201.jpg)