Embed Size (px)
Citation preview
A UPS White Paper, March 2015 Global Study
UPS Pulse of the Online Shopper™ | A UPS White Paper | March 2015 | Global Study
©2015 United Parcel Service of America, Inc. 2
Table of Contents
I. Introduction ............................................................................................................................. 3 A. Study Goals ..................................................................................................................................................................................... 3 B. Methodology .................................................................................................................................................................................... 4 C. 2014 Research Focus Areas ........................................................................................................................................................... 5 D. Executive Summary: ....................................................................................................................................................................... 5
II. The Retail Landscape ............................................................................................................ 9 A. State of the Industry ...................................................................................................................................................................... 10 B. Mobile’s Emerging Impact ............................................................................................................................................................. 13 C. Changing Store Dynamics ............................................................................................................................................................. 16 D. Social Exerts Influence .................................................................................................................................................................. 18
III. The Path to Purchase: Expectations and Satisfaction ...................................................... 22 A. The Shopper and Their Mindset .................................................................................................................................................... 22 B. Pre-Shopping: Search and Browse ............................................................................................................................................... 22 C. Checkout and General Shipping Preferences ............................................................................................................................... 25 D. Delivery and the Post-Purchase Experience ................................................................................................................................. 33
IV. Conclusion .......................................................................................................................... 40 A. The Flex Shopper is Changing the Retail World ........................................................................................................................... 40
UPS Pulse of the Online Shopper™ | A UPS White Paper | March 2015 | Global Study
©2015 United Parcel Service of America, Inc. 3
I. Introduction
UPS commissioned this Global Study with comScore for the second year to provide perspective for retailers on consumer behavior in today’s fluid shopping culture. Global e-commerce growth, which continues to fuel retail expansion, is estimated to reach 16% in 2015, moving from $1.47 trillion in 2014 to $1.7 trillion. Growth in the market is expected from expanding online and mobile user bases in emerging markets, increased m-commerce sales, and growth in new international markets.1
One of the great opportunities provided by online retail is the ability to sell to customers in previously unreachable marketplaces. In this survey, shoppers worldwide said that almost one in four (24%) of their purchases were made with online retailers outside their own country. Half of these (12%) were made with U.S.-based retailers, and the other half elsewhere. In the U.S., more than half (54%) of shoppers said they had made purchases with retailers based outside their own country.
A. Study Goals
This year’s study goes beyond other retail industry studies to give a 360˚ perspective of online shopping. The scope has been expanded on key customer experience topics and now explores what drives the consumer’s complete path to purchase. It delivers insights into shopping preferences and current levels of satisfaction with online and omnichannel shopping, taking the consumer’s pulse on what tactics influence positive shopping experiences – from pre-purchase to purchase to post-purchase. Featured throughout this white paper is a series of “Retail Watch” recommendations that can help drive retail sales.
1 http://www.emarketer.com/Article/Global-B2C-Ecommerce-Sales-Hit-15-Trillion-This-Year-Driven-by-Growth-Emerging-Markets/1010575
UPS Pulse of the Online Shopper™ | A UPS White Paper | March 2015 | Global Study
©2015 United Parcel Service of America, Inc. 4
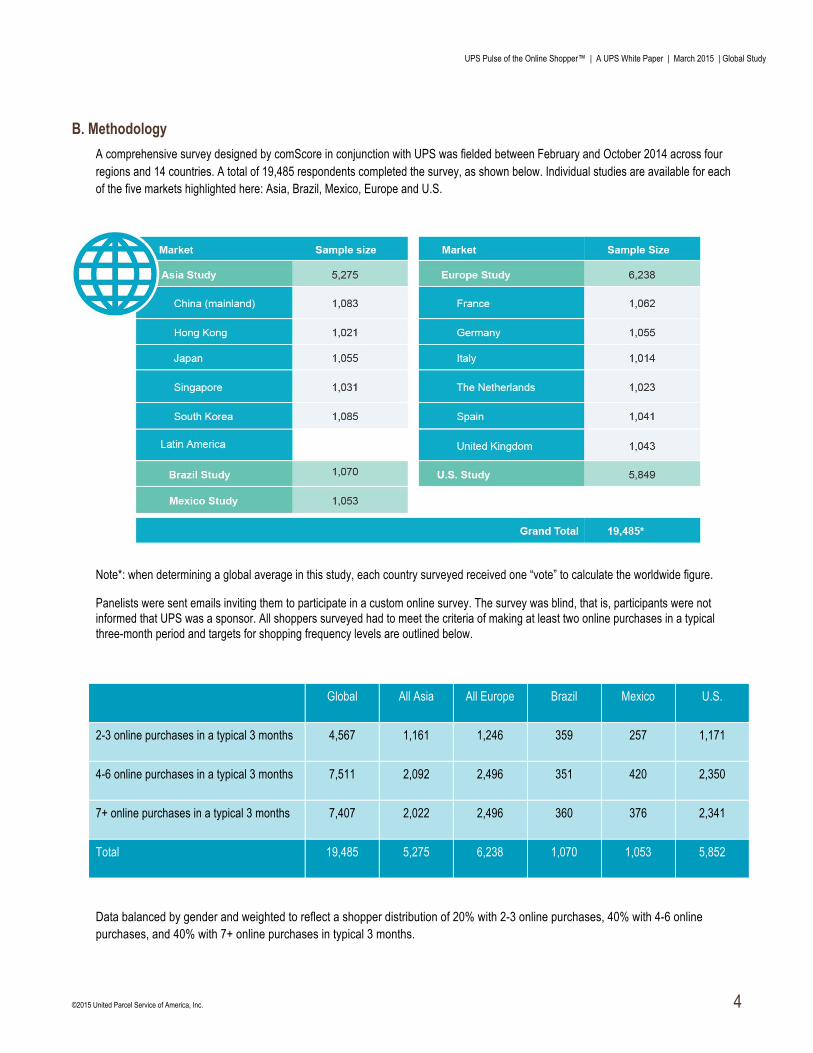
B. Methodology A comprehensive survey designed by comScore in conjunction with UPS was fielded between February and October 2014 across four regions and 14 countries. A total of 19,485 respondents completed the survey, as shown below. Individual studies are available for each of the five markets highlighted here: Asia, Brazil, Mexico, Europe and U.S.
Note*: when determining a global average in this study, each country surveyed received one “vote” to calculate the worldwide figure.
Panelists were sent emails inviting them to participate in a custom online survey. The survey was blind, that is, participants were not informed that UPS was a sponsor. All shoppers surveyed had to meet the criteria of making at least two online purchases in a typical three-month period and targets for shopping frequency levels are outlined below.
Global All Asia All Europe Brazil Mexico U.S.
2-3 online purchases in a typical 3 months 4,567 1,161 1,246 359 257 1,171
4-6 online purchases in a typical 3 months 7,511 2,092 2,496 351 420 2,350
7+ online purchases in a typical 3 months 7,407 2,022 2,496 360 376 2,341
Total 19,485 5,275 6,238 1,070 1,053 5,852
Data balanced by gender and weighted to reflect a shopper distribution of 20% with 2-3 online purchases, 40% with 4-6 online purchases, and 40% with 7+ online purchases in typical 3 months.
UPS Pulse of the Online Shopper™ | A UPS White Paper | March 2015 | Global Study
©2015 United Parcel Service of America, Inc. 5
C. 2014 Research Focus Areas Shopping Experience
• What do consumers want in an online shopping experience? • How important is product and customer service information when making a purchase, and when and where
should it be presented? • What do consumers want to see from retailers in the online checkout and delivery process? • How important are returns in the overall shopping journey and when do consumers access this information while
shopping and post-purchase? • What drives customer retention and subsequent retailer recommendations?
Mobile, Social and Future of Retail • How are mobile and social media channels changing consumers’ shopping habits and expectations? • What are consumers interested in as it relates to emerging technology capabilities
Omnichannel
• What elements of the online experience are consumers receptive to when shopping in store? • What do omnichannel shoppers value most in loyalty programs? • Given the omnichannel nature of today’s shoppers, how are they navigating channels and why?
Global Impact How frequently do global shoppers purchase on local versus foreign websites?
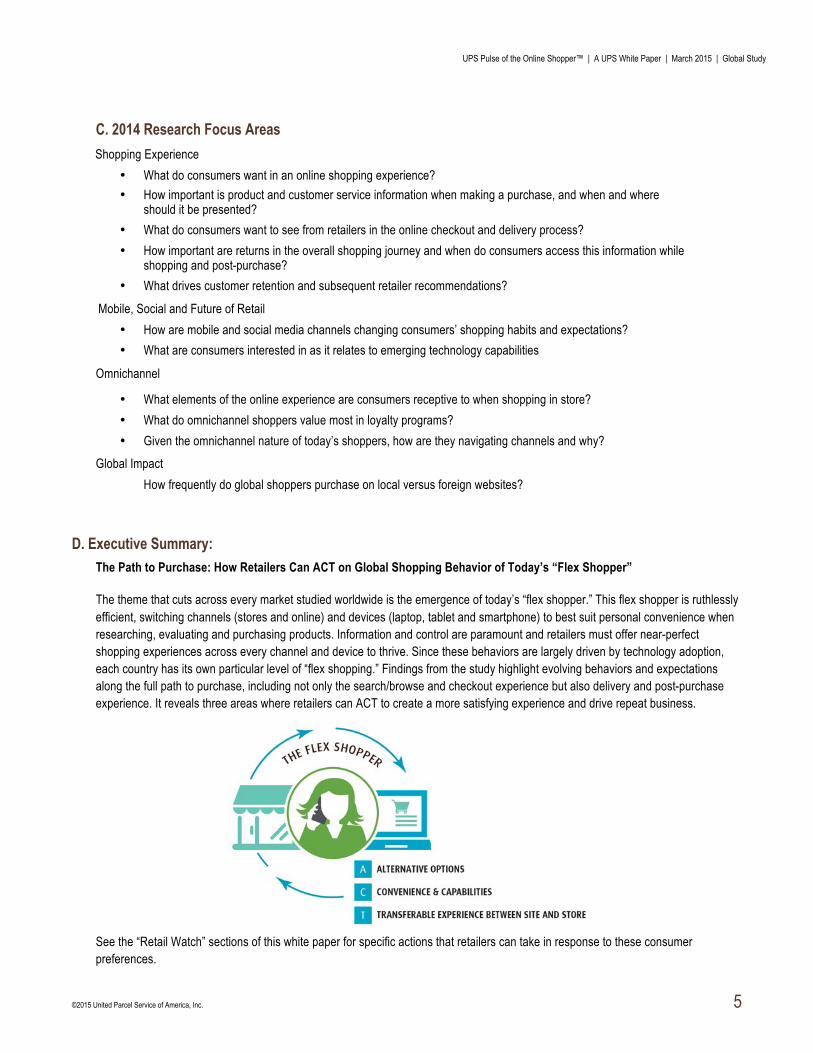
D. Executive Summary: The Path to Purchase: How Retailers Can ACT on Global Shopping Behavior of Today’s “Flex Shopper” The theme that cuts across every market studied worldwide is the emergence of today’s “flex shopper.” This flex shopper is ruthlessly efficient, switching channels (stores and online) and devices (laptop, tablet and smartphone) to best suit personal convenience when researching, evaluating and purchasing products. Information and control are paramount and retailers must offer near-perfect shopping experiences across every channel and device to thrive. Since these behaviors are largely driven by technology adoption, each country has its own particular level of “flex shopping.” Findings from the study highlight evolving behaviors and expectations along the full path to purchase, including not only the search/browse and checkout experience but also delivery and post-purchase experience. It reveals three areas where retailers can ACT to create a more satisfying experience and drive repeat business.
See the “Retail Watch” sections of this white paper for specific actions that retailers can take in response to these consumer preferences.
UPS Pulse of the Online Shopper™ | A UPS White Paper | March 2015 | Global Study
©2015 United Parcel Service of America, Inc. 6
The global online shopper is increasingly interested in alternative options and choices, ranging from new delivery options to new payment options.
• While consumers across markets still prefer to have the majority of their online orders delivered to their homes, they also need other methods to pick up and receive their packages (e.g., alternate delivery locations – Asia - 46%; Europe - 32%; Brazil - 45%; Mexico - 44%; U.S. - 26%)
• When not at home to sign for a package, consumers across regions differ in their preferences for delivery alternatives: • Asia: 33% prefer items shipped to a local retail location • Europe: 38% prefer items left with a neighbor • Brazil: 39% prefer items shipped to another location, like an office or another address • Mexico: 42% prefer items shipped to a carrier’s location • U.S.: 27% prefer items shipped to a carrier’s location
For today’s global consumer, convenience takes several forms. In addition to returns preferences and free and flexible delivery options, constant technological advances have led to a new range of in-store shopping conveniences and capabilities, which will play a more significant role in the future shopping experience.
• Free shipping plays a major role in the online shopping experience (importance of free shipping: 70% Asia; 73% Europe; 84% Brazil; 80% Mexico; 81% U.S.)
• Ship-to-store is viewed as an appealing convenience across markets • The most preferred delivery service convenience option among consumers is receiving email or text
delivery alerts so they know approximate time of delivery • Consumers across markets are becoming more open to delivery service convenience options like
rescheduling a delivery en route, rerouting a delivery to an alternate address and authorizing a delivery beforehand
Consumers want a consistent and positive online shopping experience across all channels and the store remains important. Retailers must optimize their mobile, online and in-store shopping experience and bridge the three for a seamless customer experience.
• Across all markets, consumers are more satisfied with their online shopping experience than their in-store experience • Online: U.S. is most satisfied (83%) and Asia is least satisfied (46%) • In-store: Mexico is most satisfied (73%) and Asia is least satisfied (43%)
UPS Pulse of the Online Shopper™ | A UPS White Paper | March 2015 | Global Study
©2015 United Parcel Service of America, Inc. 7
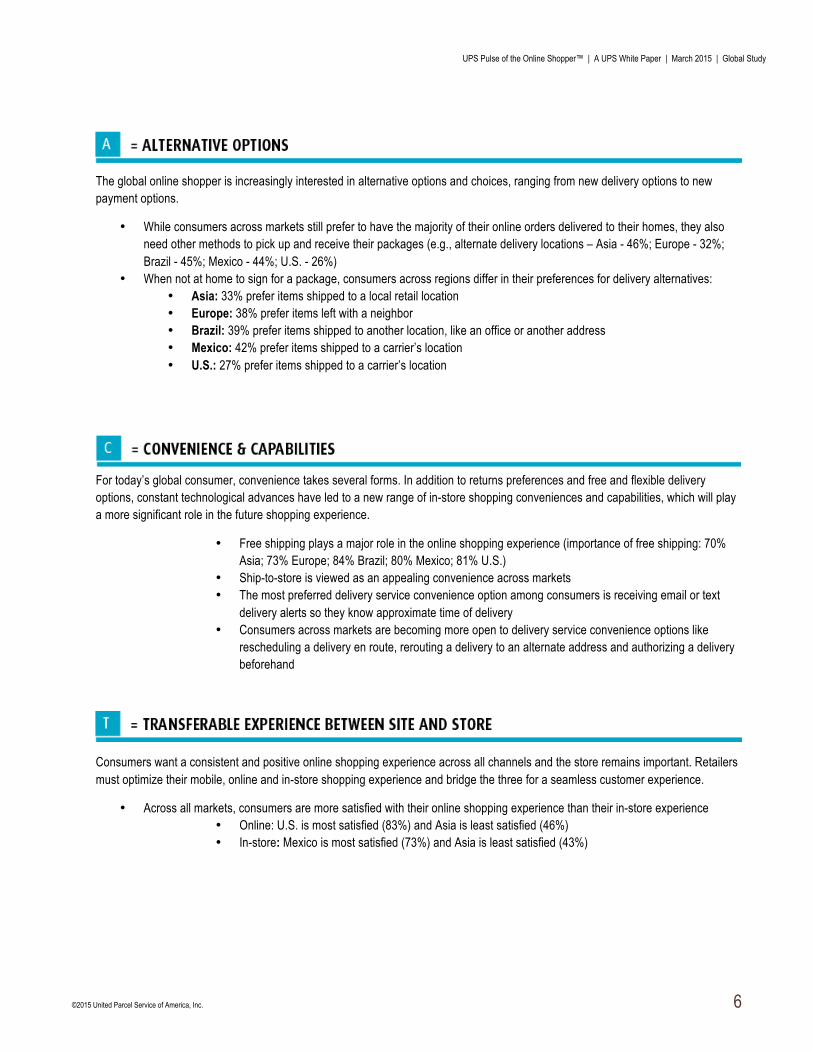
Overall Satisfaction with Shopping Experience
• The store still plays a major role. The top “searching and buying” preference for all markets is to do so online (across all devices) and second is searching and buying in store
• Consumers across markets differ in their returns location preferences:
• Despite the continued growth of mobile commerce, shoppers around the world are experiencing several barriers to shopping via mobile devices, including not getting a clear or large enough product image, product information not being easily viewed and being hard to compare products.
UPS Pulse of the Online Shopper™ | A UPS White Paper | March 2015 | Global Study
©2015 United Parcel Service of America, Inc. 8
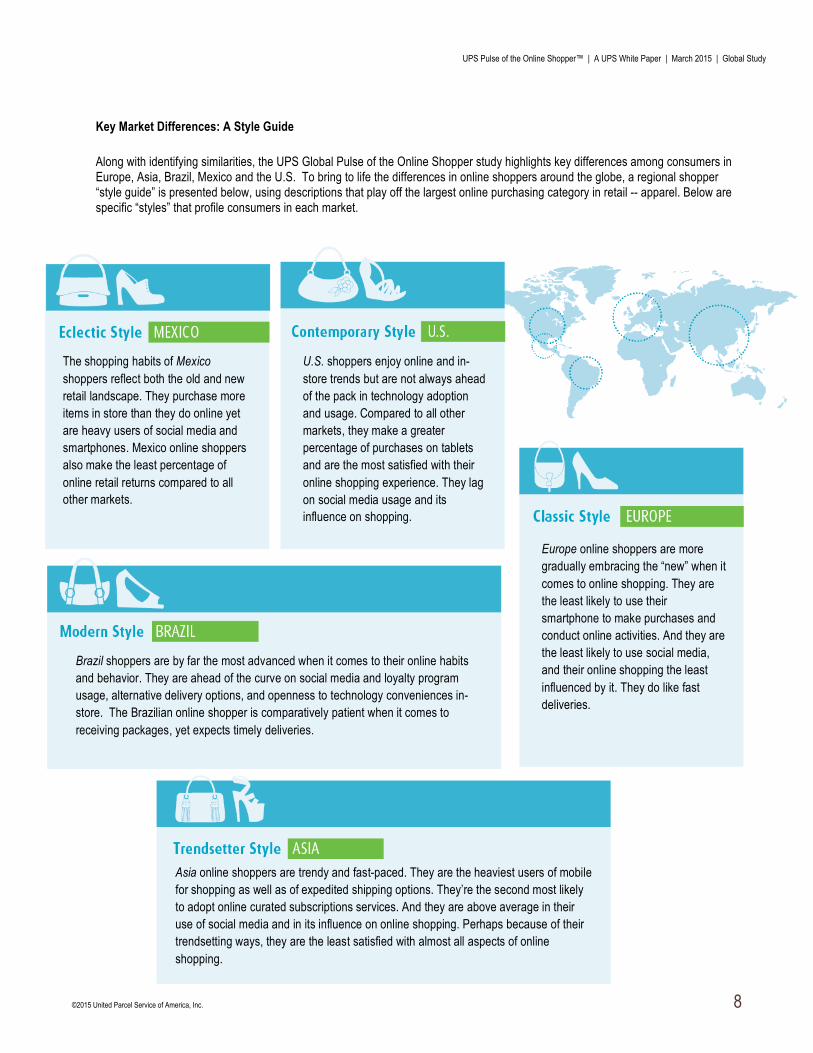
Key Market Differences: A Style Guide Along with identifying similarities, the UPS Global Pulse of the Online Shopper study highlights key differences among consumers in Europe, Asia, Brazil, Mexico and the U.S. To bring to life the differences in online shoppers around the globe, a regional shopper “style guide” is presented below, using descriptions that play off the largest online purchasing category in retail -- apparel. Below are specific “styles” that profile consumers in each market.
Asia online shoppers are trendy and fast-paced. They are the heaviest users of mobile for shopping as well as of expedited shipping options. They’re the second most likely to adopt online curated subscriptions services. And they are above average in their use of social media and in its influence on online shopping. Perhaps because of their trendsetting ways, they are the least satisfied with almost all aspects of online shopping.
Europe online shoppers are more gradually embracing the “new” when it comes to online shopping. They are the least likely to use their smartphone to make purchases and conduct online activities. And they are the least likely to use social media, and their online shopping the least influenced by it. They do like fast deliveries.
Brazil shoppers are by far the most advanced when it comes to their online habits and behavior. They are ahead of the curve on social media and loyalty program usage, alternative delivery options, and openness to technology conveniences in-store. The Brazilian online shopper is comparatively patient when it comes to receiving packages, yet expects timely deliveries.
The shopping habits of Mexico shoppers reflect both the old and new retail landscape. They purchase more items in store than they do online yet are heavy users of social media and smartphones. Mexico online shoppers also make the least percentage of online retail returns compared to all other markets.
U.S. shoppers enjoy online and in-store trends but are not always ahead of the pack in technology adoption and usage. Compared to all other markets, they make a greater percentage of purchases on tablets and are the most satisfied with their online shopping experience. They lag on social media usage and its influence on shopping.
UPS Pulse of the Online Shopper™ | A UPS White Paper | March 2015 | Global Study
©2015 United Parcel Service of America, Inc. 9
Global Opportunities and Customer Behavior
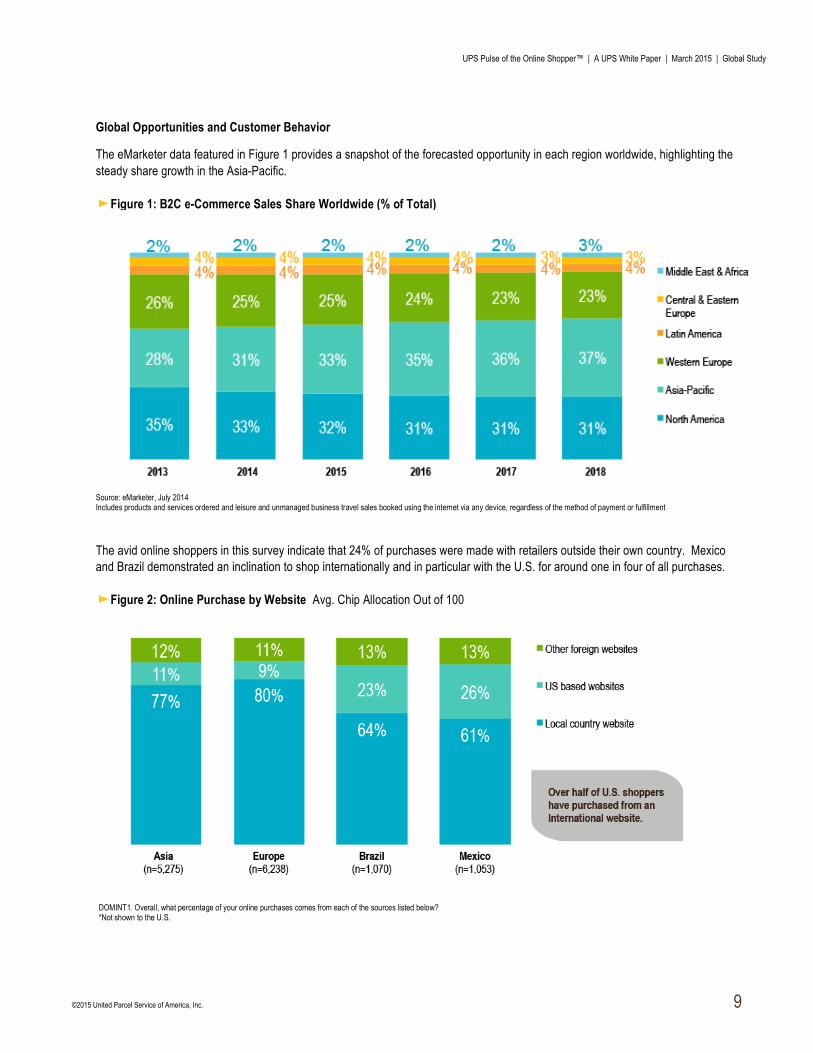
The eMarketer data featured in Figure 1 provides a snapshot of the forecasted opportunity in each region worldwide, highlighting the steady share growth in the Asia-Pacific.
The avid online shoppers in this survey indicate that 24% of purchases were made with retailers outside their own country. Mexico and Brazil demonstrated an inclination to shop internationally and in particular with the U.S. for around one in four of all purchases.
Figure 2: Online Purchase by Website Avg. Chip Allocation Out of 100
DOMINT1. Overall, what percentage of your online purchases comes from each of the sources listed below? *Not shown to the U.S.
Figure 1: B2C e-Commerce Sales Share Worldwide (% of Total)
Source: eMarketer, July 2014 Includes products and services ordered and leisure and unmanaged business travel sales booked using the internet via any device, regardless of the method of payment or fulfillment
UPS Pulse of the Online Shopper™ | A UPS White Paper | March 2015 | Global Study
©2015 United Parcel Service of America, Inc. 10
II. The Retail Landscape
A. State of the Industry Today’s connected consumer has heightened the demands they place on retailers. Despite desktop’s reign, mobile’s emergence as a significant revenue channel and social media’s ability to influence means retailers must up their game and differentiate themselves to compete in an omnichannel world.
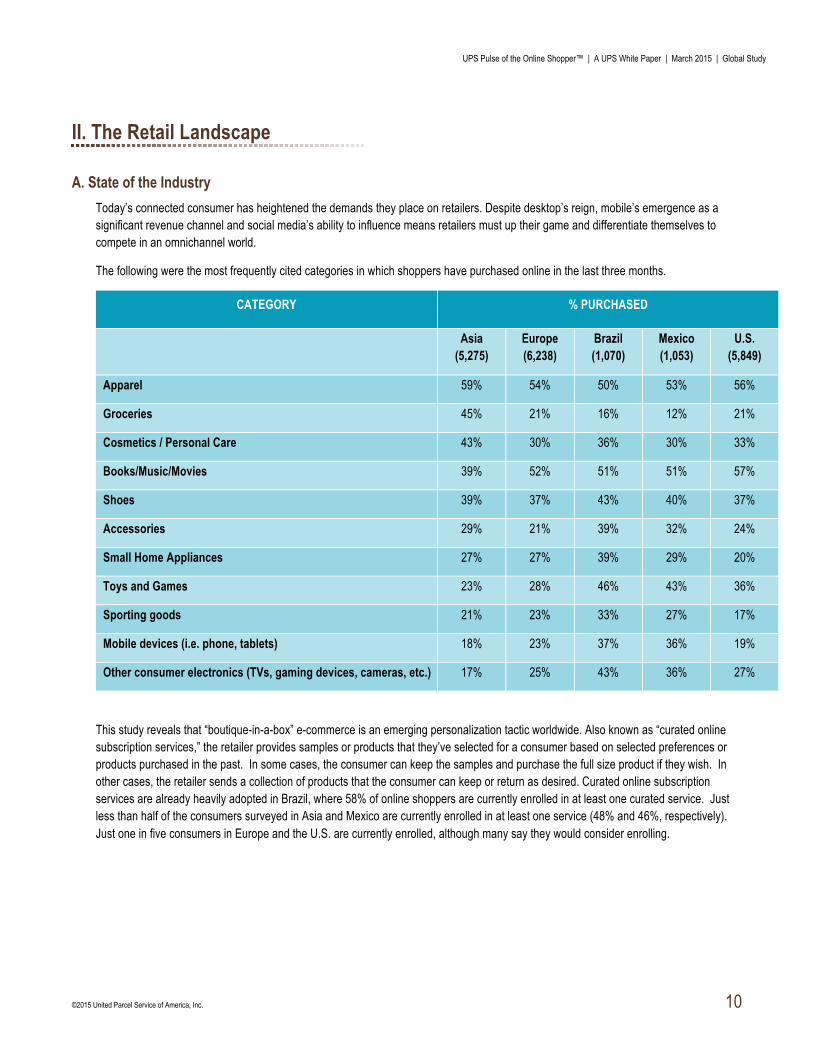
The following were the most frequently cited categories in which shoppers have purchased online in the last three months.
CATEGORY % PURCHASED
Asia (5,275)
Europe (6,238)
Brazil (1,070)
Mexico (1,053)
U.S. (5,849)
Apparel 59% 54% 50% 53% 56%
Groceries 45% 21% 16% 12% 21%
Cosmetics / Personal Care 43% 30% 36% 30% 33%
Books/Music/Movies 39% 52% 51% 51% 57%
Shoes 39% 37% 43% 40% 37%
Accessories 29% 21% 39% 32% 24%
Small Home Appliances 27% 27% 39% 29% 20%
Toys and Games 23% 28% 46% 43% 36%
Sporting goods 21% 23% 33% 27% 17%
Mobile devices (i.e. phone, tablets) 18% 23% 37% 36% 19%
Other consumer electronics (TVs, gaming devices, cameras, etc.) 17% 25% 43% 36% 27%
This study reveals that “boutique-in-a-box” e-commerce is an emerging personalization tactic worldwide. Also known as “curated online subscription services,” the retailer provides samples or products that they’ve selected for a consumer based on selected preferences or products purchased in the past. In some cases, the consumer can keep the samples and purchase the full size product if they wish. In other cases, the retailer sends a collection of products that the consumer can keep or return as desired. Curated online subscription services are already heavily adopted in Brazil, where 58% of online shoppers are currently enrolled in at least one curated service. Just less than half of the consumers surveyed in Asia and Mexico are currently enrolled in at least one service (48% and 46%, respectively). Just one in five consumers in Europe and the U.S. are currently enrolled, although many say they would consider enrolling.
UPS Pulse of the Online Shopper™ | A UPS White Paper | March 2015 | Global Study
©2015 United Parcel Service of America, Inc. 11
Shoppers Start Their Search with a Search Engine or by Going to a Shopping Website
In order to find products of interest, many consumers begin their search for products through a search engine, which is where about one in four consumers in Asia, Europe, Brazil and Mexico start their search. In the U.S., more consumers start with a trip to Amazon (28%) rather than a search engine (19%). Other common starting spots are a specific retailer’s website, a retailer’s physical store, or other online marketplaces.
Desktops/Laptops Are Still the Preferred Method for Online Researching and Buying
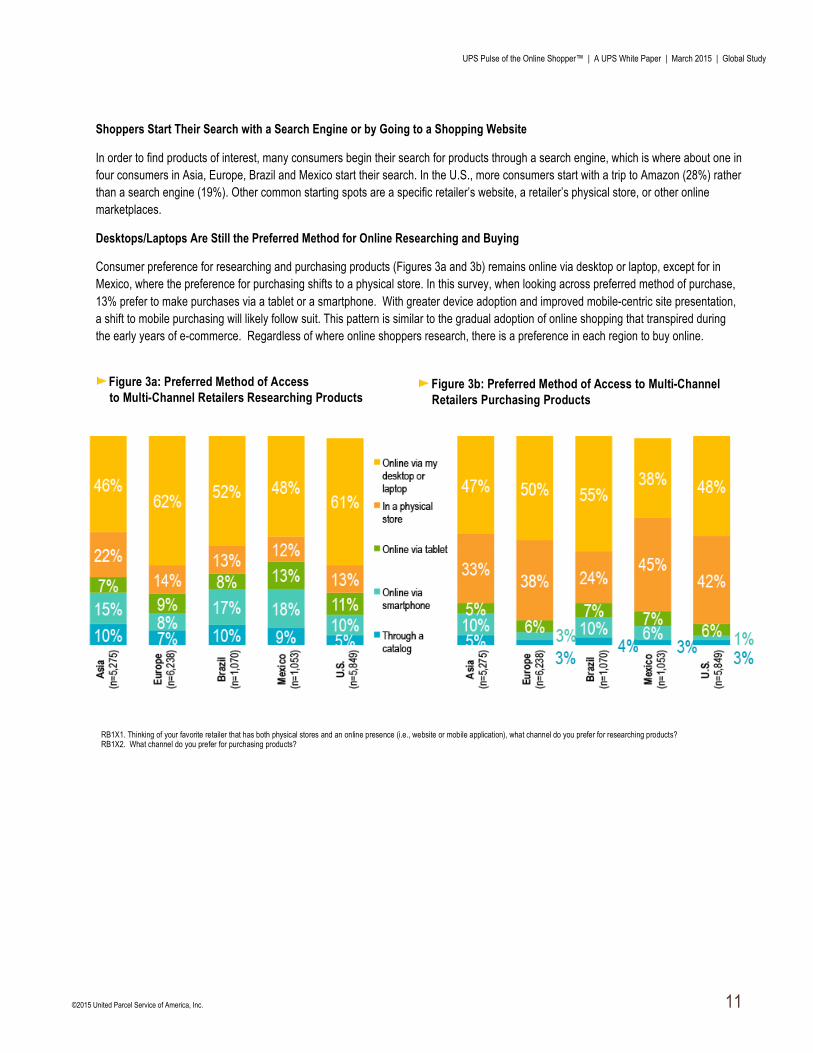
Consumer preference for researching and purchasing products (Figures 3a and 3b) remains online via desktop or laptop, except for in Mexico, where the preference for purchasing shifts to a physical store. In this survey, when looking across preferred method of purchase, 13% prefer to make purchases via a tablet or a smartphone. With greater device adoption and improved mobile-centric site presentation, a shift to mobile purchasing will likely follow suit. This pattern is similar to the gradual adoption of online shopping that transpired during the early years of e-commerce. Regardless of where online shoppers research, there is a preference in each region to buy online.
Figure 3a: Preferred Method of Access to Multi-Channel Retailers Researching Products
Figure 3b: Preferred Method of Access to Multi-Channel Retailers Purchasing Products
RB1X1. Thinking of your favorite retailer that has both physical stores and an online presence (i.e., website or mobile application), what channel do you prefer for researching products? RB1X2. What channel do you prefer for purchasing products?
UPS Pulse of the Online Shopper™ | A UPS White Paper | March 2015 | Global Study
©2015 United Parcel Service of America, Inc. 12
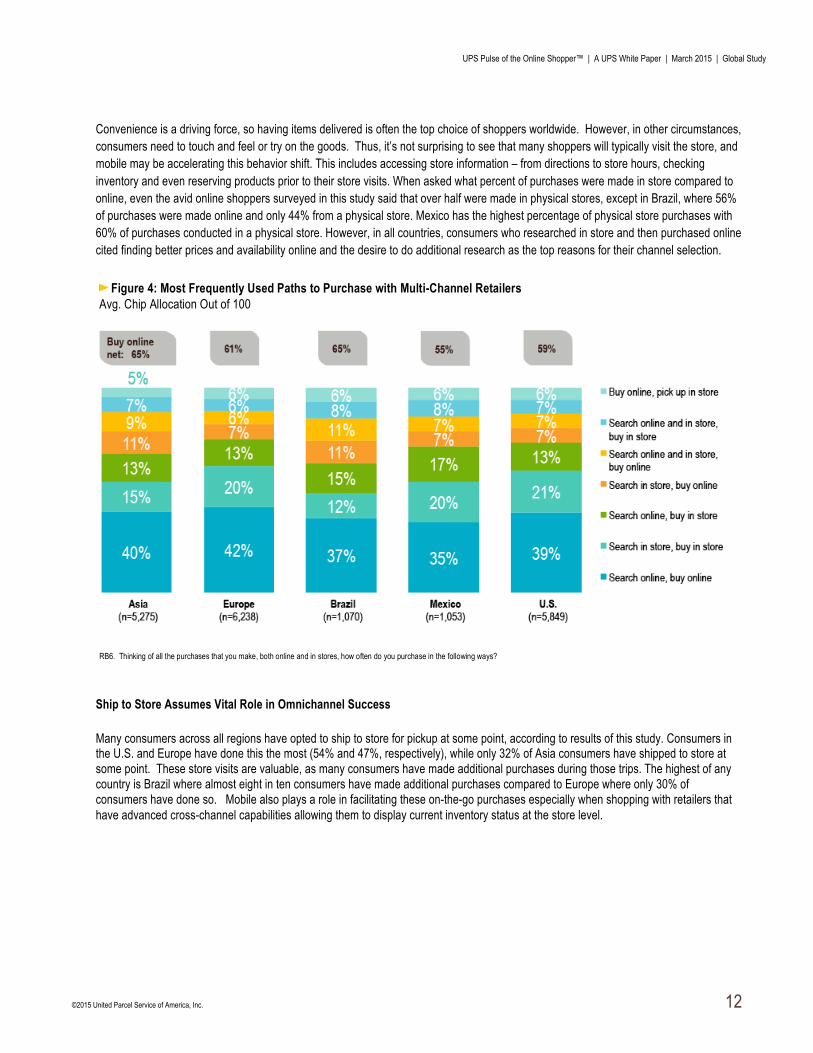
Convenience is a driving force, so having items delivered is often the top choice of shoppers worldwide. However, in other circumstances, consumers need to touch and feel or try on the goods. Thus, it’s not surprising to see that many shoppers will typically visit the store, and mobile may be accelerating this behavior shift. This includes accessing store information – from directions to store hours, checking inventory and even reserving products prior to their store visits. When asked what percent of purchases were made in store compared to online, even the avid online shoppers surveyed in this study said that over half were made in physical stores, except in Brazil, where 56% of purchases were made online and only 44% from a physical store. Mexico has the highest percentage of physical store purchases with 60% of purchases conducted in a physical store. However, in all countries, consumers who researched in store and then purchased online cited finding better prices and availability online and the desire to do additional research as the top reasons for their channel selection.
Ship to Store Assumes Vital Role in Omnichannel Success
Many consumers across all regions have opted to ship to store for pickup at some point, according to results of this study. Consumers in the U.S. and Europe have done this the most (54% and 47%, respectively), while only 32% of Asia consumers have shipped to store at some point. These store visits are valuable, as many consumers have made additional purchases during those trips. The highest of any country is Brazil where almost eight in ten consumers have made additional purchases compared to Europe where only 30% of consumers have done so. Mobile also plays a role in facilitating these on-the-go purchases especially when shopping with retailers that have advanced cross-channel capabilities allowing them to display current inventory status at the store level.
Figure 4: Most Frequently Used Paths to Purchase with Multi-Channel Retailers Avg. Chip Allocation Out of 100
RB6. Thinking of all the purchases that you make, both online and in stores, how often do you purchase in the following ways?
UPS Pulse of the Online Shopper™ | A UPS White Paper | March 2015 | Global Study
©2015 United Parcel Service of America, Inc. 13
B. Mobile’s Emerging Impact Smartphones and tablets are changing how consumers communicate, access information, and how they shop. eMarketer estimates that in 2015, mobile search will grow beyond that of desktop search and that by 2018, smartphone purchases will make up 26.1% of m-commerce in the U.S.2 This same research also shows that the type of smartphone can lead to different basket sizes, with Windows Phone purchasers on the low end and Apple iPhone users on the high end. Growth of e-commerce in some countries, such as China, is largely being driven by m-commerce growth.3 In markets like China, retailers are trying to capitalize on smartphone users and convert them into purchasers.
Consumers Accelerate Mobile Behavior and Retailers Reap Rewards
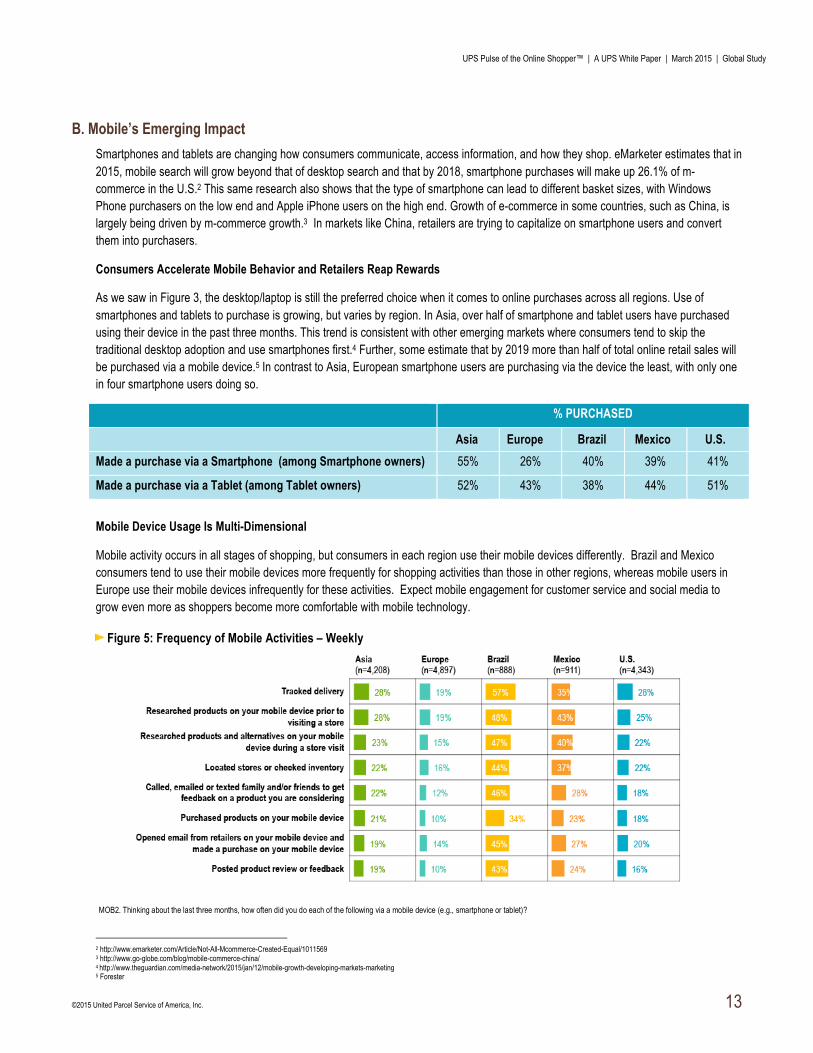
As we saw in Figure 3, the desktop/laptop is still the preferred choice when it comes to online purchases across all regions. Use of smartphones and tablets to purchase is growing, but varies by region. In Asia, over half of smartphone and tablet users have purchased using their device in the past three months. This trend is consistent with other emerging markets where consumers tend to skip the traditional desktop adoption and use smartphones first.4 Further, some estimate that by 2019 more than half of total online retail sales will be purchased via a mobile device.5 In contrast to Asia, European smartphone users are purchasing via the device the least, with only one in four smartphone users doing so.
% PURCHASED
Asia Europe Brazil Mexico U.S. Made a purchase via a Smartphone (among Smartphone owners) 55% 26% 40% 39% 41%
Made a purchase via a Tablet (among Tablet owners) 52% 43% 38% 44% 51%
Mobile Device Usage Is Multi-Dimensional
Mobile activity occurs in all stages of shopping, but consumers in each region use their mobile devices differently. Brazil and Mexico consumers tend to use their mobile devices more frequently for shopping activities than those in other regions, whereas mobile users in Europe use their mobile devices infrequently for these activities. Expect mobile engagement for customer service and social media to grow even more as shoppers become more comfortable with mobile technology.
2 http://www.emarketer.com/Article/Not-All-Mcommerce-Created-Equal/1011569 3 http://www.go-globe.com/blog/mobile-commerce-china/ 4 http://www.theguardian.com/media-network/2015/jan/12/mobile-growth-developing-markets-marketing 5 Forester
Figure 5: Frequency of Mobile Activities – Weekly
MOB2. Thinking about the last three months, how often did you do each of the following via a mobile device (e.g., smartphone or tablet)?
UPS Pulse of the Online Shopper™ | A UPS White Paper | March 2015 | Global Study
©2015 United Parcel Service of America, Inc. 14
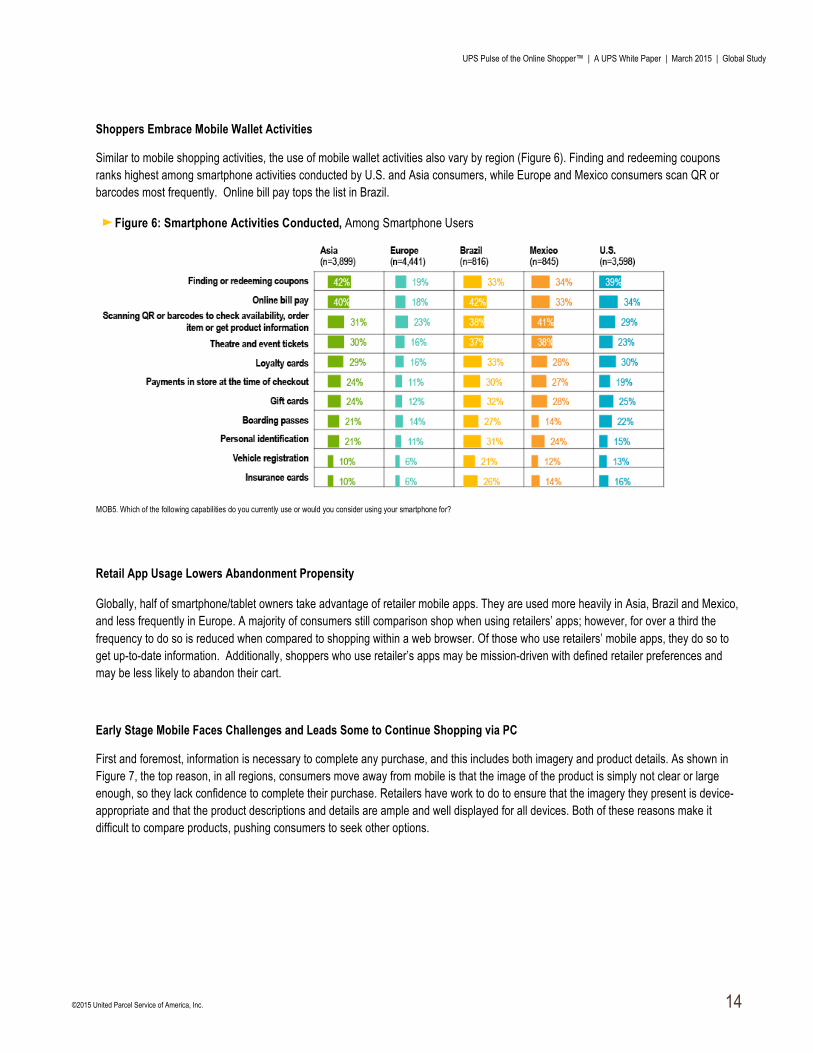
Shoppers Embrace Mobile Wallet Activities
Similar to mobile shopping activities, the use of mobile wallet activities also vary by region (Figure 6). Finding and redeeming coupons ranks highest among smartphone activities conducted by U.S. and Asia consumers, while Europe and Mexico consumers scan QR or barcodes most frequently. Online bill pay tops the list in Brazil.
Retail App Usage Lowers Abandonment Propensity
Globally, half of smartphone/tablet owners take advantage of retailer mobile apps. They are used more heavily in Asia, Brazil and Mexico, and less frequently in Europe. A majority of consumers still comparison shop when using retailers’ apps; however, for over a third the frequency to do so is reduced when compared to shopping within a web browser. Of those who use retailers’ mobile apps, they do so to get up-to-date information. Additionally, shoppers who use retailer’s apps may be mission-driven with defined retailer preferences and may be less likely to abandon their cart.
Early Stage Mobile Faces Challenges and Leads Some to Continue Shopping via PC
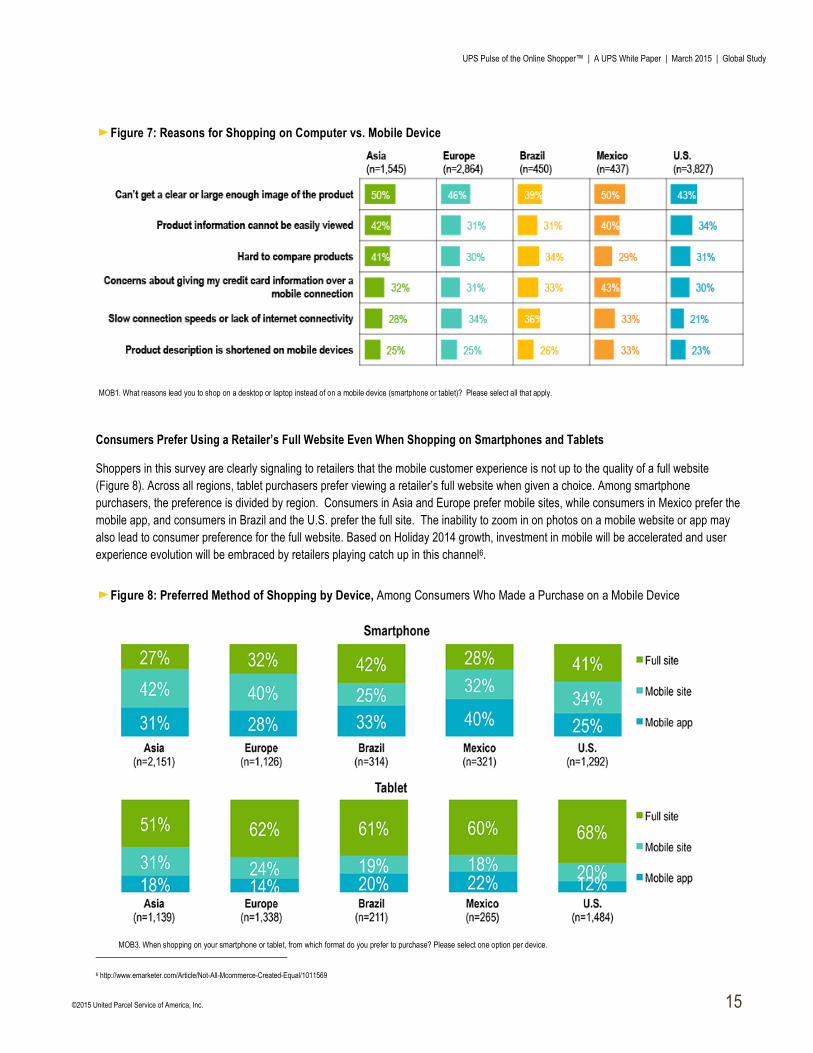
First and foremost, information is necessary to complete any purchase, and this includes both imagery and product details. As shown in Figure 7, the top reason, in all regions, consumers move away from mobile is that the image of the product is simply not clear or large enough, so they lack confidence to complete their purchase. Retailers have work to do to ensure that the imagery they present is device-appropriate and that the product descriptions and details are ample and well displayed for all devices. Both of these reasons make it difficult to compare products, pushing consumers to seek other options.
MOB5. Which of the following capabilities do you currently use or would you consider using your smartphone for?
Figure 6: Smartphone Activities Conducted, Among Smartphone Users
UPS Pulse of the Online Shopper™ | A UPS White Paper | March 2015 | Global Study
©2015 United Parcel Service of America, Inc. 15
Consumers Prefer Using a Retailer’s Full Website Even When Shopping on Smartphones and Tablets
Shoppers in this survey are clearly signaling to retailers that the mobile customer experience is not up to the quality of a full website (Figure 8). Across all regions, tablet purchasers prefer viewing a retailer’s full website when given a choice. Among smartphone purchasers, the preference is divided by region. Consumers in Asia and Europe prefer mobile sites, while consumers in Mexico prefer the mobile app, and consumers in Brazil and the U.S. prefer the full site. The inability to zoom in on photos on a mobile website or app may also lead to consumer preference for the full website. Based on Holiday 2014 growth, investment in mobile will be accelerated and user experience evolution will be embraced by retailers playing catch up in this channel6.
6 http://www.emarketer.com/Article/Not-All-Mcommerce-Created-Equal/1011569
Figure 7: Reasons for Shopping on Computer vs. Mobile Device
MOB1. What reasons lead you to shop on a desktop or laptop instead of on a mobile device (smartphone or tablet)? Please select all that apply.
Figure 8: Preferred Method of Shopping by Device, Among Consumers Who Made a Purchase on a Mobile Device
MOB3. When shopping on your smartphone or tablet, from which format do you prefer to purchase? Please select one option per device.
UPS Pulse of the Online Shopper™ | A UPS White Paper | March 2015 | Global Study
©2015 United Parcel Service of America, Inc. 16
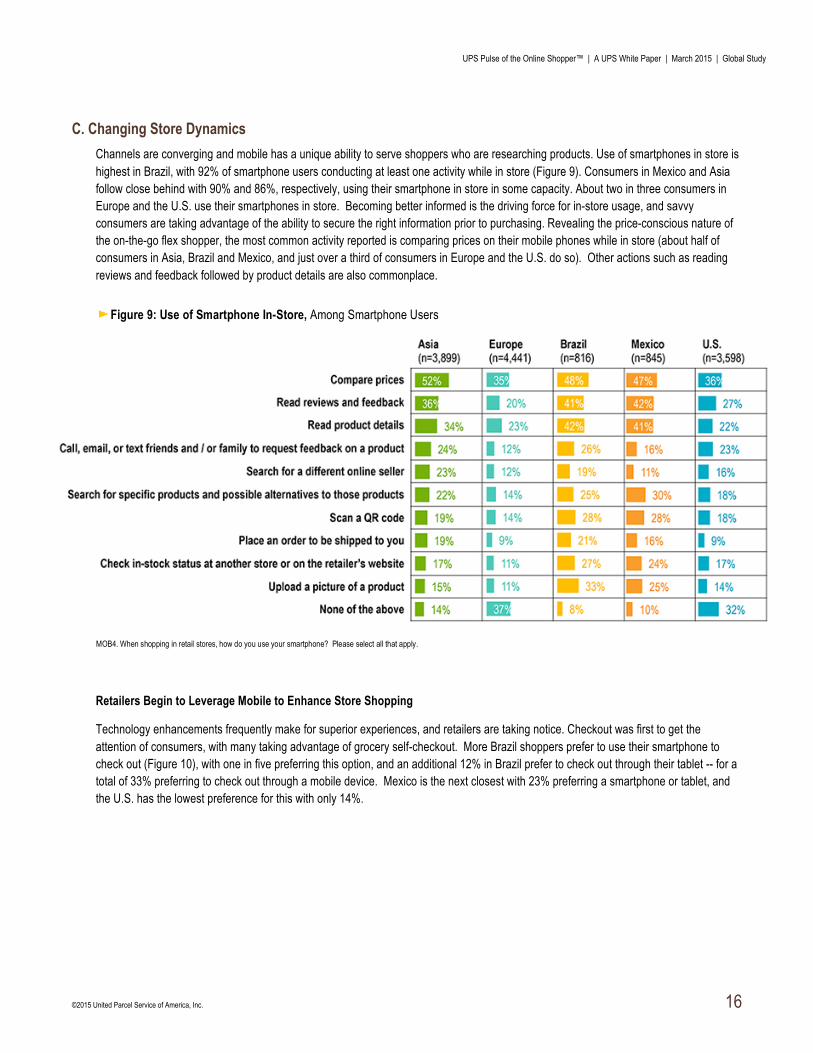
C. Changing Store Dynamics Channels are converging and mobile has a unique ability to serve shoppers who are researching products. Use of smartphones in store is highest in Brazil, with 92% of smartphone users conducting at least one activity while in store (Figure 9). Consumers in Mexico and Asia follow close behind with 90% and 86%, respectively, using their smartphone in store in some capacity. About two in three consumers in Europe and the U.S. use their smartphones in store. Becoming better informed is the driving force for in-store usage, and savvy consumers are taking advantage of the ability to secure the right information prior to purchasing. Revealing the price-conscious nature of the on-the-go flex shopper, the most common activity reported is comparing prices on their mobile phones while in store (about half of consumers in Asia, Brazil and Mexico, and just over a third of consumers in Europe and the U.S. do so). Other actions such as reading reviews and feedback followed by product details are also commonplace.
Retailers Begin to Leverage Mobile to Enhance Store Shopping
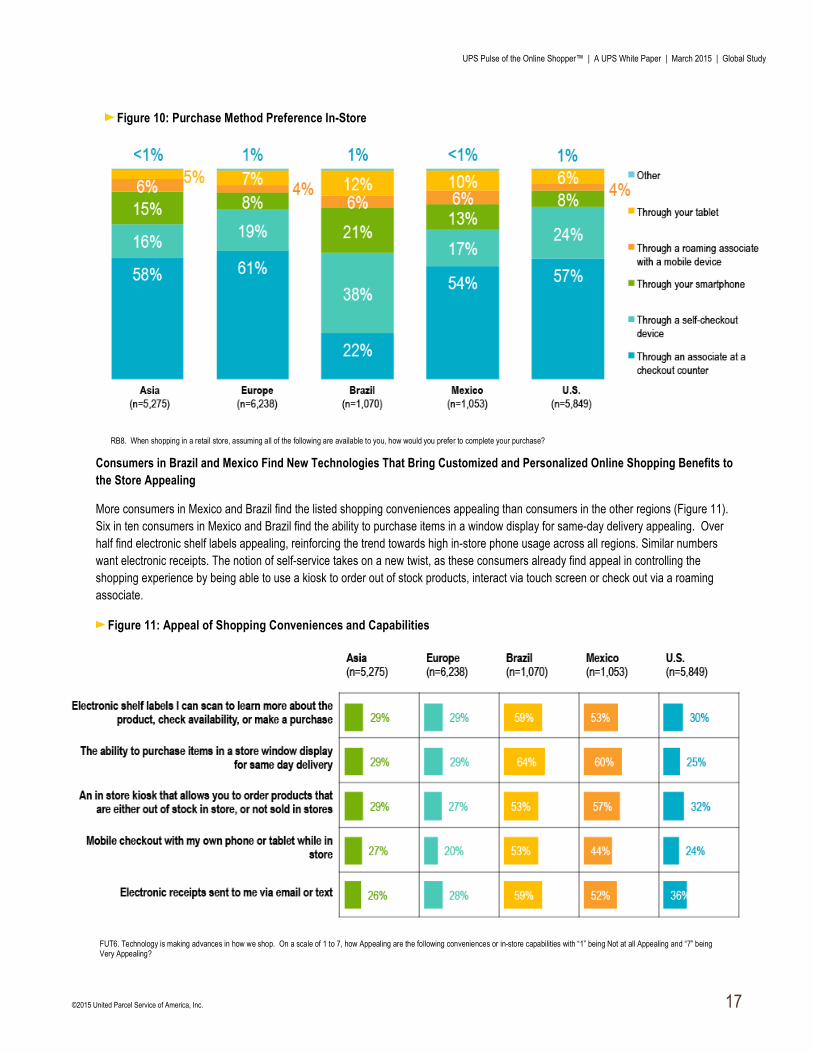
Technology enhancements frequently make for superior experiences, and retailers are taking notice. Checkout was first to get the attention of consumers, with many taking advantage of grocery self-checkout. More Brazil shoppers prefer to use their smartphone to check out (Figure 10), with one in five preferring this option, and an additional 12% in Brazil prefer to check out through their tablet -- for a total of 33% preferring to check out through a mobile device. Mexico is the next closest with 23% preferring a smartphone or tablet, and the U.S. has the lowest preference for this with only 14%.
Figure 9: Use of Smartphone In-Store, Among Smartphone Users
MOB4. When shopping in retail stores, how do you use your smartphone? Please select all that apply.
UPS Pulse of the Online Shopper™ | A UPS White Paper | March 2015 | Global Study
©2015 United Parcel Service of America, Inc. 17
Consumers in Brazil and Mexico Find New Technologies That Bring Customized and Personalized Online Shopping Benefits to the Store Appealing
More consumers in Mexico and Brazil find the listed shopping conveniences appealing than consumers in the other regions (Figure 11). Six in ten consumers in Mexico and Brazil find the ability to purchase items in a window display for same-day delivery appealing. Over half find electronic shelf labels appealing, reinforcing the trend towards high in-store phone usage across all regions. Similar numbers want electronic receipts. The notion of self-service takes on a new twist, as these consumers already find appeal in controlling the shopping experience by being able to use a kiosk to order out of stock products, interact via touch screen or check out via a roaming associate.
Figure 10: Purchase Method Preference In-Store
RB8. When shopping in a retail store, assuming all of the following are available to you, how would you prefer to complete your purchase?
Figure 11: Appeal of Shopping Conveniences and Capabilities
FUT6. Technology is making advances in how we shop. On a scale of 1 to 7, how Appealing are the following conveniences or in-store capabilities with “1” being Not at all Appealing and “7” being Very Appealing?
UPS Pulse of the Online Shopper™ | A UPS White Paper | March 2015 | Global Study
©2015 United Parcel Service of America, Inc. 18
D. Social Exerts Influence
It has been challenging for retailers to directly link social media exposure to product buying decisions. While consumers say that they are influenced by what they see on social media sites, the non-linear buying journey of the flex shopper makes it difficult to attribute the purchase to social media exposure. Positive and negative social media posts and reviews influence consumers; therefore, it is crucial for retailers to monitor and respond to these posts in order to protect their brand, attract new consumers and retain their current customer base.
Half of Online Shoppers Use Social Media to Make Purchase Decisions
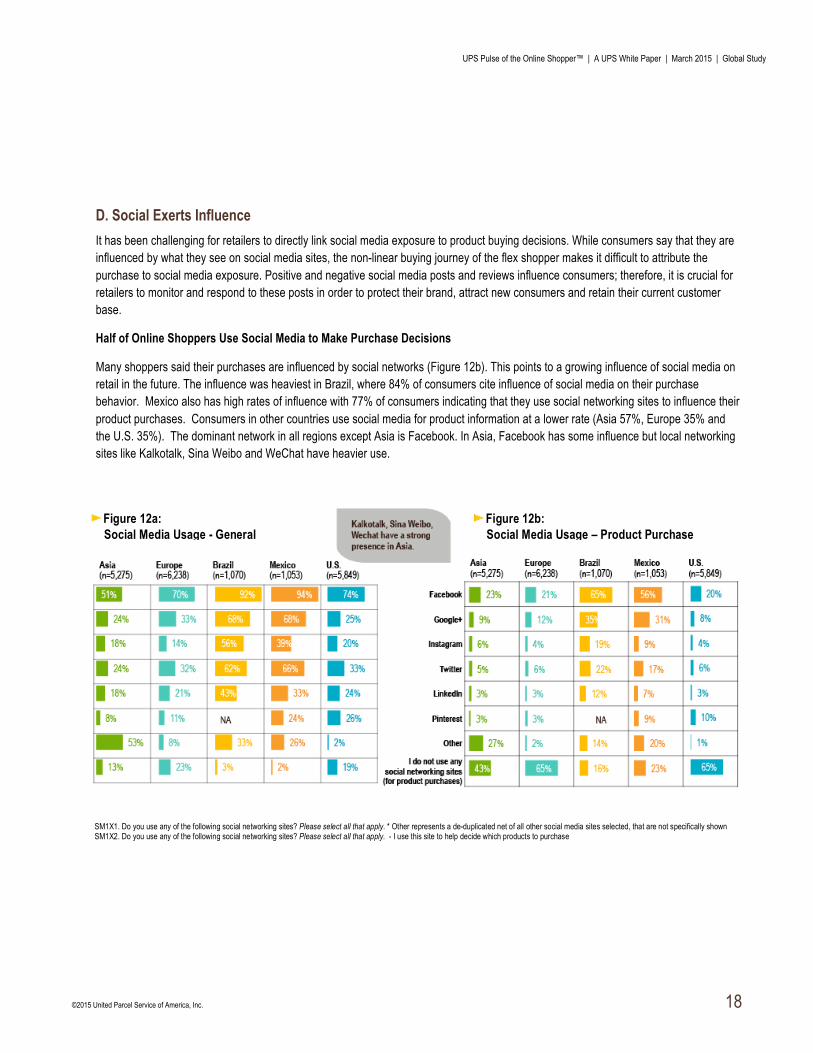
Many shoppers said their purchases are influenced by social networks (Figure 12b). This points to a growing influence of social media on retail in the future. The influence was heaviest in Brazil, where 84% of consumers cite influence of social media on their purchase behavior. Mexico also has high rates of influence with 77% of consumers indicating that they use social networking sites to influence their product purchases. Consumers in other countries use social media for product information at a lower rate (Asia 57%, Europe 35% and the U.S. 35%). The dominant network in all regions except Asia is Facebook. In Asia, Facebook has some influence but local networking sites like Kalkotalk, Sina Weibo and WeChat have heavier use.
SM1X1. Do you use any of the following social networking sites? Please select all that apply. * Other represents a de-duplicated net of all other social media sites selected, that are not specifically shown SM1X2. Do you use any of the following social networking sites? Please select all that apply. - I use this site to help decide which products to purchase
Figure 12a: Social Media Usage - General
Figure 12b: Social Media Usage – Product Purchase
UPS Pulse of the Online Shopper™ | A UPS White Paper | March 2015 | Global Study
©2015 United Parcel Service of America, Inc. 19
Social Media Extends Reach via Viral Means
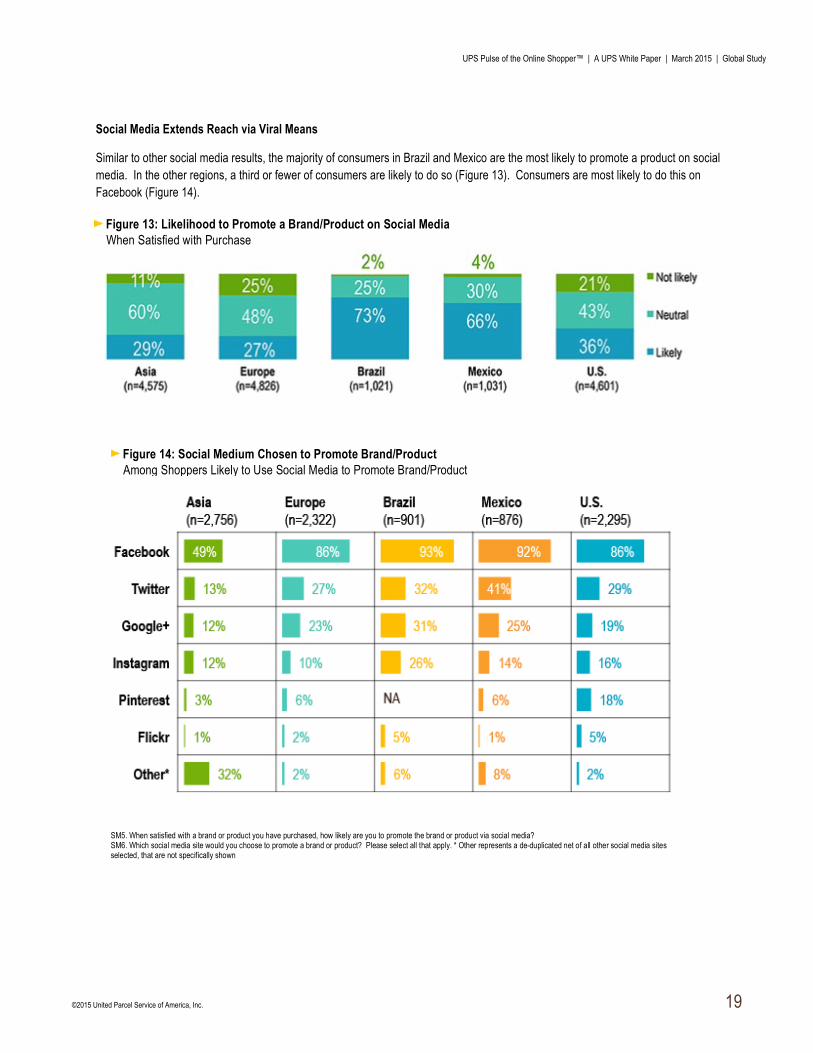
Similar to other social media results, the majority of consumers in Brazil and Mexico are the most likely to promote a product on social media. In the other regions, a third or fewer of consumers are likely to do so (Figure 13). Consumers are most likely to do this on Facebook (Figure 14).
Figure 13: Likelihood to Promote a Brand/Product on Social Media When Satisfied with Purchase
Figure 14: Social Medium Chosen to Promote Brand/Product Among Shoppers Likely to Use Social Media to Promote Brand/Product
SM5. When satisfied with a brand or product you have purchased, how likely are you to promote the brand or product via social media? SM6. Which social media site would you choose to promote a brand or product? Please select all that apply. * Other represents a de-duplicated net of all other social media sites selected, that are not specifically shown
UPS Pulse of the Online Shopper™ | A UPS White Paper | March 2015 | Global Study
©2015 United Parcel Service of America, Inc. 20
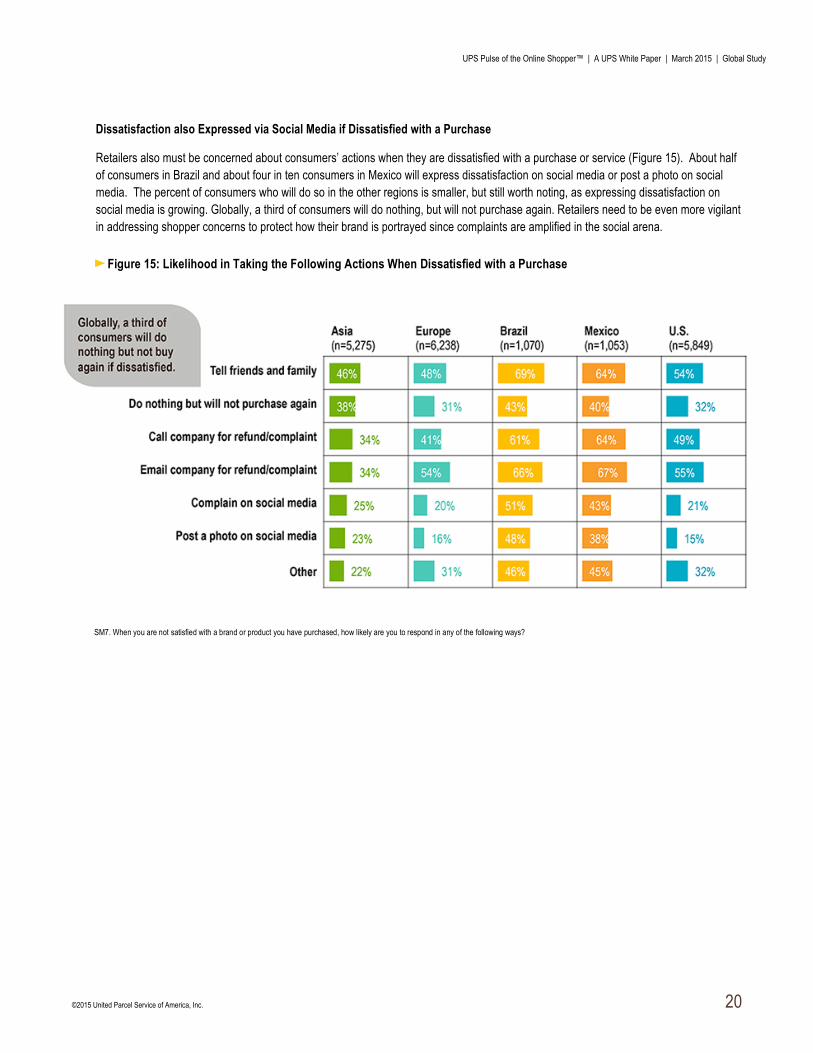
Dissatisfaction also Expressed via Social Media if Dissatisfied with a Purchase
Retailers also must be concerned about consumers’ actions when they are dissatisfied with a purchase or service (Figure 15). About half of consumers in Brazil and about four in ten consumers in Mexico will express dissatisfaction on social media or post a photo on social media. The percent of consumers who will do so in the other regions is smaller, but still worth noting, as expressing dissatisfaction on social media is growing. Globally, a third of consumers will do nothing, but will not purchase again. Retailers need to be even more vigilant in addressing shopper concerns to protect how their brand is portrayed since complaints are amplified in the social arena.
Figure 15: Likelihood in Taking the Following Actions When Dissatisfied with a Purchase
SM7. When you are not satisfied with a brand or product you have purchased, how likely are you to respond in any of the following ways?
UPS Pulse of the Online Shopper™ | A UPS White Paper | March 2015 | Global Study
©2015 United Parcel Service of America, Inc. 21
RETAIL WATCH: THE RETAIL LANDSCAPE The following suggestions should be assessed in the context of specific country and retailer needs, and adopted as appropriate.
MOBILE • Define the optimal user experience for mobile (smartphone and tablet) and build a roadmap to achieve those goals • Make sure emails render properly on all mobile devices • Leverage responsive site design to deliver a mobile-optimized experience • Review imagery needs and upgrade to ensure customers gain a clear view of the product to facilitate decision-
making • Evaluate the role of apps for your business (note: recent studies have revealed that having strong basic functions,
such as searching and purchasing products and easy checkout, is more critical than the latest technology feature)
STORES • For store-based retailers, explore the technology that can be deployed to educate, inspire and service the shopper
in store • Allow shoppers to have a choice in receipts (electronic, paper or both) • Utilize product locators online and in store to find inventory and deliver it to the customer • Be forward-thinking with POS (point of sale) systems and evaluate mobile tools
SOCIAL • Be creative in your marketing strategies to grow your social channels and utilize them to market, message and
merchandise to your fans • Monitor social media for both positive feedback and complaints and respond in a timely fashion • Encourage consumers to “Like” your brand through onsite placement and extended marketing efforts • Reward those who “Like” your brand with deals and offers
UPS Pulse of the Online Shopper™ | A UPS White Paper | March 2015 | Global Study
©2015 United Parcel Service of America, Inc. 22
III. The Path to Purchase: Expectations and Satisfaction
A. The Shopper and Their Mindset The Flex Shopper Covets Control and Convenience When Making Choices
Based on consumer expectations, retailers need to deliver exemplary customer experiences throughout the shopping journey (pre-purchase, purchase and post-purchase) to achieve superior levels of satisfaction, and logistics are an important part of that foundation. Satisfying today’s demanding shopper is no small feat, and successful retailers have learned, often through trial and error, how to provide the desired level of services sought by shoppers. Over the years, much research has been done around what is now coined “omnichannel,” where the value of a shopper who uses multiple channels is exponentially greater.
B. Pre-Shopping: Search and Browse Customer Satisfaction Scores Significantly Higher Online
This survey reflects the views of omnichannel shoppers – those who shop online and in store. In fact, cumulatively they report having made over half of recent purchases in store. Brazil consumers are an outlier, in that only 44% of their purchases are done in a physical store. Having the benefit of both online and in-store shopping experiences, over eight in ten of shoppers in Europe, Brazil, Mexico and the U.S. expressed satisfaction with the online shopping experience, while only 46% of Asia consumers were satisfied. In all regions consumers were more satisfied with the online shopping experience than with the physical store experience. Consumers continue to gravitate towards non-store channels, while expecting stores to evolve to meet their needs by integrating with online channels.
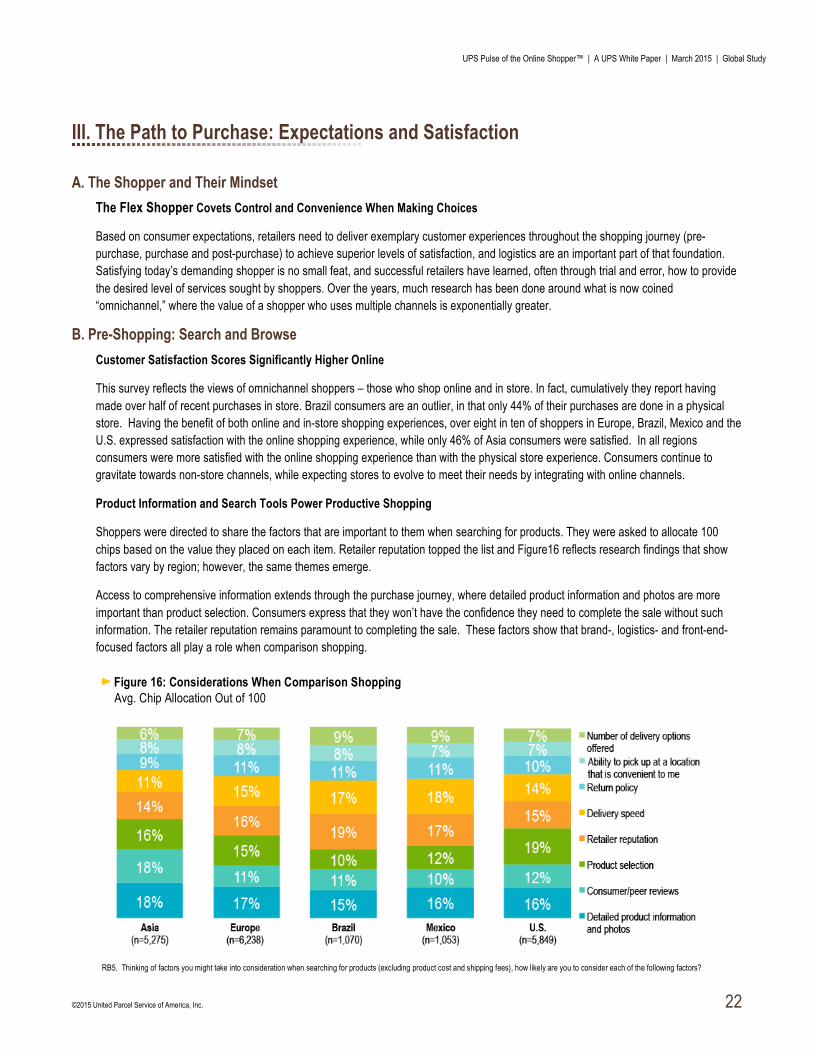
Product Information and Search Tools Power Productive Shopping
Shoppers were directed to share the factors that are important to them when searching for products. They were asked to allocate 100 chips based on the value they placed on each item. Retailer reputation topped the list and Figure16 reflects research findings that show factors vary by region; however, the same themes emerge.
Access to comprehensive information extends through the purchase journey, where detailed product information and photos are more important than product selection. Consumers express that they won’t have the confidence they need to complete the sale without such information. The retailer reputation remains paramount to completing the sale. These factors show that brand-, logistics- and front-end-focused factors all play a role when comparison shopping.
Figure 16: Considerations When Comparison Shopping Avg. Chip Allocation Out of 100
RB5. Thinking of factors you might take into consideration when searching for products (excluding product cost and shipping fees), how likely are you to consider each of the following factors?
UPS Pulse of the Online Shopper™ | A UPS White Paper | March 2015 | Global Study
©2015 United Parcel Service of America, Inc. 23
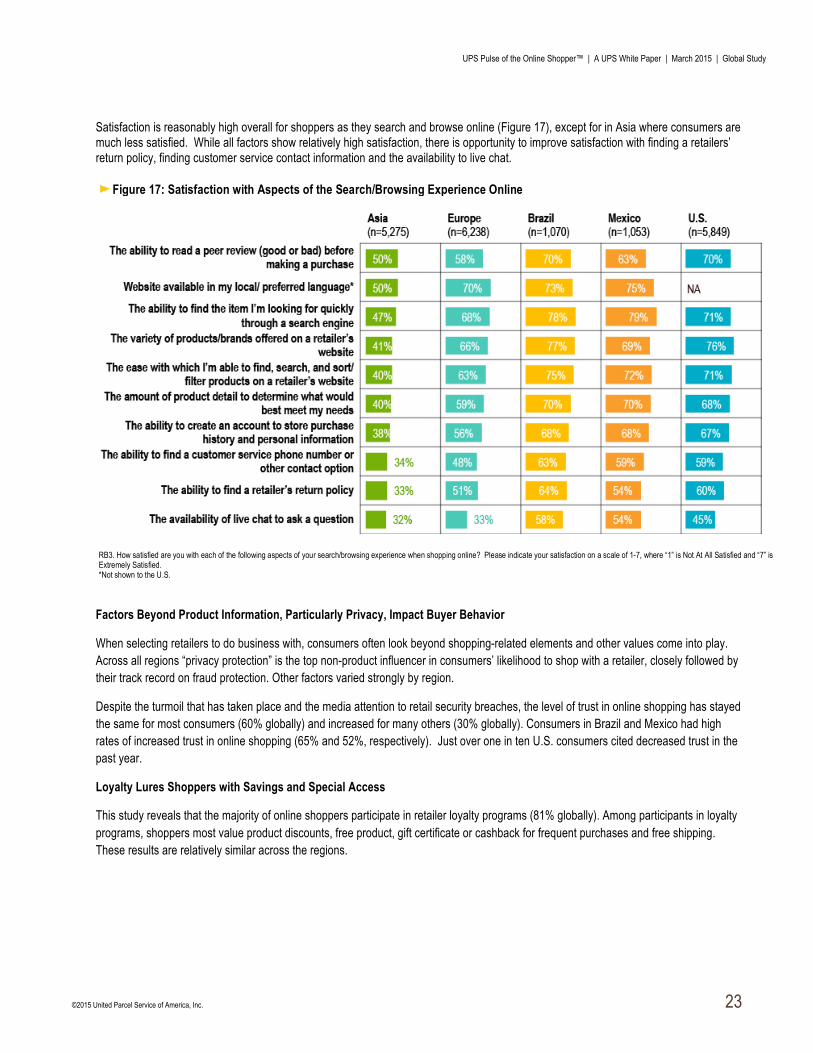
Satisfaction is reasonably high overall for shoppers as they search and browse online (Figure 17), except for in Asia where consumers are much less satisfied. While all factors show relatively high satisfaction, there is opportunity to improve satisfaction with finding a retailers’ return policy, finding customer service contact information and the availability to live chat.
Factors Beyond Product Information, Particularly Privacy, Impact Buyer Behavior
When selecting retailers to do business with, consumers often look beyond shopping-related elements and other values come into play. Across all regions “privacy protection” is the top non-product influencer in consumers’ likelihood to shop with a retailer, closely followed by their track record on fraud protection. Other factors varied strongly by region.
Despite the turmoil that has taken place and the media attention to retail security breaches, the level of trust in online shopping has stayed the same for most consumers (60% globally) and increased for many others (30% globally). Consumers in Brazil and Mexico had high rates of increased trust in online shopping (65% and 52%, respectively). Just over one in ten U.S. consumers cited decreased trust in the past year.
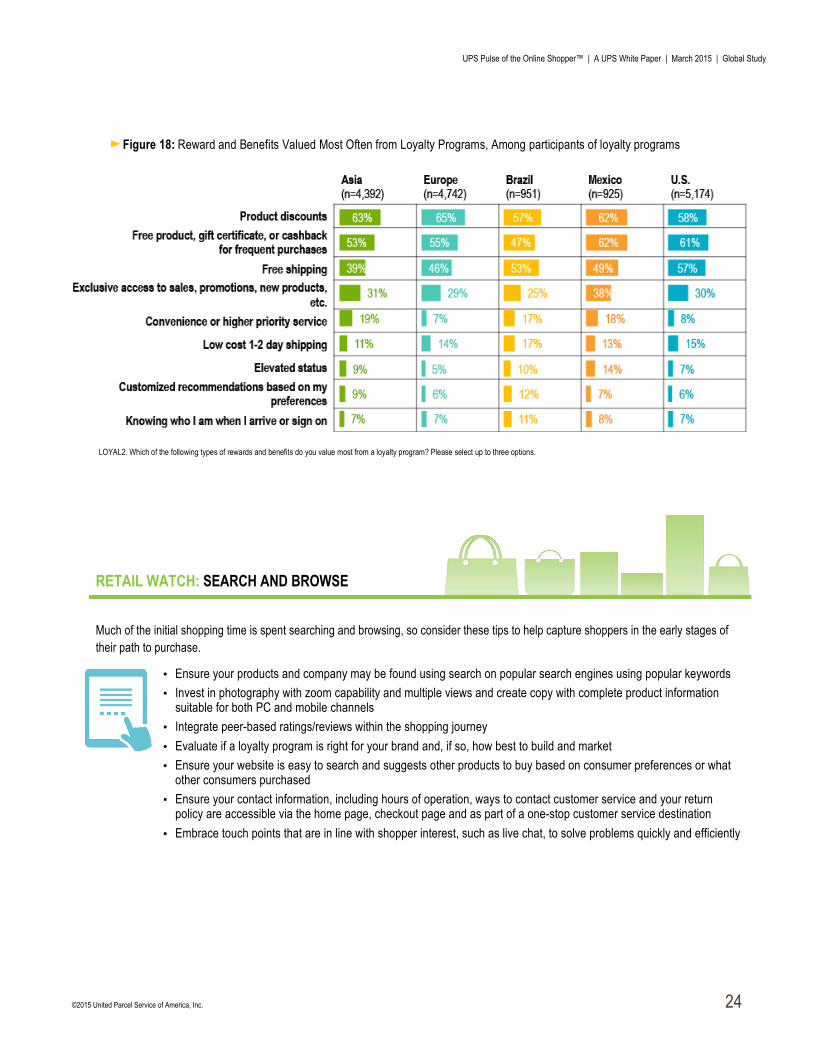
Loyalty Lures Shoppers with Savings and Special Access
This study reveals that the majority of online shoppers participate in retailer loyalty programs (81% globally). Among participants in loyalty programs, shoppers most value product discounts, free product, gift certificate or cashback for frequent purchases and free shipping. These results are relatively similar across the regions.
Figure 17: Satisfaction with Aspects of the Search/Browsing Experience Online
RB3. How satisfied are you with each of the following aspects of your search/browsing experience when shopping online? Please indicate your satisfaction on a scale of 1-7, where “1” is Not At All Satisfied and “7” is Extremely Satisfied. *Not shown to the U.S.
UPS Pulse of the Online Shopper™ | A UPS White Paper | March 2015 | Global Study
©2015 United Parcel Service of America, Inc. 24
RETAIL WATCH: SEARCH AND BROWSE
Much of the initial shopping time is spent searching and browsing, so consider these tips to help capture shoppers in the early stages of their path to purchase.
• Ensure your products and company may be found using search on popular search engines using popular keywords • Invest in photography with zoom capability and multiple views and create copy with complete product information
suitable for both PC and mobile channels • Integrate peer-based ratings/reviews within the shopping journey • Evaluate if a loyalty program is right for your brand and, if so, how best to build and market • Ensure your website is easy to search and suggests other products to buy based on consumer preferences or what
other consumers purchased • Ensure your contact information, including hours of operation, ways to contact customer service and your return
policy are accessible via the home page, checkout page and as part of a one-stop customer service destination • Embrace touch points that are in line with shopper interest, such as live chat, to solve problems quickly and efficiently
Figure 18: Reward and Benefits Valued Most Often from Loyalty Programs, Among participants of loyalty programs
LOYAL2. Which of the following types of rewards and benefits do you value most from a loyalty program? Please select up to three options.
UPS Pulse of the Online Shopper™ | A UPS White Paper | March 2015 | Global Study
©2015 United Parcel Service of America, Inc. 25
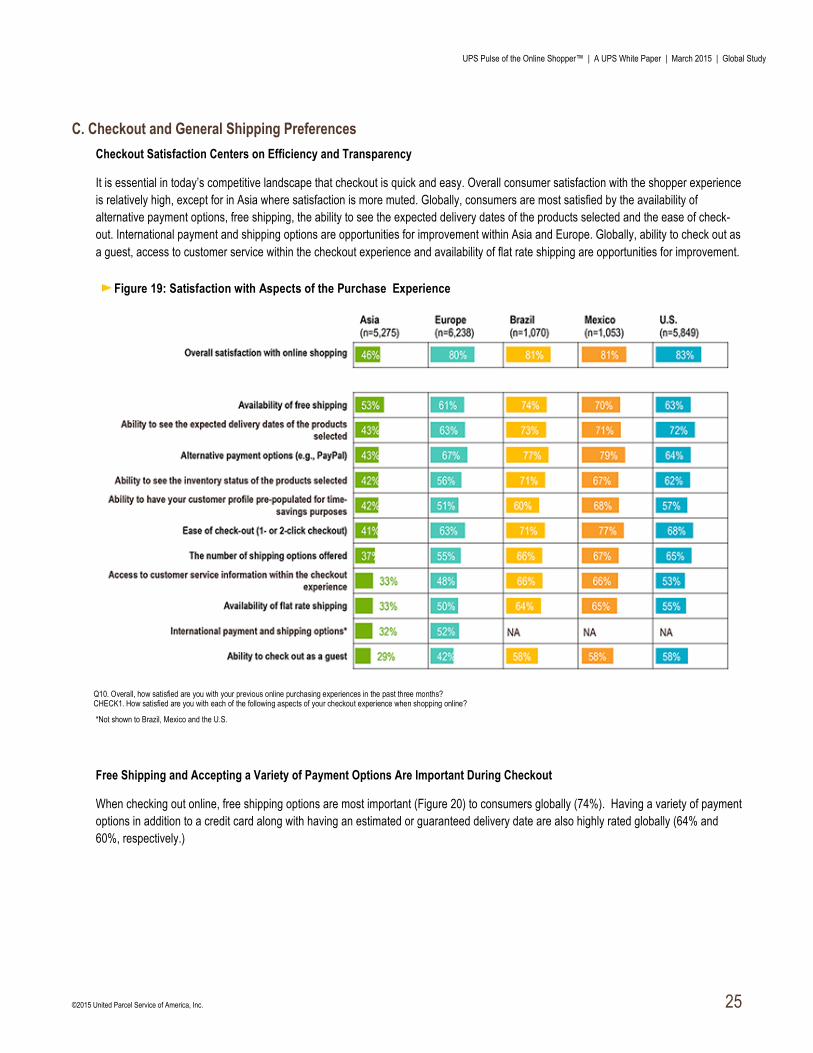
C. Checkout and General Shipping Preferences Checkout Satisfaction Centers on Efficiency and Transparency
It is essential in today’s competitive landscape that checkout is quick and easy. Overall consumer satisfaction with the shopper experience is relatively high, except for in Asia where satisfaction is more muted. Globally, consumers are most satisfied by the availability of alternative payment options, free shipping, the ability to see the expected delivery dates of the products selected and the ease of check-out. International payment and shipping options are opportunities for improvement within Asia and Europe. Globally, ability to check out as a guest, access to customer service within the checkout experience and availability of flat rate shipping are opportunities for improvement.
*Not shown to Brazil, Mexico and the U.S.
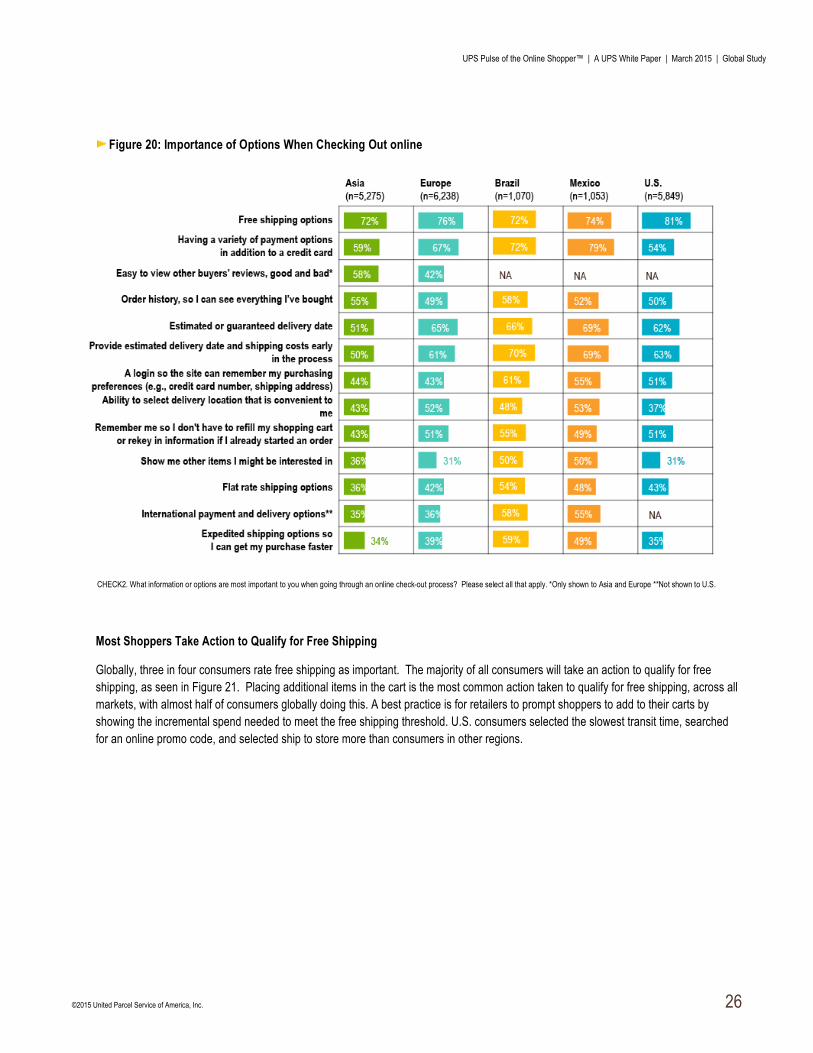
Free Shipping and Accepting a Variety of Payment Options Are Important During Checkout
When checking out online, free shipping options are most important (Figure 20) to consumers globally (74%). Having a variety of payment options in addition to a credit card along with having an estimated or guaranteed delivery date are also highly rated globally (64% and 60%, respectively.)
Figure 19: Satisfaction with Aspects of the Purchase Experience
Q10. Overall, how satisfied are you with your previous online purchasing experiences in the past three months? CHECK1. How satisfied are you with each of the following aspects of your checkout experience when shopping online?
UPS Pulse of the Online Shopper™ | A UPS White Paper | March 2015 | Global Study
©2015 United Parcel Service of America, Inc. 26
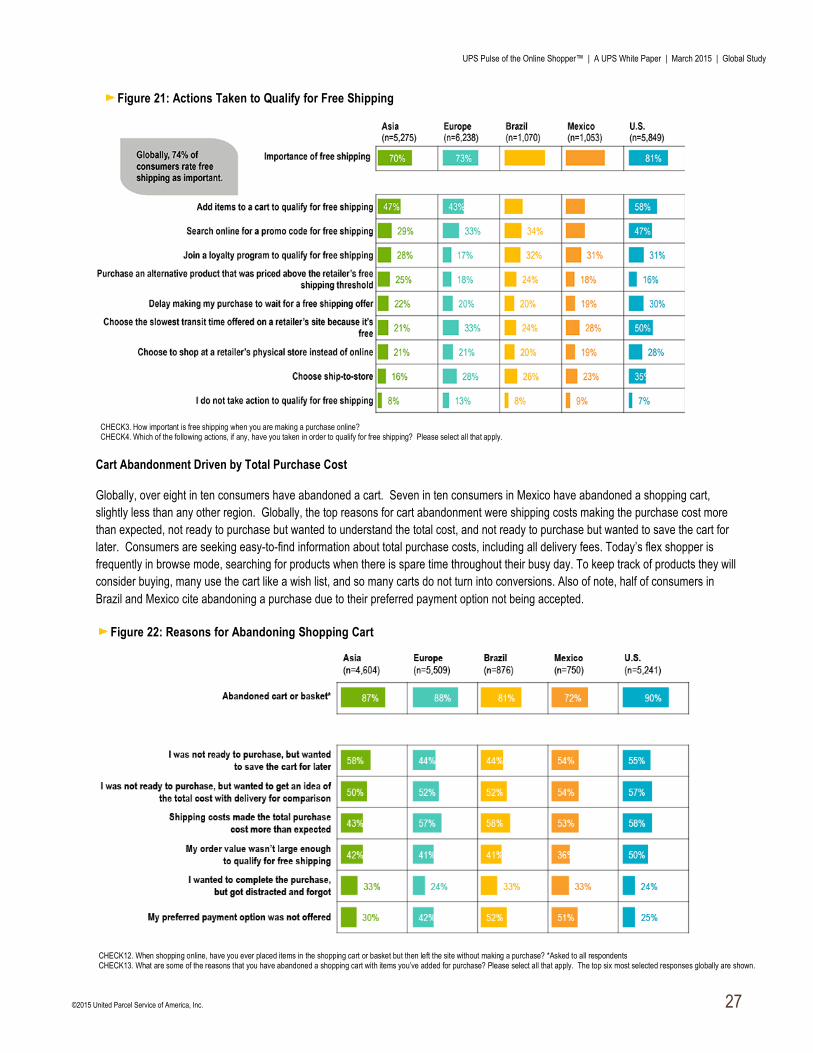
Most Shoppers Take Action to Qualify for Free Shipping
Globally, three in four consumers rate free shipping as important. The majority of all consumers will take an action to qualify for free shipping, as seen in Figure 21. Placing additional items in the cart is the most common action taken to qualify for free shipping, across all markets, with almost half of consumers globally doing this. A best practice is for retailers to prompt shoppers to add to their carts by showing the incremental spend needed to meet the free shipping threshold. U.S. consumers selected the slowest transit time, searched for an online promo code, and selected ship to store more than consumers in other regions.
Figure 20: Importance of Options When Checking Out online
CHECK2. What information or options are most important to you when going through an online check-out process? Please select all that apply. *Only shown to Asia and Europe **Not shown to U.S.
UPS Pulse of the Online Shopper™ | A UPS White Paper | March 2015 | Global Study
©2015 United Parcel Service of America, Inc. 27
Cart Abandonment Driven by Total Purchase Cost
Globally, over eight in ten consumers have abandoned a cart. Seven in ten consumers in Mexico have abandoned a shopping cart, slightly less than any other region. Globally, the top reasons for cart abandonment were shipping costs making the purchase cost more than expected, not ready to purchase but wanted to understand the total cost, and not ready to purchase but wanted to save the cart for later. Consumers are seeking easy-to-find information about total purchase costs, including all delivery fees. Today’s flex shopper is frequently in browse mode, searching for products when there is spare time throughout their busy day. To keep track of products they will consider buying, many use the cart like a wish list, and so many carts do not turn into conversions. Also of note, half of consumers in Brazil and Mexico cite abandoning a purchase due to their preferred payment option not being accepted.
Figure 21: Actions Taken to Qualify for Free Shipping
CHECK3. How important is free shipping when you are making a purchase online? CHECK4. Which of the following actions, if any, have you taken in order to qualify for free shipping? Please select all that apply.
Figure 22: Reasons for Abandoning Shopping Cart
CHECK12. When shopping online, have you ever placed items in the shopping cart or basket but then left the site without making a purchase? *Asked to all respondents CHECK13. What are some of the reasons that you have abandoned a shopping cart with items you’ve added for purchase? Please select all that apply. The top six most selected responses globally are shown.
UPS Pulse of the Online Shopper™ | A UPS White Paper | March 2015 | Global Study
©2015 United Parcel Service of America, Inc. 28
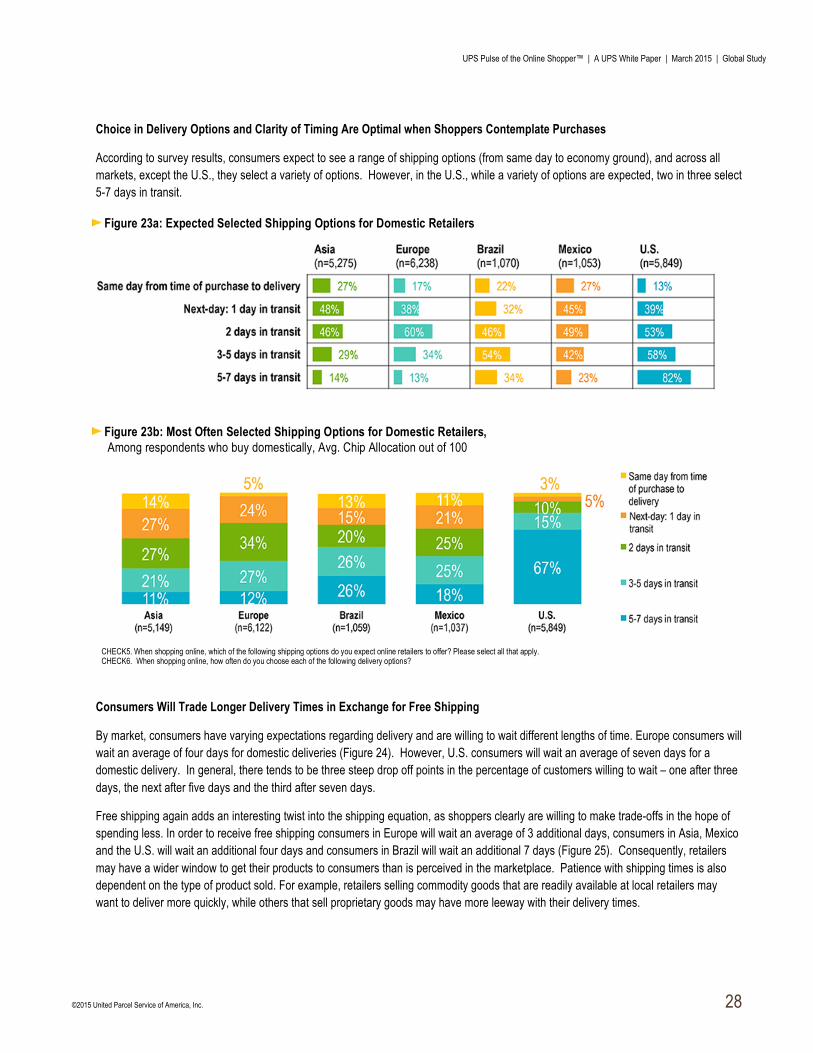
Choice in Delivery Options and Clarity of Timing Are Optimal when Shoppers Contemplate Purchases
According to survey results, consumers expect to see a range of shipping options (from same day to economy ground), and across all markets, except the U.S., they select a variety of options. However, in the U.S., while a variety of options are expected, two in three select 5-7 days in transit.
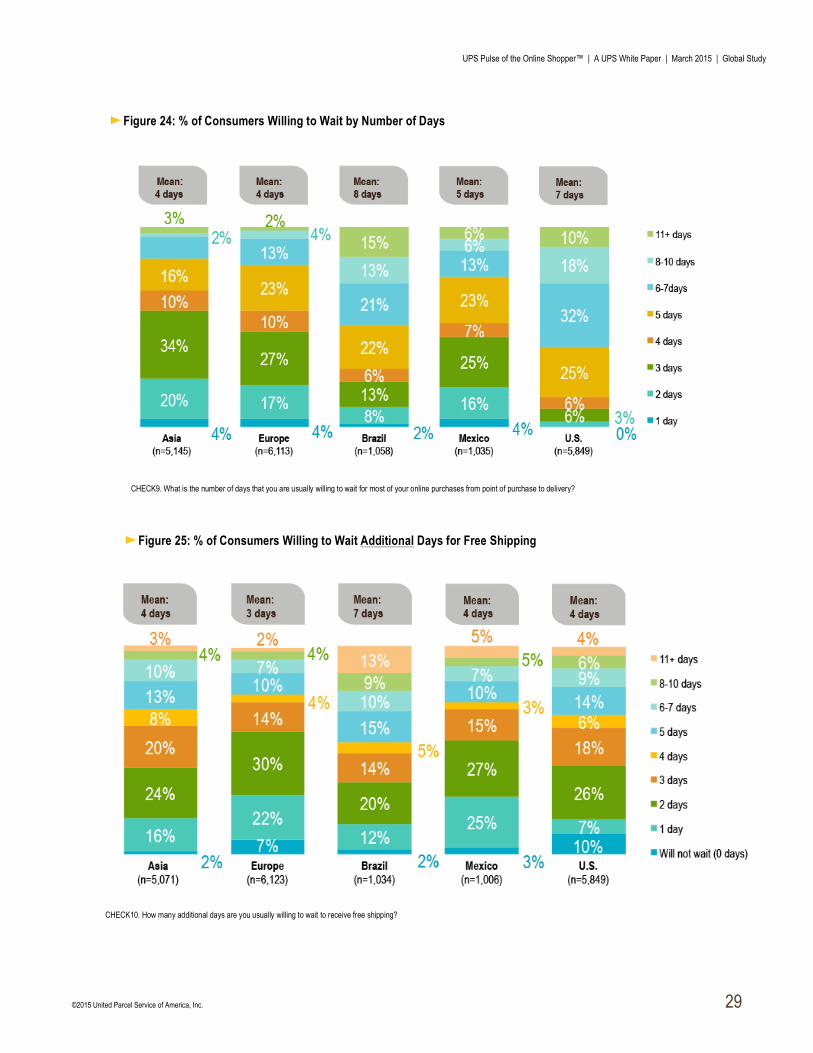
Consumers Will Trade Longer Delivery Times in Exchange for Free Shipping
By market, consumers have varying expectations regarding delivery and are willing to wait different lengths of time. Europe consumers will wait an average of four days for domestic deliveries (Figure 24). However, U.S. consumers will wait an average of seven days for a domestic delivery. In general, there tends to be three steep drop off points in the percentage of customers willing to wait – one after three days, the next after five days and the third after seven days.
Free shipping again adds an interesting twist into the shipping equation, as shoppers clearly are willing to make trade-offs in the hope of spending less. In order to receive free shipping consumers in Europe will wait an average of 3 additional days, consumers in Asia, Mexico and the U.S. will wait an additional four days and consumers in Brazil will wait an additional 7 days (Figure 25). Consequently, retailers may have a wider window to get their products to consumers than is perceived in the marketplace. Patience with shipping times is also dependent on the type of product sold. For example, retailers selling commodity goods that are readily available at local retailers may want to deliver more quickly, while others that sell proprietary goods may have more leeway with their delivery times.
Figure 23a: Expected Selected Shipping Options for Domestic Retailers
Figure 23b: Most Often Selected Shipping Options for Domestic Retailers, Among respondents who buy domestically, Avg. Chip Allocation out of 100
CHECK5. When shopping online, which of the following shipping options do you expect online retailers to offer? Please select all that apply. CHECK6. When shopping online, how often do you choose each of the following delivery options?
UPS Pulse of the Online Shopper™ | A UPS White Paper | March 2015 | Global Study
©2015 United Parcel Service of America, Inc. 29
Figure 24: % of Consumers Willing to Wait by Number of Days
CHECK9. What is the number of days that you are usually willing to wait for most of your online purchases from point of purchase to delivery?
Figure 25: % of Consumers Willing to Wait Additional Days for Free Shipping
CHECK10. How many additional days are you usually willing to wait to receive free shipping?
UPS Pulse of the Online Shopper™ | A UPS White Paper | March 2015 | Global Study
©2015 United Parcel Service of America, Inc. 30
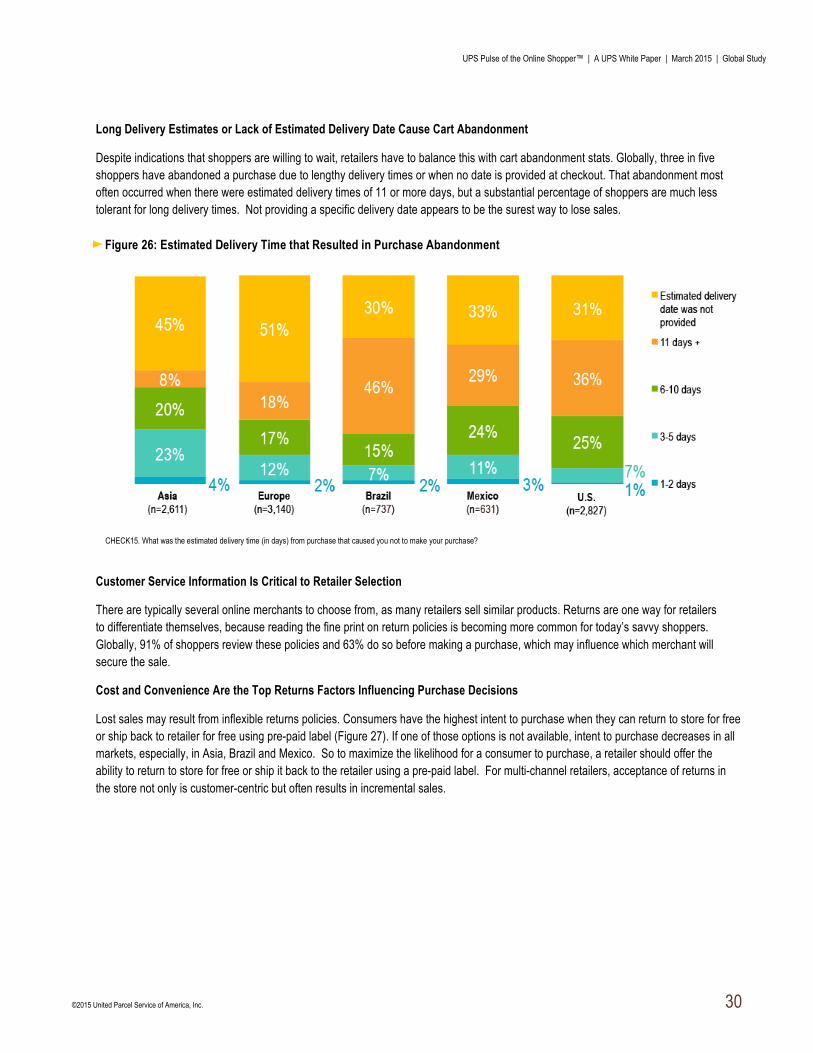
Long Delivery Estimates or Lack of Estimated Delivery Date Cause Cart Abandonment
Despite indications that shoppers are willing to wait, retailers have to balance this with cart abandonment stats. Globally, three in five shoppers have abandoned a purchase due to lengthy delivery times or when no date is provided at checkout. That abandonment most often occurred when there were estimated delivery times of 11 or more days, but a substantial percentage of shoppers are much less tolerant for long delivery times. Not providing a specific delivery date appears to be the surest way to lose sales.
Customer Service Information Is Critical to Retailer Selection
There are typically several online merchants to choose from, as many retailers sell similar products. Returns are one way for retailers to differentiate themselves, because reading the fine print on return policies is becoming more common for today’s savvy shoppers. Globally, 91% of shoppers review these policies and 63% do so before making a purchase, which may influence which merchant will secure the sale.
Cost and Convenience Are the Top Returns Factors Influencing Purchase Decisions
Lost sales may result from inflexible returns policies. Consumers have the highest intent to purchase when they can return to store for free or ship back to retailer for free using pre-paid label (Figure 27). If one of those options is not available, intent to purchase decreases in all markets, especially, in Asia, Brazil and Mexico. So to maximize the likelihood for a consumer to purchase, a retailer should offer the ability to return to store for free or ship it back to the retailer using a pre-paid label. For multi-channel retailers, acceptance of returns in the store not only is customer-centric but often results in incremental sales.
Figure 26: Estimated Delivery Time that Resulted in Purchase Abandonment
CHECK15. What was the estimated delivery time (in days) from purchase that caused you not to make your purchase?
UPS Pulse of the Online Shopper™ | A UPS White Paper | March 2015 | Global Study
©2015 United Parcel Service of America, Inc. 31
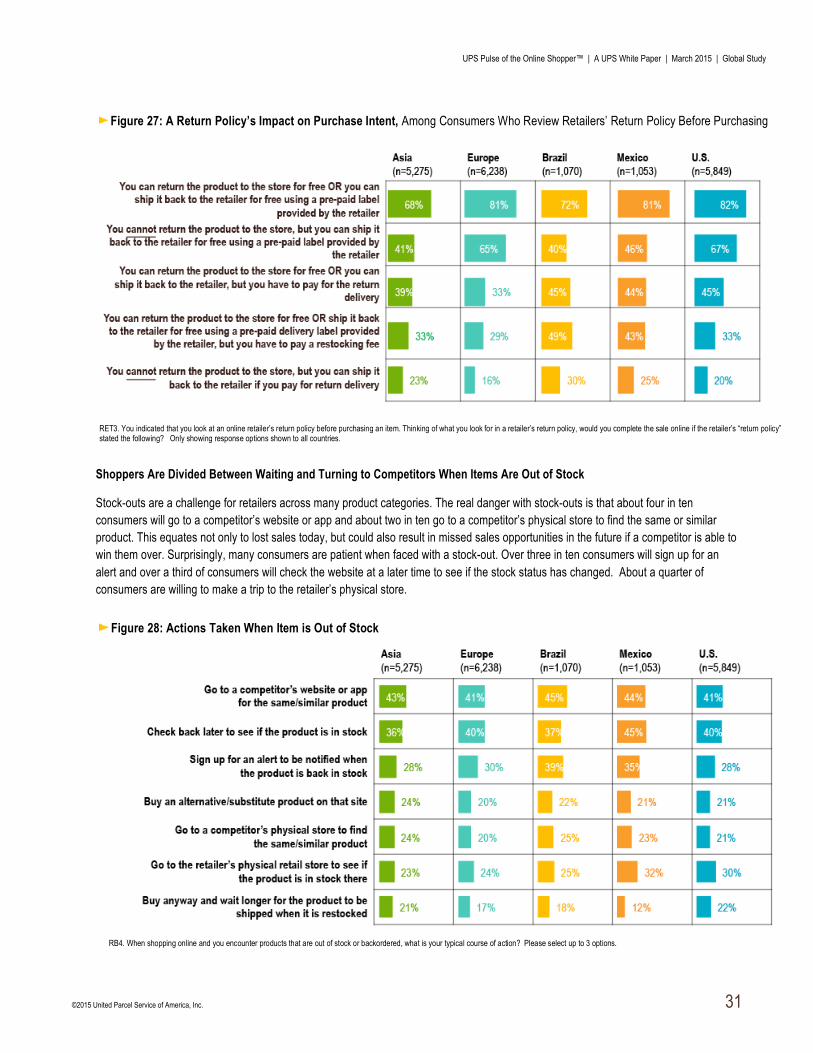
Shoppers Are Divided Between Waiting and Turning to Competitors When Items Are Out of Stock
Stock-outs are a challenge for retailers across many product categories. The real danger with stock-outs is that about four in ten consumers will go to a competitor’s website or app and about two in ten go to a competitor’s physical store to find the same or similar product. This equates not only to lost sales today, but could also result in missed sales opportunities in the future if a competitor is able to win them over. Surprisingly, many consumers are patient when faced with a stock-out. Over three in ten consumers will sign up for an alert and over a third of consumers will check the website at a later time to see if the stock status has changed. About a quarter of consumers are willing to make a trip to the retailer’s physical store.
Figure 27: A Return Policy’s Impact on Purchase Intent, Among Consumers Who Review Retailers’ Return Policy Before Purchasing
RET3. You indicated that you look at an online retailer’s return policy before purchasing an item. Thinking of what you look for in a retailer’s return policy, would you complete the sale online if the retailer’s “return policy” stated the following? Only showing response options shown to all countries.
Figure 28: Actions Taken When Item is Out of Stock
RB4. When shopping online and you encounter products that are out of stock or backordered, what is your typical course of action? Please select up to 3 options.
UPS Pulse of the Online Shopper™ | A UPS White Paper | March 2015 | Global Study
©2015 United Parcel Service of America, Inc. 32
RETAIL WATCH: CHECKOUT AND GENERAL SHIPPING PREFERENCES
The final step in the process is integral to securing the sale, so careful consideration in customer service and policies at this juncture are advisable. The following suggestions should be assessed in the context of specific country and retailer needs, and adopted as appropriate.
CUSTOMER SERVICE • Review return policies for clarity and access throughout the site and via post-order communication • Integrate “Shop with Confidence” messaging within the all-important shopping cart that includes phone number,
return policies and contact touch points • Highlight contact phone numbers and links to touch points like live chat onsite
SHIPPING • Show total shipping costs early in the process based on the customer’s location • Offer choices in terms of shipping options to accommodate shopper needs • Invest in logistics to provide faster, more efficient options
FREE SHIPPING • Understand the patterns that matter and how long shoppers are willing to wait for free shipping • Monitor your free shipping model and understand time frames to receive products while staying keenly aware of the
competitive landscape • Assess whether you can absorb these costs as a marketing expense and what strategies will be put in place to
preserve desired margin yet still remain competitive
RETURNS • Reread your current returns policy to ensure it is clear, concise and customer-centric • Position the policy in your customer service page as well as in the shopping cart to avert abandonment • Assess whether supporting free returns is viable where retailers cover the cost of shipping the product back • Consider including a return label in the box, or at a minimum make it convenient for shoppers to print a return label
right from your website
STOCK-OUTS • Make shoppers aware of the status of products at both the product page and shopping cart stages • Put in place tools, such as email when stock comes available, to capture the sale • Invest in smart inventory and fulfillment strategies to minimize stock-outs
UPS Pulse of the Online Shopper™ | A UPS White Paper | March 2015 | Global Study
©2015 United Parcel Service of America, Inc. 33
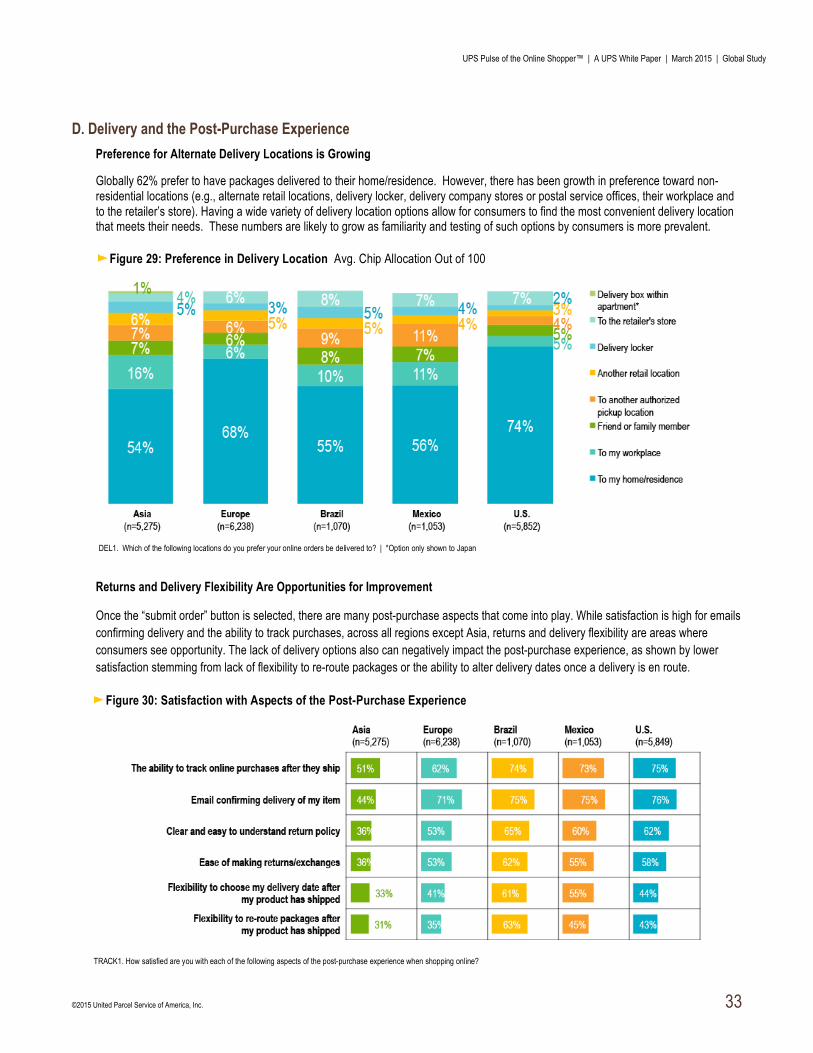
D. Delivery and the Post-Purchase Experience Preference for Alternate Delivery Locations is Growing
Globally 62% prefer to have packages delivered to their home/residence. However, there has been growth in preference toward non-residential locations (e.g., alternate retail locations, delivery locker, delivery company stores or postal service offices, their workplace and to the retailer’s store). Having a wide variety of delivery location options allow for consumers to find the most convenient delivery location that meets their needs. These numbers are likely to grow as familiarity and testing of such options by consumers is more prevalent.
Returns and Delivery Flexibility Are Opportunities for Improvement
Once the “submit order” button is selected, there are many post-purchase aspects that come into play. While satisfaction is high for emails confirming delivery and the ability to track purchases, across all regions except Asia, returns and delivery flexibility are areas where consumers see opportunity. The lack of delivery options also can negatively impact the post-purchase experience, as shown by lower satisfaction stemming from lack of flexibility to re-route packages or the ability to alter delivery dates once a delivery is en route.
Figure 29: Preference in Delivery Location Avg. Chip Allocation Out of 100
DEL1. Which of the following locations do you prefer your online orders be delivered to? | *Option only shown to Japan
Figure 30: Satisfaction with Aspects of the Post-Purchase Experience
TRACK1. How satisfied are you with each of the following aspects of the post-purchase experience when shopping online?
UPS Pulse of the Online Shopper™ | A UPS White Paper | March 2015 | Global Study
©2015 United Parcel Service of America, Inc. 34
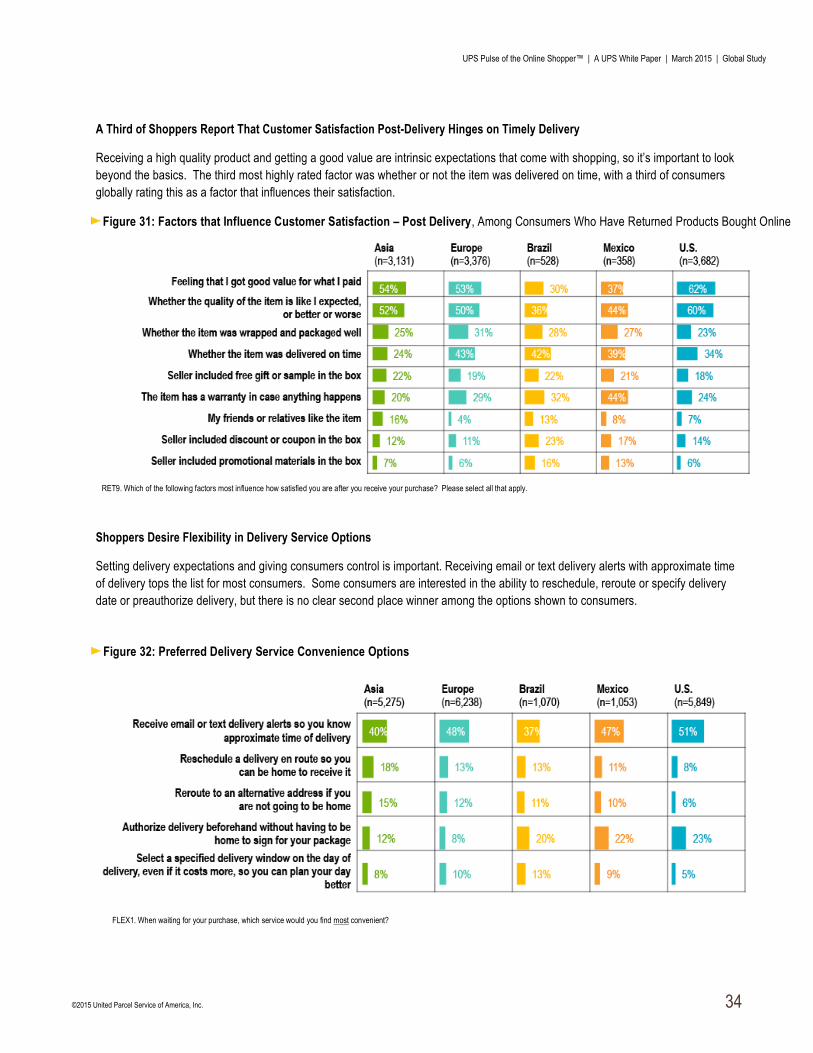
A Third of Shoppers Report That Customer Satisfaction Post-Delivery Hinges on Timely Delivery
Receiving a high quality product and getting a good value are intrinsic expectations that come with shopping, so it’s important to look beyond the basics. The third most highly rated factor was whether or not the item was delivered on time, with a third of consumers globally rating this as a factor that influences their satisfaction.
Shoppers Desire Flexibility in Delivery Service Options
Setting delivery expectations and giving consumers control is important. Receiving email or text delivery alerts with approximate time of delivery tops the list for most consumers. Some consumers are interested in the ability to reschedule, reroute or specify delivery date or preauthorize delivery, but there is no clear second place winner among the options shown to consumers.
Figure 31: Factors that Influence Customer Satisfaction – Post Delivery, Among Consumers Who Have Returned Products Bought Online
RET9. Which of the following factors most influence how satisfied you are after you receive your purchase? Please select all that apply.
Figure 32: Preferred Delivery Service Convenience Options
FLEX1. When waiting for your purchase, which service would you find most convenient?
UPS Pulse of the Online Shopper™ | A UPS White Paper | March 2015 | Global Study
©2015 United Parcel Service of America, Inc. 35
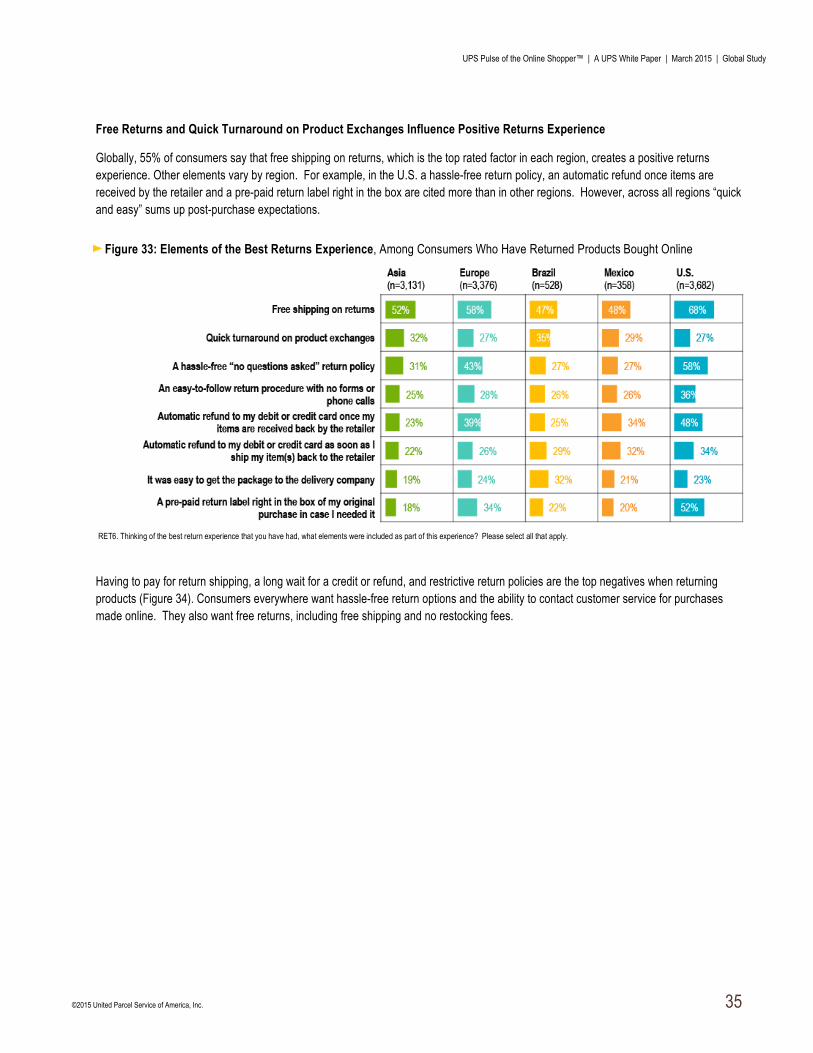
Free Returns and Quick Turnaround on Product Exchanges Influence Positive Returns Experience
Globally, 55% of consumers say that free shipping on returns, which is the top rated factor in each region, creates a positive returns experience. Other elements vary by region. For example, in the U.S. a hassle-free return policy, an automatic refund once items are received by the retailer and a pre-paid return label right in the box are cited more than in other regions. However, across all regions “quick and easy” sums up post-purchase expectations.
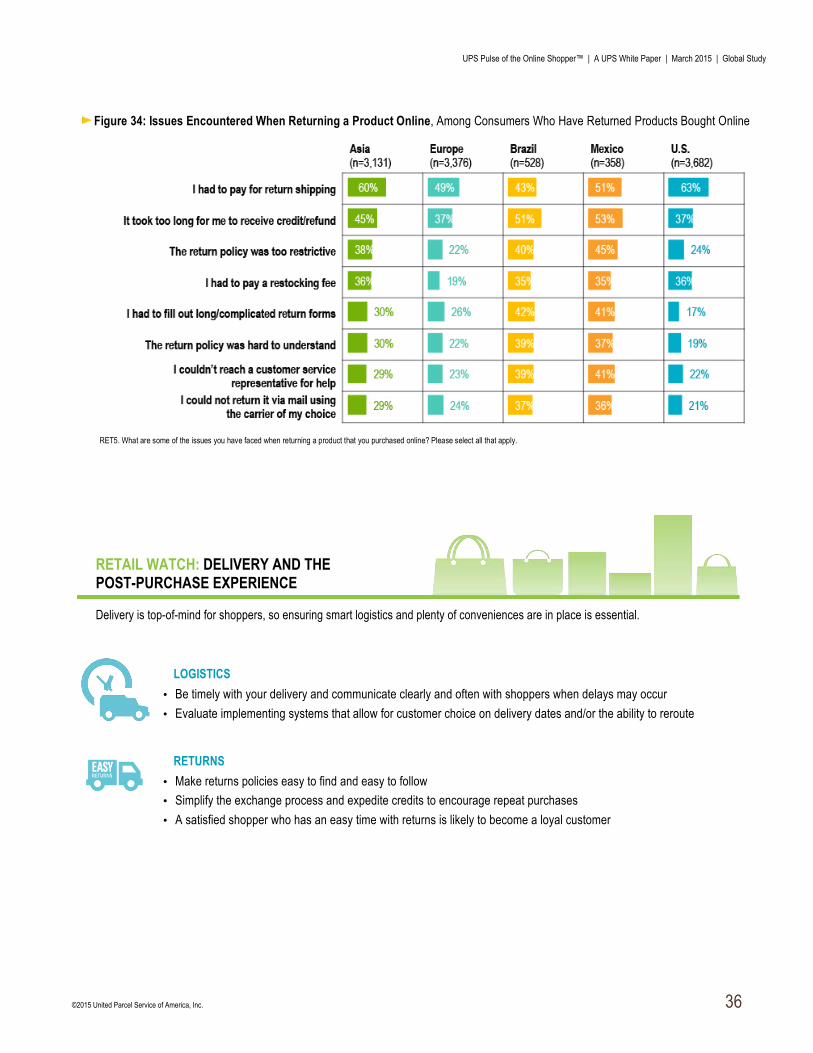
Having to pay for return shipping, a long wait for a credit or refund, and restrictive return policies are the top negatives when returning products (Figure 34). Consumers everywhere want hassle-free return options and the ability to contact customer service for purchases made online. They also want free returns, including free shipping and no restocking fees.
Figure 33: Elements of the Best Returns Experience, Among Consumers Who Have Returned Products Bought Online
RET6. Thinking of the best return experience that you have had, what elements were included as part of this experience? Please select all that apply.
UPS Pulse of the Online Shopper™ | A UPS White Paper | March 2015 | Global Study
©2015 United Parcel Service of America, Inc. 36
RETAIL WATCH: DELIVERY AND THE POST-PURCHASE EXPERIENCE
Delivery is top-of-mind for shoppers, so ensuring smart logistics and plenty of conveniences are in place is essential.
LOGISTICS • Be timely with your delivery and communicate clearly and often with shoppers when delays may occur • Evaluate implementing systems that allow for customer choice on delivery dates and/or the ability to reroute
RETURNS • Make returns policies easy to find and easy to follow • Simplify the exchange process and expedite credits to encourage repeat purchases • A satisfied shopper who has an easy time with returns is likely to become a loyal customer
Figure 34: Issues Encountered When Returning a Product Online, Among Consumers Who Have Returned Products Bought Online
RET5. What are some of the issues you have faced when returning a product that you purchased online? Please select all that apply.
UPS Pulse of the Online Shopper™ | A UPS White Paper | March 2015 | Global Study
©2015 United Parcel Service of America, Inc. 37
IV. Conclusion A. The Flex Shopper is Changing the Retail World
Shoppers everywhere are hungry for convenience on their own terms. Choice continues to be paramount to global shopping behavior as consumers navigate among channels and devices. They want to be in control of everything -- from retailer selection and product reviews to delivery options and returns.
Today’s shoppers expect to be able to seamlessly shift from one channel and device to the next. The online shopping population within each region worldwide, and even within each country, has varying levels of device adoption and technological sophistication that drives their shopping habits and preferences. As expected, Asia shoppers lead the world in tech adoption, while Mexico and Brazil fall slightly behind, followed by the U.S. and Europe.
Mobile is often the catalyst fueling heightened omnichannel expectations along the customer journey. Mobile has become indispensable -- from researching products in advance of store visits and previewing retail email, to hunting down the best price and checking on delivery status.
Stores are still core to the shopping experience, particularly in some regions (Mexico and U.S., for example). Checking for inventory availability and store information via mobile serves as the bridge to the store visit. Use of mobile devices when visiting the store has also become commonplace as consumers access product reviews and price check, gaining confidence along the way that they are making the right purchase. Then, mobile is used to verify delivery status for home or in-store pickup.
Retailers face significant pressure to ACT on the global shopping behavior. While in the past, retailers had the luxury of optimizing each channel on its own, the challenge today lies in making sure the channels are well integrated. Inventory transparency will form the foundation of many cross-channel efforts. Investments will be forthcoming that foster consistency of marketing and customer experience across channels.
The future of the store will most certainly involve mobile as well. Line-busting checkout via handheld devices, Wi-Fi access storewide and associate-aided, tablet-based selling may be the new standard in a few short years. Though change won’t happen overnight, prioritizing initiatives that ensure consistency across every touch point is a must-do to engage the global flex shopper.
UPS Pulse of the Online Shopper™ | A UPS White Paper | March 2015 | Global Study
©2015 United Parcel Service of America, Inc. 38
About comScore, Inc.
comScore, Inc. (NASDAQ: SCOR). Through its Audience Analytics, Advertising Analytics, and Enterprise Analytics product suites, comScore provides its clients with a variety of on-demand software, real-time analytics and custom solutions to succeed in a multi-platform world. The proprietary comScore Census Network™ (CCN) leverages a world-class technology infrastructure to capture trillions of digital interactions a month and power big data analytics on a global scale for its more than 2,000 clients.
About UPS
UPS (NYSE: UPS) is a global leader in logistics, offering a broad range of solutions for the transportation of packages and freight, including innovative delivery options for the global consumer market; the facilitation of international trade; and the deployment of advanced technology to more efficiently manage the world of business. Headquartered in Atlanta, Georgia, UPS serves more than 220 countries and territories worldwide.
For more information, please contact:
Susan Engleson Bala Ganesh comScore, Inc. UPS 703-234-2625 404-828-6988 [email protected] [email protected]