Embed Size (px)
Citation preview
A Customer Experience Study
A UPS CONSULTATION PAPER | SEPTEMBER 2013
GLOBAL STUDY
Conducted by
Contents
Welcome to the UPS Pulse of the Online Shopper™ Global Study ........................................................... 3
Methodology ............................................................................................................................................. 3
Internet Population Overview .................................................................................................................... 4
Global e-Commerce Trends ...................................................................................................................... 5
Key Findings ................................................................................................................................................. 6
Regional Differences in Satisfaction ............................................................................................................. 9
Satisfaction and Importance ................................................................................................................... 10
Checkout Process and Cart Abandonment ................................................................................................ 12
Setting Delivery Expectations ................................................................................................................. 13
Factors Driving Cart Abandonment ......................................................................................................... 14
The Delivery Experience ............................................................................................................................ 16
Package Tracking Importance ................................................................................................................ 16
Factors Driving Retailer Recommendations ........................................................................................... 18
The Impact of Mobile Devices .................................................................................................................... 18
Mobile Playing a Significant Role ............................................................................................................ 18
Mobile Shopping Habits .......................................................................................................................... 20
Social Commerce ....................................................................................................................................... 21
Consumer Engagement through Social Media ....................................................................................... 22
Consumers Seek an Integrated Experience across Retailer Channels .................................................. 24
Returns and Exchanges ............................................................................................................................. 26
Frequency of Returns ............................................................................................................................. 26
Elements of a Positive Returns Experience ............................................................................................ 28
Conclusions ................................................................................................................................................ 29
Appendix: Region & Country Spotlights ..................................................................................................... 32
© 2013 United Parcel Service of America, Inc. UPS, the UPS brandmark and the color brown are trademarks of United Parcel
Service of America, Inc. All rights reserved. 3
Welcome to the UPS Pulse of the Online Shopper™ Global Study
The dramatic changes in retailing arising from e-commerce can be felt across the globe. As the
population of Internet users grows across geographic regions and consumers become increasingly
comfortable buying online, all retailers are competing to create a differentiating online shopping
experience to capture their share of the thriving e-commerce market. Consumers everywhere are
demanding that retailers focus on the end-to-end shopping experience – from web usability and checkout
to delivery and returns. To better understand these consumer preferences, UPS commissioned research
with comScore and created the UPS Pulse of the Online Shopper study. It goes beyond topics covered by
other studies and focuses on the entire online shopping experience.
Since e-commerce is a global phenomenon, opening up borders and markets worldwide, this second
annual UPS Pulse of the Online Shopper was commissioned across multiple geographies. This Global
Study helps retailers gain insights into consumer preferences by incorporating findings from the U.S.,
Canada, Mexico, Asia, Australia and Europe.
The topics addressed were the same across all of the regions and included the following:
ü What do consumers want in an online shopping experience?
ü How are mobile and social media channels changing consumers’ shopping habits and
expectations?
ü What do consumers want from retailers in the online checkout and delivery experience?
ü What comprises a good returns experience?
ü What are omnichannel consumer expectations of retailers?
ü What drives repeat customers and retailer recommendations?
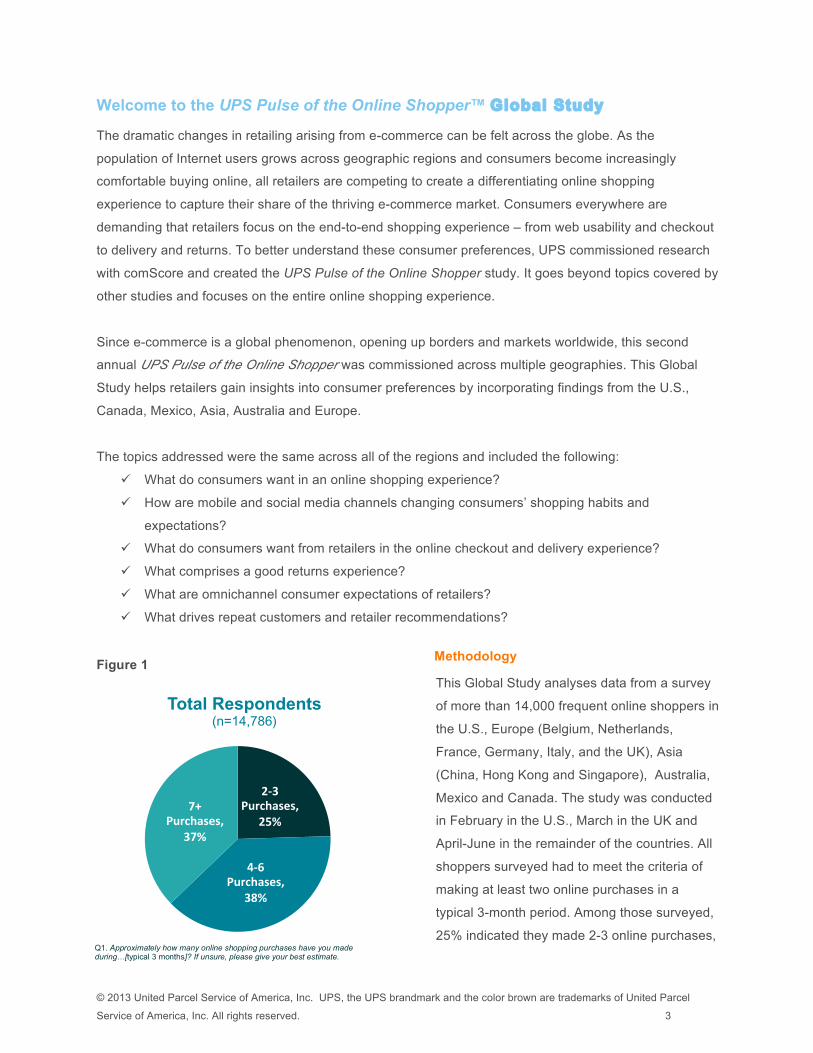
Methodology
This Global Study analyses data from a survey
of more than 14,000 frequent online shoppers in
the U.S., Europe (Belgium, Netherlands,
France, Germany, Italy, and the UK), Asia
(China, Hong Kong and Singapore), Australia,
Mexico and Canada. The study was conducted
in February in the U.S., March in the UK and
April-June in the remainder of the countries. All
shoppers surveyed had to meet the criteria of
making at least two online purchases in a
typical 3-month period. Among those surveyed,
25% indicated they made 2-3 online purchases,
Figure 1
2-‐3 Purchases,
25%
4-‐6 Purchases,
38%
7+ Purchases,
37%
Total Respondents (n=14,786)
Q1. Approximately how many online shopping purchases have you made during…[typical 3 months]? If unsure, please give your best estimate.
© 2013 United Parcel Service of America, Inc. UPS, the UPS brandmark and the color brown are trademarks of United Parcel
Service of America, Inc. All rights reserved. 4
38% made 4-6 purchases and 37% made 7 or more purchases (Figure 1). Although this is not necessarily
a natural breakout, these frequent shoppers provide the best insights into what today’s savvy shoppers
want from an online retailer.
Additional country-level details are also available in separate consultation papers for the U.S., Mexico,
Canada, Europe, Asia and Australia regions. This sixth consultation paper, the Global Study, focuses on
comparisons between the three North American countries, Australia and the Europe and Asia Regions --
with some call-outs for specific countries in these two regions. These region consultation papers can be
provided upon request from your UPS Account Manager, or from the U.S., are publicly available at
ups.com/comscore2013.
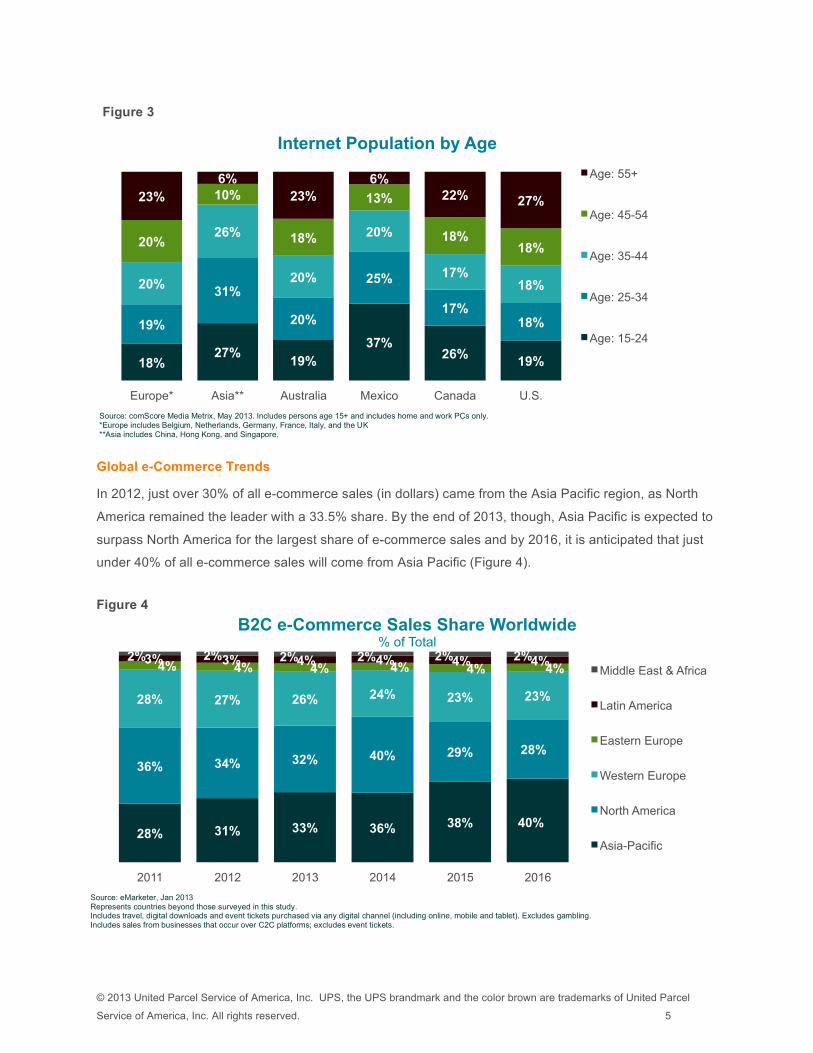
Internet Population Overview
Asia has the largest total Internet population of any region at 358 million, the U.S. is second with 192
million and Europe third at 182 million, followed by Canada, Mexico and Australia (Figure 2). Asia and
Mexico are the only regions with more than 50% of their total Internet population under the age of 35
(Figure 3). These demographic differences are important to take into account for retailers seeking to
expand their markets into Asia and Mexico, where online consumers are much younger than other
countries.
182
358
14 25 26
192
Europe* Asia** Australia Mexico Canada U.S.
Total Internet Population (in Millions) Persons 15+
182 358 416
650
Europe Asia
Total Internet Population (in Millions) Persons 15+
Countries Surveyed All Countries
Figure 2
Source: comScore Media Metrix, May 2013. Includes persons age 15+ and includes home and work PCs only. *Europe includes Belgium, Netherlands, Germany, France, Italy, and the UK **Asia includes China, Hong Kong, and Singapore.
© 2013 United Parcel Service of America, Inc. UPS, the UPS brandmark and the color brown are trademarks of United Parcel
Service of America, Inc. All rights reserved. 5
Global e-Commerce Trends
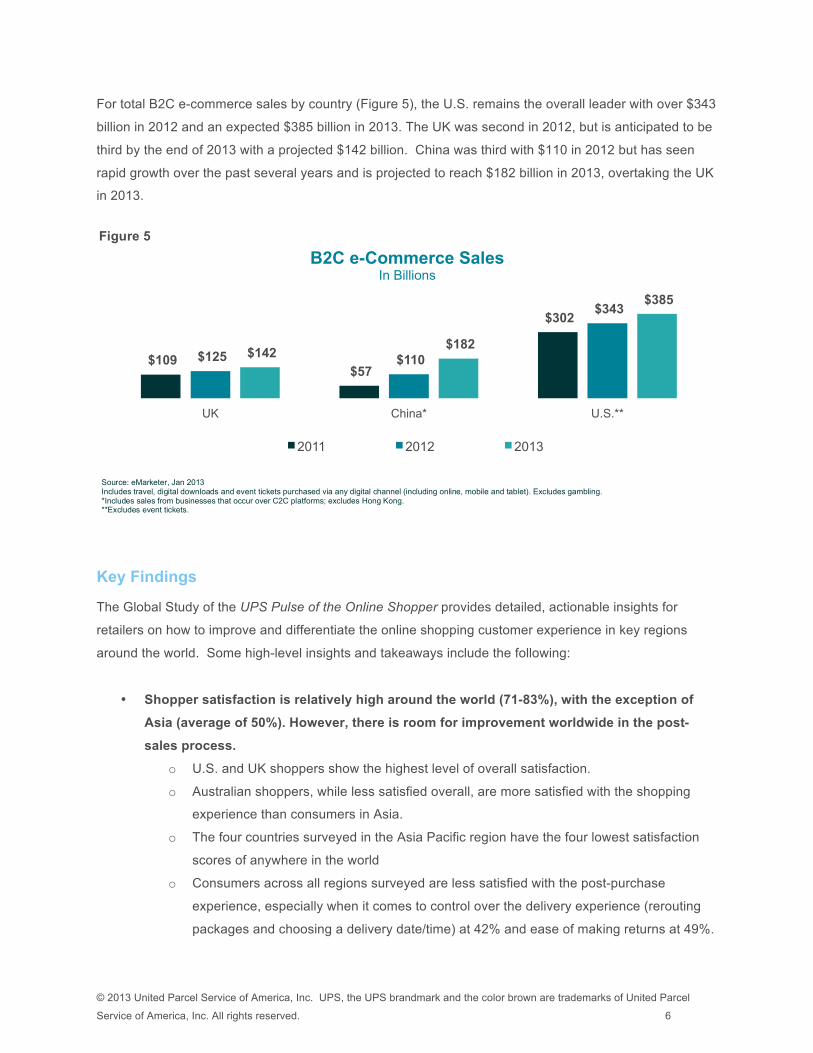
In 2012, just over 30% of all e-commerce sales (in dollars) came from the Asia Pacific region, as North
America remained the leader with a 33.5% share. By the end of 2013, though, Asia Pacific is expected to
surpass North America for the largest share of e-commerce sales and by 2016, it is anticipated that just
under 40% of all e-commerce sales will come from Asia Pacific (Figure 4).
18% 27%
19% 37%
26% 19%
19%
31%
20%
25%
17% 18%
20%
26%
20%
20%
17% 18%
20%
10%
18%
13%
18% 18%
23% 6%
23% 6%
22% 27%
Europe* Asia** Australia Mexico Canada U.S.
Internet Population by Age
Age: 55+
Age: 45-54
Age: 35-44
Age: 25-34
Age: 15-24
28% 31% 33% 36% 38% 40%
36% 34% 32% 40% 29% 28%
28% 27% 26% 24% 23% 23%
4% 4% 4% 4% 4% 4% 3% 3% 4% 4% 4% 4% 2% 2% 2% 2% 2% 2%
2011 2012 2013 2014 2015 2016
B2C e-Commerce Sales Share Worldwide % of Total
Middle East & Africa
Latin America
Eastern Europe
Western Europe
North America
Asia-Pacific
Figure 3
Source: comScore Media Metrix, May 2013. Includes persons age 15+ and includes home and work PCs only. *Europe includes Belgium, Netherlands, Germany, France, Italy, and the UK **Asia includes China, Hong Kong, and Singapore.
Figure 4
Source: eMarketer, Jan 2013 Represents countries beyond those surveyed in this study. Includes travel, digital downloads and event tickets purchased via any digital channel (including online, mobile and tablet). Excludes gambling. Includes sales from businesses that occur over C2C platforms; excludes event tickets.
© 2013 United Parcel Service of America, Inc. UPS, the UPS brandmark and the color brown are trademarks of United Parcel
Service of America, Inc. All rights reserved. 6
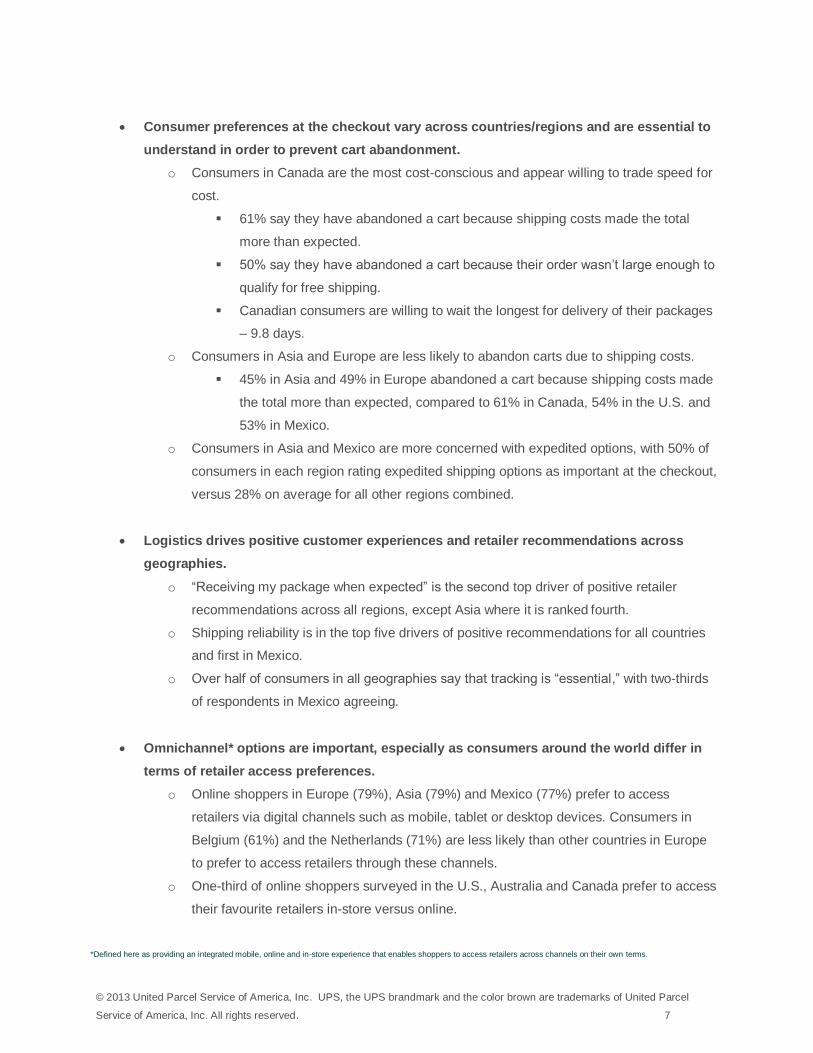
For total B2C e-commerce sales by country (Figure 5), the U.S. remains the overall leader with over $343
billion in 2012 and an expected $385 billion in 2013. The UK was second in 2012, but is anticipated to be
third by the end of 2013 with a projected $142 billion. China was third with $110 in 2012 but has seen
rapid growth over the past several years and is projected to reach $182 billion in 2013, overtaking the UK
in 2013.
Key Findings
The Global Study of the UPS Pulse of the Online Shopper provides detailed, actionable insights for
retailers on how to improve and differentiate the online shopping customer experience in key regions
around the world. Some high-level insights and takeaways include the following:
• Shopper satisfaction is relatively high around the world (71-83%), with the exception of
Asia (average of 50%). However, there is room for improvement worldwide in the post-
sales process.
o U.S. and UK shoppers show the highest level of overall satisfaction.
o Australian shoppers, while less satisfied overall, are more satisfied with the shopping
experience than consumers in Asia.
o The four countries surveyed in the Asia Pacific region have the four lowest satisfaction
scores of anywhere in the world
o Consumers across all regions surveyed are less satisfied with the post-purchase
experience, especially when it comes to control over the delivery experience (rerouting
packages and choosing a delivery date/time) at 42% and ease of making returns at 49%.
$109 $57
$302
$125 $110
$343
$142 $182
$385
UK China* U.S.**
B2C e-Commerce Sales In Billions
2011 2012 2013
Figure 5
Source: eMarketer, Jan 2013 Includes travel, digital downloads and event tickets purchased via any digital channel (including online, mobile and tablet). Excludes gambling. *Includes sales from businesses that occur over C2C platforms; excludes Hong Kong. **Excludes event tickets.
© 2013 United Parcel Service of America, Inc. UPS, the UPS brandmark and the color brown are trademarks of United Parcel
Service of America, Inc. All rights reserved. 7
Consumer preferences at the checkout vary across countries/regions and are essential to
understand in order to prevent cart abandonment.
o Consumers in Canada are the most cost-conscious and appear willing to trade speed for
cost.
61% say they have abandoned a cart because shipping costs made the total
more than expected.
50% say they have abandoned a cart because their order wasn’t large enough to
qualify for free shipping.
Canadian consumers are willing to wait the longest for delivery of their packages
– 9.8 days.
o Consumers in Asia and Europe are less likely to abandon carts due to shipping costs.
45% in Asia and 49% in Europe abandoned a cart because shipping costs made
the total more than expected, compared to 61% in Canada, 54% in the U.S. and
53% in Mexico.
o Consumers in Asia and Mexico are more concerned with expedited options, with 50% of
consumers in each region rating expedited shipping options as important at the checkout,
versus 28% on average for all other regions combined.
Logistics drives positive customer experiences and retailer recommendations across
geographies.
o “Receiving my package when expected” is the second top driver of positive retailer
recommendations across all regions, except Asia where it is ranked fourth.
o Shipping reliability is in the top five drivers of positive recommendations for all countries
and first in Mexico.
o Over half of consumers in all geographies say that tracking is “essential,” with two-thirds
of respondents in Mexico agreeing.
Omnichannel* options are important, especially as consumers around the world differ in
terms of retailer access preferences.
o Online shoppers in Europe (79%), Asia (79%) and Mexico (77%) prefer to access
retailers via digital channels such as mobile, tablet or desktop devices. Consumers in
Belgium (61%) and the Netherlands (71%) are less likely than other countries in Europe
to prefer to access retailers through these channels.
o One-third of online shoppers surveyed in the U.S., Australia and Canada prefer to access
their favourite retailers in-store versus online.
*Defined here as providing an integrated mobile, online and in-store experience that enables shoppers to access retailers across channels on their own terms.
© 2013 United Parcel Service of America, Inc. UPS, the UPS brandmark and the color brown are trademarks of United Parcel
Service of America, Inc. All rights reserved. 8
o Consumers in Asia have the highest percentage of smartphone and tablet owners
purchasing goods on their devices; 78% of those who own tablets and 73% of those who
own smartphones have made purchases on these devices. o Consumers in Mexico and the U.S. highly value omnichannel options.
§ 67% of shoppers in Mexico and 62% in the U.S. want the ability to buy online and make returns in-store (compared to 51% in Asia and 52% in Europe).
§ 62% of consumers in Mexico are more likely to shop with a retailer if they offer location-enabled services, such as the push of a coupon to the phone, the highest of any country surveyed
• Returns are a critical factor in a positive online shopping experience across geographies, yet consumer behaviour around returns varies by country.
o Over half of consumers in every country/region would shop more with a retailer and
recommend a retailer to a friend if the retailer has a hassle-free returns policy.
o Free returns shipping is the most frequently cited element of a favourable returns
experience in every country/region surveyed.
o Although only 30% of shoppers in Mexico have returned an online purchase, 62% of
them review a returns policy before making a purchase.
© 2013 United Parcel Service of America, Inc. UPS, the UPS brandmark and the color brown are trademarks of United Parcel
Service of America, Inc. All rights reserved. 9
Regional Differences in Satisfaction
Global consumer satisfaction with online shopping is generally high at 66% (those survey respondents
selecting the top two boxes on a 7-point scale, Figure 6), but is markedly lower in Asia. Although China
and Singapore both have relatively low satisfaction at 60% and 51%, Hong Kong has by far the least
satisfied consumers, at just 38%. The U.S. leads in overall satisfaction, at 83%, with Germany (81%) and
the UK (80%) the only other countries to reach 80% satisfaction.
The aspects of online shopping that respondents are most satisfied with include those related to the
retailer’s website, such as ease of checkout and the variety of brands and products offered (Figure 7).
These are areas that indicate that retailers are generally doing a good job with e-commerce fundamentals
– offering products consumers are looking for and making the checkout process on a website simpler.
Consumers in Asia are the least satisfied with these areas, which is also reflected in their low satisfaction
overall. Not shown in Figure 7 are two other items that scored relatively high in Europe − having websites
available in the local or preferred language (73%) and international payment and delivery options (63%).
Q10. Overall, how satisfied are you with your previous online purchasing experiences in the past three months?
Figure 6
83%
78%
77%
76%
71%
50%
Overall Satisfaction 7-point Scale, Top Two Boxes
© 2013 United Parcel Service of America, Inc. UPS, the UPS brandmark and the color brown are trademarks of United Parcel
Service of America, Inc. All rights reserved. 10
Satisfaction and Importance
For retailers to get a clearer picture of where they should invest their time and which elements of
satisfaction are relatively more important than others, a quadrant analysis was performed to overlay
derived importance with satisfaction. Direct and indirect drivers of satisfaction were determined using
statistical modelling techniques. Coupling derived importance with satisfaction can provide retailers
guidance regarding areas where they should focus to help move the overall satisfaction needle.
68%
73%
69%
69%
71%
76%
80%
81%
56%
61%
61%
65%
62%
66%
73%
74%
53%
55%
65%
65%
70%
67%
72%
68%
53%
47%
58%
58%
61%
59%
67%
71%
44%
44%
55%
54%
55%
54%
57%
58%
57%
59%
62%
61%
59%
66%
72%
71%
The retailer has a clear and easy to understand returns
policy
The number of shipping options (e.g., next day, two-day, regular ground) offered
Availability of free or discounted shipping
Ability to create an account to store purchase history and personal information
The number of payment options available
The ability to track online purchases whilst in transit
Variety of brands and products offered
Ease of checkout
Europe
Asia
Australia
Mexico
Canada
U.S.
44%
44%
49%
43%
55%
55%
58%
62%
61%
32%
34%
37%
35%
38%
42%
46%
45%
42%
45%
51%
53%
52%
47%
55%
32%
32%
33%
29%
35%
34%
39%
38%
44%
41%
38%
43%
39%
44%
40%
43%
40%
50%
40%
42%
45%
45%
38%
51%
40%
55%
46%
Ability to choose a specified time of day for delivery of my purchase
Flexibility to reroute packages
Flexibility to choose my delivery date
A green/environmentally friendly shipping option
Ability to purchase through a mobile
smartphone application
Ability to collect from a retail location that is
convenient to me (retailer’s store, another
Ability to contact a live customer service rep
Ease of making returns/ exchanges
Ability to purchase through a tablet
application
Figure 7
Q11. Based upon your previous experience, how satisfied are you with each of the following aspects of online purchasing?
Satisfaction with Aspects of Online Shopping 7-point scale, Top Two Boxes (n varies by aspect)
© 2013 United Parcel Service of America, Inc. UPS, the UPS brandmark and the color brown are trademarks of United Parcel
Service of America, Inc. All rights reserved. 11
The right side of Figure 8 highlights regional differences for aspects of both high derived importance and
high satisfaction. These are areas where consumers are satisfied, but retailers should not lose focus on
them because they are still fundamental drivers of overall satisfaction. Variety of products and ease of
checkout are two aspects that fall into this quadrant for most countries, but there are still several key
differences to note. In France and Germany, having a website in the local or preferred language was both
of high derived importance and an area where consumers are already relatively satisfied. Mexico is the
only country where reliable shipping is both highly important and an area where consumers are relatively
satisfied.
The left side of Figure 8 reveals the areas that are of high derived importance, but low satisfaction –
areas where retailers should invest their time. In France and Canada, for example, tablet apps rank low
on satisfaction but high on importance. In Australia, the rerouting of packages is seen as the most
important factor, but satisfaction is low in this area. Mexico was the only country examined where online
shoppers indicated the time to receive an order as highly important, yet an area where consumers are
relatively less satisfied. In China and the U.S., a clear returns policy also falls into this quadrant, indicating
a need for improvement in this area.
Free shipping or anything “free” such as free returns, which surfaces later in this paper, is very often of
high stated importance, but not necessarily of high derived importance, depending on the country.
Countries where free shipping does have high derived importance include Canada, Australia and Italy.
Throughout the paper it will be important to keep areas of high derived importance in mind to better
understand how to cater to consumers across the globe.
• Time to Receive Order
• Ease of Returns & Exchanges
• Live Customer Service Rep
Mexico • Number of Payment Options
• Ability to Track Online
• Reliable Shipping
• Purchase via Tablet App
• Choose Delivery Date
• Ease of Returns & Exchanges
Canada • Ease of Checkout
• Variety of Brands & Products
• Free or Discounted Shipping
• Number of Shipping Options
• Ability to Create an Account
• Clear Returns Policy
U.S. • Ease of Checkout
• Variety of Brands & Products
• Ability to Track Online
High Derived Importance, Low Satisfaction
(Invest)
Figure 8
High Derived Importance, High Satisfaction
(Maintain) North America
© 2013 United Parcel Service of America, Inc. UPS, the UPS brandmark and the color brown are trademarks of United Parcel
Service of America, Inc. All rights reserved. 12
Checkout Process and Cart Abandonment
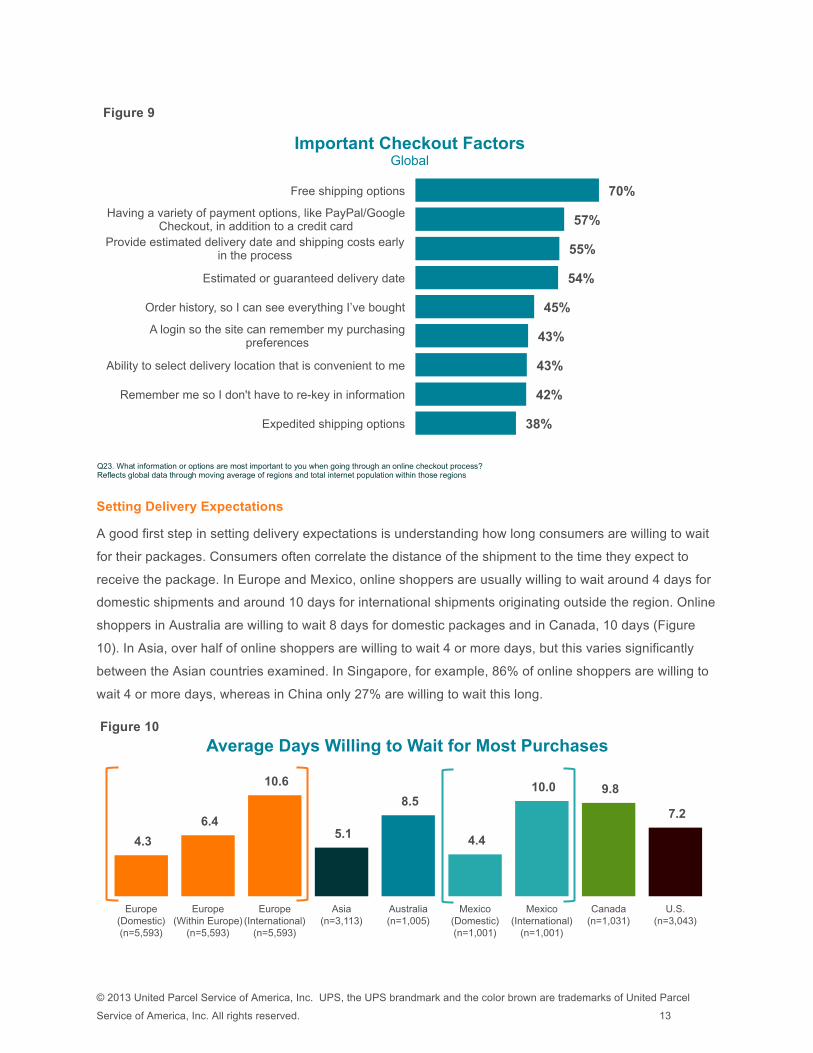
Examining what information or options are important to online shoppers when going through an online checkout process, 70% globally list free shipping options as important. Other important factors include having a variety of payment options, providing an estimated or guaranteed delivery date and total cost including shipping early in the process (Figure 9).
• Purchase via Smartphone App
• Live Customer Service Rep
• Ability to Reroute Packages
Belgium • Ease of Checkout
• Variety of Brands & Products
• Free or Discounted Shipping
• Collect from Convenient Location
• Ability to Reroute Packages
• Choose Delivery Date
Netherlands • Ease of Checkout
• Variety of Brands & Products
• Free or Discounted Shipping
• Purchase via Smartphone App
• Ability to Reroute Packages
• Purchase via Tablet App
France • Ease of Checkout
• Website in Local or Preferred Language
• Ability to Track Online
• Ability to Reroute Packages
• Live Customer Service Rep
• Collect from Convenient Location
Germany • Ease of Checkout
• Variety of Brands & Products
• Website in Local or Preferred Language
• Live Customer Service Rep
• Ability to Reroute Packages
• Choose Delivery Time of Day
Italy • Free or Discounted Shipping
• Variety of Brands & Products
• Ability to Track Online
• Green Shipping Options
• Purchase via Smartphone App
• Choose Delivery Date
UK • Ease of Checkout
• Variety of Brands & Products
• Number of Payment Options
• Ease of Returns & Exchanges
• Clear Returns Policy
• Number of Shipping Options
China • Ability to Create an Account
• Variety of Brands & Products
• Ease of Checkout
• Green Shipping Options
• Ability to Reroute Packages
• Ease of Returns & Exchanges
Hong Kong • Variety of Brands & Products
• Ease of Checkout
• Number of Payment Options
• Choose Delivery Date
• Green Shipping Options
• Purchase via Smartphone App
Singapore • Ease of Checkout
• Number of Payment Options
• Variety of Brands & Products
• Ability to Reroute Packages
• Number of Shipping Options
• Purchase via Smartphone App
Australia • Ease of Checkout
• Free or Discounted Shipping
• Variety of Brands & Products
Q11. Based upon your previous experience, how satisfied are you with each of the following aspects of online purchasing? Top Two Boxes Satisfaction in Most Countries; Top Box in Italy, UK, Australia, Mexico, Canada, and U.S. * U.S. uses Direct Impact rather than Derived Importance.
Asia
Europe
© 2013 United Parcel Service of America, Inc. UPS, the UPS brandmark and the color brown are trademarks of United Parcel
Service of America, Inc. All rights reserved. 13
Setting Delivery Expectations
A good first step in setting delivery expectations is understanding how long consumers are willing to wait
for their packages. Consumers often correlate the distance of the shipment to the time they expect to
receive the package. In Europe and Mexico, online shoppers are usually willing to wait around 4 days for
domestic shipments and around 10 days for international shipments originating outside the region. Online
shoppers in Australia are willing to wait 8 days for domestic packages and in Canada, 10 days (Figure
10). In Asia, over half of online shoppers are willing to wait 4 or more days, but this varies significantly
between the Asian countries examined. In Singapore, for example, 86% of online shoppers are willing to
wait 4 or more days, whereas in China only 27% are willing to wait this long.
38%
42%
43%
43%
45%
54%
55%
57%
70%
Expedited shipping options
Remember me so I don't have to re-key in information
Ability to select delivery location that is convenient to me
A login so the site can remember my purchasing preferences
Order history, so I can see everything I’ve bought
Estimated or guaranteed delivery date
Provide estimated delivery date and shipping costs early in the process
Having a variety of payment options, like PayPal/Google Checkout, in addition to a credit card
Free shipping options
Important Checkout Factors Global
4.3
6.4
10.6
5.1
8.5
4.4
10.0 9.8
7.2
Europe (Domestic) (n=5,593)
Europe (Within Europe)
(n=5,593)
Europe (International)
(n=5,593)
Asia (n=3,113)
Australia (n=1,005)
Mexico (Domestic) (n=1,001)
Mexico (International)
(n=1,001)
Canada (n=1,031)
U.S. (n=3,043)
Average Days Willing to Wait for Most Purchases Figure 10
Q23. What information or options are most important to you when going through an online checkout process? Reflects global data through moving average of regions and total internet population within those regions
Figure 9
© 2013 United Parcel Service of America, Inc. UPS, the UPS brandmark and the color brown are trademarks of United Parcel
Service of America, Inc. All rights reserved. 14
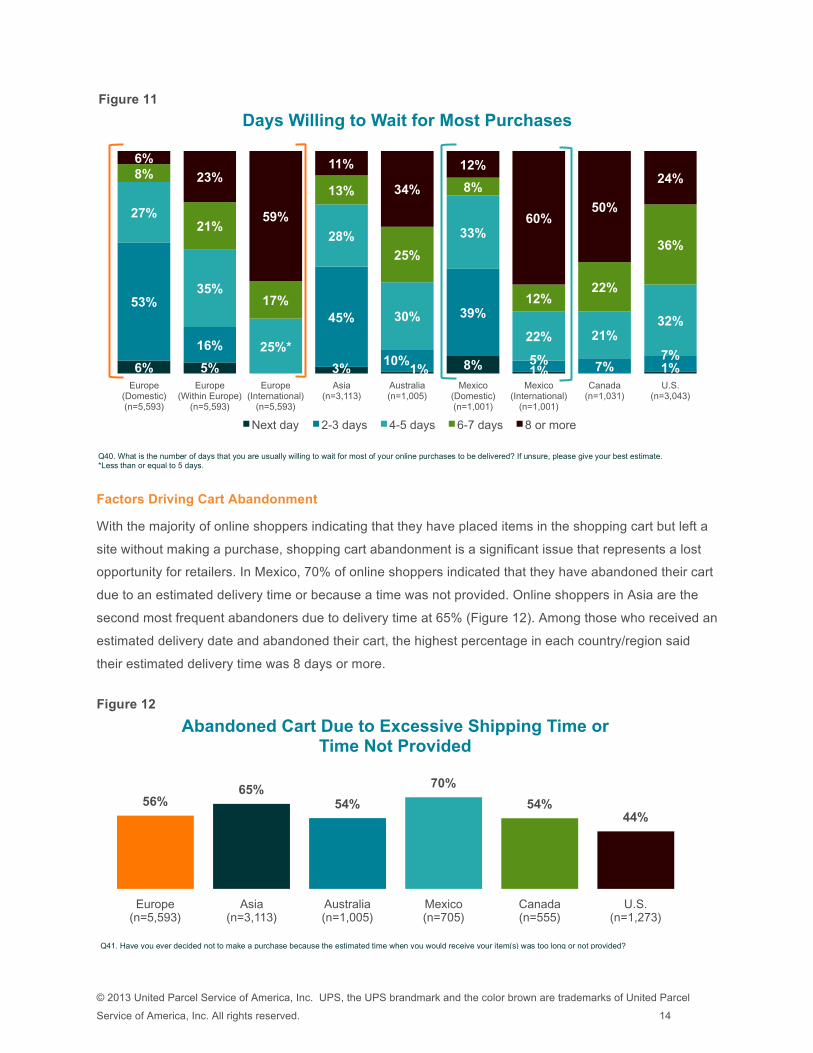
Factors Driving Cart Abandonment
With the majority of online shoppers indicating that they have placed items in the shopping cart but left a
site without making a purchase, shopping cart abandonment is a significant issue that represents a lost
opportunity for retailers. In Mexico, 70% of online shoppers indicated that they have abandoned their cart
due to an estimated delivery time or because a time was not provided. Online shoppers in Asia are the
second most frequent abandoners due to delivery time at 65% (Figure 12). Among those who received an
estimated delivery date and abandoned their cart, the highest percentage in each country/region said
their estimated delivery time was 8 days or more.
6% 5% 3% 1% 8% 1%
0%
1%
53%
16%
45%
10%
39%
5% 7% 7%
27%
35%
25%*
28%
30%
33%
22% 21% 32%
8%
21%
17%
13%
25%
8%
12% 22%
36%
6%
23%
59%
11%
34%
12%
60% 50%
24%
Europe (Domestic) (n=5,593)
Europe (Within Europe)
(n=5,593)
Europe (International)
(n=5,593)
Asia (n=3,113)
Australia (n=1,005)
Mexico (Domestic) (n=1,001)
Mexico (International)
(n=1,001)
Canada (n=1,031)
U.S. (n=3,043)
Days Willing to Wait for Most Purchases
Next day 2-3 days 4-5 days 6-7 days 8 or more
56% 65%
54%
70%
54% 44%
Europe (n=5,593)
Asia (n=3,113)
Australia (n=1,005)
Mexico (n=705)
Canada (n=555)
U.S. (n=1,273)
Abandoned Cart Due to Excessive Shipping Time or Time Not Provided
Figure 11
Q40. What is the number of days that you are usually willing to wait for most of your online purchases to be delivered? If unsure, please give your best estimate. *Less than or equal to 5 days.
Q41. Have you ever decided not to make a purchase because the estimated time when you would receive your item(s) was too long or not provided?
Figure 12
© 2013 United Parcel Service of America, Inc. UPS, the UPS brandmark and the color brown are trademarks of United Parcel
Service of America, Inc. All rights reserved. 15
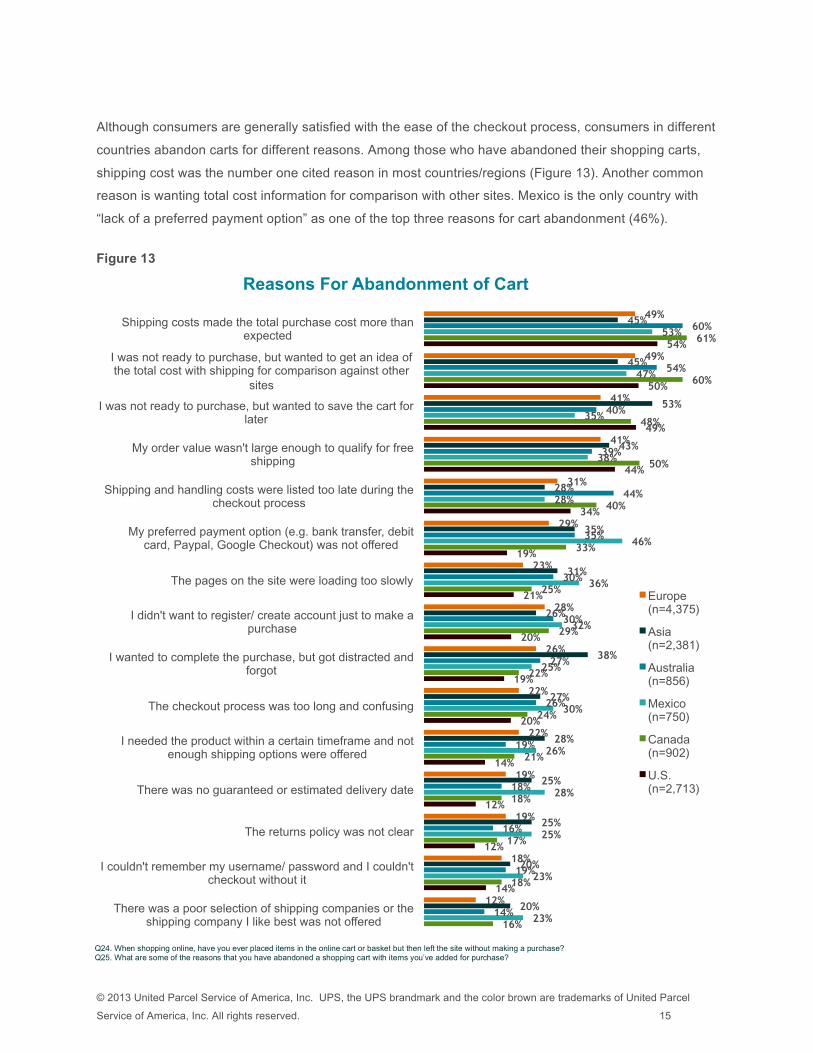
Although consumers are generally satisfied with the ease of the checkout process, consumers in different
countries abandon carts for different reasons. Among those who have abandoned their shopping carts,
shipping cost was the number one cited reason in most countries/regions (Figure 13). Another common
reason is wanting total cost information for comparison with other sites. Mexico is the only country with
“lack of a preferred payment option” as one of the top three reasons for cart abandonment (46%).
14%
12%
12%
14%
20%
19%
20%
21%
19%
34%
44%
49%
50%
54%
16%
18%
17%
18%
21%
24%
22%
29%
25%
33%
40%
50%
48%
60%
61%
23%
23%
25%
28%
26%
30%
25%
32%
36%
46%
28%
38%
35%
47%
53%
14%
19%
16%
18%
19%
26%
27%
30%
30%
35%
44%
39%
40%
54%
60%
20%
20%
25%
25%
28%
27%
38%
26%
31%
35%
28%
43%
53%
45%
45%
12%
18%
19%
19%
22%
22%
26%
28%
23%
29%
31%
41%
41%
49%
49%
There was a poor selection of shipping companies or the shipping company I like best was not offered
I couldn't remember my username/ password and I couldn't checkout without it
The returns policy was not clear
There was no guaranteed or estimated delivery date
I needed the product within a certain timeframe and not enough shipping options were offered
The checkout process was too long and confusing
I wanted to complete the purchase, but got distracted and forgot
I didn't want to register/ create account just to make a purchase
The pages on the site were loading too slowly
My preferred payment option (e.g. bank transfer, debit card, Paypal, Google Checkout) was not offered
Shipping and handling costs were listed too late during the checkout process
My order value wasn't large enough to qualify for free shipping
I was not ready to purchase, but wanted to save the cart for later
I was not ready to purchase, but wanted to get an idea of the total cost with shipping for comparison against other
sites
Shipping costs made the total purchase cost more than expected
Reasons For Abandonment of Cart
Europe (n=4,375)
Asia (n=2,381)
Australia (n=856)
Mexico (n=750)
Canada (n=902)
U.S. (n=2,713)
Figure 13
Q24. When shopping online, have you ever placed items in the online cart or basket but then left the site without making a purchase? Q25. What are some of the reasons that you have abandoned a shopping cart with items you’ve added for purchase?
© 2013 United Parcel Service of America, Inc. UPS, the UPS brandmark and the color brown are trademarks of United Parcel
Service of America, Inc. All rights reserved. 16
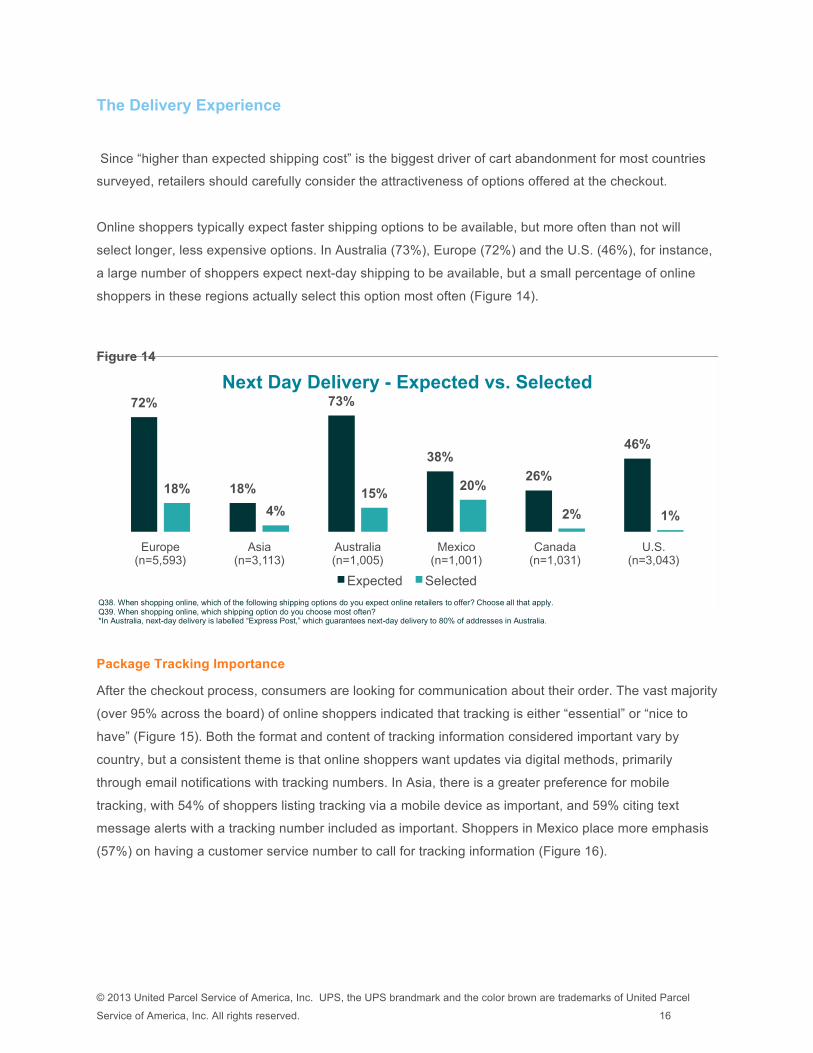
The Delivery Experience
Since “higher than expected shipping cost” is the biggest driver of cart abandonment for most countries
surveyed, retailers should carefully consider the attractiveness of options offered at the checkout.
Online shoppers typically expect faster shipping options to be available, but more often than not will
select longer, less expensive options. In Australia (73%), Europe (72%) and the U.S. (46%), for instance,
a large number of shoppers expect next-day shipping to be available, but a small percentage of online
shoppers in these regions actually select this option most often (Figure 14).
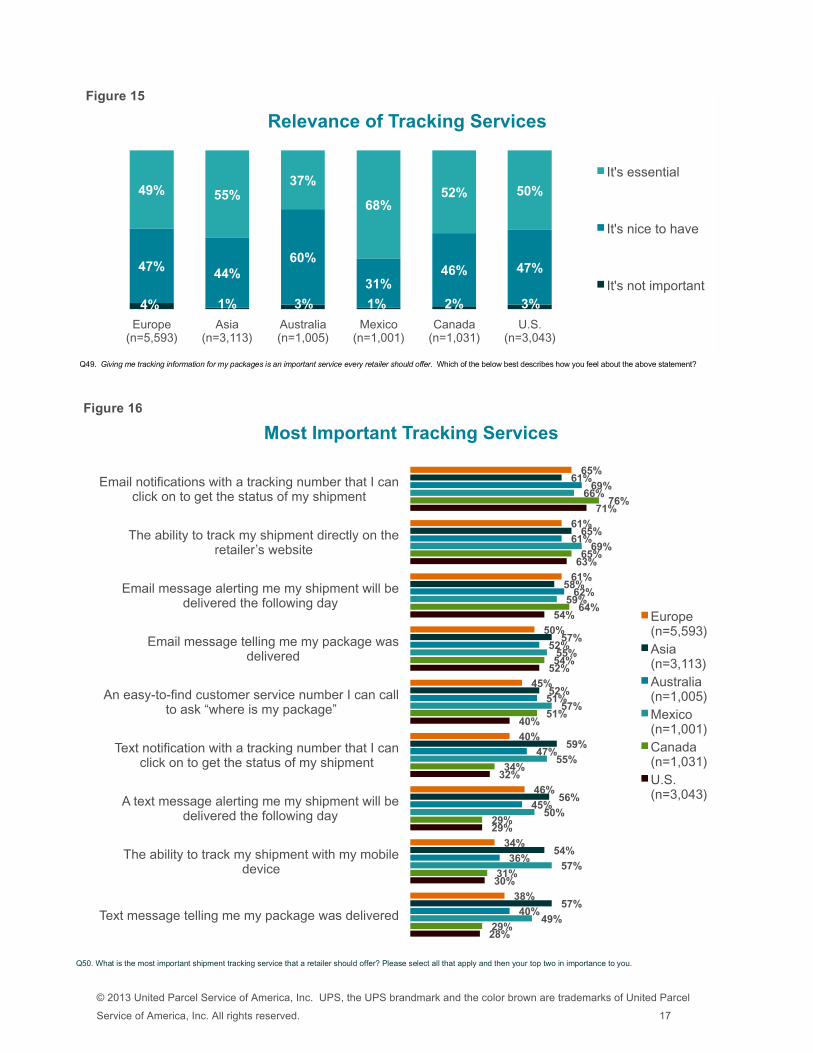
Package Tracking Importance
After the checkout process, consumers are looking for communication about their order. The vast majority
(over 95% across the board) of online shoppers indicated that tracking is either “essential” or “nice to
have” (Figure 15). Both the format and content of tracking information considered important vary by
country, but a consistent theme is that online shoppers want updates via digital methods, primarily
through email notifications with tracking numbers. In Asia, there is a greater preference for mobile
tracking, with 54% of shoppers listing tracking via a mobile device as important, and 59% citing text
message alerts with a tracking number included as important. Shoppers in Mexico place more emphasis
(57%) on having a customer service number to call for tracking information (Figure 16).
72%
18%
73%
38%
26%
46%
18%
4% 15%
20%
2% 1%
Europe (n=5,593)
Asia (n=3,113)
Australia (n=1,005)
Mexico (n=1,001)
Canada (n=1,031)
U.S. (n=3,043)
Next Day Delivery - Expected vs. Selected
Expected Selected
Figure 14
Q38. When shopping online, which of the following shipping options do you expect online retailers to offer? Choose all that apply. Q39. When shopping online, which shipping option do you choose most often? *In Australia, next-day delivery is labelled “Express Post,” which guarantees next-day delivery to 80% of addresses in Australia.
© 2013 United Parcel Service of America, Inc. UPS, the UPS brandmark and the color brown are trademarks of United Parcel
Service of America, Inc. All rights reserved. 17
4% 1% 3% 1% 2% 3%
47% 44% 60%
31% 46% 47%
49% 55% 37%
68% 52% 50%
Europe (n=5,593)
Asia (n=3,113)
Australia (n=1,005)
Mexico (n=1,001)
Canada (n=1,031)
U.S. (n=3,043)
Relevance of Tracking Services
It's essential
It's nice to have
It's not important
28%
30%
29%
32%
40%
52%
54%
63%
71%
29%
31%
29%
34%
51%
54%
64%
65%
76%
49%
57%
50%
55%
57%
55%
59%
69%
66%
40%
36%
45%
47%
51%
52%
62%
61%
69%
57%
54%
56%
59%
52%
57%
58%
65%
61%
38%
34%
46%
40%
45%
50%
61%
61%
65%
Text message telling me my package was delivered
The ability to track my shipment with my mobile device
A text message alerting me my shipment will be delivered the following day
Text notification with a tracking number that I can click on to get the status of my shipment
An easy-to-find customer service number I can call to ask “where is my package”
Email message telling me my package was delivered
Email message alerting me my shipment will be delivered the following day
The ability to track my shipment directly on the retailer’s website
Email notifications with a tracking number that I can click on to get the status of my shipment
Most Important Tracking Services
Europe (n=5,593) Asia (n=3,113) Australia (n=1,005) Mexico (n=1,001) Canada (n=1,031) U.S. (n=3,043)
Q50. What is the most important shipment tracking service that a retailer should offer? Please select all that apply and then your top two in importance to you.
Figure 16
Figure 15
Q49. Giving me tracking information for my packages is an important service every retailer should offer. Which of the below best describes how you feel about the above statement?
© 2013 United Parcel Service of America, Inc. UPS, the UPS brandmark and the color brown are trademarks of United Parcel
Service of America, Inc. All rights reserved. 18
Factors Driving Retailer Recommendations
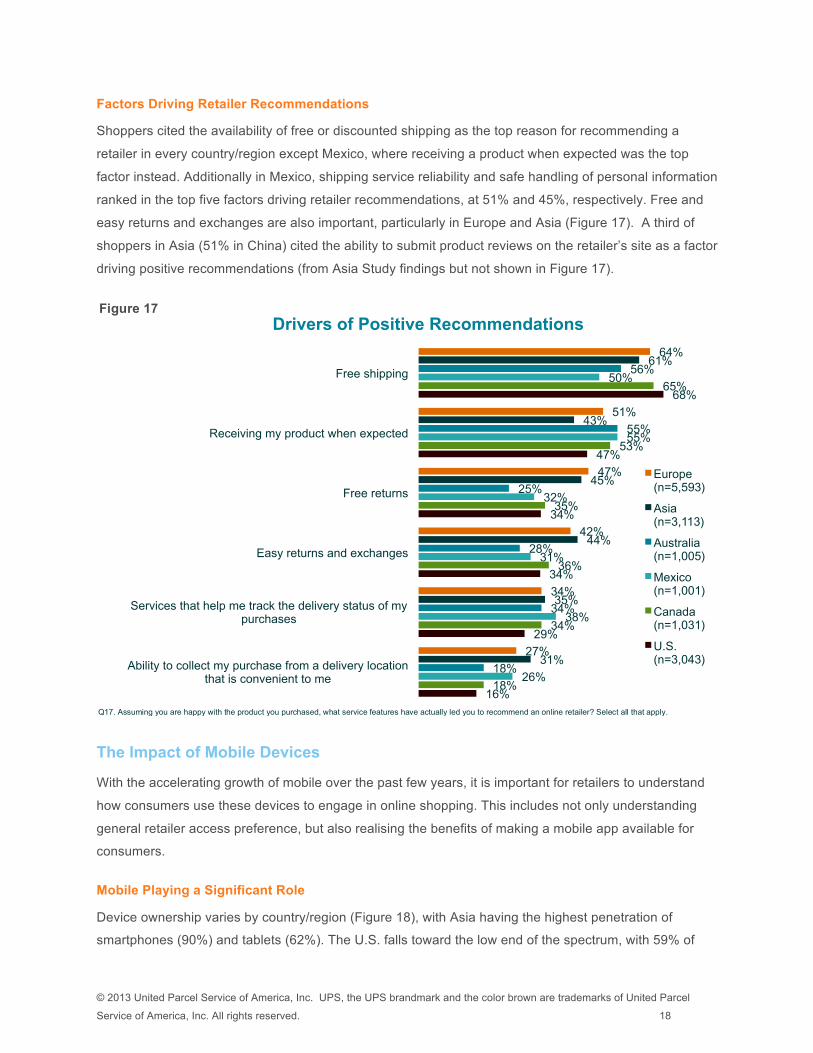
Shoppers cited the availability of free or discounted shipping as the top reason for recommending a
retailer in every country/region except Mexico, where receiving a product when expected was the top
factor instead. Additionally in Mexico, shipping service reliability and safe handling of personal information
ranked in the top five factors driving retailer recommendations, at 51% and 45%, respectively. Free and
easy returns and exchanges are also important, particularly in Europe and Asia (Figure 17). A third of
shoppers in Asia (51% in China) cited the ability to submit product reviews on the retailer’s site as a factor
driving positive recommendations (from Asia Study findings but not shown in Figure 17).
The Impact of Mobile Devices
With the accelerating growth of mobile over the past few years, it is important for retailers to understand
how consumers use these devices to engage in online shopping. This includes not only understanding
general retailer access preference, but also realising the benefits of making a mobile app available for
consumers.
Mobile Playing a Significant Role
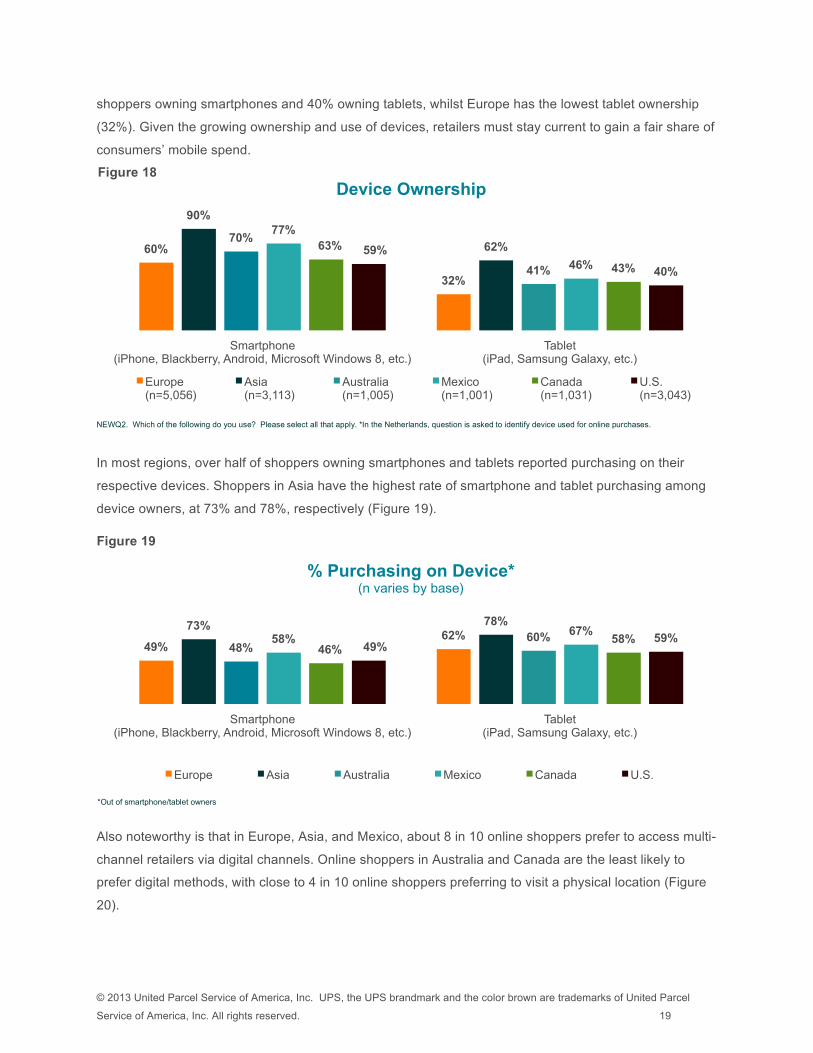
Device ownership varies by country/region (Figure 18), with Asia having the highest penetration of
smartphones (90%) and tablets (62%). The U.S. falls toward the low end of the spectrum, with 59% of
16%
29%
34%
34%
47%
68%
18%
34%
36%
35%
53%
65%
26%
38%
31%
32%
55%
50%
18%
34%
28%
25%
55%
56%
31%
35%
44%
45%
43%
61%
27%
34%
42%
47%
51%
64%
Ability to collect my purchase from a delivery location that is convenient to me
Services that help me track the delivery status of my purchases
Easy returns and exchanges
Free returns
Receiving my product when expected
Free shipping
Drivers of Positive Recommendations
Europe (n=5,593)
Asia (n=3,113)
Australia (n=1,005)
Mexico (n=1,001)
Canada (n=1,031)
U.S. (n=3,043)
Q17. Assuming you are happy with the product you purchased, what service features have actually led you to recommend an online retailer? Select all that apply.
Figure 17
© 2013 United Parcel Service of America, Inc. UPS, the UPS brandmark and the color brown are trademarks of United Parcel
Service of America, Inc. All rights reserved. 19
shoppers owning smartphones and 40% owning tablets, whilst Europe has the lowest tablet ownership
(32%). Given the growing ownership and use of devices, retailers must stay current to gain a fair share of
consumers’ mobile spend.
In most regions, over half of shoppers owning smartphones and tablets reported purchasing on their
respective devices. Shoppers in Asia have the highest rate of smartphone and tablet purchasing among
device owners, at 73% and 78%, respectively (Figure 19).
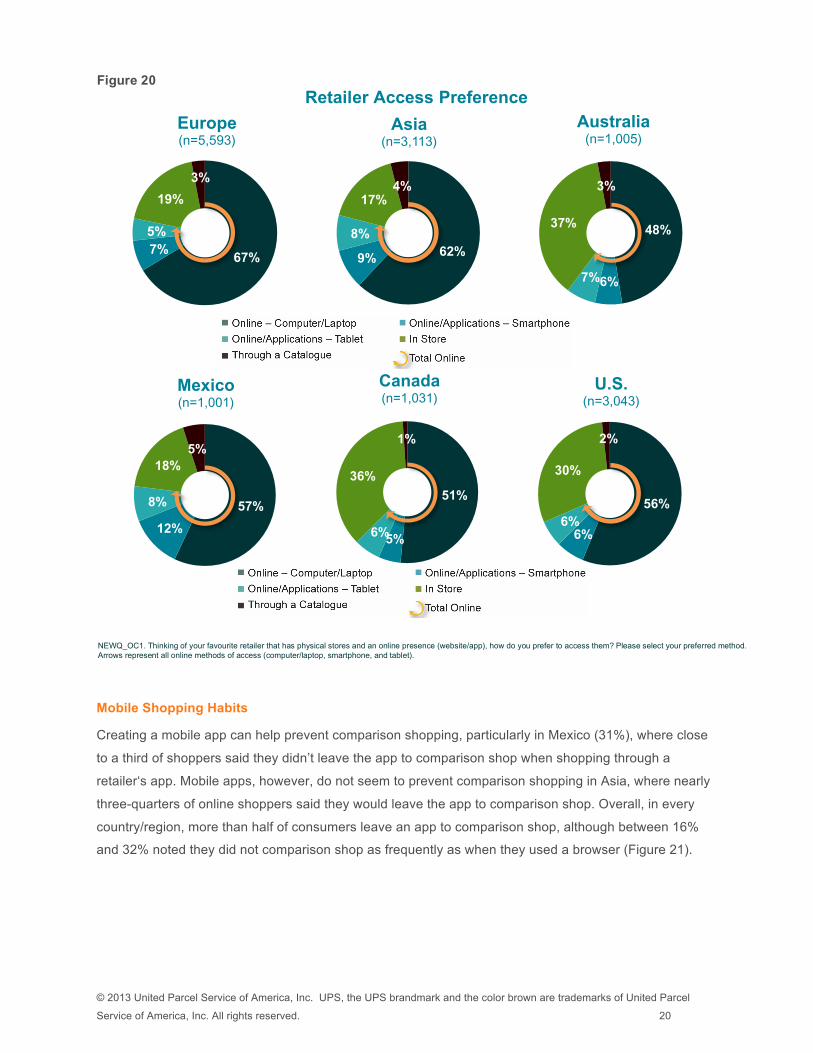
Also noteworthy is that in Europe, Asia, and Mexico, about 8 in 10 online shoppers prefer to access multi-
channel retailers via digital channels. Online shoppers in Australia and Canada are the least likely to
prefer digital methods, with close to 4 in 10 online shoppers preferring to visit a physical location (Figure
20).
60%
32%
90%
62% 70%
41%
77%
46%
63%
43%
59%
40%
Smartphone (iPhone, Blackberry, Android, Microsoft Windows 8, etc.)
Tablet (iPad, Samsung Galaxy, etc.)
Device Ownership
Europe (n=5,056)
Asia (n=3,113)
Australia (n=1,005)
Mexico (n=1,001)
Canada (n=1,031)
U.S. (n=3,043)
49% 62%
73% 78%
48% 60% 58%
67%
46% 58%
49% 59%
Smartphone (iPhone, Blackberry, Android, Microsoft Windows 8, etc.)
Tablet (iPad, Samsung Galaxy, etc.)
% Purchasing on Device* (n varies by base)
Europe
Asia
Australia
Mexico
Canada
U.S.
Figure 19
Figure 18
NEWQ2. Which of the following do you use? Please select all that apply. *In the Netherlands, question is asked to identify device used for online purchases.
*Out of smartphone/tablet owners
© 2013 United Parcel Service of America, Inc. UPS, the UPS brandmark and the color brown are trademarks of United Parcel
Service of America, Inc. All rights reserved. 20
Mobile Shopping Habits
Creating a mobile app can help prevent comparison shopping, particularly in Mexico (31%), where close
to a third of shoppers said they didn’t leave the app to comparison shop when shopping through a
retailer‘s app. Mobile apps, however, do not seem to prevent comparison shopping in Asia, where nearly
three-quarters of online shoppers said they would leave the app to comparison shop. Overall, in every
country/region, more than half of consumers leave an app to comparison shop, although between 16%
and 32% noted they did not comparison shop as frequently as when they used a browser (Figure 21).
67% 7% 5%
19%
3%
Europe (n=5,593)
62% 9%
8%
17% 4%
Asia (n=3,113)
48%
6% 7%
37%
3%
Australia (n=1,005)
57%
12%
8%
18% 5%
Mexico (n=1,001)
51%
5% 6%
36%
1%
Canada (n=1,031)
56%
6% 6%
30%
2%
U.S. (n=3,043)
Figure 20
NEWQ_OC1. Thinking of your favourite retailer that has physical stores and an online presence (website/app), how do you prefer to access them? Please select your preferred method. Arrows represent all online methods of access (computer/laptop, smartphone, and tablet).
Retailer Access Preference
© 2013 United Parcel Service of America, Inc. UPS, the UPS brandmark and the color brown are trademarks of United Parcel
Service of America, Inc. All rights reserved. 21
In addition, a mobile app allows retailers to provide targeted social/deal services according to the user’s
location. Interest in this functionality spans across regions, but is most prominent in Mexico and the U.S.,
where 67% and 60% of online shoppers said they would like to have this functionality, versus 50% in
Canada, 47% in Asia and 46% in Europe.
Improving apps, particularly in terms of facilitating the browsing and transaction processes, can help
retailers reduce resistance from customers and improve mobile conversion. With the inclusion of value-
added features that leverage what’s unique about the mobile medium, namely location-enabled services,
retailers can significantly enhance their customers’ mobile experience.
Social Commerce
The social media component of the survey reveals insights about how and why consumers engage with
retail brands through various channels. Figure 22 demonstrates the shift in modes of access for social
networking sites by consumers. The amount of time spent on social media sites on personal computers
has declined from May 2012 to May 2013, while time spent with social media on smartphones has more
than doubled.
44% 58%
37% 29%
42% 42%
25%
16%
27% 32%
29% 23%
19% 20%
20% 31% 17% 23%
12% 6% 16%
8% 13% 12%
Europe (n=1,852)
Asia (n=2,266)
Australia (n=333)
Mexico (n=567)
Canada (n=408)
U.S. (n=782)
App-Based Mobile Comparison Shopping I only use browsers
No - don't leave app to comparison shop
Not as frequently as I do when I shop within a web browser Yes - leave app to comparison shop
NEWQ_MOB1. When you shop within a retailer’s mobile app, do you leave that app to comparison shop across other retailers?
Figure 21
© 2013 United Parcel Service of America, Inc. UPS, the UPS brandmark and the color brown are trademarks of United Parcel
Service of America, Inc. All rights reserved. 22
Consumer Engagement through Social Media
Of the shoppers surveyed, the majority indicated using at least one social media site. Facebook is the
dominant player by a considerable margin and the sites ranked below Facebook vary by country/region.
In China, local sites including Sina Weibo and QQ Weibo are used most often. Facebook provides a
means for retailers to engage with online shoppers. “Liking” brands through Facebook is popular across
countries/regions, but is most prominent in Asia and Mexico, at 81% and 76%, respectively (Figure 23).
Just under half of consumers in Europe engage with retailers by liking their brand on Facebook.
Those who “like” a brand on Facebook do so for various reasons, with a significant number of shoppers
saying that retailers occasionally offer special promotions for Facebook “fans” (Figure 24). The majority in
73.4 62.6
52.7 115.2
-
17.4
May 2012 May 2013
Minutes Spent on Social Media Sites (in Billions) (U.S.)
Tablet*
Smartphone**
PC
45%
81%
62%
76%
58% 66%
Europe (n=3,857)
Asia* (n=1,817)
Australia (n=689)
Mexico (n=918)
Canada (n=822)
United States (n=2,327)
"Like" Retailer on Facebook
Figure 22
Source: comScore Media Metrix and Mobile Metrix *Tablet includes iPad only. **Smartphone includes iPhone and Android phone platforms.
+119%
-‐15%
SM2. Do you `Like` any retailers on Facebook? *Asia excludes China.
Figure 23
© 2013 United Parcel Service of America, Inc. UPS, the UPS brandmark and the color brown are trademarks of United Parcel
Service of America, Inc. All rights reserved. 23
all countries pay at least some attention to Facebook updates from retailers (Figure 25). This finding
highlights the importance of Facebook as a marketing channel for retailers given its combination of
audience reach and engagement with promotional content.
20%
32% 31%
48% 46%
26%
41% 44%
59%
53%
30% 26%
35%
45%
55%
16%
38%
29%
44%
49%
29%
23%
39% 39%
60%
32%
25%
47%
36%
60%
I am a fan of all (or most) brands that I am
associated with
I like to actively voice my opinion to the
brand on Facebook
The retailer incentivised me to “Like” its Facebook
page/application
I find it’s an easy way to stay up to date with
a retailer
The retailer occasionally offers
special promotions for its Facebook fans
Reasons for “Liking” a Retailer/Brand on Facebook
Europe (n=1,744)
Asia (n=1,477)
Australia (n=420)
Mexico (n=693)
Canada (n=480)
U.S. (n=1,493)
34% 37% 25% 53%
26% 34%
52% 57% 61%
43%
61% 52%
Europe (n=1,744)
Asia (n=664)
Australia (n=420)
Mexico (n=693)
Canada (n=480)
U.S. (n=1,493)
Amount of Attention Paid to Retailer’s Updates
I pay a little attention to updates (i.e., I briefly skim for information)
I pay a lot of attention (i.e., I read the update as if it were from one of my friends)
86% 94% 86% 96% 87% 86%
Europe (n=1,744)
Asia (n=664)
Australia (n=420)
Mexico (n=693)
Canada (n=480)
U.S. (n=1,493)
Pay Attention to Retailer's Facebook Newsfeed
SM3. Why did you decide to “Like” a retailer/brand on Facebook? Please select all that apply.
Figure 24
Figure 25
SM4. When you see updates from the retailer on your Facebook newsfeed, how much attention do you generally devote to the update?
© 2013 United Parcel Service of America, Inc. UPS, the UPS brandmark and the color brown are trademarks of United Parcel
Service of America, Inc. All rights reserved. 24
Consumers Seek an Integrated Experience across Retailer Channels
When examining aspects driving likelihood to shop with a retailer, there is a preference for retailers who
deliver integrated omnichannel options. Across all regions, the single most important factor is the ability to
buy online and return at the store (Figure 26). When compared to other areas surveyed, shoppers in
Mexico are the ones most actively looking for integrated experiences across retailer channels.
Many consumers indicated that offering the ability to buy online and collect in-store made them more
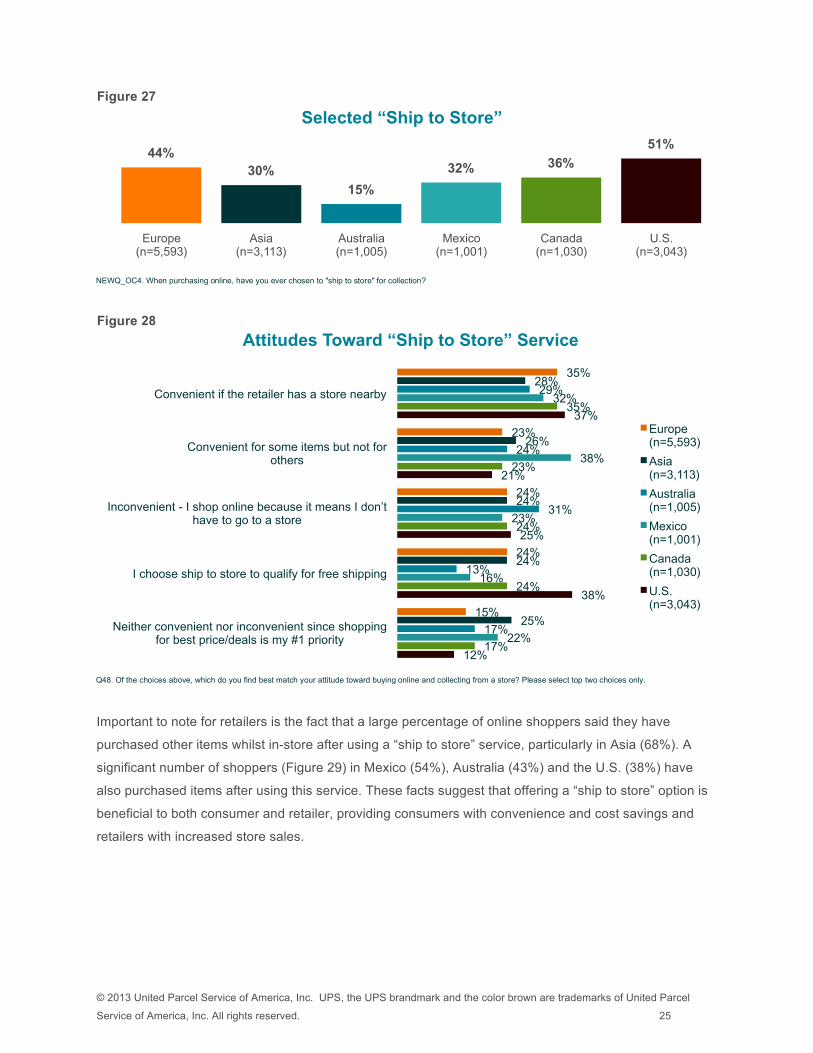
likely to shop with a retailer. The U.S. leads in “ship to store” usage at 51%, followed by Europe at 44%,
while around a third of online shoppers in other countries/regions have selected “ship to store” (Figure
27). Most online shoppers find the “ship to store” option to be convenient, although attitudes vary by
region. 38% of shoppers in Mexico said “ship to store” was convenient for some items but not others,
while 38% of shoppers in the U.S. said they chose “ship to store” to qualify for free shipping (Figure 28).
23%
37%
36%
41%
47%
40%
44%
62%
26%
28%
26%
33%
36%
42%
49%
65%
53%
52%
51%
56%
62%
60%
56%
67%
22%
22%
26%
30%
27%
36%
38%
56%
41%
38%
38%
45%
43%
46%
45%
51%
24%
27%
28%
36%
37%
40%
41%
52%
The ability to start a purchase online and then complete the purchase in-store or through the
retailer's smartphone/tablet app
The ability to complete a purchase in-store using mobile device
The availability of a mobile app for a smartphone
The availability of an app designed specifically for a tablet
The push of a coupon/promotion to my smartphone because the retailer knows I’m in-
store or close by
The option to conduct one-click checkout online
The ability to buy online and collect in-store
The ability to buy online and then make returns at the store
Aspects Driving Likelihood to Shop with a Retailer
Europe (n=5,593)
Asia (n=3,113)
Australia (n=1,005)
Mexico (n=1,001)
Canada (n=1,031)
U.S. (n=3,043)
Figure 26
NEWQ_OC3. On a scale of 1 to 7, how likely would you be to shop with a retailer if the following were made available to you? (Top Two Boxes)
© 2013 United Parcel Service of America, Inc. UPS, the UPS brandmark and the color brown are trademarks of United Parcel
Service of America, Inc. All rights reserved. 25
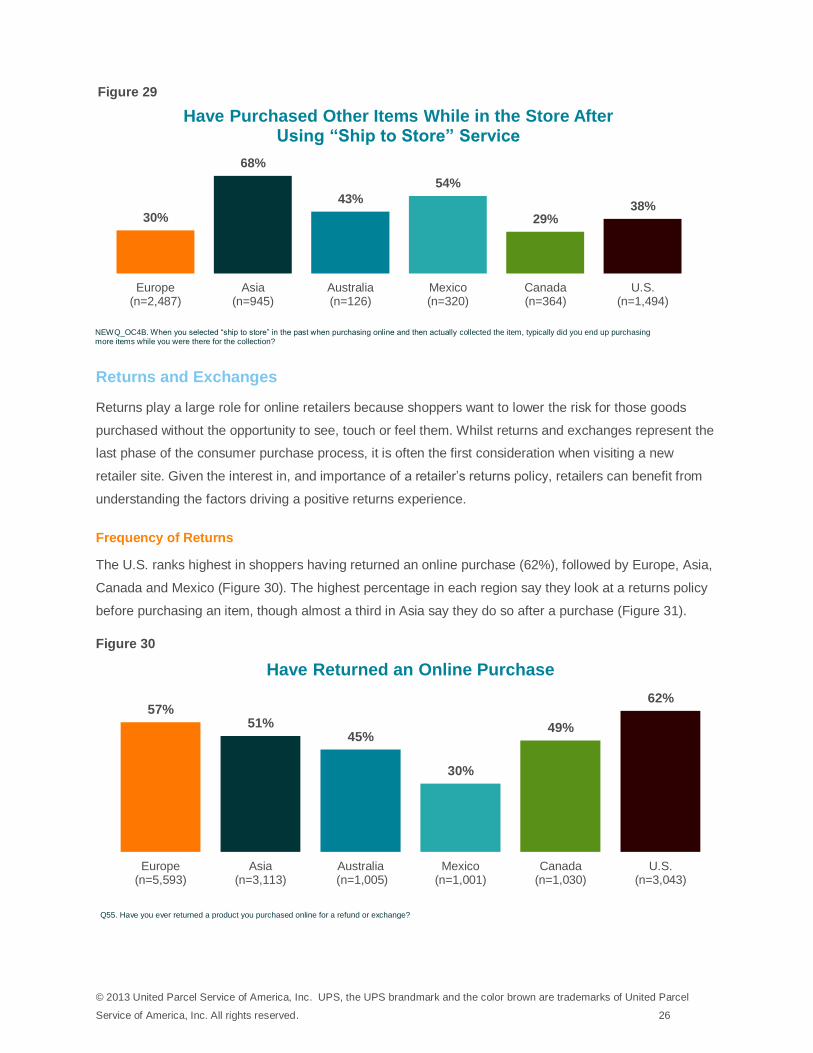
Important to note for retailers is the fact that a large percentage of online shoppers said they have
purchased other items whilst in-store after using a “ship to store” service, particularly in Asia (68%). A
significant number of shoppers (Figure 29) in Mexico (54%), Australia (43%) and the U.S. (38%) have
also purchased items after using this service. These facts suggest that offering a “ship to store” option is
beneficial to both consumer and retailer, providing consumers with convenience and cost savings and
retailers with increased store sales.
44% 30%
15%
32% 36%
51%
Europe (n=5,593)
Asia (n=3,113)
Australia (n=1,005)
Mexico (n=1,001)
Canada (n=1,030)
U.S. (n=3,043)
Selected “Ship to Store”
12%
38%
25%
21%
37%
17%
24%
24%
23%
35%
22%
16%
23%
38%
32%
17%
13%
31%
24%
29%
25%
24%
24%
26%
28%
15%
24%
24%
23%
35%
Neither convenient nor inconvenient since shopping for best price/deals is my #1 priority
I choose ship to store to qualify for free shipping
Inconvenient - I shop online because it means I don’t have to go to a store
Convenient for some items but not for others
Convenient if the retailer has a store nearby
Attitudes Toward “Ship to Store” Service
Europe (n=5,593)
Asia (n=3,113)
Australia (n=1,005)
Mexico (n=1,001)
Canada (n=1,030)
U.S. (n=3,043)
Figure 28
Q48. Of the choices above, which do you find best match your attitude toward buying online and collecting from a store? Please select top two choices only.
Figure 27
NEWQ_OC4. When purchasing online, have you ever chosen to "ship to store" for collection?
© 2013 United Parcel Service of America, Inc. UPS, the UPS brandmark and the color brown are trademarks of United Parcel
Service of America, Inc. All rights reserved. 26
Returns and Exchanges
Returns play a large role for online retailers because shoppers want to lower the risk for those goods
purchased without the opportunity to see, touch or feel them. Whilst returns and exchanges represent the
last phase of the consumer purchase process, it is often the first consideration when visiting a new
retailer site. Given the interest in, and importance of a retailer’s returns policy, retailers can benefit from
understanding the factors driving a positive returns experience.
Frequency of Returns
The U.S. ranks highest in shoppers having returned an online purchase (62%), followed by Europe, Asia,
Canada and Mexico (Figure 30). The highest percentage in each region say they look at a returns policy
before purchasing an item, though almost a third in Asia say they do so after a purchase (Figure 31).
30%
68%
43%
54%
29% 38%
Europe(n=2,487)
Asia(n=945)
Australia(n=126)
Mexico(n=320)
Canada(n=364)
U.S.(n=1,494)
Have Purchased Other Items While in the Store After Using “Ship to Store” Service
57% 51%
45%
30%
49%
62%
Europe(n=5,593)
Asia(n=3,113)
Australia (n=1,005)
Mexico(n=1,001)
Canada(n=1,030)
U.S.(n=3,043)
Have Returned an Online Purchase
Figure 29
NEWQ_OC4B. When you selected “ship to store” in the past when purchasing online and then actually collected the item, typically did you end up purchasing more items while you were there for the collection?
Q55. Have you ever returned a product you purchased online for a refund or exchange?
Figure 30
© 2013 United Parcel Service of America, Inc. UPS, the UPS brandmark and the color brown are trademarks of United Parcel
Service of America, Inc. All rights reserved. 27
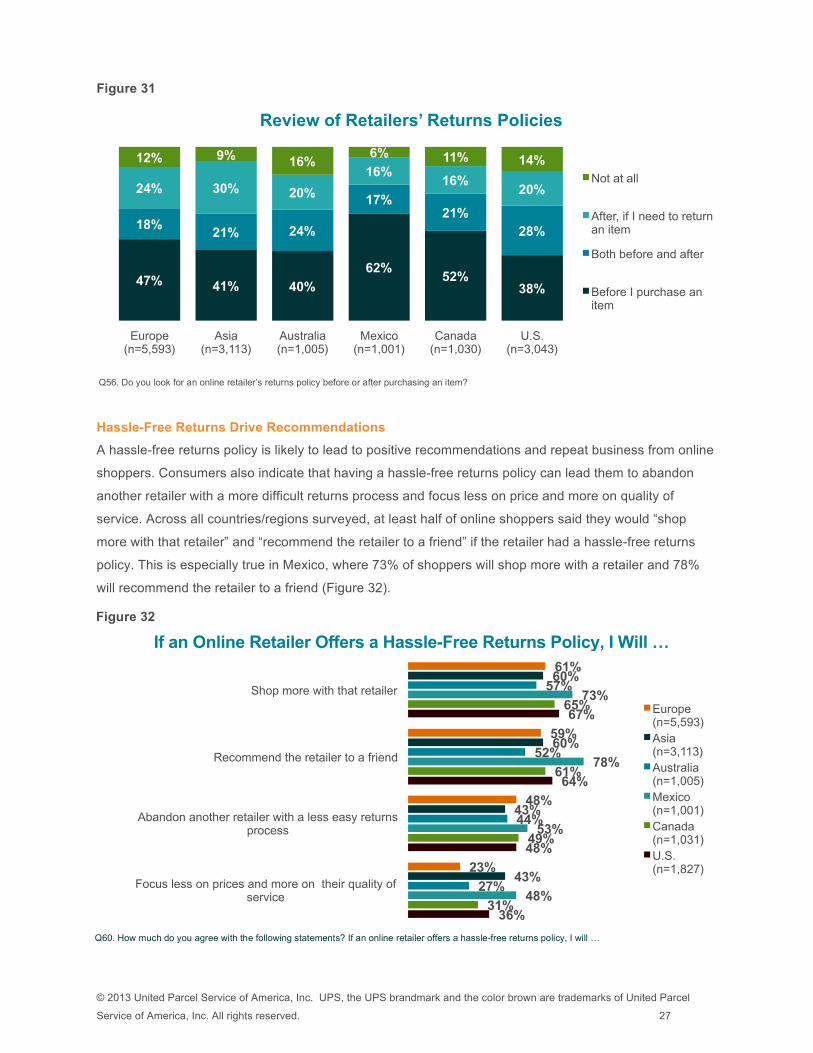
Hassle-Free Returns Drive Recommendations A hassle-free returns policy is likely to lead to positive recommendations and repeat business from online
shoppers. Consumers also indicate that having a hassle-free returns policy can lead them to abandon
another retailer with a more difficult returns process and focus less on price and more on quality of
service. Across all countries/regions surveyed, at least half of online shoppers said they would “shop
more with that retailer” and “recommend the retailer to a friend” if the retailer had a hassle-free returns
policy. This is especially true in Mexico, where 73% of shoppers will shop more with a retailer and 78%
will recommend the retailer to a friend (Figure 32).
47% 41% 40%
62% 52%
38%
18% 21% 24%
17% 21%
28%
24% 30% 20%
16% 16%
20%
12% 9% 16% 6% 11% 14%
Europe (n=5,593)
Asia (n=3,113)
Australia (n=1,005)
Mexico (n=1,001)
Canada (n=1,030)
U.S. (n=3,043)
Review of Retailers’ Returns Policies
Not at all
After, if I need to return an item
Both before and after
Before I purchase an item
36%
48%
64%
67%
31%
49%
61%
65%
48%
53%
78%
73%
27%
44%
52%
57%
43%
43%
60%
60%
23%
48%
59%
61%
Focus less on prices and more on their quality of service
Abandon another retailer with a less easy returns process
Recommend the retailer to a friend
Shop more with that retailer
Europe (n=5,593) Asia (n=3,113) Australia (n=1,005) Mexico (n=1,001) Canada (n=1,031) U.S. (n=1,827)
If an Online Retailer Offers a Hassle-Free Returns Policy, I Will …
Figure 32
Q60. How much do you agree with the following statements? If an online retailer offers a hassle-free returns policy, I will …
Q56. Do you look for an online retailer’s returns policy before or after purchasing an item?
Figure 31
© 2013 United Parcel Service of America, Inc. UPS, the UPS brandmark and the color brown are trademarks of United Parcel
Service of America, Inc. All rights reserved. 28
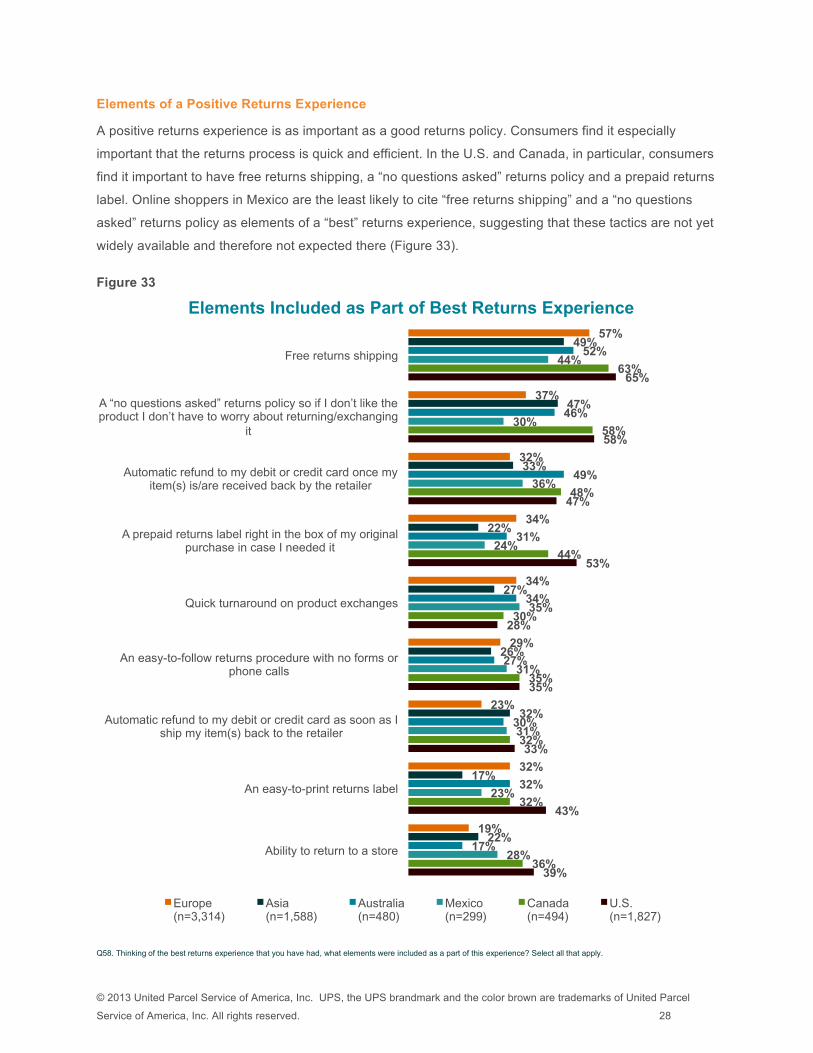
Elements of a Positive Returns Experience
A positive returns experience is as important as a good returns policy. Consumers find it especially
important that the returns process is quick and efficient. In the U.S. and Canada, in particular, consumers
find it important to have free returns shipping, a “no questions asked” returns policy and a prepaid returns
label. Online shoppers in Mexico are the least likely to cite “free returns shipping” and a “no questions
asked” returns policy as elements of a “best” returns experience, suggesting that these tactics are not yet
widely available and therefore not expected there (Figure 33).
39%
43%
33%
35%
28%
53%
47%
58%
65%
36%
32%
32%
35%
30%
44%
48%
58%
63%
28%
23%
31%
31%
35%
24%
36%
30%
44%
17%
32%
30%
27%
34%
31%
49%
46%
52%
22%
17%
32%
26%
27%
22%
33%
47%
49%
19%
32%
23%
29%
34%
34%
32%
37%
57%
Ability to return to a store
An easy-to-print returns label
Automatic refund to my debit or credit card as soon as I ship my item(s) back to the retailer
An easy-to-follow returns procedure with no forms or phone calls
Quick turnaround on product exchanges
A prepaid returns label right in the box of my original purchase in case I needed it
Automatic refund to my debit or credit card once my item(s) is/are received back by the retailer
A “no questions asked” returns policy so if I don’t like the product I don’t have to worry about returning/exchanging
it
Free returns shipping
Elements Included as Part of Best Returns Experience
Europe (n=3,314)
Asia (n=1,588)
Australia (n=480)
Mexico (n=299)
Canada (n=494)
U.S. (n=1,827)
Q58. Thinking of the best returns experience that you have had, what elements were included as a part of this experience? Select all that apply.
Figure 33
© 2013 United Parcel Service of America, Inc. UPS, the UPS brandmark and the color brown are trademarks of United Parcel
Service of America, Inc. All rights reserved. 29
Conclusions
For retailers seeking to win over online consumers worldwide, this study reveals some universal
preferences and behaviours of online shoppers globally, as well as some important regional differences.
Most importantly, it reveals actionable information for retailers to better engage shoppers across all
phases of the online shopping experience – from pre-purchase to purchase and delivery to post-
purchase.
Pre-purchase:
For online shoppers in all countries/regions, the preferred method of accessing retailers is through digital
channels, primarily via personal computers/laptops. With the growing penetration of smartphones and
tablets, shopping activity on mobile devices is increasing, making it more important for retailers to give
consumers the ability to use any of their devices to address shipping needs. At least half of tablet owners
in every country/region surveyed have used their tablet to purchase goods online, with this percentage
reaching 78% in Asia and 67% in Mexico.
Purchase and Delivery:
When it comes to purchase and delivery, consumers around the world want to know their options up-
front, especially around total costs of online purchases. The number one reason for cart abandonment in
every country/region surveyed except Asia is that shipping costs increased the total purchase cost more
than expected. Many shoppers also report abandoning a cart because they are not ready to purchase,
but want to get an idea of total shipping costs and/or save the cart for later.
Excessive shipping time is also a driving factor in cart abandonment, particularly in Mexico and Asia,
where 70% and 65% of shoppers respectively have abandoned a cart due to excessive shipping time or
time not provided. Whilst offering free shipping is important, retailers can also benefit from having a
variety of shipping options/times and providing these options early on in the process. Offering “ship to
store” is a good way for retailers to provide a “free” delivery option for consumers with the added benefit
of driving store sales.
Post-purchase:
The most critical aspect of the post-purchase experience – and a key driver of the overall online shopping
customer experience − is returns. Retailers that offer a hassle-free returns process can increase
consumer satisfaction and drive repeat business. Over half of shoppers in Europe, Asia, and the U.S.
have returned an online purchase. Additionally, in Canada, Mexico and Australia, the majority of shoppers
said they would shop more with a retailer and recommend the retailer to a friend if the retailer offers a
hassle-free returns policy. Whilst free shipping for returns is the most often cited element included as part
of a shopper’s best returns experience, other features such as a “no questions asked” returns policy, a
© 2013 United Parcel Service of America, Inc. UPS, the UPS brandmark and the color brown are trademarks of United Parcel
Service of America, Inc. All rights reserved. 30
prepaid returns label included with the original purchase and an automatic credit/debit card refund are
important as well.
In addition, shoppers globally recognise the importance of mobile tracking services and consumers in
Asia and Mexico in particular emphasise the ability to receive status updates and track shipments through
a mobile device.
Across all aspects of the online shopping experience, retailers can win shoppers over by:
Globally:
• Facilitating a seamless omnichannel experience
• Providing information on delivery options and shipping costs up-front
• Providing tracking information and keeping shoppers informed proactively on delivery status
• Delivering products when expected
• Enabling a “hassle-free” returns experience in the shopper’s channel of choice
Asia Pacific
• Tailoring offerings for a strong and growing base of mobile and social consumers
• Enabling omnichannel experience, especially in Asia, but not as critical in Australia
Europe
• Meeting delivery timing expectations based on package origin as well as providing flexibility for
delivery dates
• Improving the post-purchase experience, especially returns and the flexibility of delivery options
Canada
• Catering to cost- and time-conscious consumers
• Having a clear and transparent returns policy
Mexico
• Facilitating convenient and affordable cross-border shopping
• Demonstrating shipping and delivery reliability
U.S.
• Providing information on shipping and delivery options up-front
• Having a clear and easy to understand returns policy
© 2013 United Parcel Service of America, Inc. UPS, the UPS brandmark and the color brown are trademarks of United Parcel
Service of America, Inc. All rights reserved. 31
About comScore, Inc. comScore, Inc. (NASDAQ: SCOR) is a global leader in digital measurement and analytics, delivering
insights on web, mobile and TV consumer behaviour that enable clients to maximise the value of their
digital investments. A preferred source of digital audience measurement, comScore offers a variety of on-
demand software and custom services within its four analytics pillars: Audience Analytics, Advertising
Analytics, Digital Business Analytics and Mobile Operator Analytics. By leveraging a world-class
technology infrastructure, the comScore Census Network™ (CCN) captures trillions of digital interactions
a month to power big data analytics on a global scale for its more than 2,000 clients, which include
leading companies such as AOL, Baidu, BBC, Best Buy, Carat, Deutsche Bank, ESPN, France Telecom,
Financial Times, Fox, LinkedIn, Microsoft, MediaCorp, Nestle, Starcom, Terra Networks, Universal
McCann, Verizon, ViaMichelin and Yahoo!. For more information, please visit www.comscore.com.
About UPS UPS (NYSE: UPS) is a global leader in logistics, offering a broad range of solutions for the transportation
of packages and freight, including innovative delivery options for the global consumer market, the
facilitation of international trade and the deployment of advanced technology to more efficiently manage
the world of business. Headquartered in Atlanta, UPS serves more than 220 countries and territories
worldwide.
For more information, please contact:
Susan Engleson Melanie Alavi
comScore, Inc. UPS
703-234-2625 404-828-7374
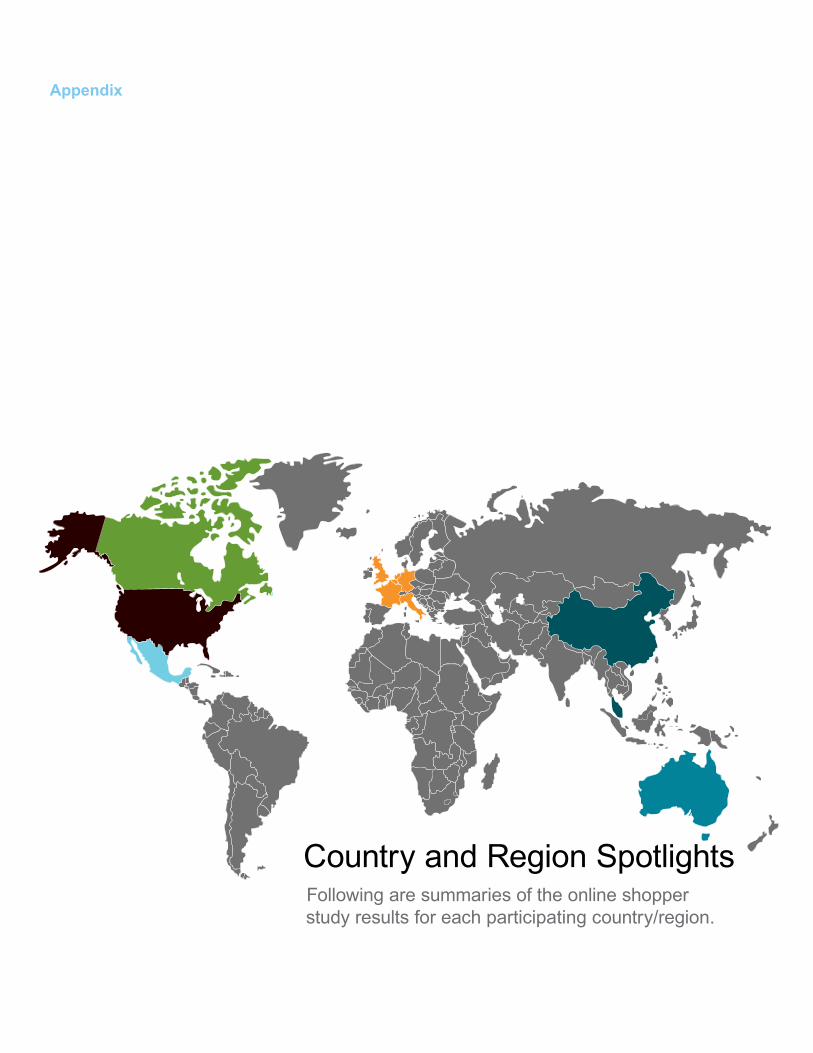
Country and Region SpotlightsFollowing are summaries of the online shopper study results for each participating country/region.
Appendix
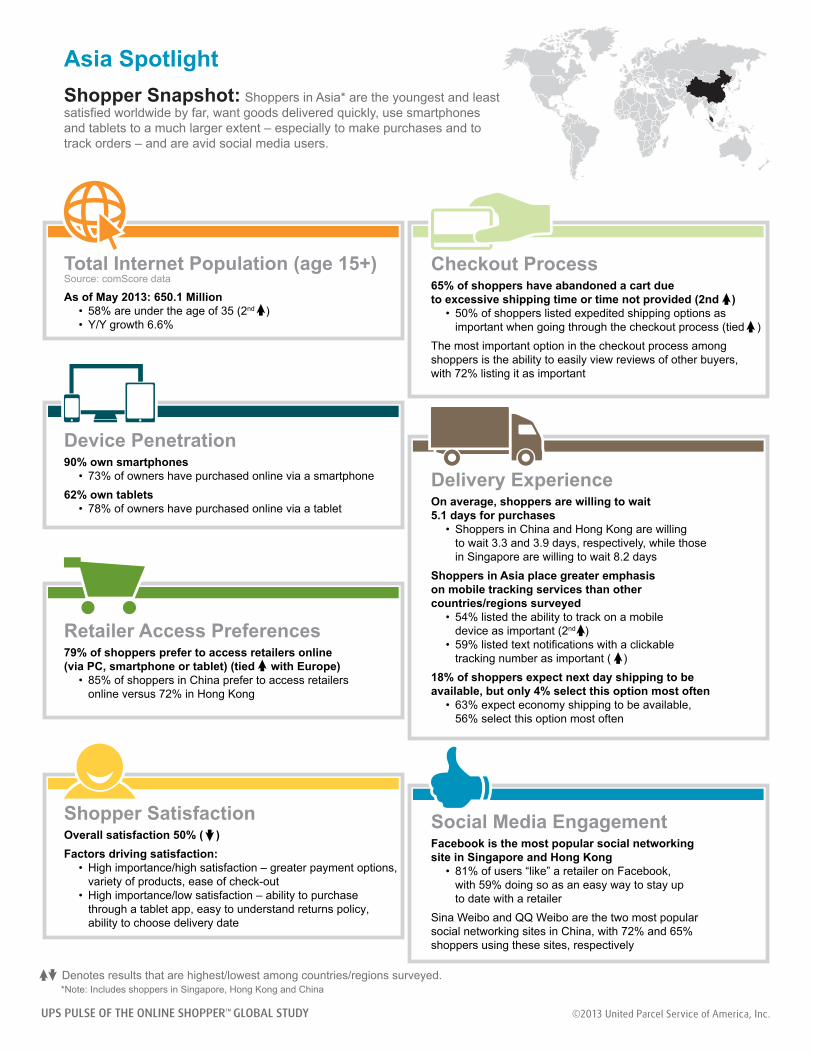
Device Penetration90% own smartphones
• 73% of owners have purchased online via a smartphone
62% own tablets• 78% of owners have purchased online via a tablet
Retailer Access Preferences79% of shoppers prefer to access retailers online (via PC, smartphone or tablet) (tied with Europe)
• 85% of shoppers in China prefer to access retailers online versus 72% in Hong Kong
Shopper Satisfaction
Checkout Process
Delivery Experience
Social Media EngagementFacebook is the most popular social networking site in Singapore and Hong Kong
• 81% of users “like” a retailer on Facebook, with 59% doing so as an easy way to stay up to date with a retailer
Sina Weibo and QQ Weibo are the two most popular social networking sites in China, with 72% and 65% shoppers using these sites, respectively
Shopper Snapshot: Shoppers in Asia* are the youngest and least satisfied worldwide by far, want goods delivered quickly, use smartphones and tablets to a much larger extent – especially to make purchases and totrack orders – and are avid social media users.
Asia Spotlight
As of May 2013: 650.1 Million• 58% are under the age of 35 (2nd ) • Y/Y growth 6.6%
Overall satisfaction 50% ( )
Factors driving satisfaction:• High importance/high satisfaction – greater payment options, variety of products, ease of check-out• High importance/low satisfaction – ability to purchase through a tablet app, easy to understand returns policy, ability to choose delivery date
65% of shoppers have abandoned a cart due to excessive shipping time or time not provided (2nd )
• 50% of shoppers listed expedited shipping options as important when going through the checkout process (tied )
The most important option in the checkout process among shoppers is the ability to easily view reviews of other buyers, with 72% listing it as important
On average, shoppers are willing to wait 5.1 days for purchases
• Shoppers in China and Hong Kong are willing to wait 3.3 and 3.9 days, respectively, while those in Singapore are willing to wait 8.2 days
Shoppers in Asia place greater emphasis on mobile tracking services than other countries/regions surveyed
• 54% listed the ability to track on a mobile device as important (2nd )• 59% listed text notifications with a clickable tracking number as important ( )
18% of shoppers expect next day shipping to be available, but only 4% select this option most often
• 63% expect economy shipping to be available, 56% select this option most often
*Note: Includes shoppers in Singapore, Hong Kong and China
Denotes results that are highest/lowest among countries/regions surveyed.
Total Internet Population (age 15+)Source: comScore data
UPS PULSE OF THE ONLINE SHOPPER™ GLOBAL STUDY ©2013 United Parcel Service of America, Inc.
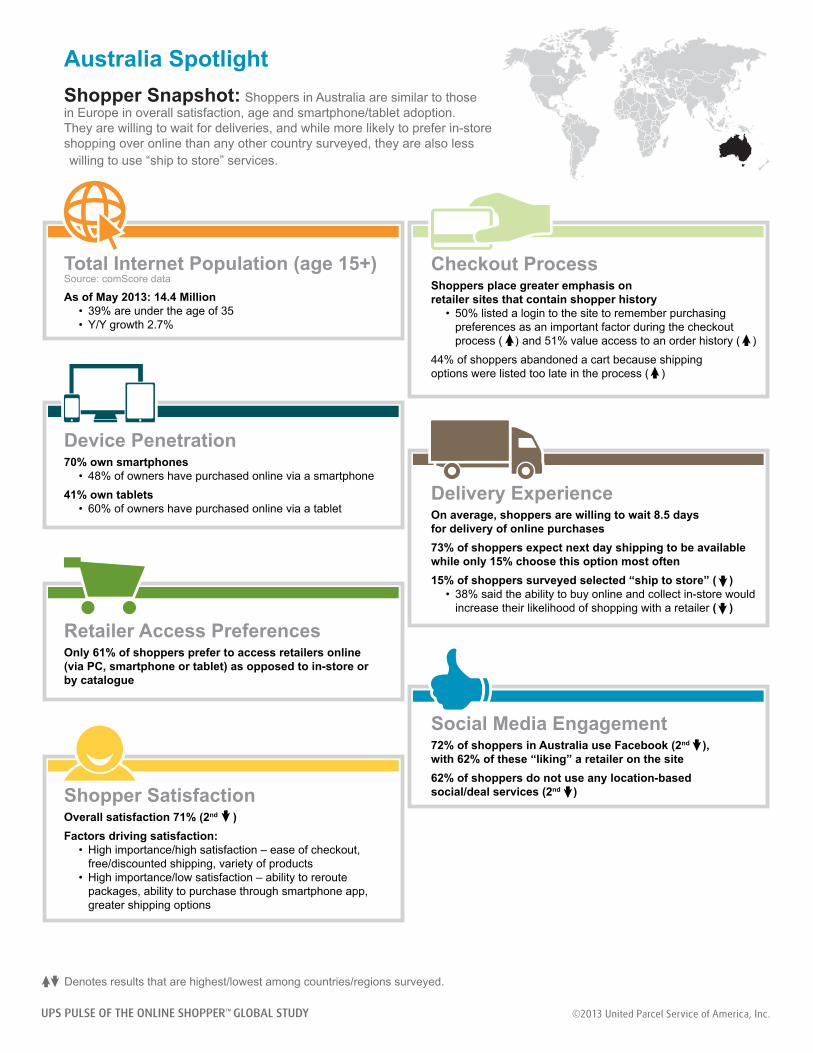
Total Internet Population (age 15+)Source: comScore data
Device Penetration70% own smartphones
• 48% of owners have purchased online via a smartphone
41% own tablets• 60% of owners have purchased online via a tablet
Retailer Access PreferencesOnly 61% of shoppers prefer to access retailers online(via PC, smartphone or tablet) as opposed to in-store orby catalogue
Shopper Satisfaction
Checkout Process
Delivery Experience
Social Media Engagement72% of shoppers in Australia use Facebook (2nd ), with 62% of these “liking” a retailer on the site
62% of shoppers do not use any location-based social/deal services (2nd )
Shopper Snapshot: Shoppers in Australia are similar to thosein Europe in overall satisfaction, age and smartphone/tablet adoption. They are willing to wait for deliveries, and while more likely to prefer in-store shopping over online than any other country surveyed, they are also less willing to use “ship to store” services.
Australia Spotlight
As of May 2013: 14.4 Million• 39% are under the age of 35• Y/Y growth 2.7%
Overall satisfaction 71% (2nd )
Factors driving satisfaction:• High importance/high satisfaction – ease of checkout, free/discounted shipping, variety of products• High importance/low satisfaction – ability to reroute packages, ability to purchase through smartphone app, greater shipping options
Shoppers place greater emphasis on retailer sites that contain shopper history
• 50% listed a login to the site to remember purchasing preferences as an important factor during the checkout process ( ) and 51% value access to an order history ( )
44% of shoppers abandoned a cart because shipping options were listed too late in the process ( )
On average, shoppers are willing to wait 8.5 days for delivery of online purchases
73% of shoppers expect next day shipping to be available while only 15% choose this option most often
15% of shoppers surveyed selected “ship to store” ( )• 38% said the ability to buy online and collect in-store would increase their likelihood of shopping with a retailer ( )
Denotes results that are highest/lowest among countries/regions surveyed.
UPS PULSE OF THE ONLINE SHOPPER™ GLOBAL STUDY ©2013 United Parcel Service of America, Inc.
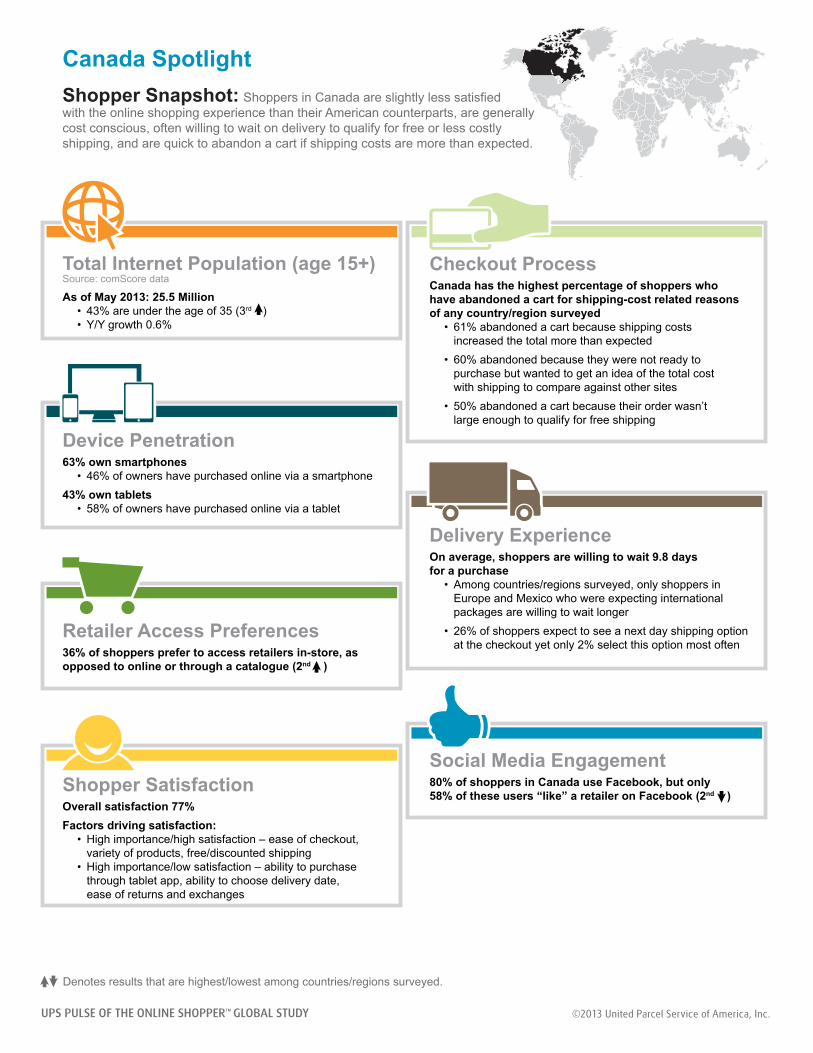
Total Internet Population (age 15+)Source: comScore data
Device Penetration63% own smartphones
• 46% of owners have purchased online via a smartphone
43% own tablets• 58% of owners have purchased online via a tablet
Retailer Access Preferences36% of shoppers prefer to access retailers in-store, as opposed to online or through a catalogue (2nd )
Shopper Satisfaction
Checkout Process
Delivery Experience
Social Media Engagement80% of shoppers in Canada use Facebook, but only 58% of these users “like” a retailer on Facebook (2nd )
Shopper Snapshot: Shoppers in Canada are slightly less satisfied with the online shopping experience than their American counterparts, are generally cost conscious, often willing to wait on delivery to qualify for free or less costly shipping, and are quick to abandon a cart if shipping costs are more than expected.
Canada Spotlight
As of May 2013: 25.5 Million• 43% are under the age of 35 (3rd )• Y/Y growth 0.6%
Overall satisfaction 77%
Factors driving satisfaction:• High importance/high satisfaction – ease of checkout, variety of products, free/discounted shipping• High importance/low satisfaction – ability to purchase through tablet app, ability to choose delivery date, ease of returns and exchanges
Canada has the highest percentage of shoppers who have abandoned a cart for shipping-cost related reasons of any country/region surveyed
• 61% abandoned a cart because shipping costs increased the total more than expected
• 60% abandoned because they were not ready to purchase but wanted to get an idea of the total cost with shipping to compare against other sites
• 50% abandoned a cart because their order wasn’t large enough to qualify for free shipping
On average, shoppers are willing to wait 9.8 days for a purchase
• Among countries/regions surveyed, only shoppers in Europe and Mexico who were expecting international packages are willing to wait longer
• 26% of shoppers expect to see a next day shipping option at the checkout yet only 2% select this option most often
Denotes results that are highest/lowest among countries/regions surveyed.
UPS PULSE OF THE ONLINE SHOPPER™ GLOBAL STUDY ©2013 United Parcel Service of America, Inc.
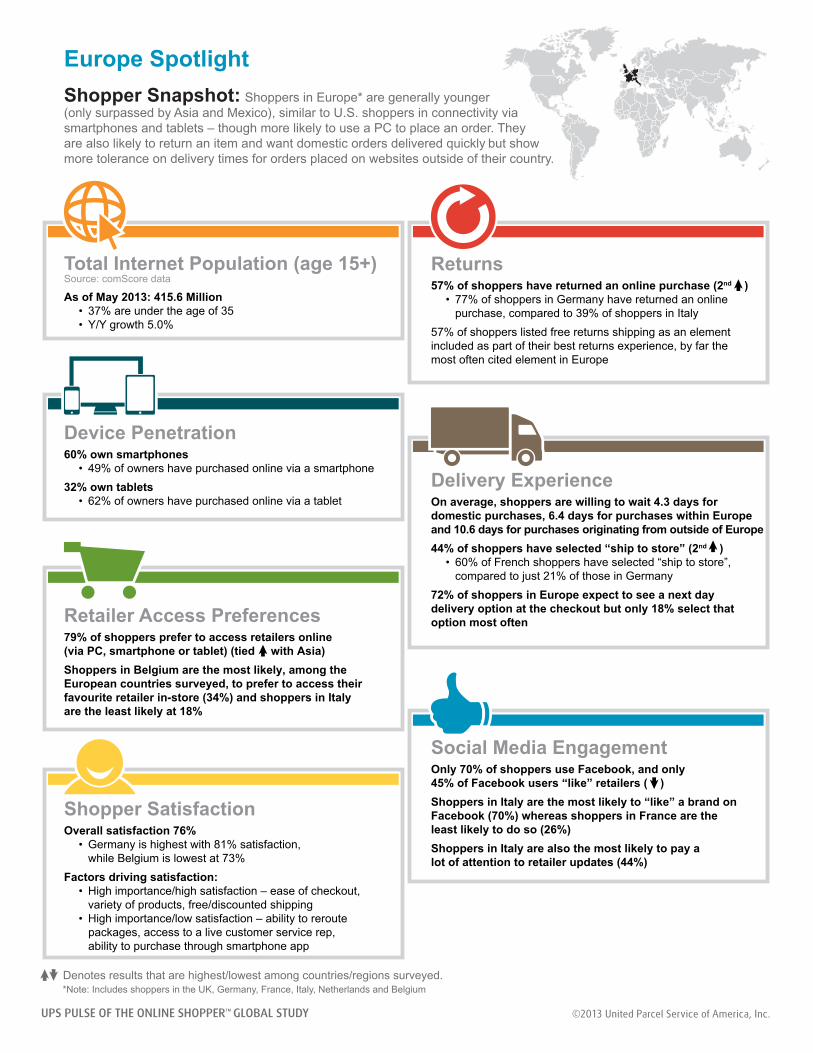
Total Internet Population (age 15+)Source: comScore data
Device Penetration60% own smartphones
• 49% of owners have purchased online via a smartphone
32% own tablets• 62% of owners have purchased online via a tablet
Retailer Access Preferences79% of shoppers prefer to access retailers online (via PC, smartphone or tablet) (tied with Asia)
Shoppers in Belgium are the most likely, among theEuropean countries surveyed, to prefer to access theirfavourite retailer in-store (34%) and shoppers in Italyare the least likely at 18%
Shopper Satisfaction
Returns
Delivery Experience
Social Media EngagementOnly 70% of shoppers use Facebook, and only 45% of Facebook users “like” retailers ( )
Shoppers in Italy are the most likely to “like” a brand onFacebook (70%) whereas shoppers in France are the least likely to do so (26%)
Shoppers in Italy are also the most likely to pay a lot of attention to retailer updates (44%)
Shopper Snapshot: Shoppers in Europe* are generally younger (only surpassed by Asia and Mexico), similar to U.S. shoppers in connectivity via smartphones and tablets – though more likely to use a PC to place an order. They are also likely to return an item and want domestic orders delivered quickly but show more tolerance on delivery times for orders placed on websites outside of their country.
Europe Spotlight
As of May 2013: 415.6 Million• 37% are under the age of 35• Y/Y growth 5.0%
Overall satisfaction 76% • Germany is highest with 81% satisfaction, while Belgium is lowest at 73%
Factors driving satisfaction:• High importance/high satisfaction – ease of checkout, variety of products, free/discounted shipping• High importance/low satisfaction – ability to reroute packages, access to a live customer service rep, ability to purchase through smartphone app
57% of shoppers have returned an online purchase (2nd )• 77% of shoppers in Germany have returned an online purchase, compared to 39% of shoppers in Italy
57% of shoppers listed free returns shipping as an element included as part of their best returns experience, by far the most often cited element in Europe
On average, shoppers are willing to wait 4.3 days for domestic purchases, 6.4 days for purchases within Europe and 10.6 days for purchases originating from outside of Europe
44% of shoppers have selected “ship to store” (2nd )• 60% of French shoppers have selected “ship to store”, compared to just 21% of those in Germany
72% of shoppers in Europe expect to see a next day delivery option at the checkout but only 18% select thatoption most often
*Note: Includes shoppers in the UK, Germany, France, Italy, Netherlands and Belgium
Denotes results that are highest/lowest among countries/regions surveyed.
UPS PULSE OF THE ONLINE SHOPPER™ GLOBAL STUDY ©2013 United Parcel Service of America, Inc.
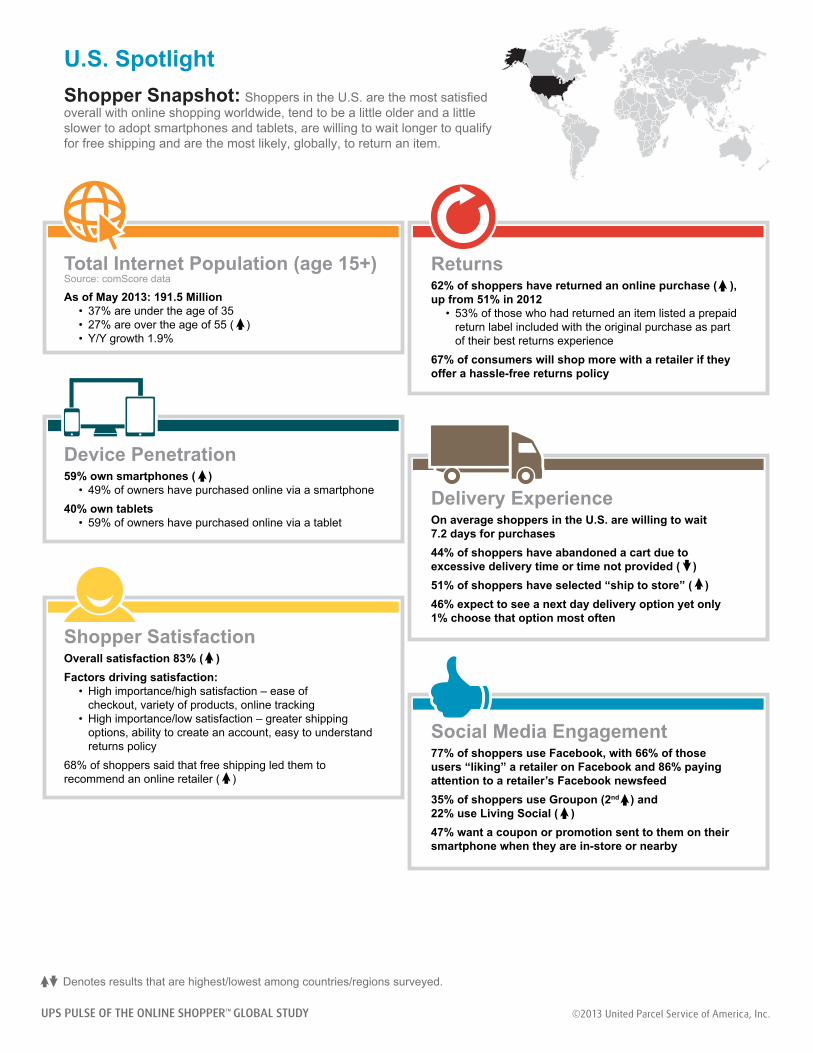
Total Internet Population (age 15+)Source: comScore data
Device Penetration59% own smartphones ( )
• 49% of owners have purchased online via a smartphone
40% own tablets• 59% of owners have purchased online via a tablet
Shopper Satisfaction
Returns
Delivery Experience
Social Media Engagement77% of shoppers use Facebook, with 66% of those users “liking” a retailer on Facebook and 86% paying attention to a retailer’s Facebook newsfeed
35% of shoppers use Groupon (2nd ) and 22% use Living Social ( )
47% want a coupon or promotion sent to them on theirsmartphone when they are in-store or nearby
Shopper Snapshot: Shoppers in the U.S. are the most satisfied overall with online shopping worldwide, tend to be a little older and a little slower to adopt smartphones and tablets, are willing to wait longer to qualify for free shipping and are the most likely, globally, to return an item.
U.S. Spotlight
As of May 2013: 191.5 Million• 37% are under the age of 35• 27% are over the age of 55 ( ) • Y/Y growth 1.9%
Overall satisfaction 83% ( )
Factors driving satisfaction:• High importance/high satisfaction – ease of checkout, variety of products, online tracking• High importance/low satisfaction – greater shipping options, ability to create an account, easy to understand returns policy
68% of shoppers said that free shipping led them to recommend an online retailer ( )
62% of shoppers have returned an online purchase ( ), up from 51% in 2012
• 53% of those who had returned an item listed a prepaid return label included with the original purchase as part of their best returns experience
67% of consumers will shop more with a retailer if theyoffer a hassle-free returns policy
On average shoppers in the U.S. are willing to wait 7.2 days for purchases
44% of shoppers have abandoned a cart due to excessive delivery time or time not provided ( )
51% of shoppers have selected “ship to store” ( )
46% expect to see a next day delivery option yet only 1% choose that option most often
Denotes results that are highest/lowest among countries/regions surveyed.
UPS PULSE OF THE ONLINE SHOPPER™ GLOBAL STUDY ©2013 United Parcel Service of America, Inc.
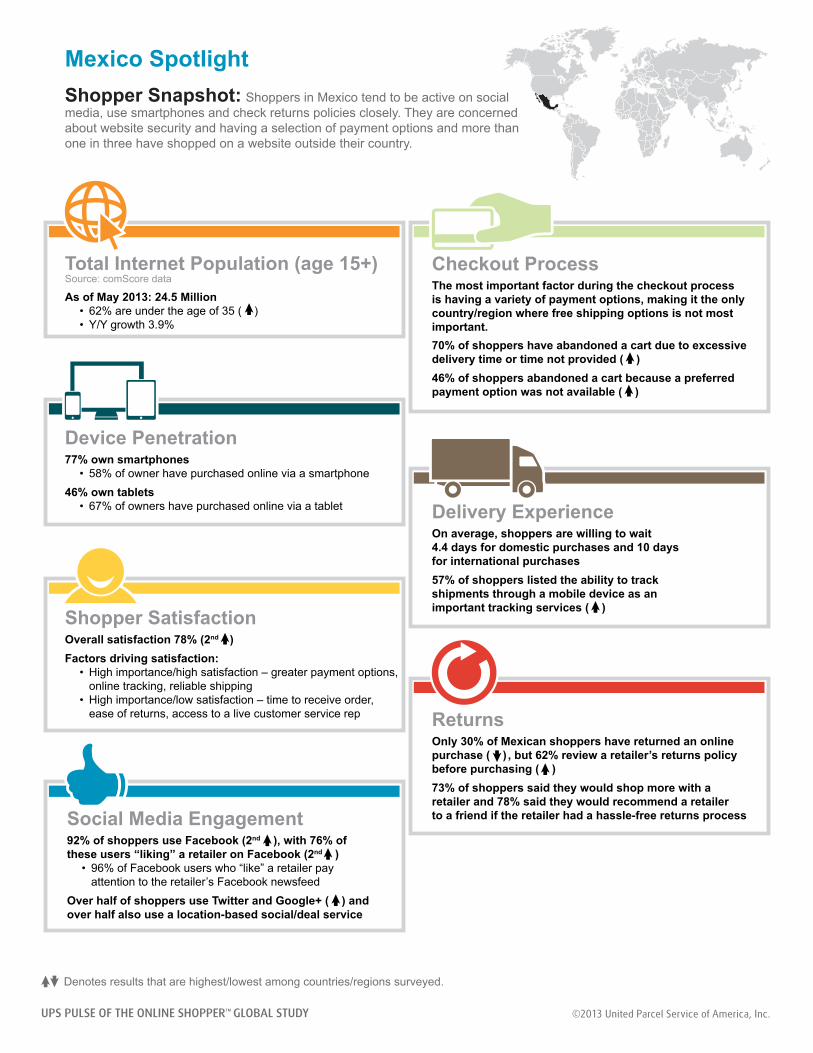
Total Internet Population (age 15+)Source: comScore data
Device Penetration77% own smartphones
• 58% of owner have purchased online via a smartphone
46% own tablets• 67% of owners have purchased online via a tablet
Shopper Satisfaction
Checkout Process
Delivery Experience
Shopper Snapshot: Shoppers in Mexico tend to be active on social media, use smartphones and check returns policies closely. They are concerned about website security and having a selection of payment options and more than one in three have shopped on a website outside their country.
Mexico Spotlight
As of May 2013: 24.5 Million• 62% are under the age of 35 ( )• Y/Y growth 3.9%
Overall satisfaction 78% (2nd )
Factors driving satisfaction:• High importance/high satisfaction – greater payment options, online tracking, reliable shipping• High importance/low satisfaction – time to receive order, ease of returns, access to a live customer service rep
The most important factor during the checkout process is having a variety of payment options, making it the only country/region where free shipping options is not mostimportant.
70% of shoppers have abandoned a cart due to excessive delivery time or time not provided ( )
46% of shoppers abandoned a cart because a preferred payment option was not available ( )
Social Media Engagement92% of shoppers use Facebook (2nd ), with 76% of these users “liking” a retailer on Facebook (2nd )
• 96% of Facebook users who “like” a retailer pay attention to the retailer’s Facebook newsfeed
Over half of shoppers use Twitter and Google+ ( ) and over half also use a location-based social/deal service
On average, shoppers are willing to wait 4.4 days for domestic purchases and 10 days for international purchases
57% of shoppers listed the ability to track shipments through a mobile device as an important tracking services ( )
ReturnsOnly 30% of Mexican shoppers have returned an online purchase ( ) , but 62% review a retailer’s returns policy before purchasing ( )
73% of shoppers said they would shop more with a retailer and 78% said they would recommend a retailer to a friend if the retailer had a hassle-free returns process
Denotes results that are highest/lowest among countries/regions surveyed.
UPS PULSE OF THE ONLINE SHOPPER™ GLOBAL STUDY ©2013 United Parcel Service of America, Inc.