Embed Size (px)
Citation preview

CNI Fall 2016 Membership Meeting12-13 December 2016
Catríona Cannon, Deputy Librarian, Bodleian LibrariesChristine Madsen, Co-Founder & Chief Innovation Officer, Athenaeum21
The Future of Finding at the University of Oxford

Outline:
1. Why are we doing this?
2. The Resource Discovery review
3. The Oxford Collections Visualization tool
Collection Size Digital metadata record Digitised resource
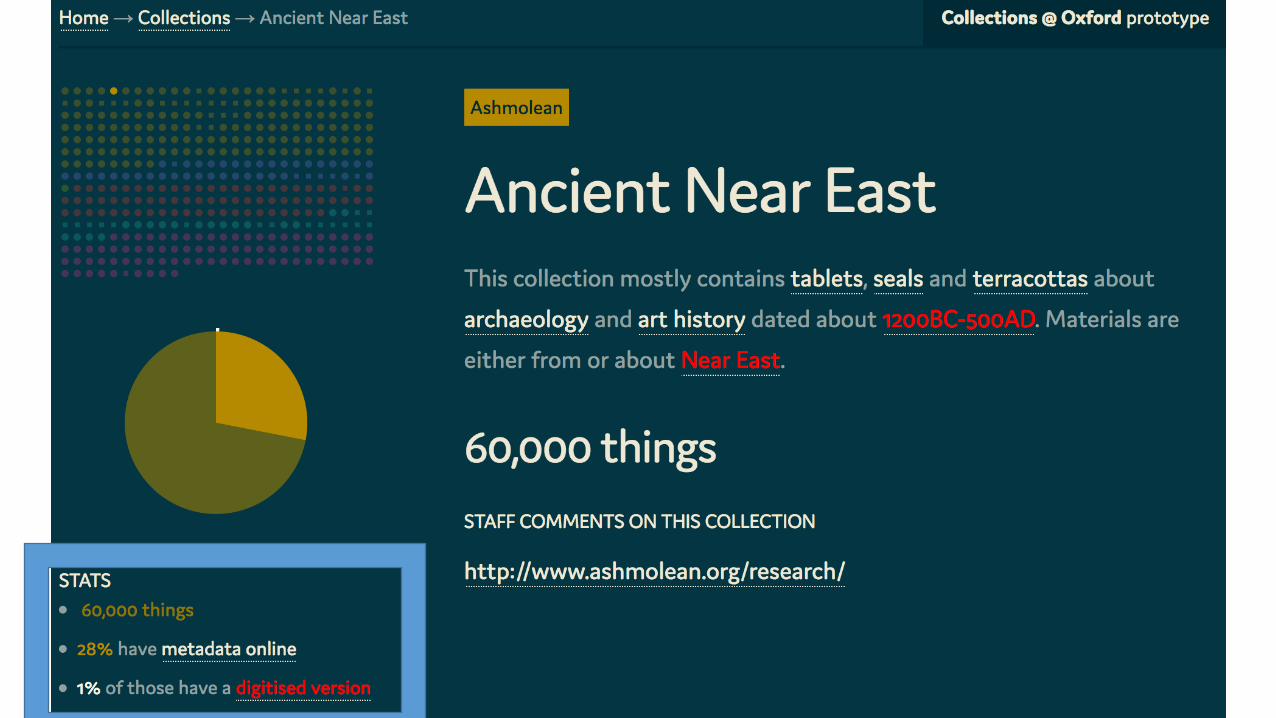
Ashmolean 1,000,000 330,000 36% 60,000 6%
Oxford Botanic Garden 30,000 7,500 25% 7,500 25%
Museum of the History of Science
45,000 40,000 89% 8,000 18%
Museum of Natural History
6,250,000 152,000 2.4% 15,000 0.24%
Pitt Rivers Museum 650,000 430,000 65% 240,000 35%
Bodleian Library Published (Print+Electronic)
12,000,000 12,000,000 100% 1.5M 12%
Bodleian Special Collections
18 kilometres ? 48% ? ?


Outline:
1. Why are we doing this?
2. The Resource Discovery review
3. The Oxford Collections Visualization tool
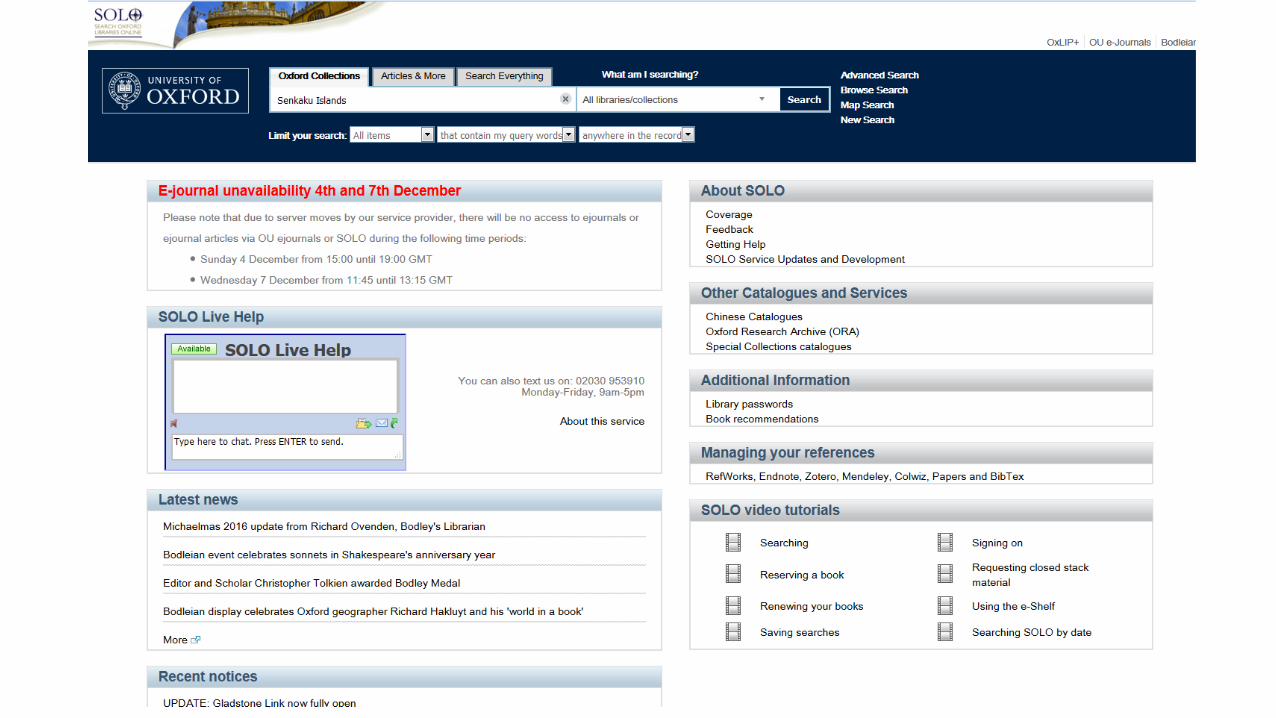
The Resource Discovery Review
1. What we did
2. What we found out
3. How we tried to solve 1 key issue

Resource Discovery: What We Did 106 interviews, 18 site visits, 3 literature reviews
38 Interviews with users of collections around Oxford 30 Interviews with collection ‘experts’ (representing all collections) 22 Interviews with external institutions (including 11 site visits) 16 Interviews with vendors/suppliers 7 Site visits to Oxford libraries and museums to observe researchers 3 Literature reviews ---
Analysis across all data

Final Report Available Online
Bodleian.ox.ac.uk>>About Us>>Policies and Reports
Or
Athenaeum21.com

What We FoundSearch behaviour & skills at Oxford are:
• about training people to become expert in their field, rather than finding things in the collections
• very discipline-specific. This is not a matter of Google vs the Catalogue
• while there is evidence that students need to learn how to search, discovery is not as simple as ‘novice’ vs ‘expert’. Experts in their fields use some of the the same discovery tools and techniques as young students when they switch to a new discipline or are looking for something specific
• as much about knowing who to ask as it is about looking for something specific
• still a very ‘analogue’ process for many collections and disciplines

What We FoundSearch behaviour & skills at Oxford are not:
• tied to a specific discovery tool – Google is heavily used, but by no means universal
• correlated to a specific discipline – ‘digital natives’ are universally bad at searching regardless of their field
Outside of Oxford
• Vendors are eager to partner with their customers because they don’t know what to do next
• Academic and cultural institutions outside of Oxford are largely in the same place: not satisfied with their current discovery tools and looking for what is next

3 Recommended Areas for Investment
1. Map the landscape of things
2. Map the network of people
3. Save people time

Save People Time• Getting existing metadata out to the places where
researchers work: Wikipedia/Wikidata, Google, Google Scholar, subject-specific repositories like arXiv and PubMed, publishers like JSTOR
• Facilitate citation chaining. Citation chaining is ubiquitous in all areas of research across all disciplines and levels of expertise. Users use cited references as authoritative points of departure for finding more resources on a topic.
3. Save People Time

• Visualization of the network of experts and research. A graph of the professional networks at Oxford would facilitate discovery and navigation within and between fields. (NB: a number of institutions have attempted this with varying degrees of success. Care should be taken to learn lessons from others’ successes and failures.)
2. Map the Network of People

Map the Landscape of ThingsOrienting the users to the corpora of collections (digital
and non-digital) by:
1. Visualizing the scope of collections at Oxford: providing an interactive diagram that represents the range of collections at Oxford (using collection-level metadata).
2. Cross-Collection Search: Overlaying this diagram with the ability to search within or across collections. In such a context, researchers will understand not only what they are finding, but what they might be missing.
1. Map the Landscape of Things

Collection Size Digital metadata record Digitised resource
Ashmolean 1,000,000 330,000 36% 60,000 6%
Oxford Botanic Garden 30,000 7,500 25% 7,500 25%
Museum of the History of Science
45,000 40,000 89% 8,000 18%
Museum of Natural History
6,250,000 152,000 2.4% 15,000 0.24%
Pitt Rivers Museum 650,000 430,000 65% 240,000 35%
Bodleian Library Published (Print+Electronic)
12,000,000 12,000,000 100% 1.5M 12%
Bodleian Special Collections
18 kilometres ? 48% ? ?

Everything Availableto Researchers
50-100M+ items
Catalogued13M+ items
Digital Surrogates250k+ items
(excludes “born-digital” items and eBooks)

Everything Availableto Researchers
50-100M+ items
Catalogued13M+ items
Digital Surrogates250k+ items
(excludes “born-digital” items and eBooks)

“It's clear that reasonably diligent students are
strikingly not sophisticated in their searching.
Students search in one place, and if they don't find
anything on the first try, they think it doesn’t exist.”
The Project: Why

Map the Landscape of Things
• We know what can be done with lots of metadata…
The Challenge

http://spatialinformationdesignlab.org/project_sites/library/catalog.html

http://spatialinformationdesignlab.org/project_sites/library/crossingDisciplines.html

Deutsche digitale Bibliothek visualisiert – Urban Complexity Lab, Potsdam

Deutsche digitale Bibliothek visualisiert – Urban Complexity Lab, Potsdam

Deutsche digitale Bibliothek visualisiert – Urban Complexity Lab, Potsdam

Map the Landscape of Things
• We know what can be done with lots of metadata…
• But what can you do without it?
The Challenge

Map the Landscape of ThingsCreate a map of all of the museum and library collections at
Oxford
• Interactive visual navigation of Oxford’s collections
• Regardless of whether they have metadata
Build something that is beautiful, easy to use and transports the user into the world of Oxford’s collections
• Like a Google maps of Oxford collections
The Project: Mapping the Collections

• Dependent upon item-level metadata
• Will only ever include ’catalogued’ things
• “How is this thing I have found related to other
things in the collections”
How does this project relate to other efforts like linked data?
• Assumes users have little or no prior knowledge of collections
• Is NOT dependent upon item-level metadata
• Will display collections that have no metadata
• “What does Oxford have that is relevant to my research?”
A Supplement – Not a Substitute

The Project: Target Audience“what collections are at Oxford that might be useful for my research?”• Many incoming researchers are spending 1-2 years just
finding their primary resources
“I know these things exist, why aren’t I getting any search results?”• Most researchers have no idea the scale of what is
catalogued electronically or not

The Project: Deliverables1. A working demonstrator, that is, an elegant, visualization design that
leverages real data (a subset of the available data) with minimum intervention. The prototype will be user-tested and will help to illustrate the feasibility and scalability of the approach.
2. A plan for gathering summary data to provide complete coverage of Oxford’s collections
3. A detailed plan and budget to develop the project into a second phase with a broader partnership

The Prototype: What Will it Do?
provide an immediate visual guide to:
• what exists at Oxford and where it is held;
• relative sizes of different types of collections;
• which collections are findable/searchable electronically;
• which collections are catalogued in print indices; and
• which are not yet catalogued.

The Prototype: How was it built?Data from two sources:
• Existing electronic metadata from museums and libraries through batch exports• Data will be analysed and summarised to provide the highest level of navigation
• Collection summary data for collections that do not have item-level electronic metadata through interviews and spreadsheets• Every collection curator or manager at the University has a good sense of what
is in their collection. Much of this summary level data already exists in spreadsheets

The User Journey
• Users will not start from a search term
• Journey may end in a detailed metadata record, digital
object, or contact information for a collection manager
• The visual navigation should uncover the unexpected --
that the Bodleian has art or that the Pitt Rivers has
manuscripts


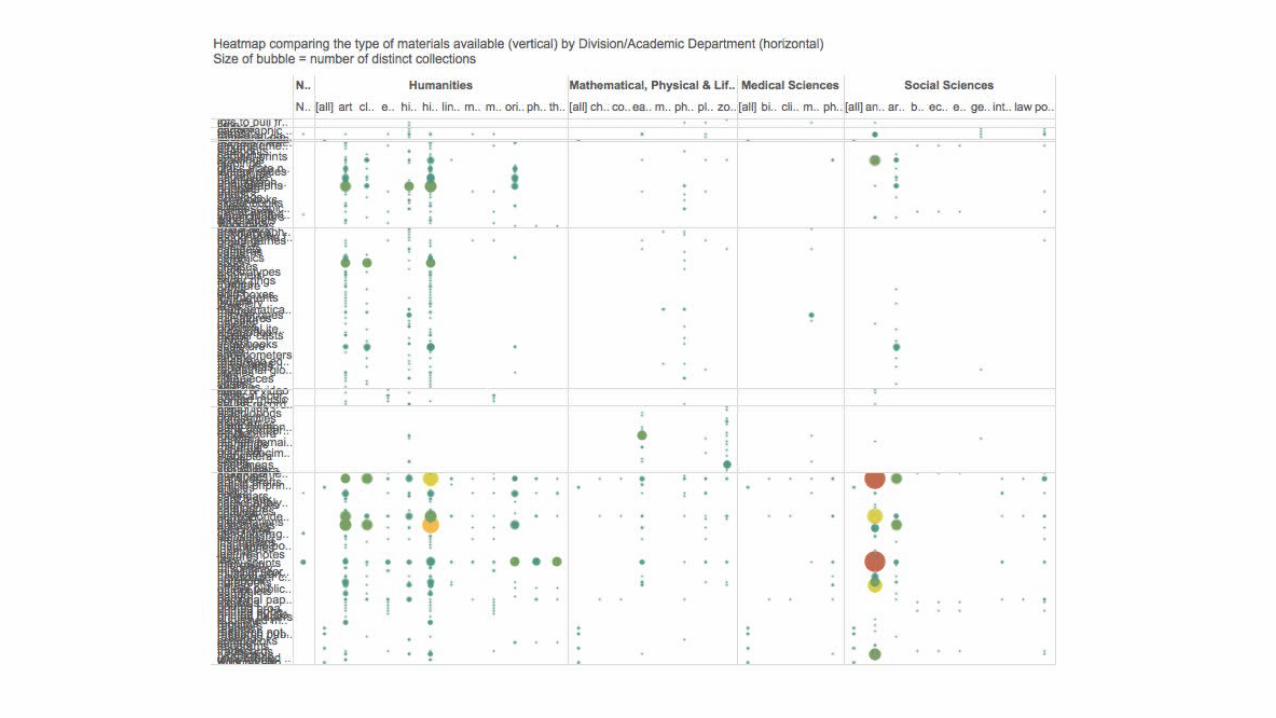
What Have we Accomplished• First version of a demonstrator• But it doesn’t quite do what we want it to do
• Much better understanding of the problem• Scale of the metadata issue
• Problems with visualization
• New design ideas
• More data analysis


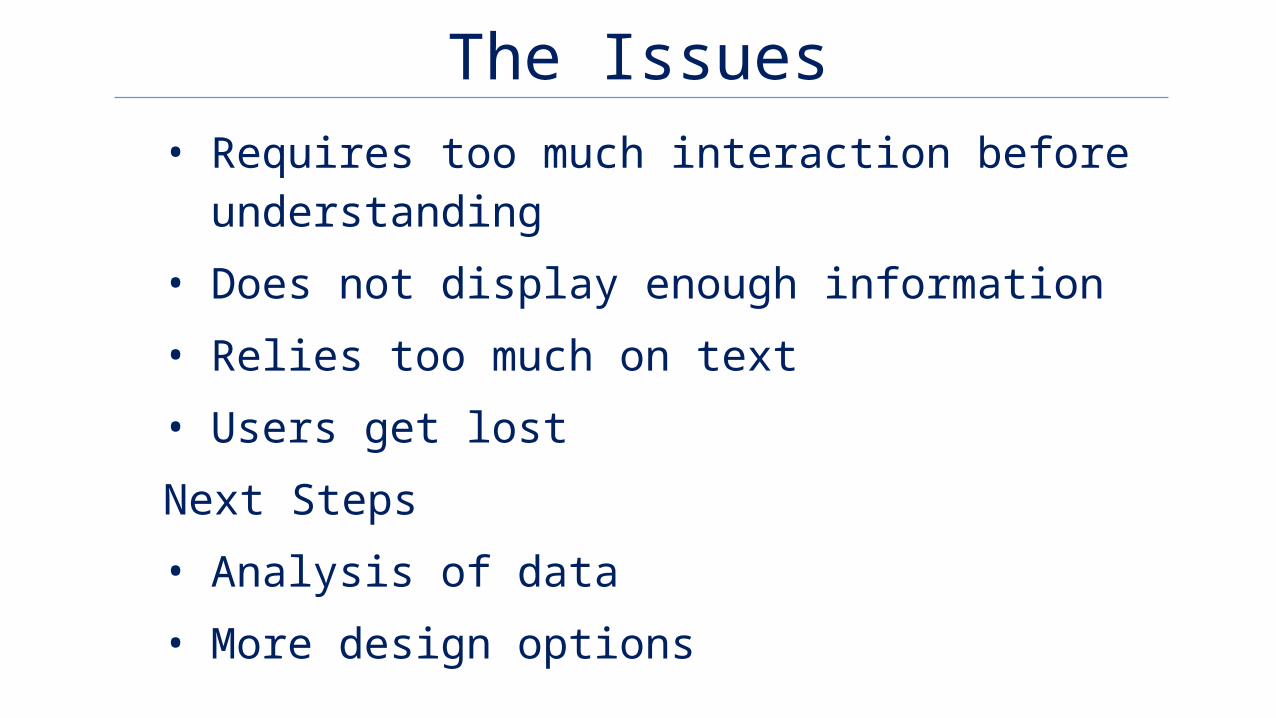
The Issues• Requires too much interaction before understanding
• Does not display enough information
• Relies too much on text
• Users get lost
Next Steps
• Analysis of data
• More design options


“If I get dropped into the middle of the landscape, I
can deduce where I am and navigate my way out,
whereas my students will latch on to the first tree that
looks interesting.”

Lessons Learned• There is a place for visualisation and a place for search
• No way around creating metadata
• Whatever you do is going to take a lot of work • Off the shelf packages don’t seem so terrible
• Data visualization vs info visualization • Tolerance for abstraction
• Data analysis versus simple visualisation
• If you want something to be design-led, hold off on data

Next Steps

Questions and discussion